Article

Experimental Study of Acid Etching and Conductivity of High-Temperature-Resistant Cross-Linked Acid

1
Drilling and Production Technology Research Institute, PetroChina Qinghai Oilfield Company, Beijing 816400, China
2
CNPC Engineering Technology R&D Company Limited, Beijing 102206, China
3
The Exploration Enterprise Department of Qinghai Oilfield Company, Dunhuang 816401, China
4
Engineering and Technology Department of Qinghai Oilfield Company, Dunhuang 816401, China
5
State Key Laboratory of Oil and Gas Resources and Prospecting, China University of Petroleum, Beijing 102249, China
*
Authors to whom correspondence should be addressed.
Processes 2023, 11(3), 722; https://doi.org/10.3390/pr11030722
Submission received: 21 December 2022 / Revised: 17 February 2023 / Accepted: 21 February 2023 / Published: 28 February 2023

Abstract

:
Acid fracturing is one of the effective techniques for developing low-permeability carbonate reservoirs economically. With the increasing reservoir depth, the reservoir temperature and closure pressure increase, posing new challenges to the acid system. In this paper, a high-temperature-resistant cross-linked acid system is selected, which maintains a viscosity above 80 mPa·s in the temperature range of 120 °C to 140 °C and can effectively reduce acid leak-off. The acid system can not only open the reservoir and ensure the extension of the fracture, but also reduce the reaction rate between the acid and the reservoir and increase the etching distance. The rock slab acid etching and conductivity tests show that the optimum injection rate is 50 mL/min, the rock etching morphology is channel type, and the conductivity remains above 110 D·cm. However, as the acid concentration decreases, the rock slab conductivity decreases considerably, especially at 10% acid concentration, where the closure pressure rises to 15 MPa, and there is almost no conductivity. In particular, after the acid system is broken, the reacted acid can form a filter cake on the core surface, hindering further intrusion of the residue into the core and reducing reservoir damage. The study shows that high-temperature-resistant cross-linked acid systems can effectively improve the stimulation of deeply fractured carbonate reservoirs at high temperatures.

1. Introduction

With the exploitation of global oil and gas resources, the exploitation depth of carbonate reservoirs is increasing. Porosity and permeability are the key parameters of the reservoir, and also determine the level of oil production. Deep carbonate reservoirs are tight (low permeability and low porosity) [1,2]. Low-permeability carbonate reservoirs have no natural productivity after drilling and need reservoir stimulation to create high-speed channels for oil and gas flow to achieve commercial development [3,4]. Acid fracturing is an effective method to improve the production of carbonate reservoirs. Acid fracturing is to crack the formation when it is higher than the formation fracture pressure, and then the injected acid reacts with the rock on the fracture surface [5,6]. Due to the heterogeneity of reservoir rock mineral distribution and acid distribution, the fracture surface is unevenly etched by acid. When the acid fracturing is completed, the rough fracture surface cannot be closed entirely under the closure pressure, forming a high conductivity channel for oil and gas flow to the wellbore [7,8].
The effect of acid fracturing on increasing oil and gas production is related to the effective length and conductivity of acid-etching fracture [9,10]. The effective length of the acid-etched fracture is mainly related to acid–rock reaction rate and acid filtration [11,12]. At reservoir temperature, the slower the reaction rate between acid and rock, the more fractures can communicate with more reservoirs. The conductivity is related to the etching form of the fracture surface and closure pressure [13,14]. In general, since the rock is composed of different minerals, the surface of the fracture surface is uneven after the rock reacts with the acid solution [15,16,17,18,19]. However, some carbonate reservoirs have high mineral content (>95%) and cannot spontaneously form uneven etching morphology, which requires the assistance of acid fracturing process. Therefore, the properties of acid are significant for the effect of acid fracturing. In particular, the reservoir temperature is high (>120 °C), and the permeability is low for deeply fractured carbonate reservoirs. Conventional hydrochloric acid, gelled acid [20], and organic acid [21,22] are not suitable for acidizing on deep tight carbonate reservoirs due to the problems of a fast acid–rock reaction rate, low viscosity, and extensive filtration. Compared with other acids mentioned above, cross-linked acid has the advantages of high viscosity, slow reaction rate, low filtration, and low friction. It is widely used in acid fracturing of high-temperature tight carbonate reservoirs.
Cross-linked acid refers to a high-viscosity acid system formed by the chemical cross-linking of thickener macromolecules and cross-linking agent small molecules under acidic conditions [23]. Avtar [24] developed a high-viscosity acid for the first time using polymer and metal ion cross-linking agents. Although the viscosity of the acid solution is high under low pH conditions (15% HCl), the temperature resistance is poor, and the viscosity decreases sharply at high temperatures, which cannot meet the acid fracturing of high-temperature reservoirs. At the same time, the iron-based cross-linking agent remains in the formation, causing damage to the reservoir [25]. In response to this problem, on the one hand, the researchers added a certain amount of organic acid to the acid solution to reduce the hydrochloric acid content, thereby reducing the acid–rock reaction rate. Buijse [26] used a mixture of hydrochloric acid and organic acid as a cross-linked acid–base solution, confirming that adding organic acids can reduce the acid–rock reaction rate and increase the effective distance of the acid in the fracture. On the other hand, more excellent thickeners and cross-linking agents were synthesized. Patil [27] prepared a new aluminum cross-linked acid system, which can withstand temperatures up to 135 °C in 20% HCl. The cross-linking agent has good compatibility with the corrosion inhibitor. When the pH is 1.5~3, the polymer can be effectively cross-linked, and the corrosion inhibition effect is good at 93 °C and 107 °C. Wang [28] synthesized a high-temperature-resistant cross-linked acid, at 140 °C, 170 s−1, after shearing 1 h apparent viscosity stability at 100 mP·s. Fang [29] used organic zirconium cross-linking agent to improve the temperature resistance of the acid to 160 °C.
For stimulation of acid fracturing in low permeability carbonate reservoirs, cross-linked acid is the most suitable acid fluid system. The research on cross-linked acid primarily focuses on temperature resistance, but acid fracturing is a comprehensive problem of acid etching and fracture closure. It is necessary to comprehensively study the temperature resistance, acid-etching ability, and the damage of reacted acid to the reservoir [30,31,32]. On the basis of clarifying the change of acid viscosity with temperature, exploring the relationship between acid-etching pattern and conductivity, and adjusting acid injection parameters to form high conductivity, is of great significance to guide acid fracturing stimulation.
To solve this problem, this paper selects a new type of ground cross-linked acid system. The polymer thickener used is amphoteric polyacrylamide, and the cross-linking agent is organic zirconium. In this paper, the research on the acid fracturing stimulation of a low permeability carbonate reservoir is mainly divided into three aspects. The first is the temperature resistance and shear resistance test of the acid system to ensure that the acid’s structure is not damaged at the reservoir temperature, which can reduce the acid leakage. The second is the acid etching and conductivity test of the ground cross-linked acid system and rock slab. By changing the acid injection parameters and adjusting the acid-etching pattern, the method of obtaining high conductivity is explored. In addition, the damage evaluation of reacted acid to rock is also carried out, revealing the mechanism of the formation of filter cake on the core surface by the reacted acid of cross-linked acid to reduce reservoir damage.

2. Materials and Methods

2.1. Materials

The rock slab used in this paper is made of tight carbonate rock with high calcite content. XRD mineral composition results of the rock slab are shown in Table 1 and the slabs are sized to meet API conductivity cell requirements (Figure 1). Cores were drilled in the same batch of rocks for porosity and permeability tests. The results show that core’s porosity is about 10%, and the permeability distribution range is 0.074~0.305 mD, which has strong heterogeneity (Table 2). The new cross-linked acid comprises 20 wt % HCl, 1 wt % thickener, 1 wt % cross-linking agent, and 3 wt % corrosion inhibitor. The thickener is amphoteric polyacrylamide. The cross-linking agent is organic zirconium cross-linking agent. It is worth noting that the cross-linking agent is composed of A and B, according to the proportion of 1:7 before use, mixed evenly and stirred, ready to use, to avoid cross-linking agent failure.

2.2. Experimental Method and Equipment

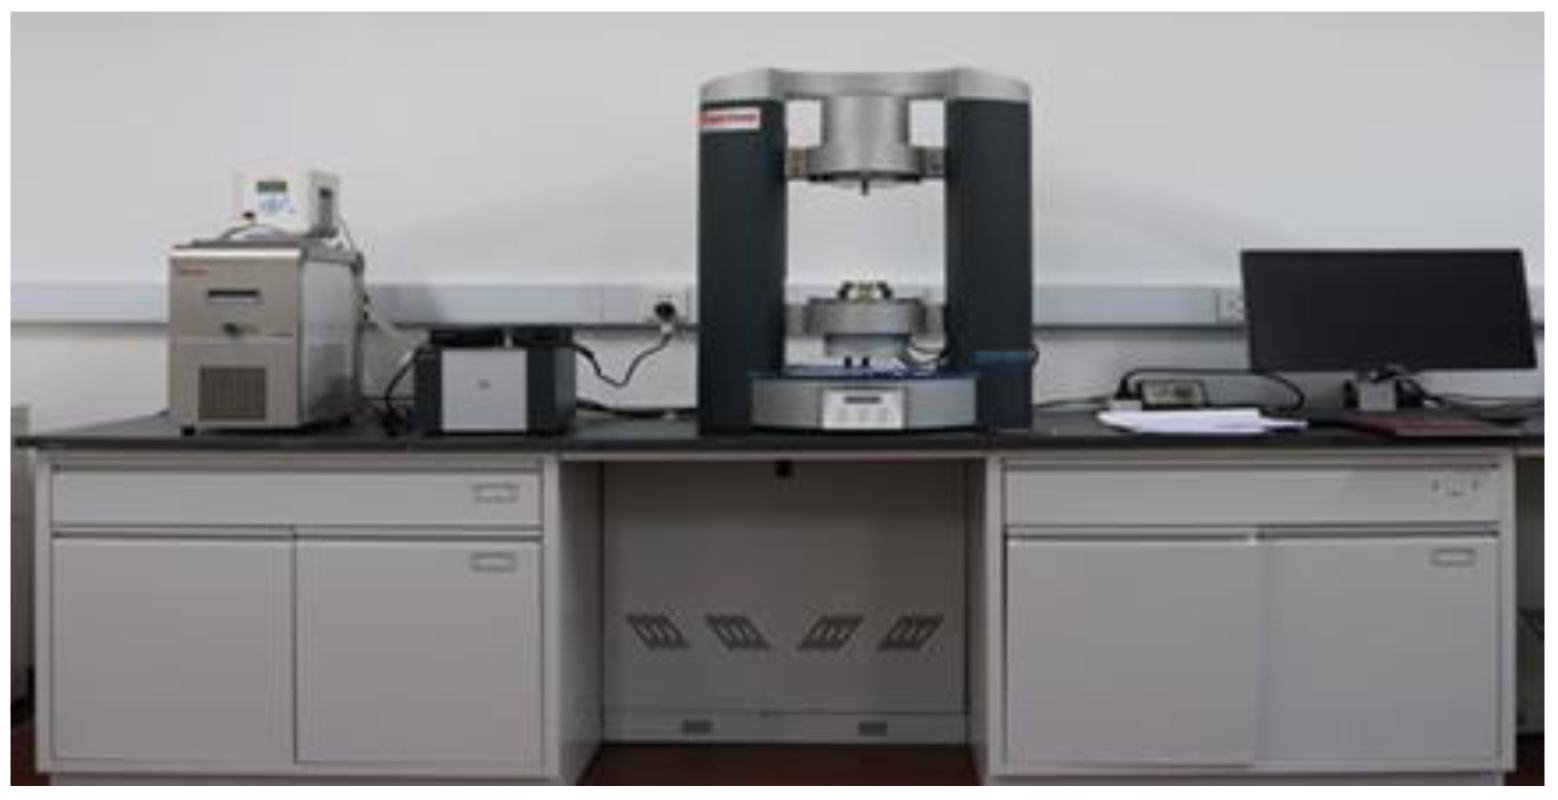
2.2.1. Acid Rheological Test

The acid rheological test used the Haake Mars III rheometer coaxial cylinder test system (Figure 2). The control mode is rate control. The shear time is 120 min, the shear rate is 170 s−1, and the test temperature is 60, 80, 100, 120, 140, and 160 °C. The apparent viscosity of the acid is tested with the shear time. Further, using the step-type constant temperature module in the rheometer, the control mode is set to rate control, the shear rate scanning range is set to 0.1~500 s−1, the test temperature is 140 °C, and the sampling points are 200. Firstly, the cross-linked acid was preheated to the test temperature, and the variation of the apparent viscosity of the acid with the shear rate was tested. The purpose was to obtain the cross-linked acid flow index and the consistency coefficient.

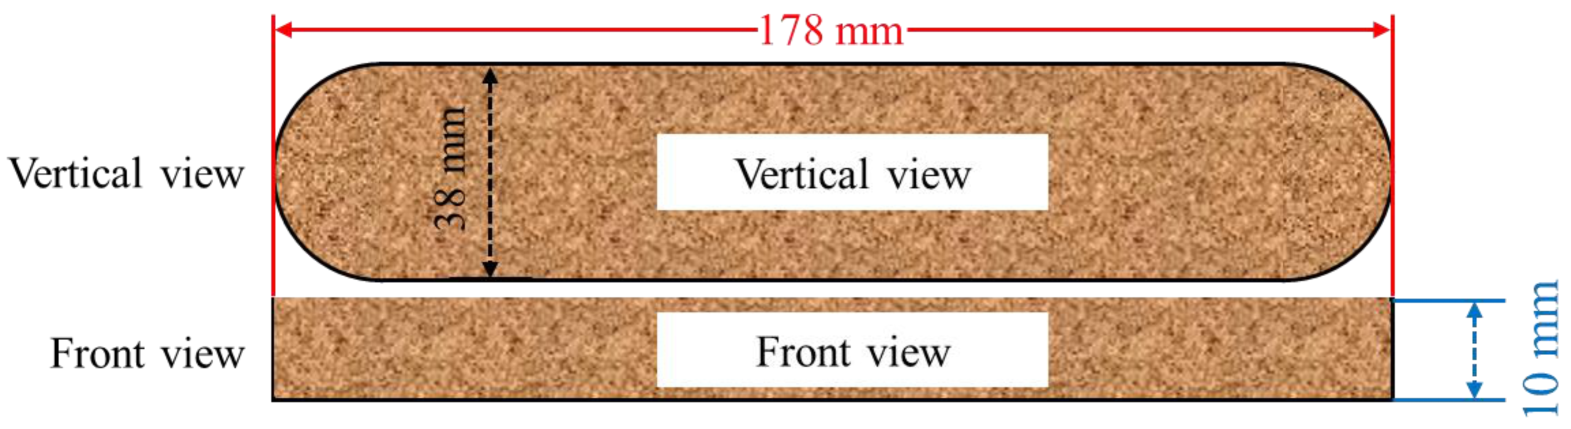
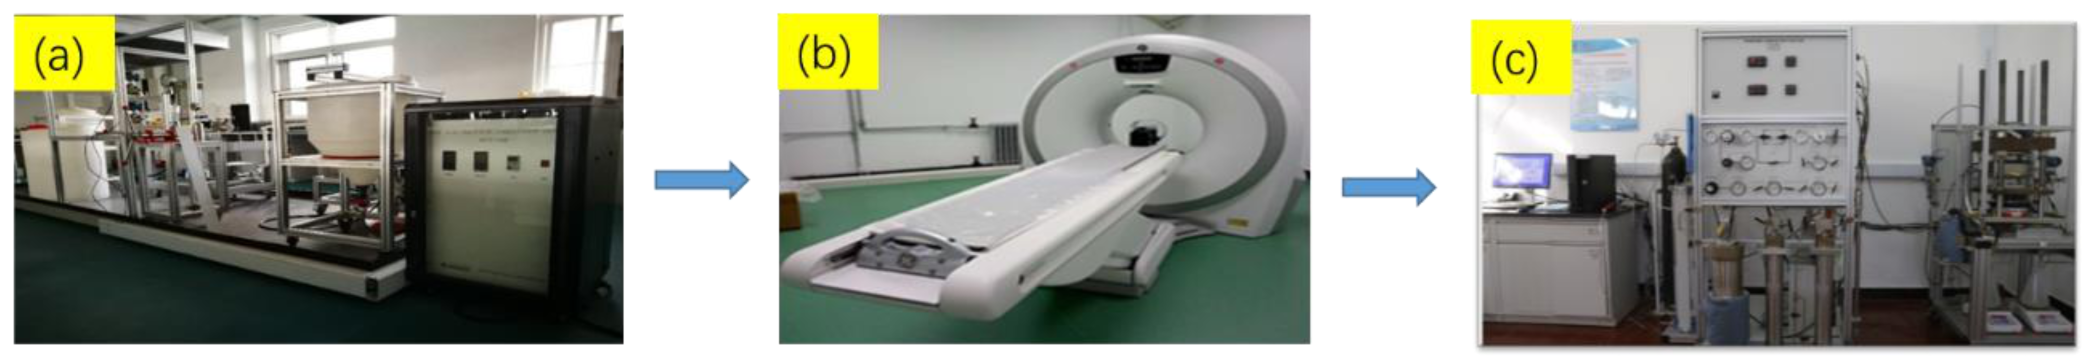
2.2.2. Acid Etching and Conductivity Test

The experiment of acid-etching fracture conductivity is divided into two parts. The first part is to simulate the acid-etching process on the fracture surface by acid-etching experiment and analyze the etching morphology by X-ray computed tomography (CT scanner). The specific steps are shown in Zhang’s research [33], and the experimental scheme is shown in Table 3. The second part is to simulate the seepage pattern of acid-etched fractures in underground rock mass after acid fracturing (Figure 3). The experimental results can be used to evaluate the conductivity of local acid-etched fractures. The principle of acid-etching fracture conductivity test is Darcy’s law.
K = 5.555 μ Q Δ P W f
The conductivity can be further expressed as:
K W f = 5.555 μ Q Δ P
where K is fracture permeability, mD; μ is viscosity, mPa·s; Q is flow rate, cm3/min; ΔP is the pressure difference, kPa; W f   is fracture width, cm.

2.2.3. Permeability Damage Test

The core damage test is performed using a core-flooding device. Fresh cross-linked acid is prepared first, and then calcium carbonate powder is continuously added until the pH of the acid solution is 6. Before the damage, the initial permeability of the core is tested first. The reacted acid is injected to damage the core. Finally, the permeability of the core after the damage is measured again. The damage degree of reacted acid to the core is calculated through the permeability change.
K = μ Q L A Δ P
where K is the core permeability, mD; Q is the flow through the core, cm3/s; a is the cross-sectional area of the fluid through the core, cm2; ΔP is the pressure difference, 0.1 MPa; μ is fluid viscosity, mPa·s; L is the core length, cm.
After obtaining the core permeability before and after damage, the damage rate of rock is calculated by the following formula:
P e = K b K a K a × 100 %
where Kb is the core permeability before reacted acid damage, mD; Ka is core permeability after reacted acid damage, mD; Pe is defined as core damage rate.

3. Result and Discussion

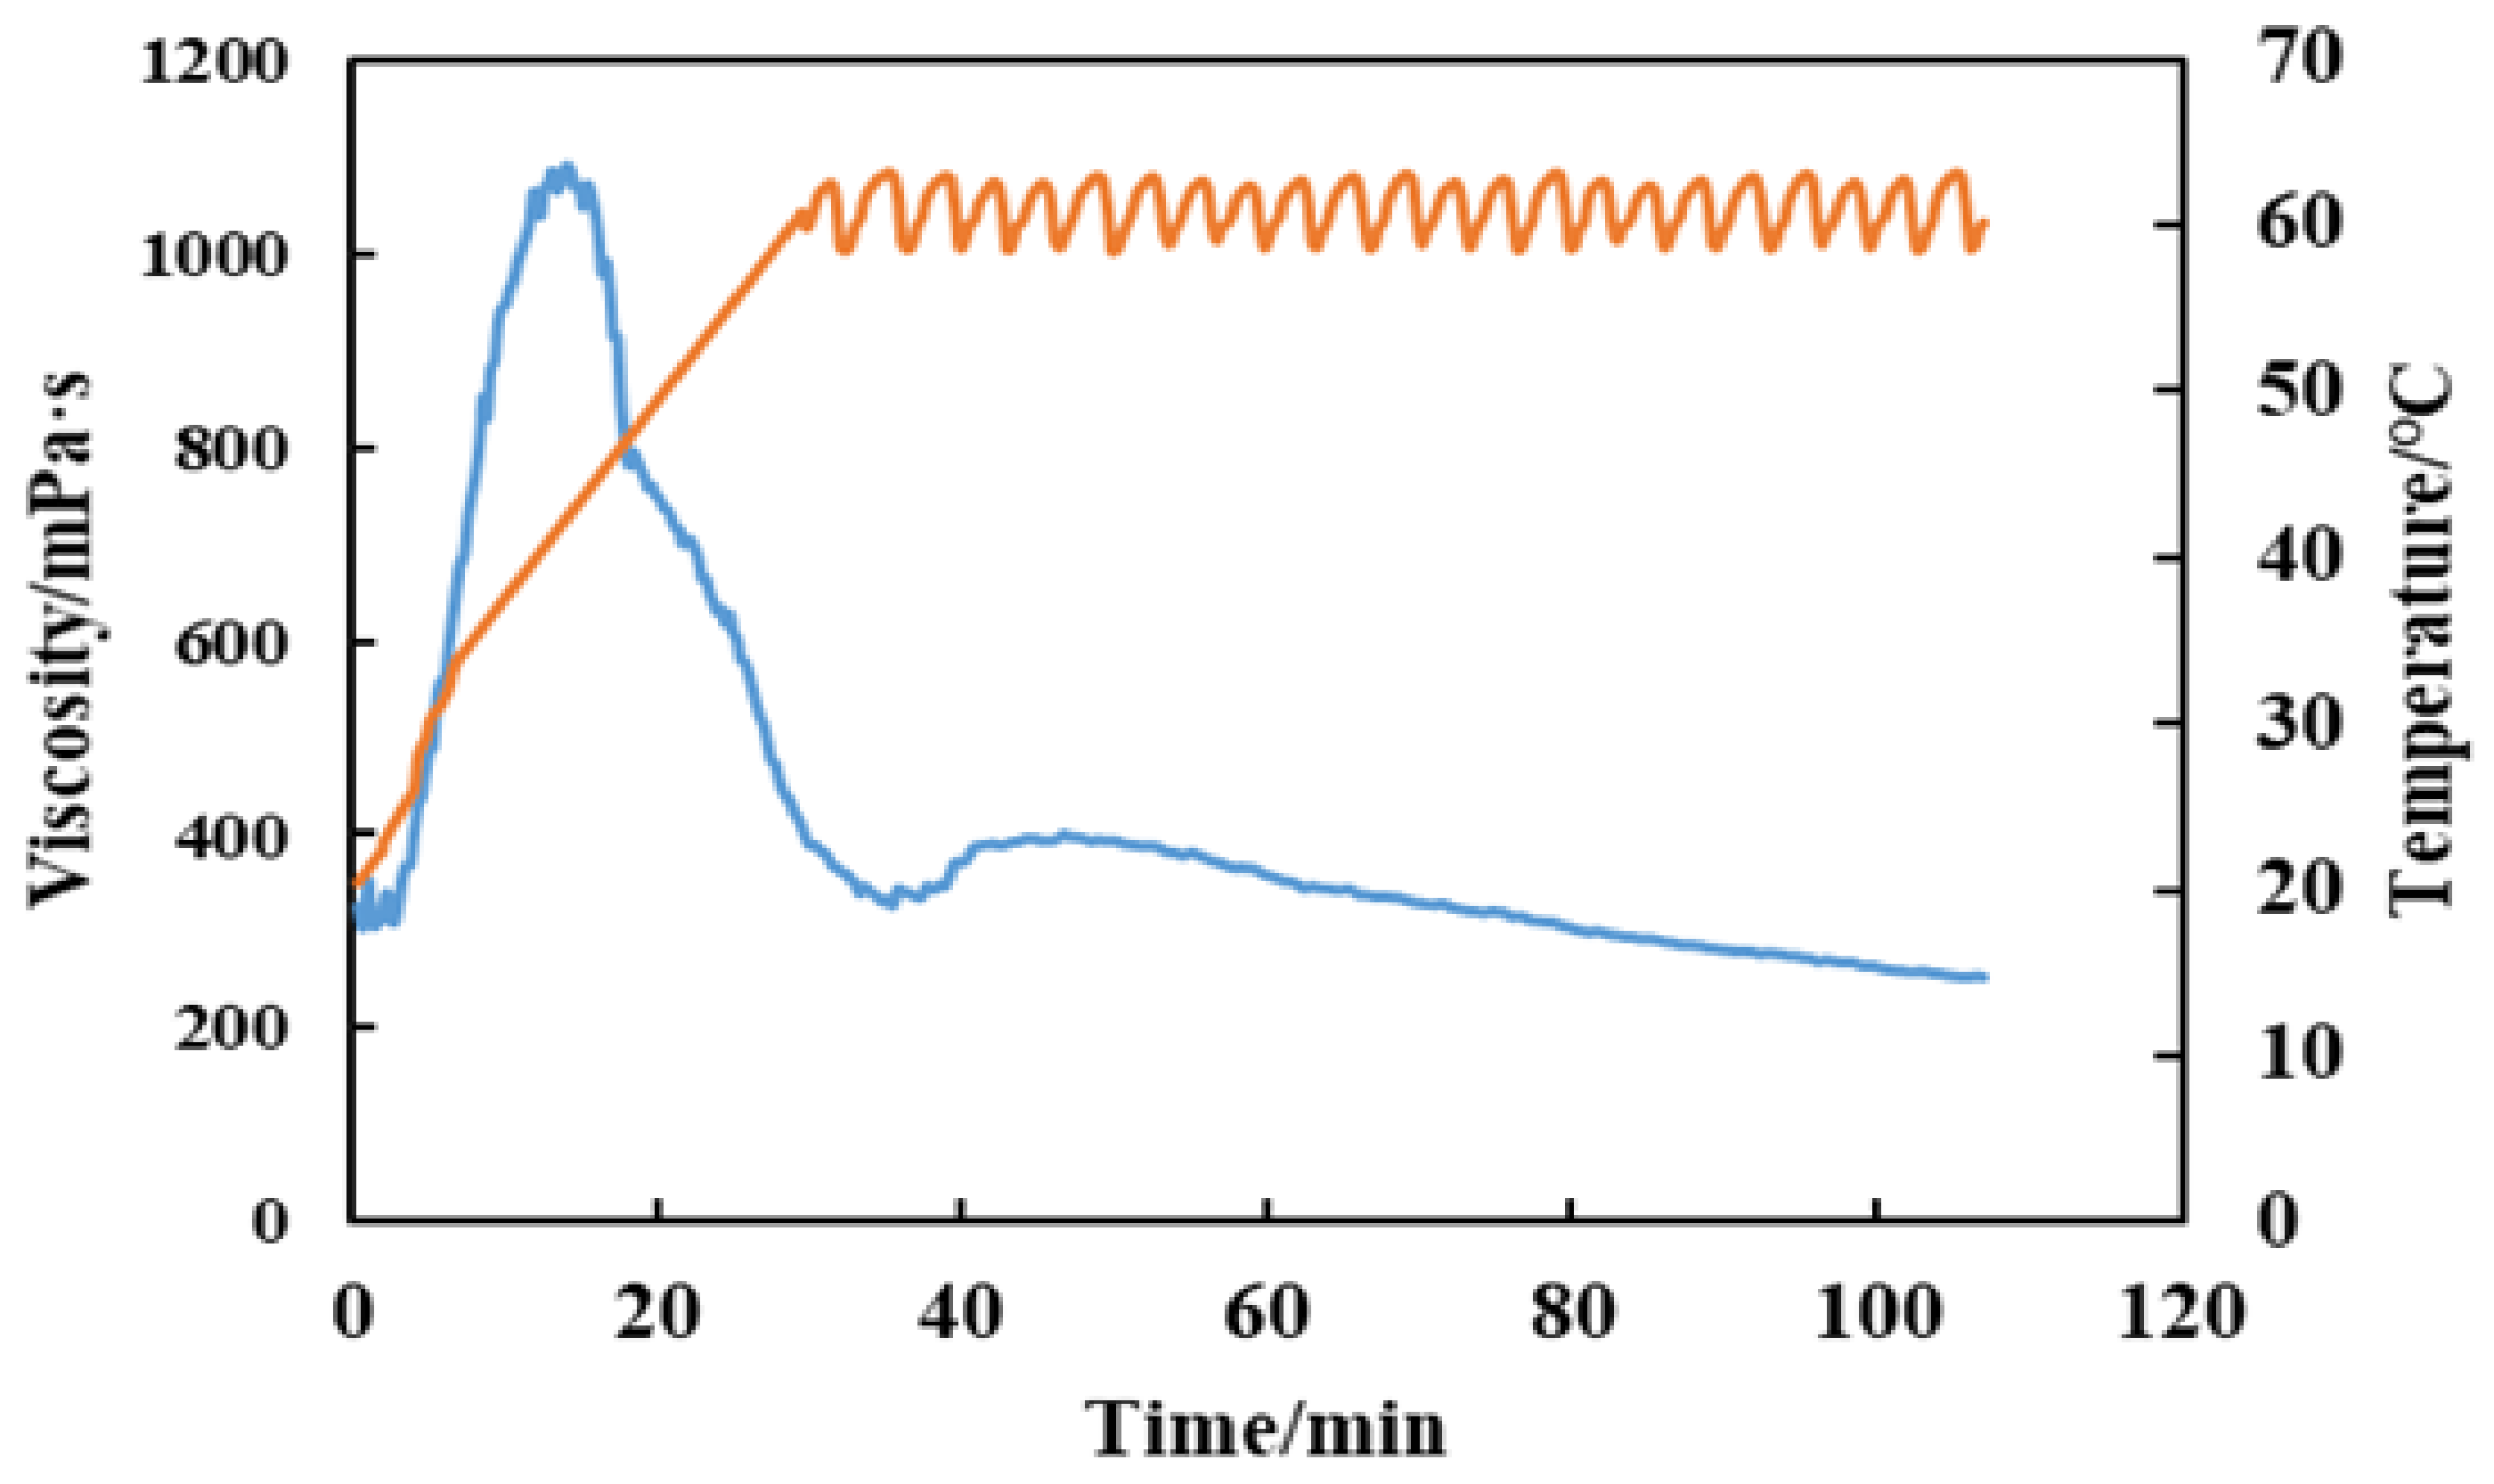
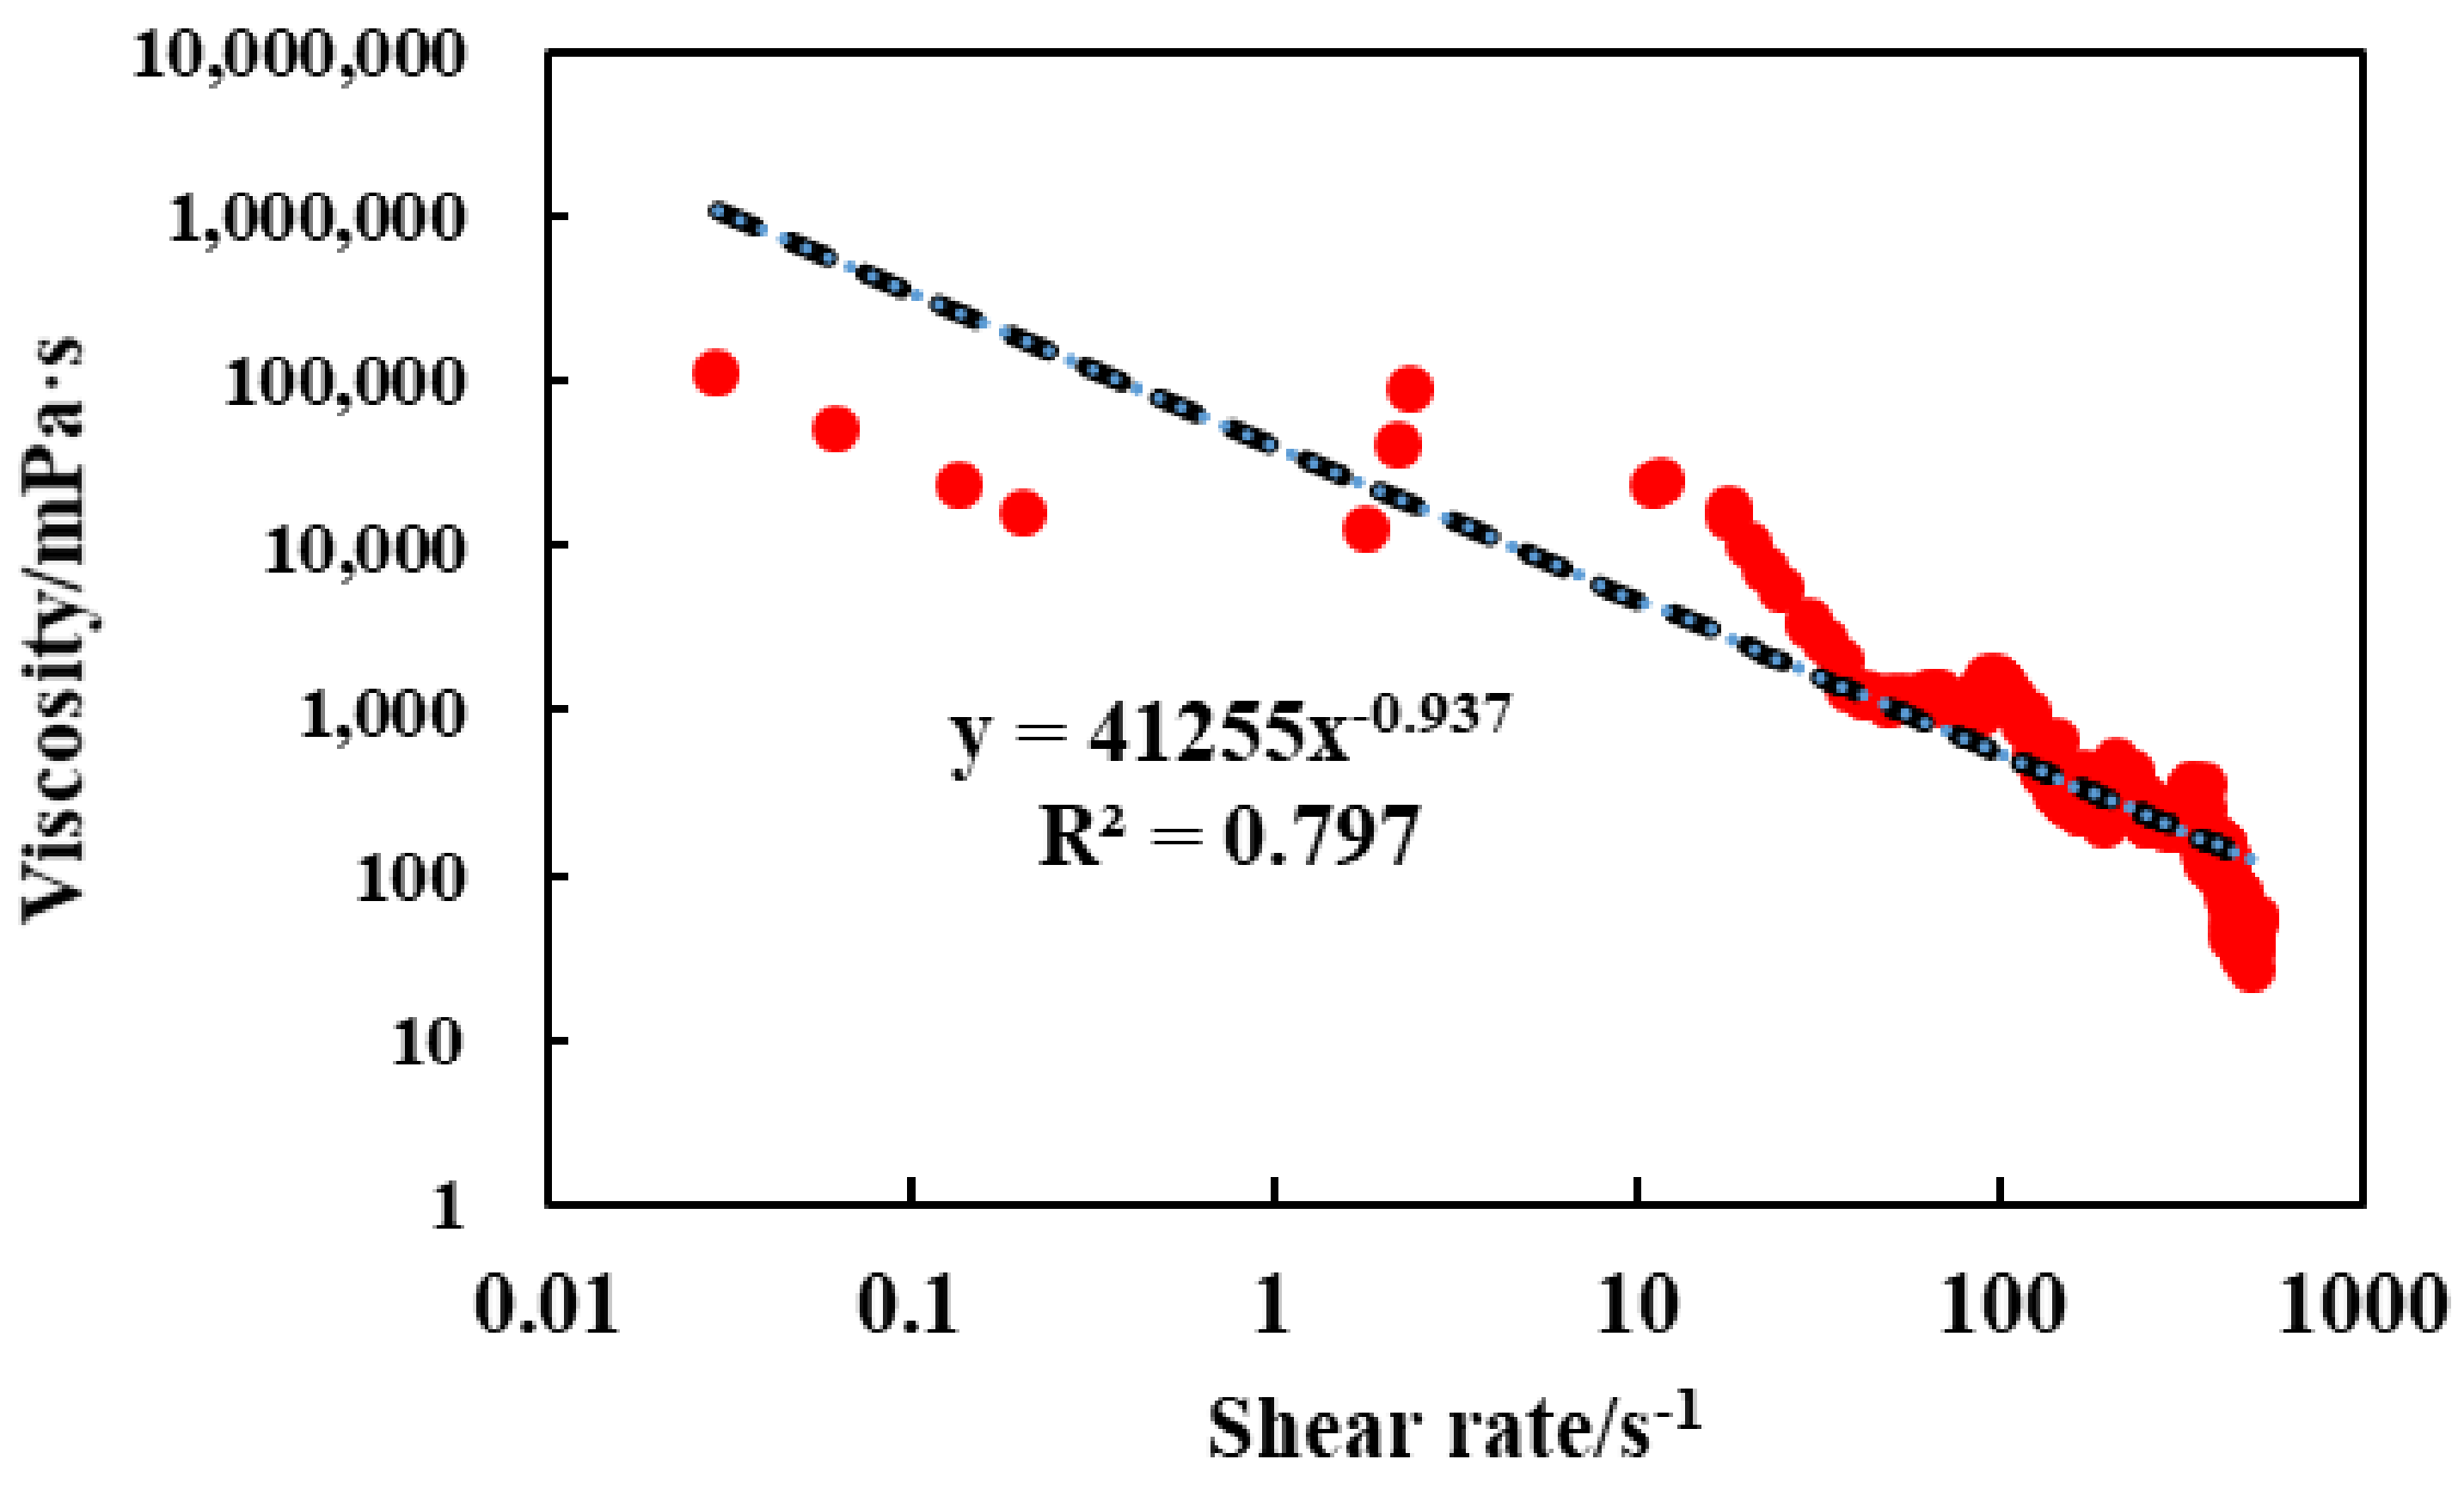
3.1. Rheological Test Results

Figure 4 shows the relationship between the viscosity and shear time at 60 °C and 170 s−1. The average viscosity of the last stable 30 min is the viscosity of the cross-linked acid at this temperature. The viscosity change of cross-linked acid at different temperatures is shown in Figure 5. When the temperature increases from 60 °C to 120 °C, the viscosity of the acid solution decreases rapidly, and the reduction rate reaches 50%. When the temperature increases from 120 °C to 140 °C, the viscosity changes little, and the influence of the temperature range on the cross-linked acid is small. When the formation temperature reaches 140 °C, the viscosity of the acid can still be maintained at about 80 mPa·s. When the temperature rises to 160 °C, the viscosity of the acid decreases rapidly. It is inferred that the polymer breaks at this temperature, decreasing the acid viscosity. From the viscosity curve, we can find that the cross-linked acid still maintains high viscosity at high temperatures, reducing the rate of H+ transfer to the rock, thereby reducing the acid–rock reaction rate [34]. In general, the 20% cross-linked acid system has appropriate temperature and shear resistance during the test, which can meet the technical requirements of acid fracturing in high temperature deep reservoirs of the Changqing gas field [35].
The power exponential form is used to fit the curve, indicating that the reasonable correlation is good and the fitting result is reliable. It can be seen from Figure 6 that the rheological characteristics of the cross-linked acid agree with the rheological model of the power-law fluid. The consistency coefficient is 41,255 mPa·sn, and the power law index is 0.937 at 140 °C, which shows typical non-Newtonian fluid characteristics. The viscosity decreases with the increase in shear rate, and the fluidity increases.

3.2. Acid Etching and Conductivity Test Results

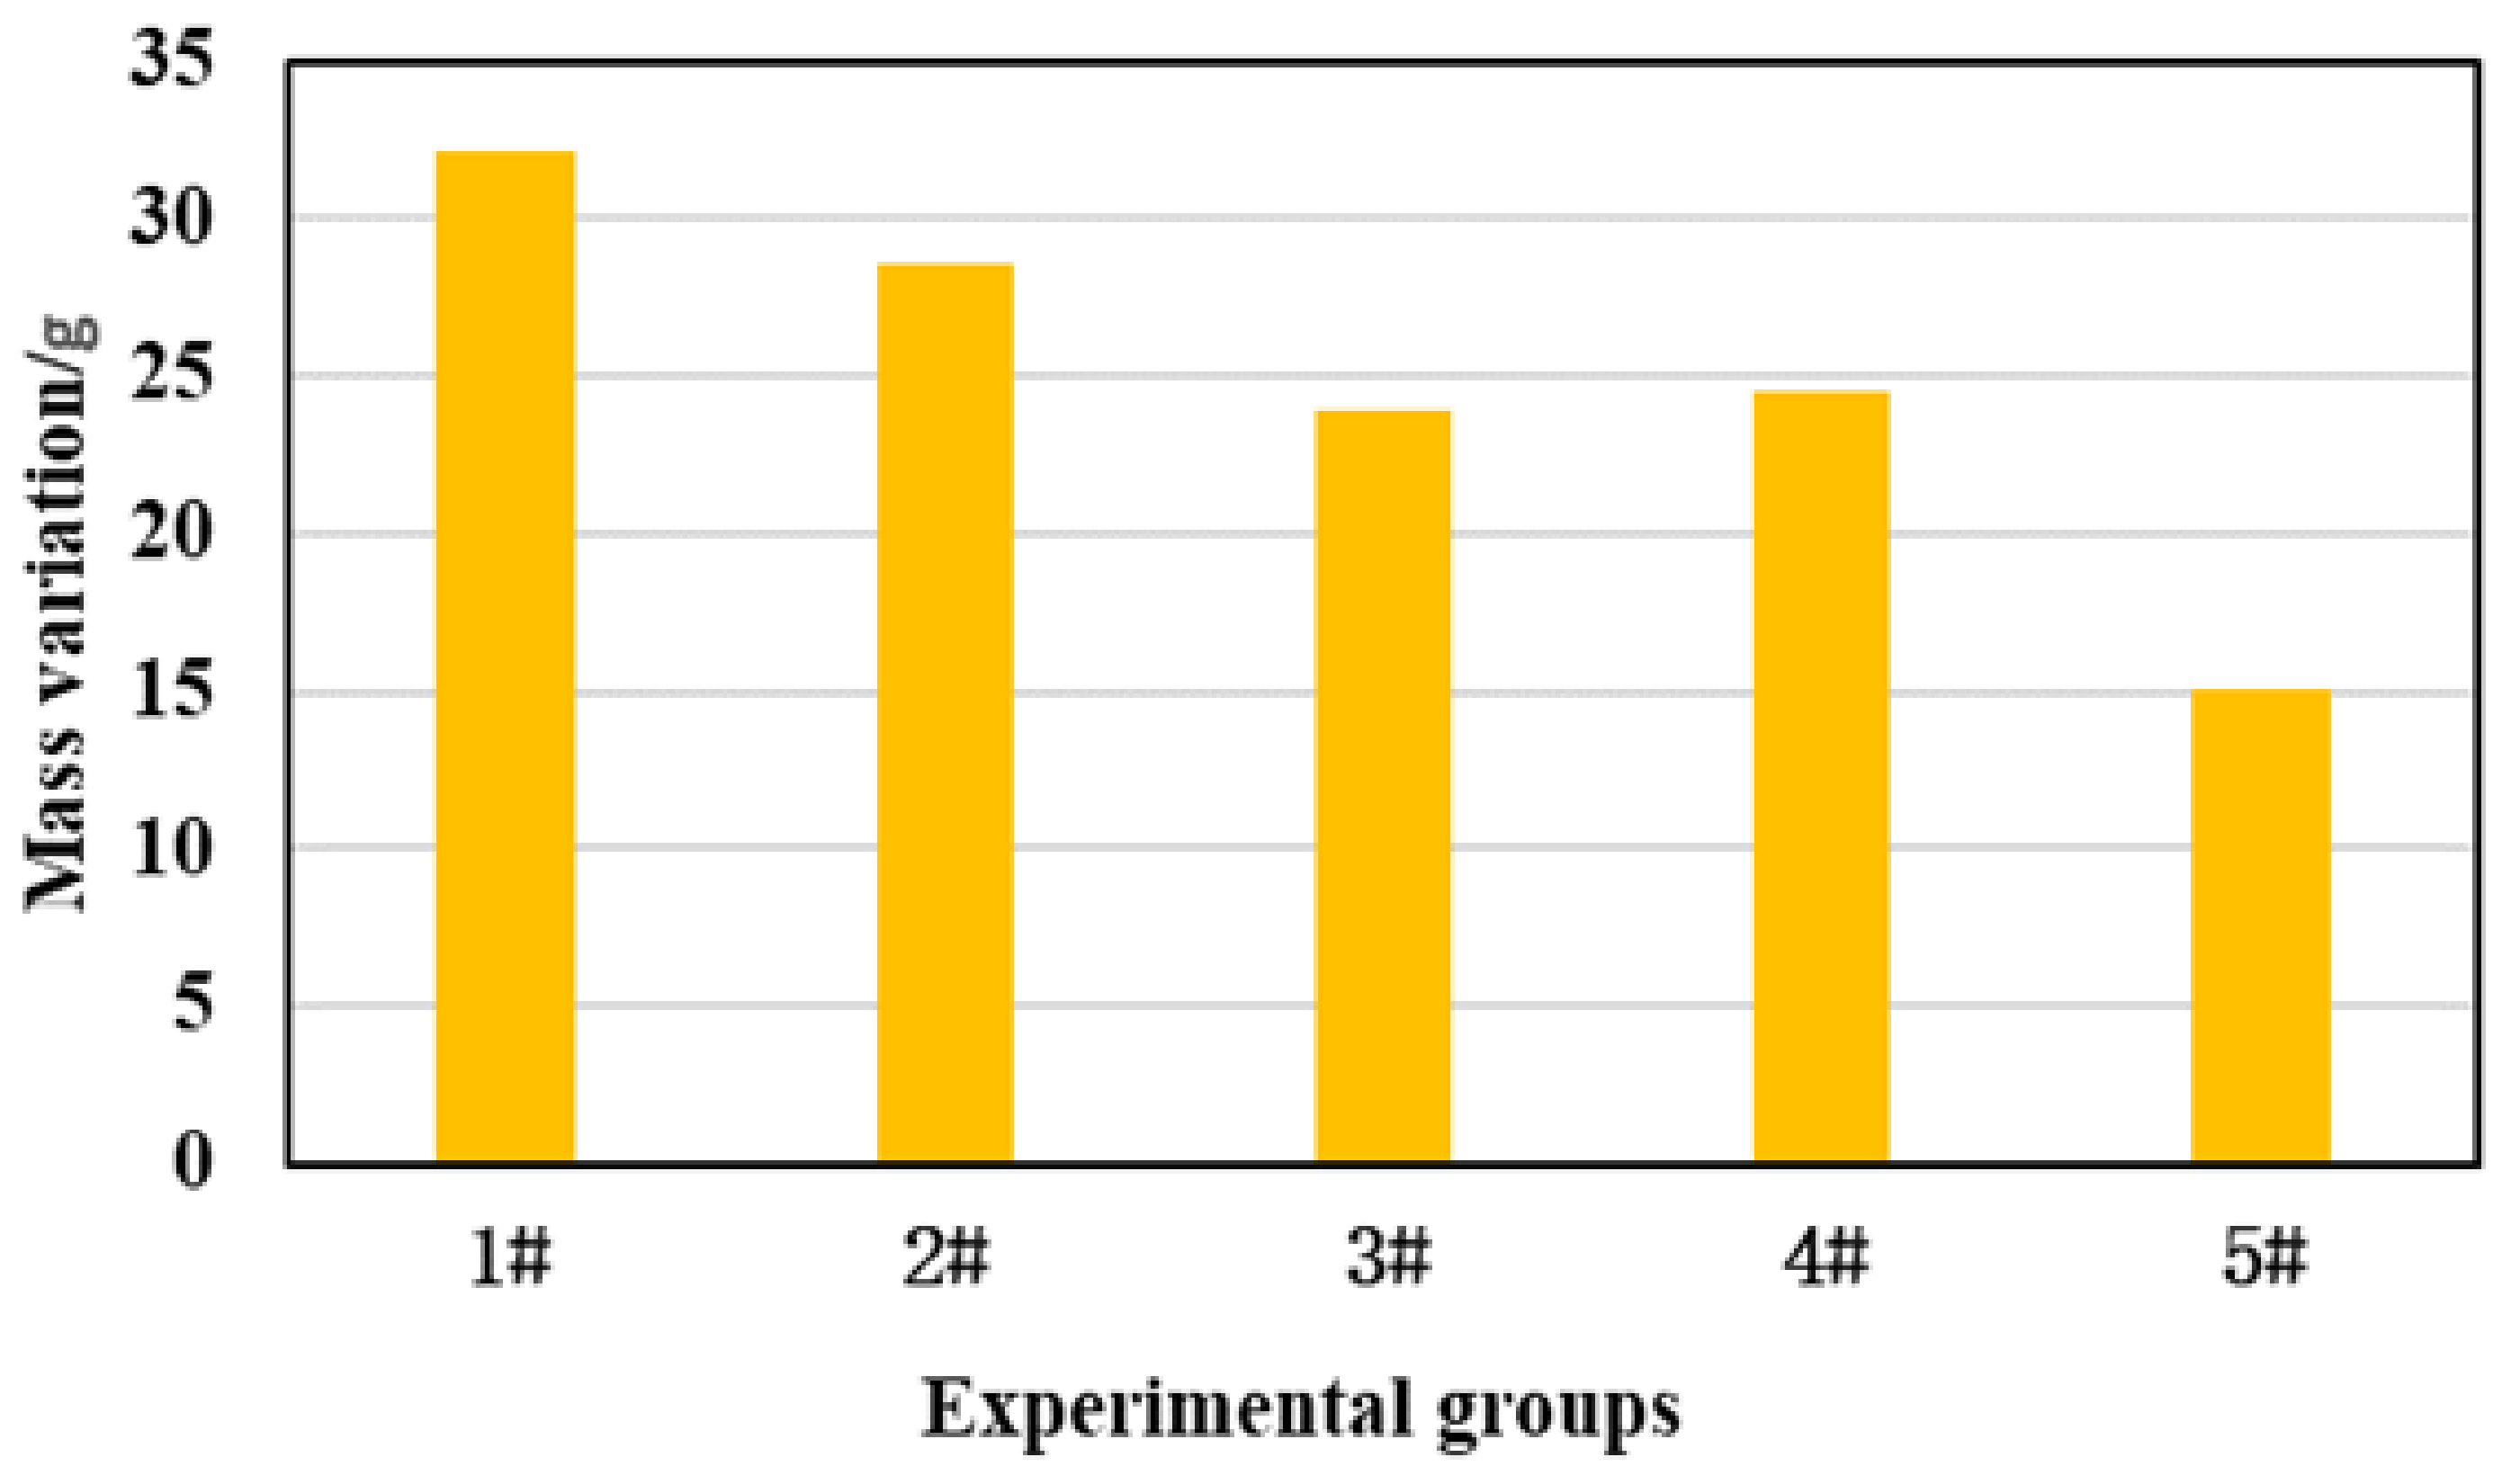
3.2.1. Mass Change after Acid Etching

The first three groups of experimental injection rates were 40, 50, and 60 mL/min, and the total amount of acid injection was 1000 mL. Due to the different contact times of acid rock, with the increase in injection rate, the reaction time of acid rock becomes shorter, and the mass difference before and after the rock slab reaction decreases gradually (Figure 7). The fourth and fifth groups have 15% and 10% acid concentrations, respectively, and the injection rate is 50 mL/min. With the decrease in acid concentration, the quality of the rock slab participating in the reaction decreases rapidly. Due to the high viscosity of the acid, the rock plate is tight, the rock slab surface is etched, but the acid basically has no leak-off and no wormhole formation. Therefore, the acid–rock contact area of the five groups of experiments is the same, and the rock quality involved in the reaction is within a reasonable range.

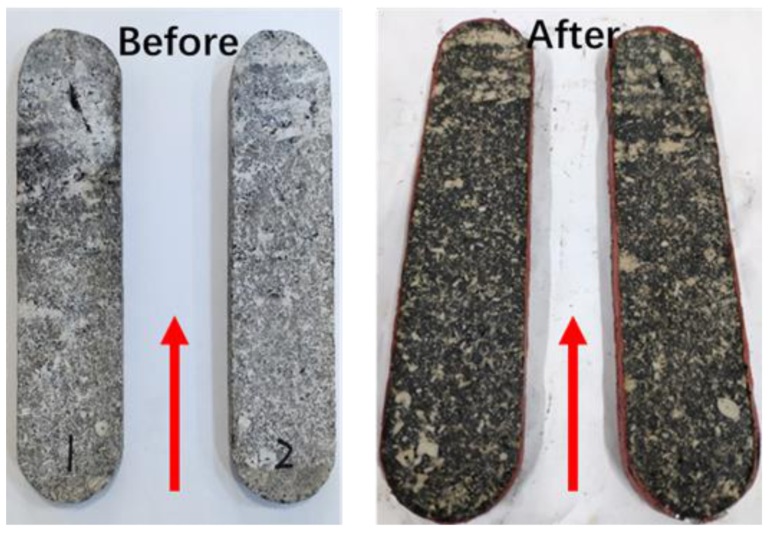
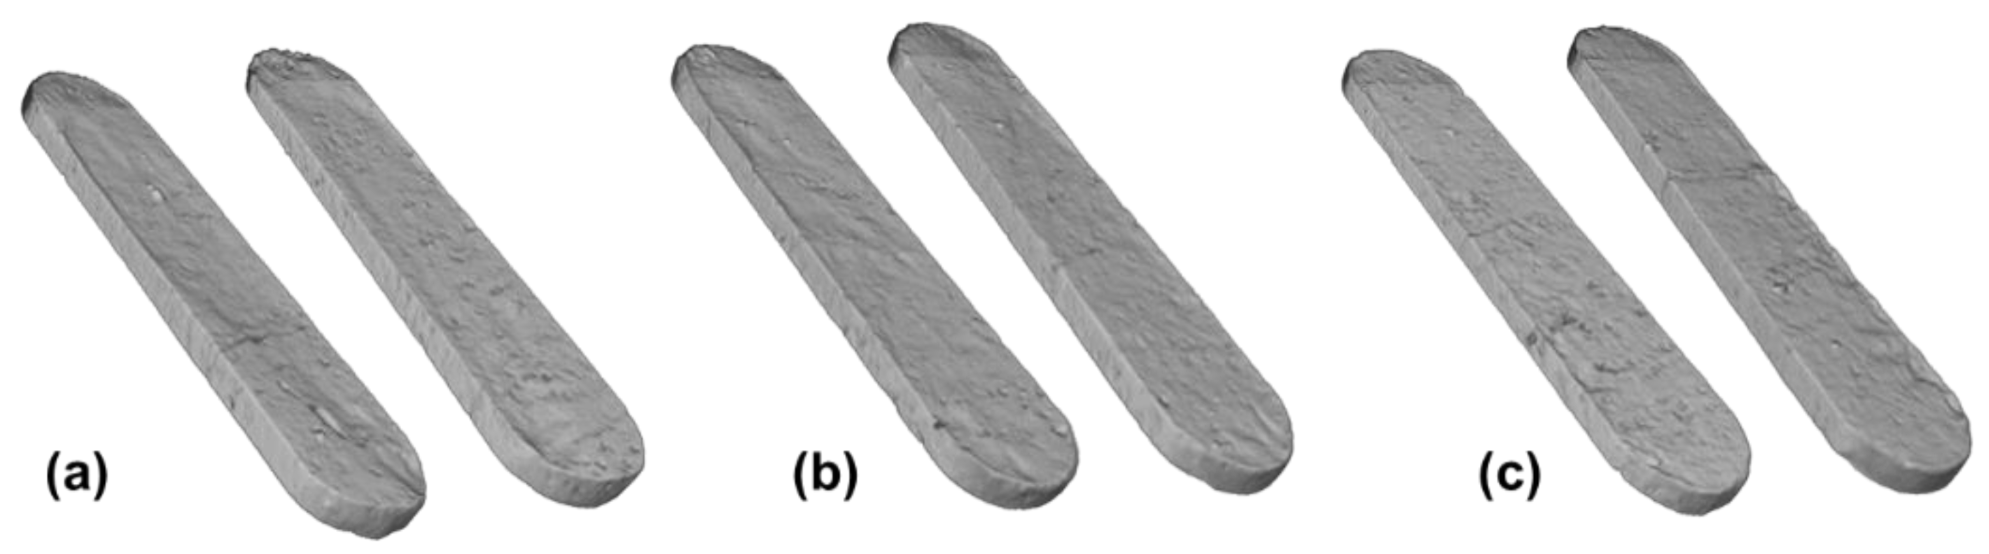
3.2.2. Slab Etching Morphology under Different Injection Rates

Before acid etching, the rock slab is grayish white, and some areas are black. The rock surface is smooth. The red arrow represents the direction of acid injection. After acid etching, the surface color becomes darker, with some cross-linked acid residue (Figure 8). The reason may be that after the acid etching, when the water replaces the acid solution, because the acid’s viscosity is much larger than that of the water, the water forms a viscosity fingering in the acid solution, causing the waterfront to quickly break through to the outlet end of the rock slab. The acid solution cannot be replaced entirely. Regarding the problem of acid residue on the surface of the rock slab and causing damage to the reservoir, the core displacement experiment analysis is carried out separately. After cleaning the rock plate and observing it again, it is found that the surface of the rock slab is uneven, and the dominant acid fluid flows through the channel on the flank. As the rock slab is tight, no wormhole is formed on the slab’s surface. In subsequent experiments, the slabs before acid etching are smooth, ensuring the unity of the experiment. Due to the deep color of the slab after acid etching, the etching morphology cannot be distinguished by the naked eye, so the surface morphology is reconstructed by CT scanning. According to the difference of atomic number/density of different components in the core, the objects with different densities are divided and three-dimensional imaging is carried out to show the acid-etching morphology after the reaction of acid solution and rock slab. In subsequent experiments, the results of CT scans were displayed.
After the first group of acid etching (Figure 9a), the natural pores at the outlet of the rock slab show an expanding trend. However, there are many non-uniform dissolution pits on other surfaces, and there is no apparent wormhole formation. According to the study of Pournik [36], along the acid flow direction is the formation of the dominant flow channel. After the second group of etching (Figure 9b), due to the increase in injection rate, the surface etching morphology heterogeneity is higher than that of the first group. On 2#rock slab, along the acid flow direction forms a flow channel. The convex part can support the fracture after the fracture is closed and maintain high conductivity. After acid etching, the third group (Figure 9c) also has no wormhole formation, more in the direction perpendicular to the acid flow to form a tiny flow channel, which is closely related to the mineral distribution.

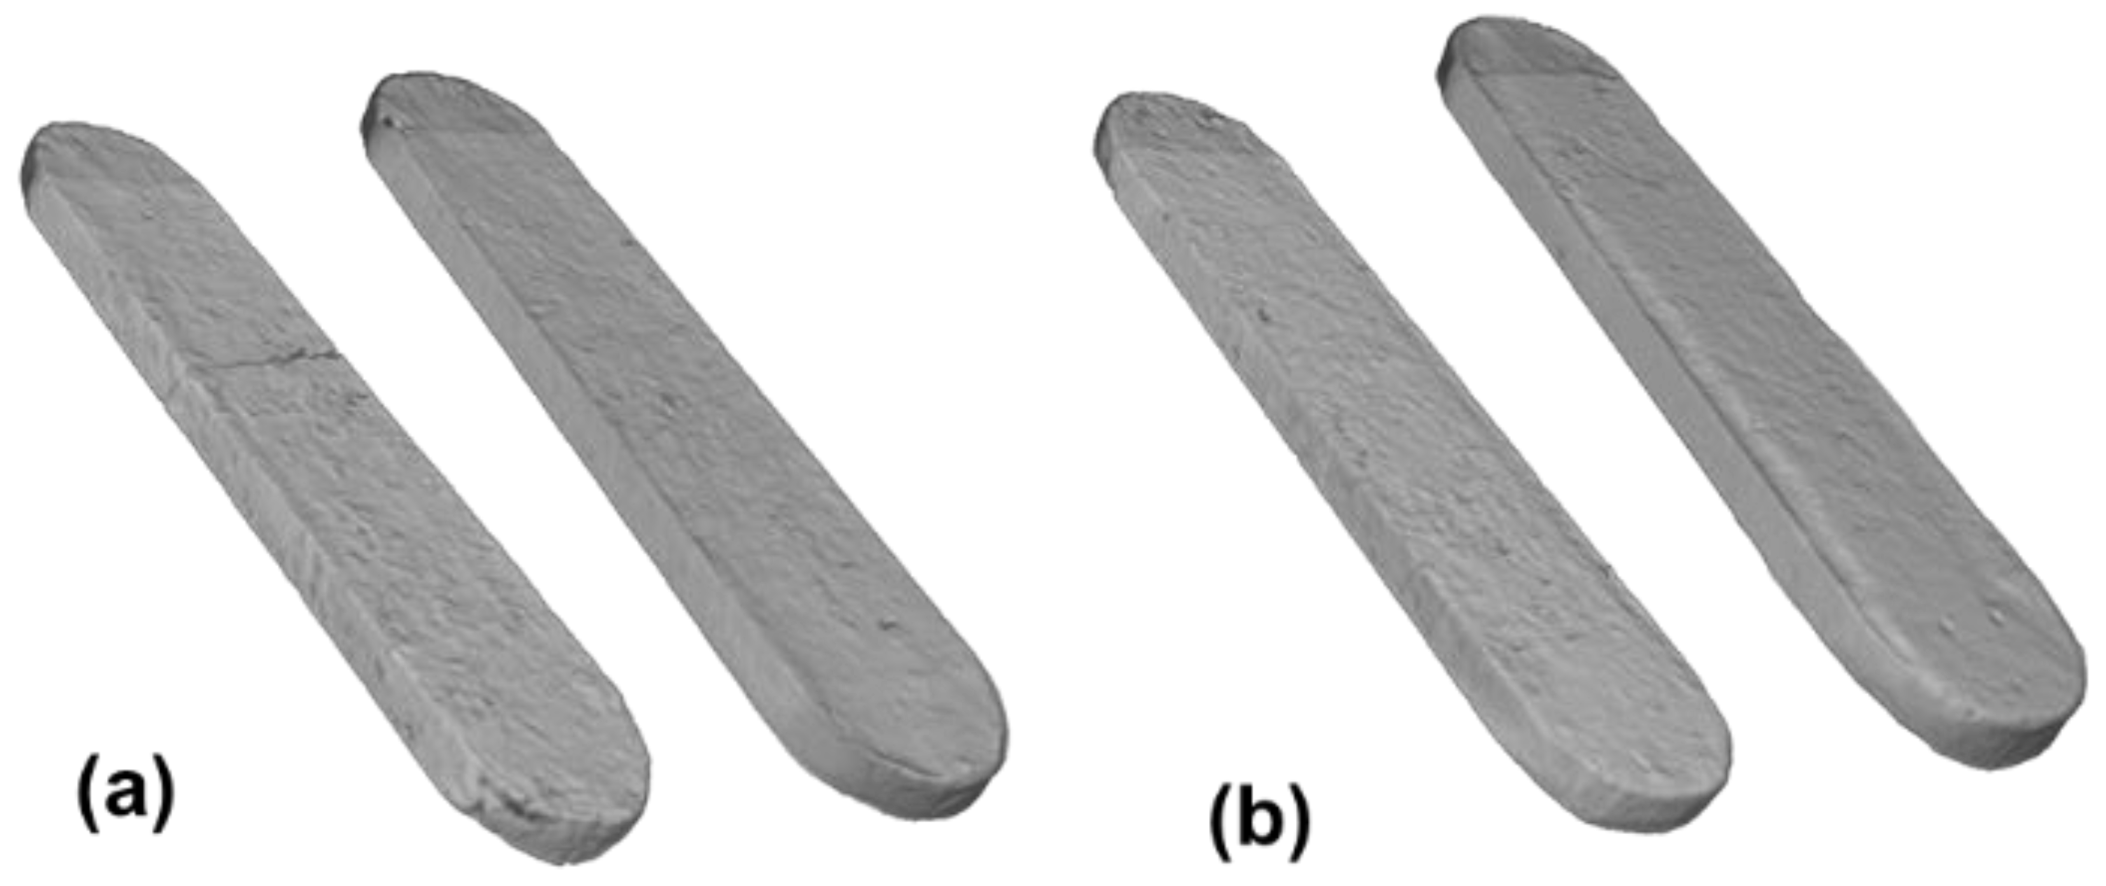
3.2.3. Slab Etching Morphology under Different Acid Concentrations

In the fourth group (Figure 10a), the acid concentration decreases and heterogeneous etching also appears on the slab’s surface, but no prominent acid flow channel appears. Compared with high concentration, the number of pits on the surface of rock plate after etching in low concentration acid solution is more, but the area is relatively small. The fifth group (Figure 10b) uses 10% cross-linked acid. The surface etching morphology is relatively flat. From the etching morphology and the mass difference before and after the reaction, the etching effect of low-concentration acid solution is worse than that of high-concentration acid solution. This shows that the front fracture edge is etched by low-concentration acid in the actual acid fracturing process, and the effect is far less than that near the wellbore.

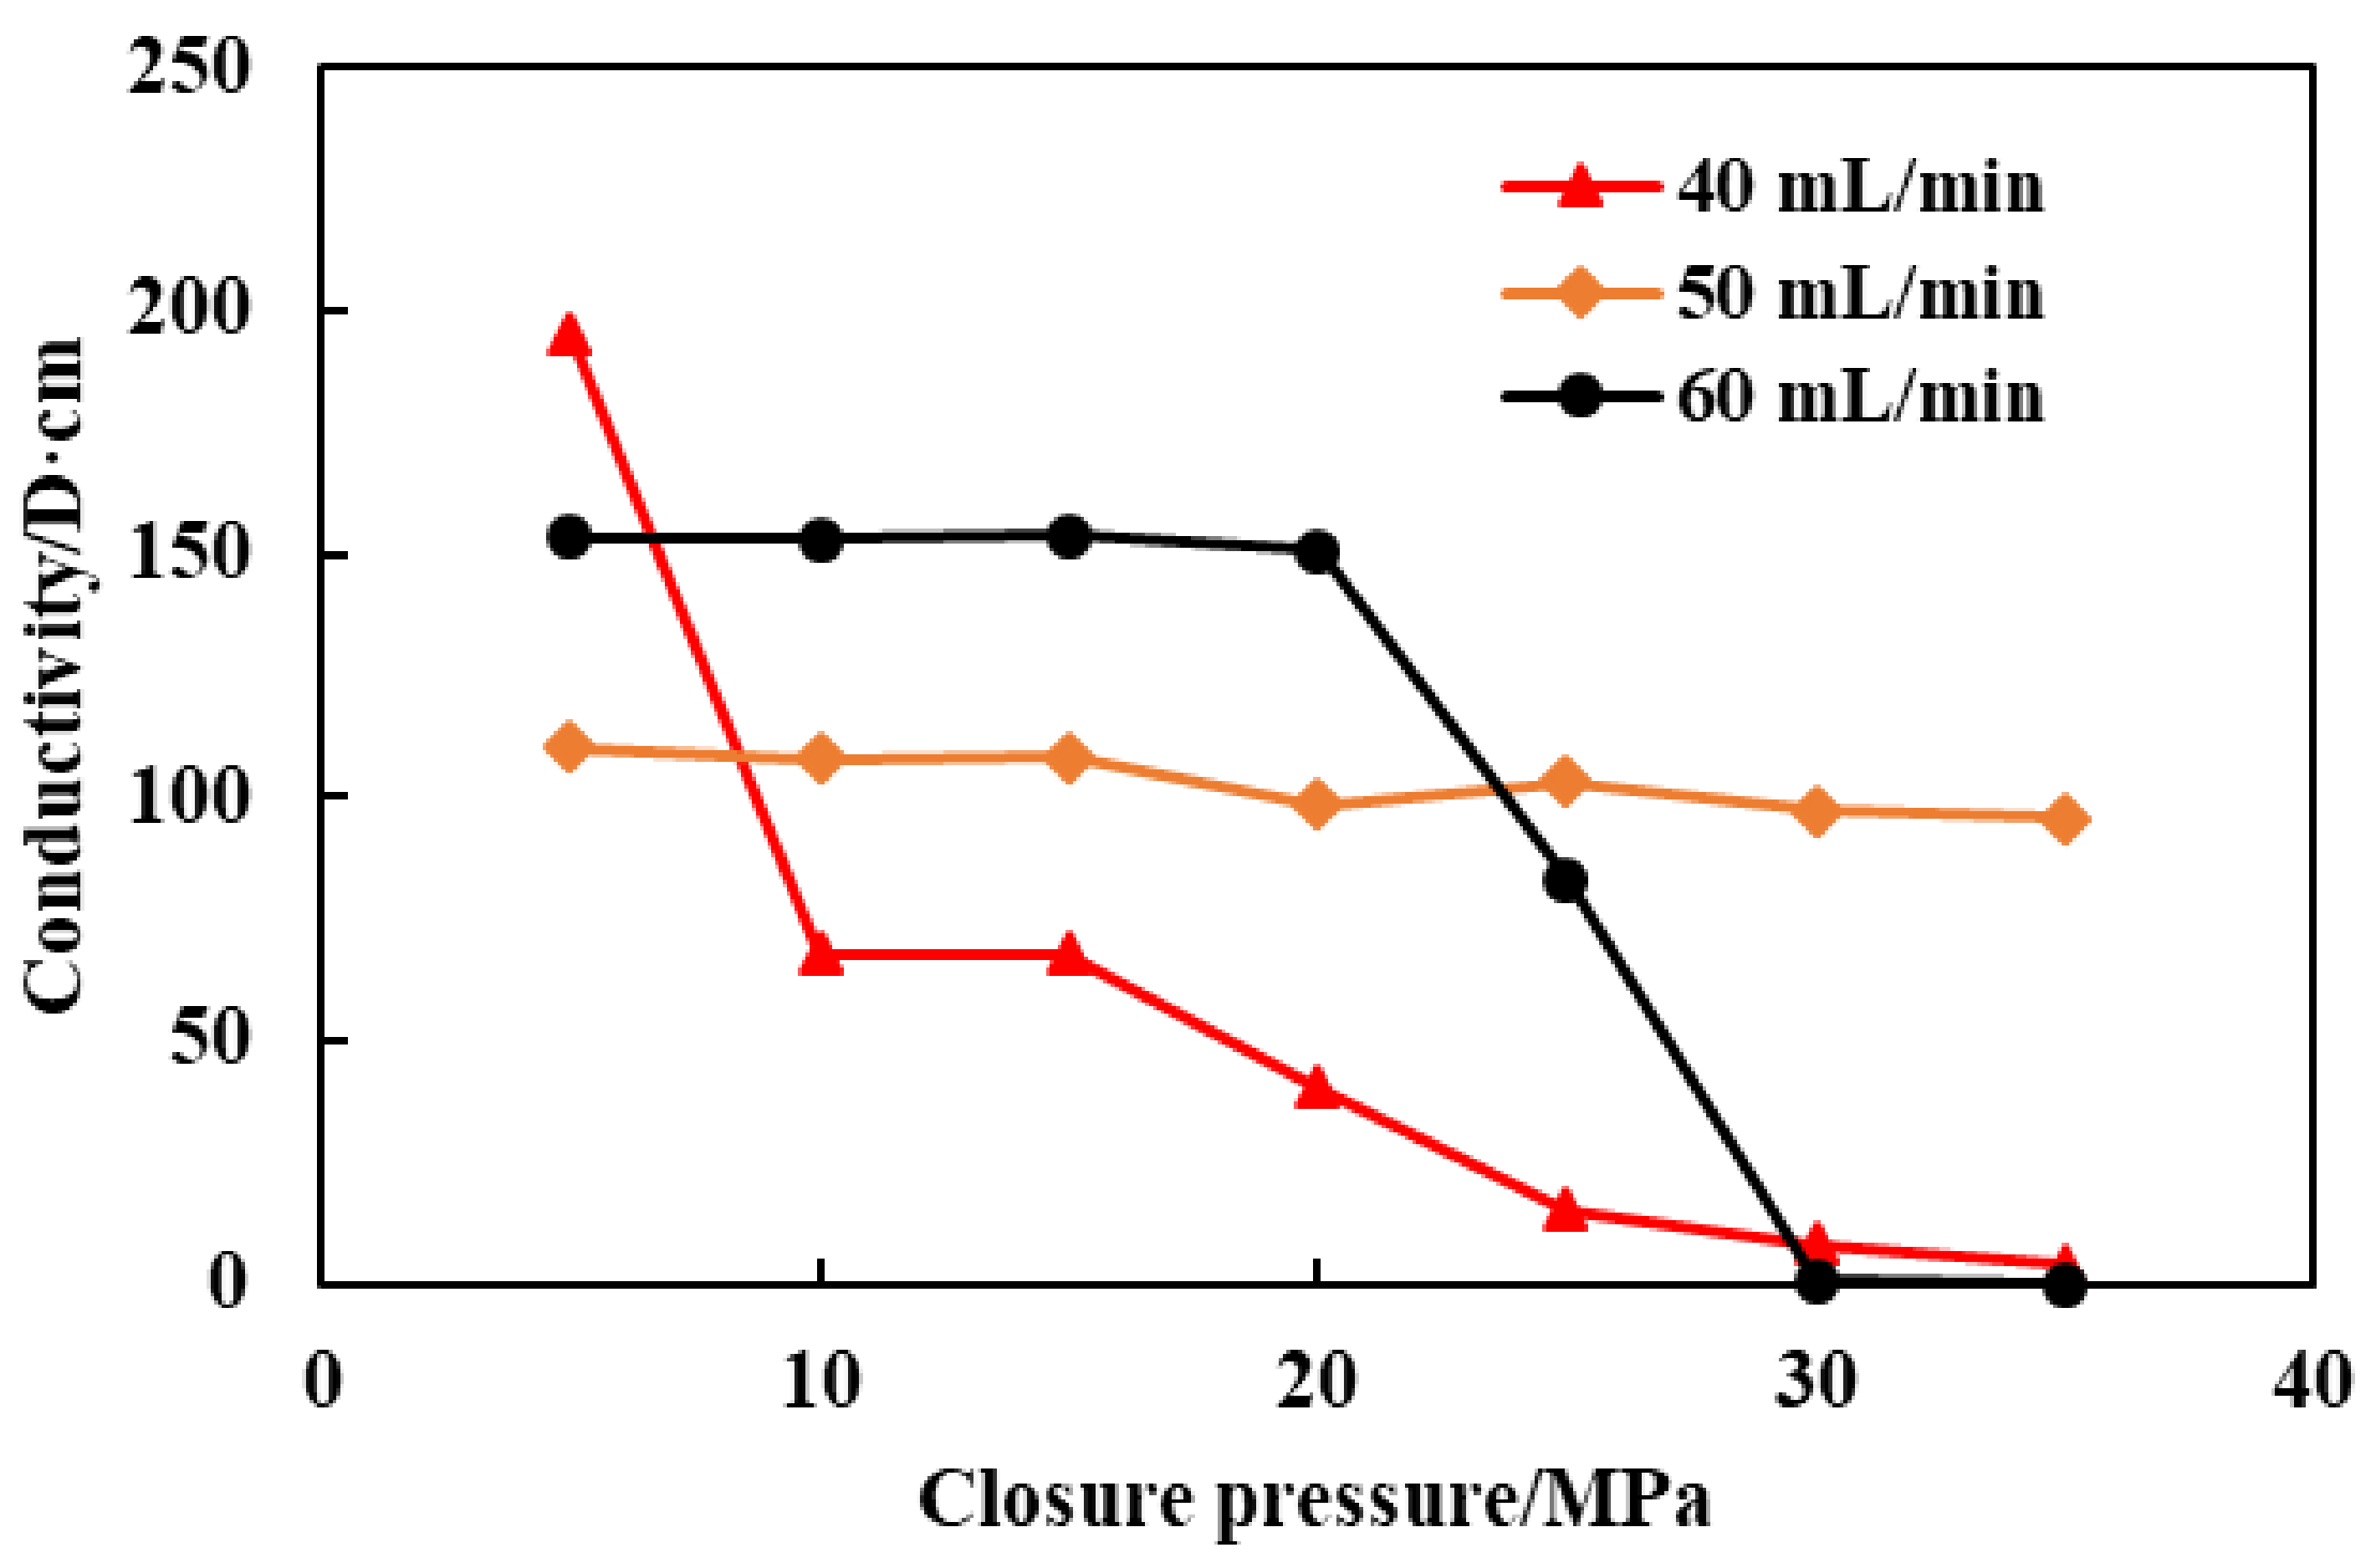
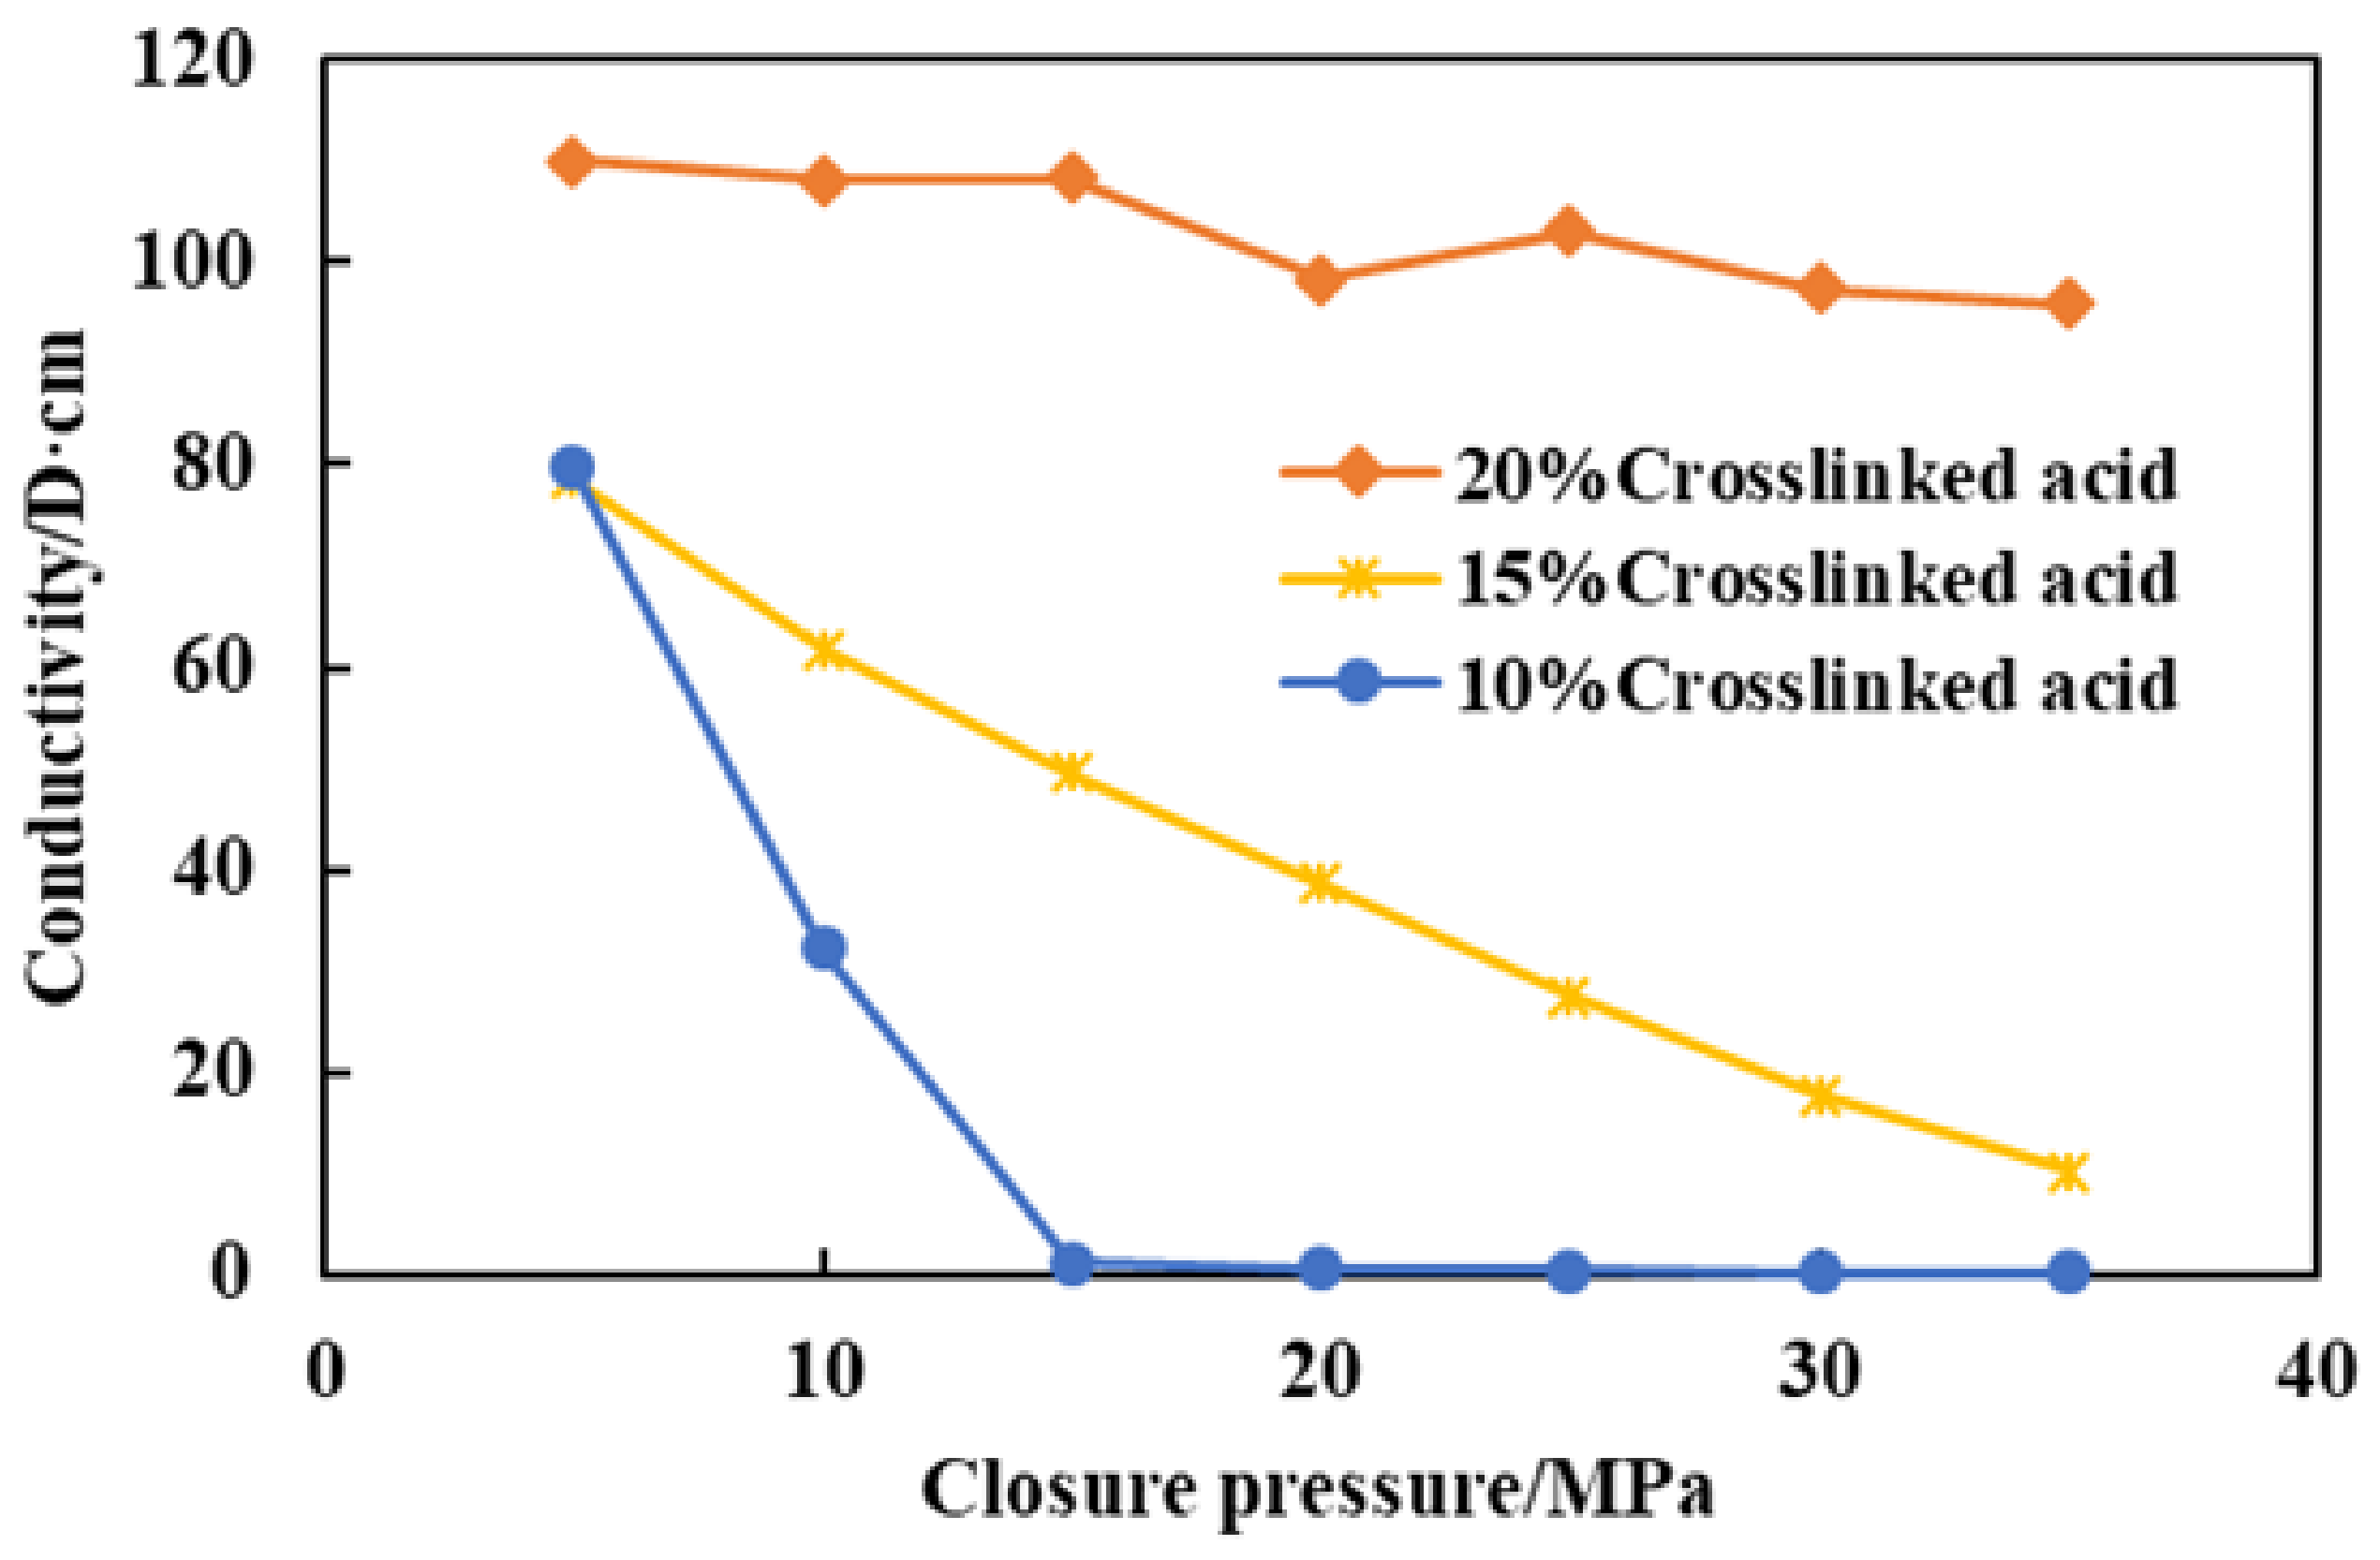
3.2.4. Conductivity Test Results

At different injection rates, the conductivity curve shows different trends. It can be seen from Figure 11 that the initial conductivity is very high at an injection rate of 40 mL/min. However, when the closure pressure increases to 10 MPa, the conductivity decreases rapidly to about 70 D·cm. When the closure pressure increases to 25 MPa, the conductivity decreases to 15 D·cm. When the injection rate is 50 mL/min, under different closure pressures, the conductivity remains basically unchanged at about 110 D·cm, and the effect is the best. Under 60 mL/min injection rate, the initial fracture conductivity is high. When the closure pressure is increased to 25 MPa, the conductivity decreases rapidly, and the final conductivity is zero.
Compared with the acid-etching morphology formed at different injection rates of cross-linked acid, the acid-etching morphology at a smaller injection rate (40 mL/min) tends to be the weak channel type, with some small support points. The acid-etching morphology at the intermediate injection rate (50 mL/min) belongs to the channel type, and the support area is connected into a piece. The acid-etching morphology at higher injection rate (60 mL/min) is rough, and the support point area is dispersed. The results of conductivity show that the conductivity generated by the channel acid-etching morphology decreases slowly with the increase in closure pressure. Choosing the appropriate injection rate to form channel-type acid-etching morphology is of great significance for the development of deep and low permeability carbonate reservoirs.
It can be seen from Figure 12 that with the decrease in acid concentration, the conductivity of rock slab is greatly reduced under the same closure pressure. The conductivity produced by 20% cross-linked acid remains basically unchanged with the increase in closure pressure, and the conductivity produced by 15% cross-linked acid decreases with the increase in closure pressure. Especially when the acid concentration is 5%, the closure pressure is increased to 15 MPa, and there is almost no conductivity. From the perspective of acid-etching morphology, the quality of acid–rock reaction is obviously reduced after the acid concentration is reduced. It shows that the acid concentration is critical to the acid action distance in the actual acid fracturing stimulation. The decrease in conductivity caused by acid concentration also shows that the problem of different conductivity at different fracture distances should be fully considered in numerical simulation.

3.3. Permeability Damage Test

The reacted acid is injected into the core, and the change value of core permeability and core surface morphology judges the damage degree of reacted acid to the reservoir.
After the core is damaged by reacted acid, the photos and displacement pressure difference curves are shown in Figure 13 and Figure 14. From the core photos after displacement, it can be found that there is a large amount of reacted acid at the entrance of the core. At the same time, there is less reacted acid at the outlet of the core. By observing the displacement pressure difference curve, it is found that the maximum displacement pressure difference can reach 12 MPa when reversing flooding kerosene after damage and decreases rapidly. This is because the reacted acid and kerosene flow in the opposite direction. In the previous stage, the reacted acid blocked the core entrance. When kerosene flows into the core for the second time, the reacted acid increases the flow resistance of kerosene, resulting in a sharp increase in the flow pressure difference. When the pressure reaches a certain value, the resistance of the reacted acid is broken through, and the subsequent kerosene flows out along the low-resistance flow channel. After the reacted acid damage, the kerosene displacement pressure difference increases slightly. The permeability damage is 6.72%, indicating that the core permeability decreases, and the reacted acid causes damage to the pore (Figure 15). Through microscopic observation (Figure 16.), there is gray–black acid slag accumulation at the inlet and glial residues on the entire core surface, which do not easily fall off after washing with water.

4. Conclusions

This paper evaluated the performance of a ground cross-linked acid system from the aspects of rheological properties, rock slab acid etching, conductivity, and reacted acid damage with high carbonate mineral rock. The main conclusions and suggestions are as follows:
(1)
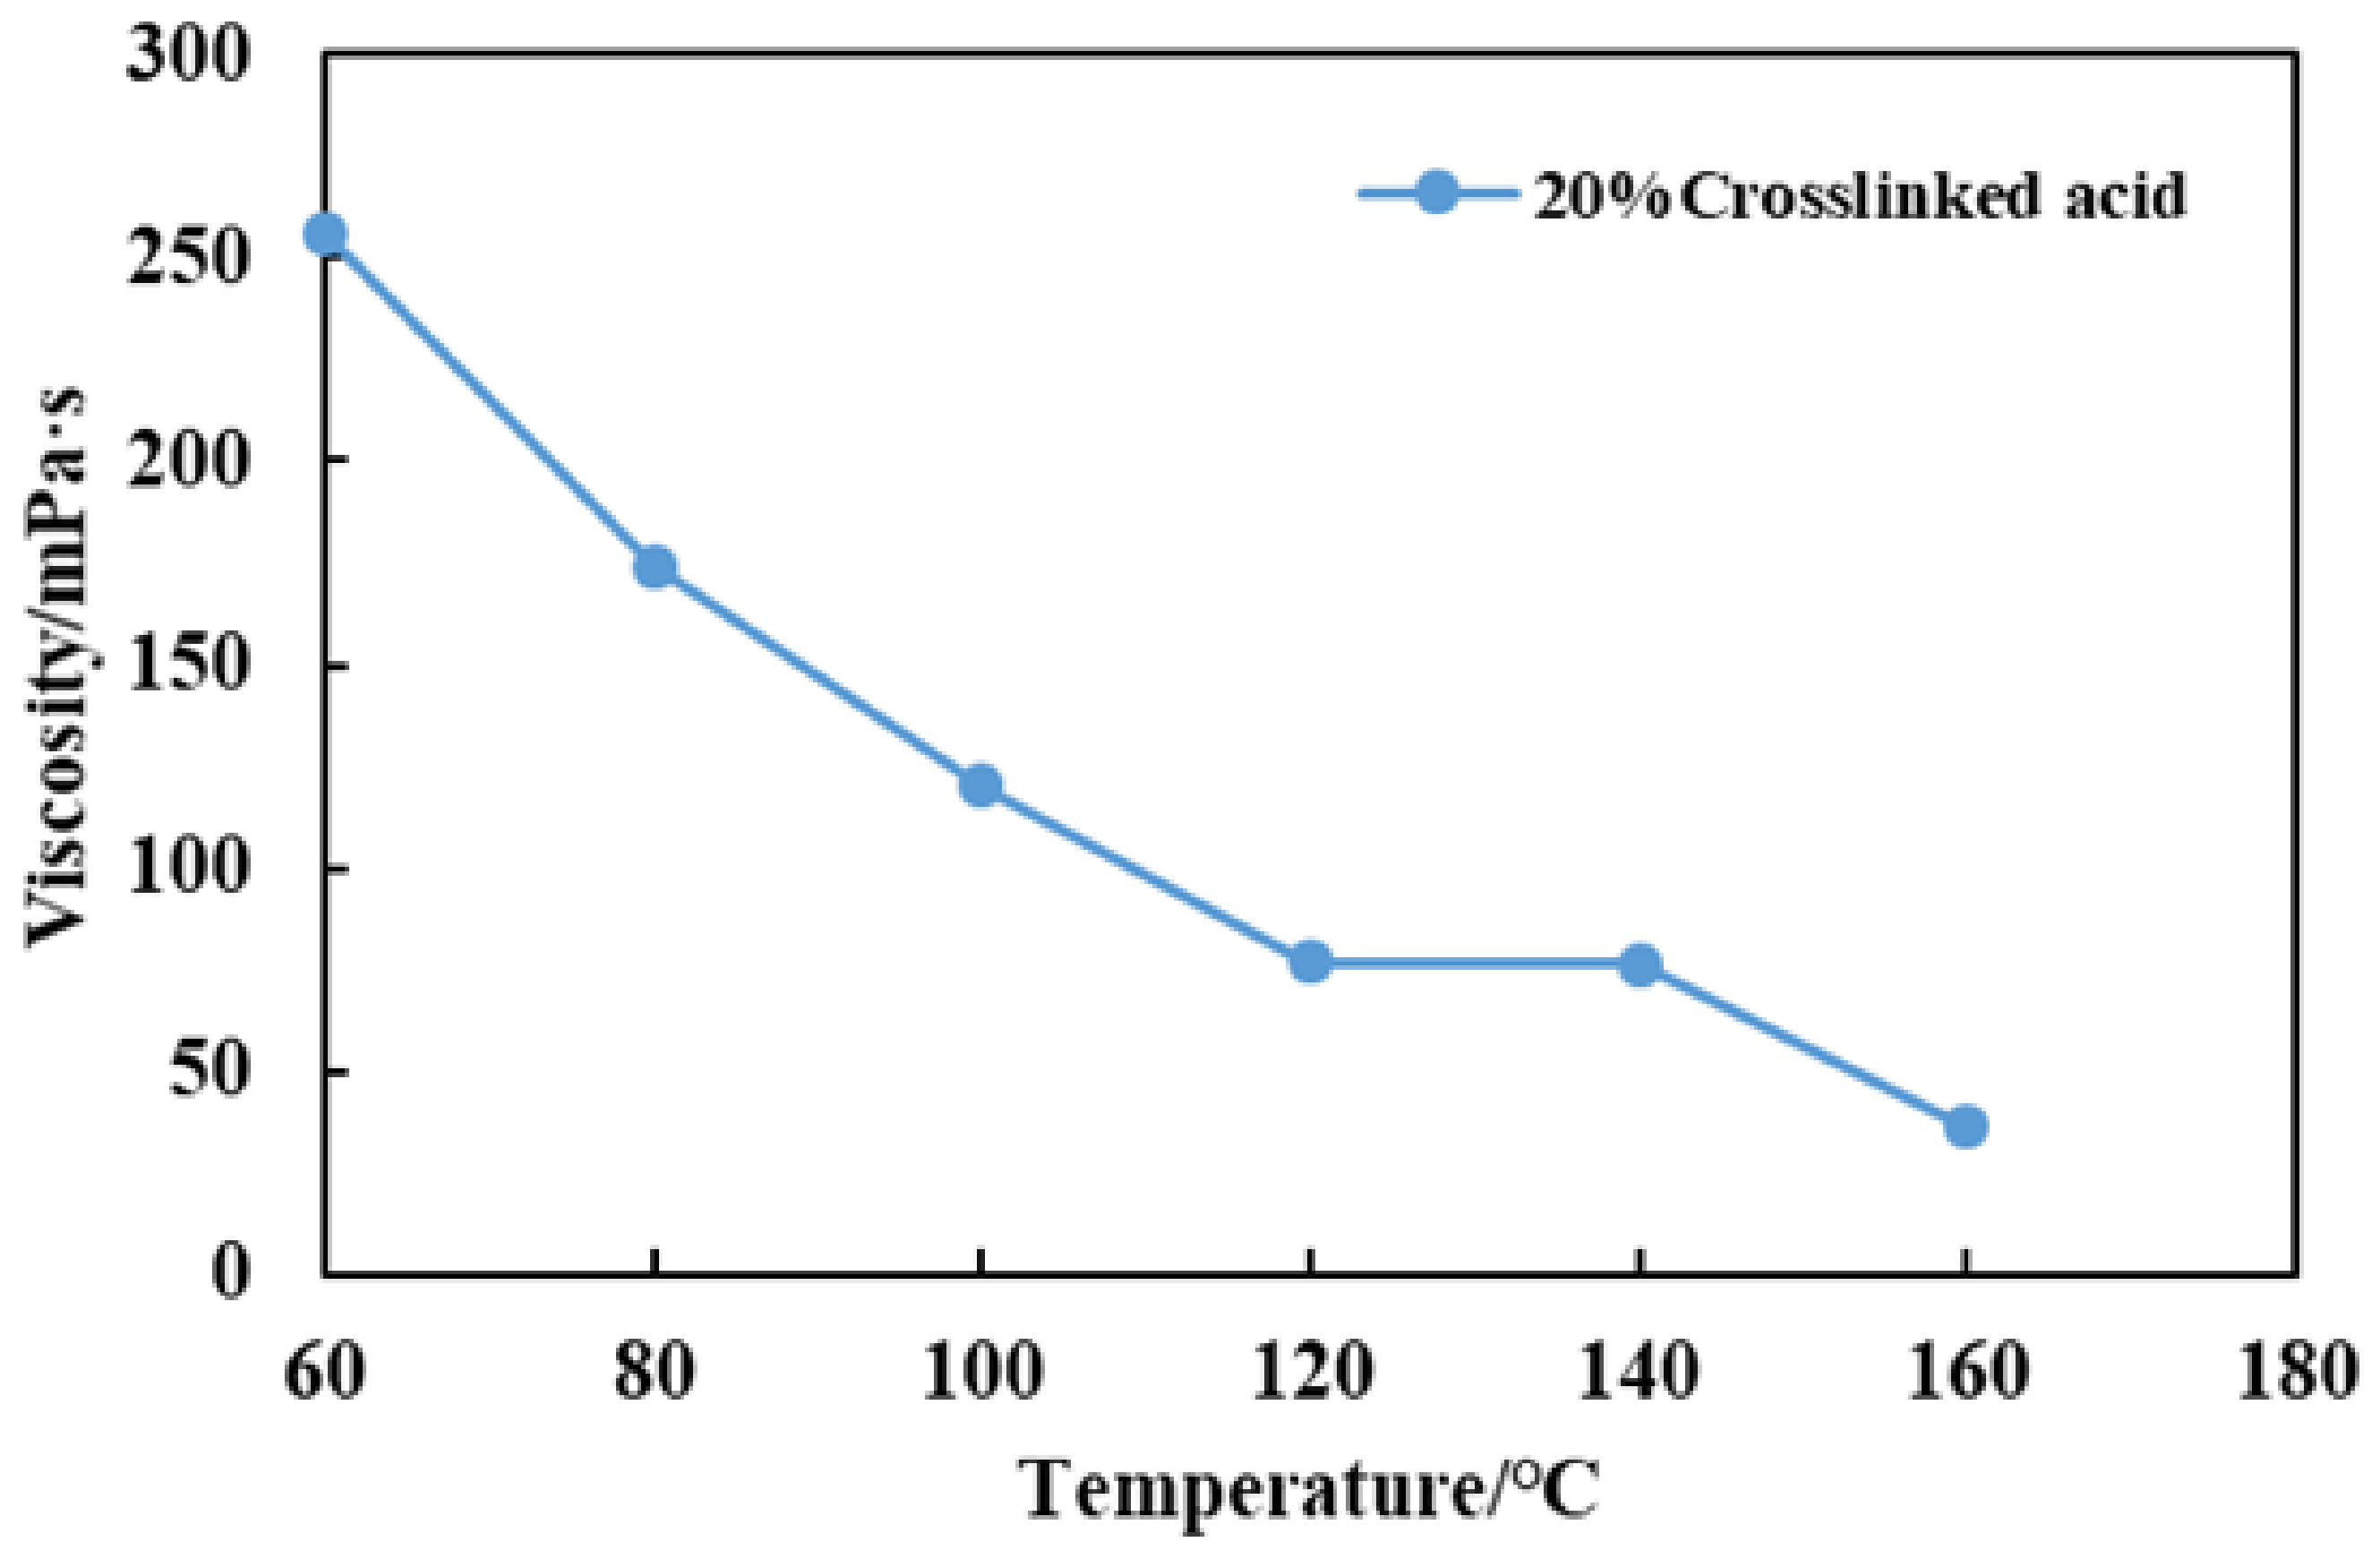
The viscosity of the cross-linked acid can be maintained at about 80 mPa·s at 120~140 °C, and the viscosity at 160 °C is about 40 mPa·s, indicating that the system has good temperature resistance and shear resistance during the test time;
(2)
The etching morphology and conductivity test show that when the injection rate is 50 mL/min, the conductivity is 110 D·cm. With the increase in closure pressure, the decreased conductivity rate is low. The conductivity is closely related to the acid = etching morphology. The experimental results show that the channel-type acid-etching morphology has a large conductivity and is not easy to reduce;
(3)
With the decrease in acid concentration, the etching effect worsens, and the conductivity decreases rapidly. When the acid concentration is 10%, the closure pressure increases to 15 MPa, with almost no conductivity. The relationship between conductivity and closure pressure is related to the strength of fracture surface. It is the trend of subsequent research to establish the relationship of acid-etching conductivity considering strength;
(4)
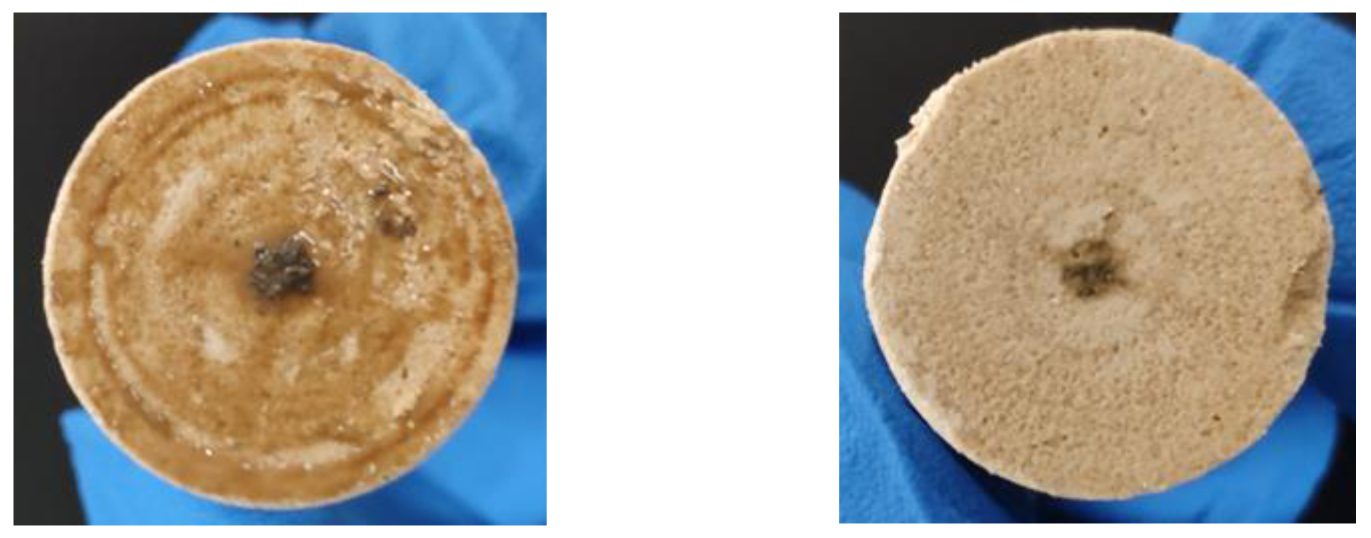
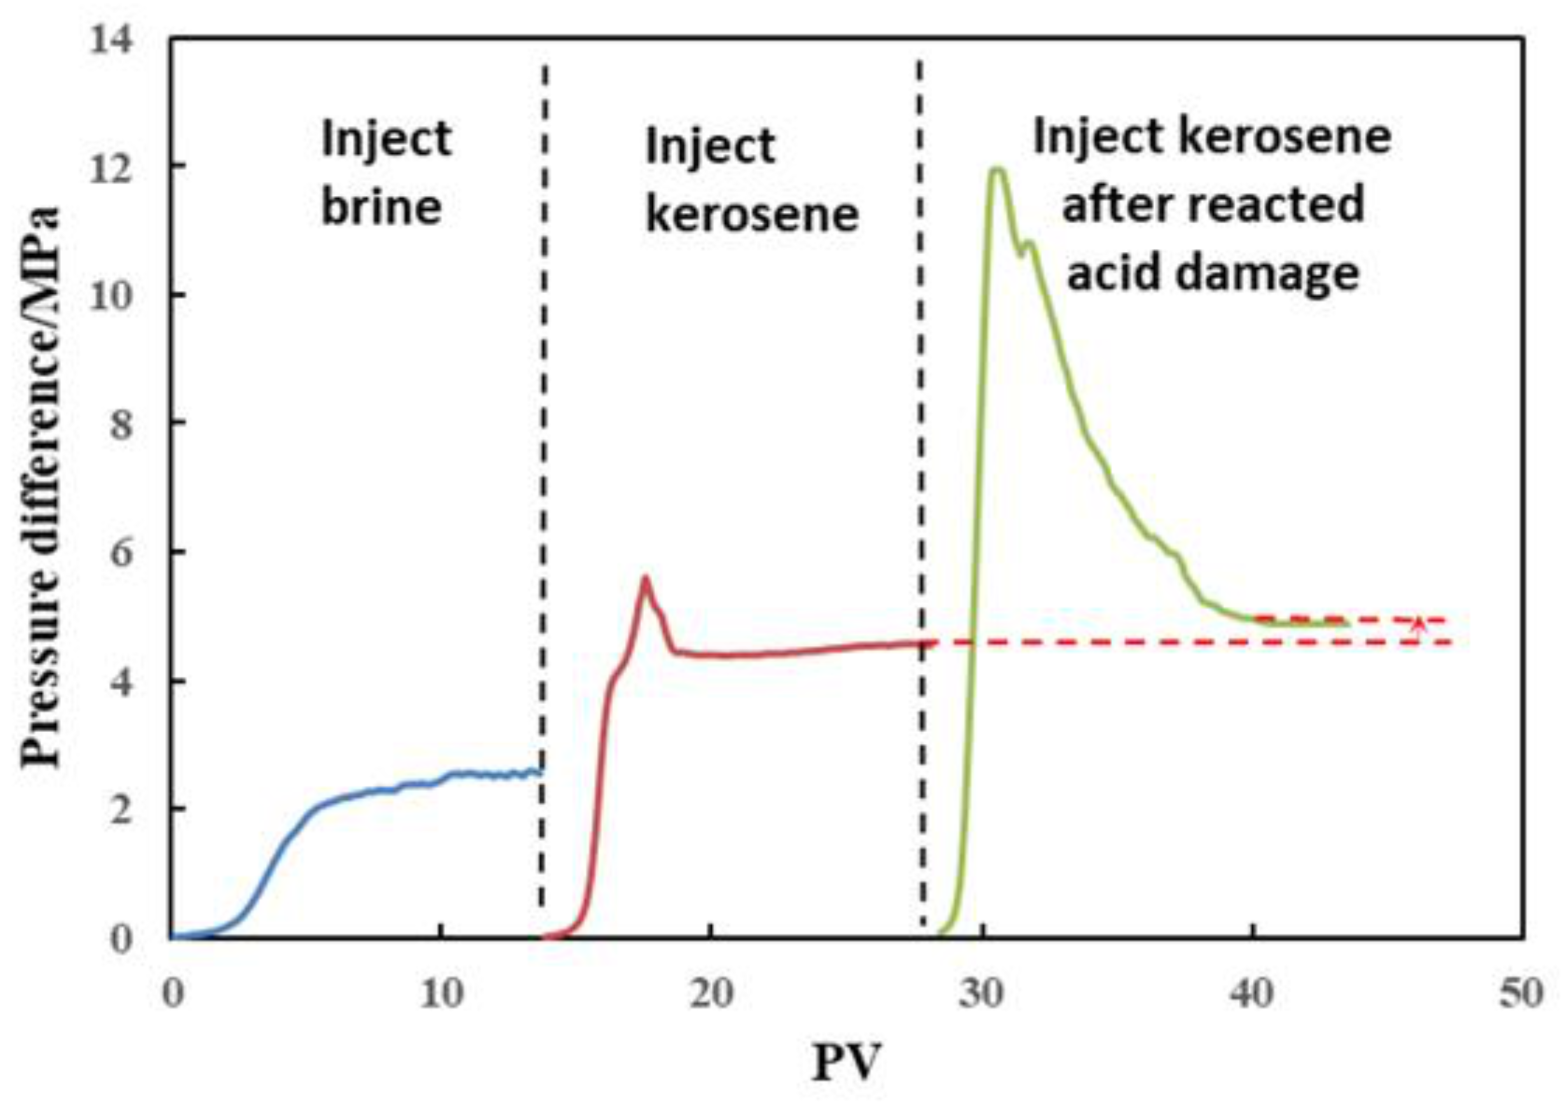
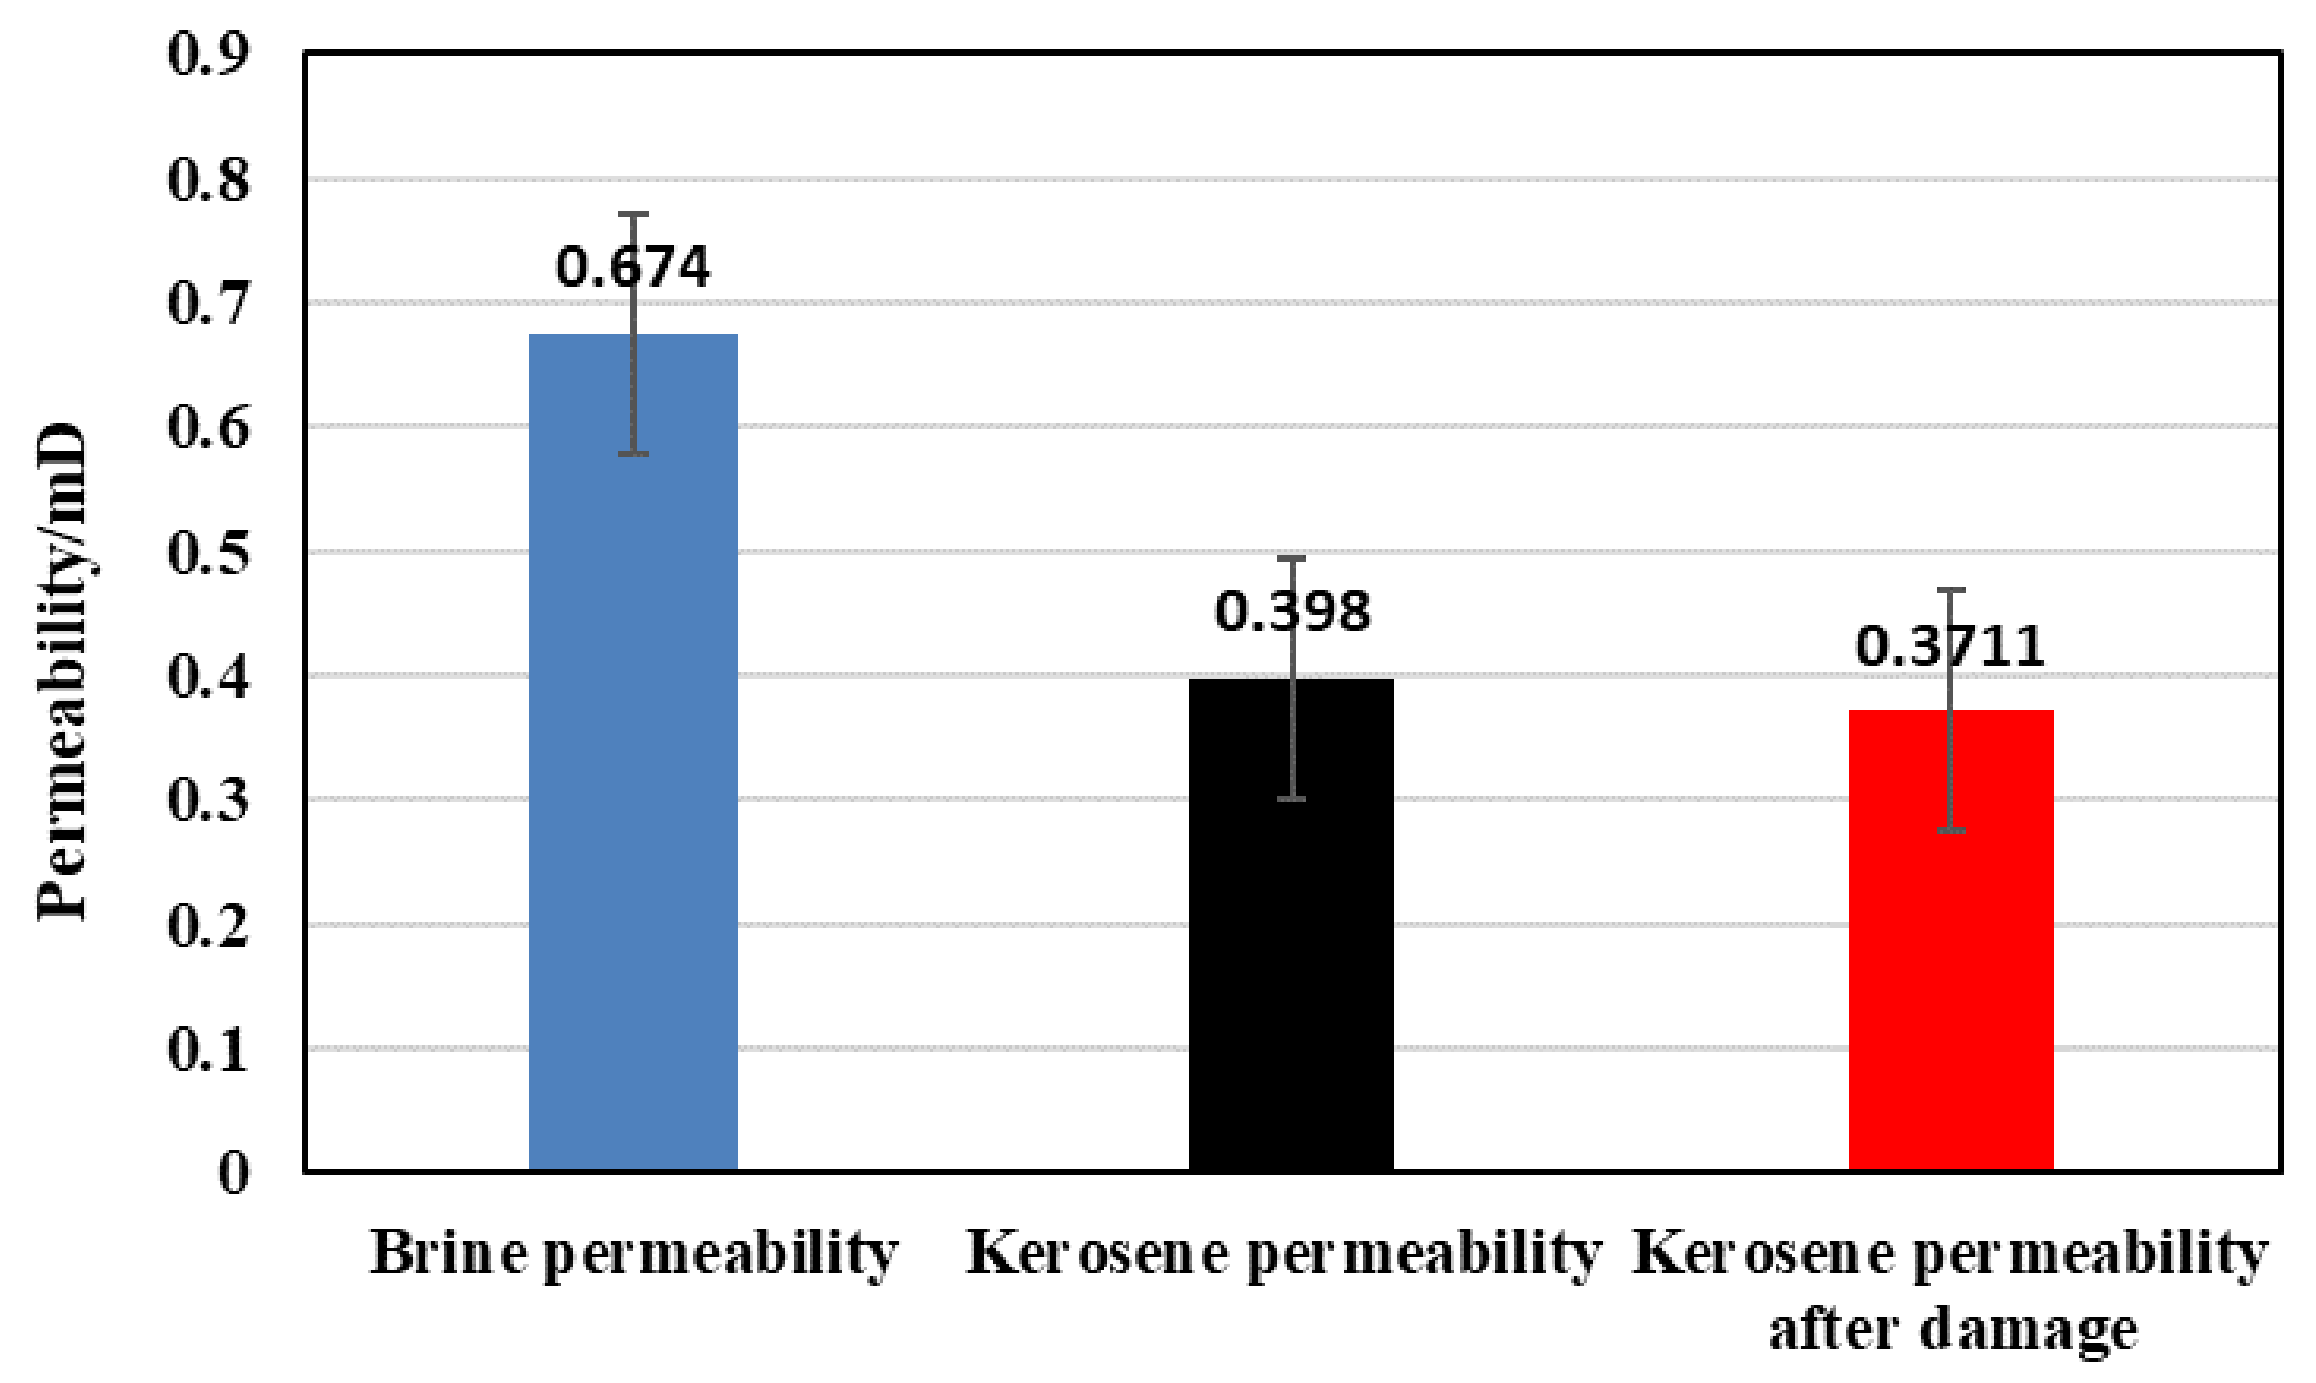
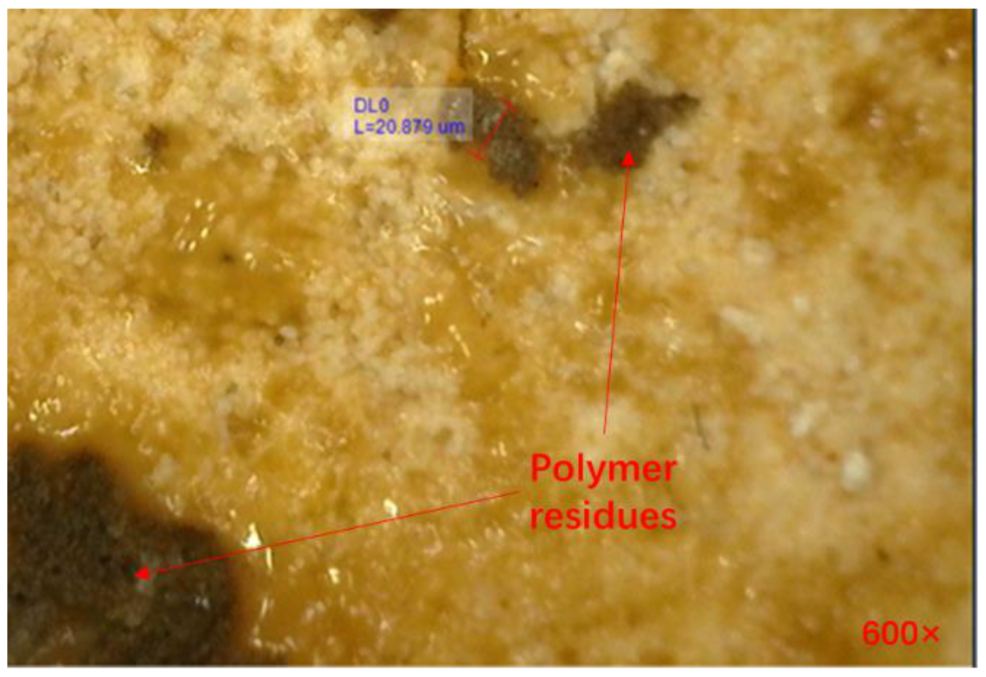
The reacted acid pollution mainly occurs at the inlet, forming a dense filter cake, hindering the entry of subsequent residues, and reducing reservoir damage.
The wormholes produced in the acid-etching process and natural fractures increase the acid fluid loss and reduce the acid-etching fracture’s length. This paper studies the damage of reacted acid to the matrix core without considering its damage to natural fractures. These problems are essential for improving the stimulation efficiency of carbonate acid fracturing and need further research.

Author Contributions

Conceptualization, H.L.; methodology, T.H.; experiment, F.W.; validation, L.Y.; data analysis, S.L.; investigation, G.Y.; writing—original draft preparation, Q.W.; writing—review and editing, G.W. and Y.L.; funding acquisition, F.Z. All authors have read and agreed to the published version of the manuscript.

Funding

This research was financially supported by National Natural Science Foundation of China (grant No. 52174045).

Institutional Review Board Statement

Not applicable.

Informed Consent Statement

Not applicable.

Data Availability Statement

Not applicable.

Conflicts of Interest

The authors declare no conflict of interest.

References

  1. Klym, H.; Karbovnyk, I.; Piskunov, S.; Popov, A.I. Positron Annihilation Lifetime Spectroscopy Insight on Free Volume Conversion of Nanostructured MgAl2O4 Ceramics. Nanomaterials 2021, 11, 3373. [Google Scholar] [CrossRef] [PubMed]
  2. Luchechko, A.; Shpotyuk, Y.; Kravets, O.; Zaremba, O.; Szmuc, K.; Cebulski, J.; Ingram, A.; Golovchak, R. Microstructure and luminescent properties of Eu3+-activated MgGa2O4: Mn2+ ceramic phosphors. J. Adv. Ceram. 2020, 9, 432–443. [Google Scholar] [CrossRef]
  3. Schwalbert, M.P.; Aljawad, M.S.; Hill, A.D.; Zhu, D. Decision Criterion for Acid-Stimulation Method in Carbonate Reservoirs: Matrix Acidizing or Acid Fracturing? SPE J. 2020, 25, 2296–2318. [Google Scholar] [CrossRef]
  4. Zhu, D.; Wang, Y.; Cui, M.; Zhou, F.; Wang, Y.; Liang, C.; Zou, H.; Yao, F. Acid System and Stimulation Efficiency of Multistage AcidFracturing in Porous Carbonate Reservoirs. Processes 2022, 10, 1883. [Google Scholar] [CrossRef]
  5. Zhao, X.; Cun, X.; Li, N.; Yu, J.; Ren, X.; Shen, F.; Zhu, J.; Zhang, Y.; Ren, Z. Simulation of Volumetric Acid Fracturing Fracture in Low Permeability Carbonate Rock. Pet. Sci. Technol. 2022, 40, 2336–2360. [Google Scholar] [CrossRef]
  6. Dong, R.; Alpak, F.O.; Wheeler, M.F. Accurate Two-Phase Flow Simulation in Faulted Reservoirs by Combining Two-Point Flux Approximation and Mimetic Finite Difference Methods. SPE J. 2022, 28, 111–129. [Google Scholar] [CrossRef]
  7. Aljawad, M.S.; Aljulaih, H.; Mahmoud, M.; Desouky, M. Integration of Field, Laboratory, and Modeling Aspects of Acid Fracturing: A Comprehensive Review. J. Pet. Sci. Eng. 2019, 181, 106158. [Google Scholar] [CrossRef]
  8. Antelo, L.F.; Pournik, M.; Zhu, D.; Hill, A.D. Surface Etching Pattern and Its Effect on Fracture Conductivity in Acid Fracturing. In Proceedings of the SPE Hydraulic Fracturing Technology Conference, The Woodlands, TX, USA, 19–21 January 2009. [Google Scholar]
  9. Gou, B. Acid-Etching Fracture Morphology and Conductivity for Alternate Stages of Self-Generating Acid and Gelled Acid during Acid-Fracturing. J. Pet. Sci. Eng. 2021, 200, 108358. [Google Scholar] [CrossRef]
  10. Jafarpour, H.; Aghaei, H.; Litvin, V.; Ashena, R. Experimental Optimization of a Recently Developed Matrix Acid Stimulation Technology in Heterogeneous Carbonate Reservoirs. J. Pet. Sci. Eng. 2021, 196, 108100. [Google Scholar] [CrossRef]
  11. Shabani, A.; Jamshidi, S.; Jahangiri, H.R. Application of a Mathematical Method in Calculation of the Skin Variation during a Real Field Acidizing Operation. Chem. Eng. Sci. 2018, 192, 829–839. [Google Scholar] [CrossRef]
  12. Karimi, M.; Shirazi, M.M.; Ayatollahi, S. Investigating the Effects of Rock and Fluid Properties in Iranian Carbonate Matrix Acidizing during Pre-Flush Stage. J. Pet. Sci. Eng. 2018, 166, 121–130. [Google Scholar] [CrossRef]
  13. Deng, J.; Mou, J.; Hill, A.D.; Zhu, D. A New Correlation of Acid-Fracture Conductivity Subject to Closure Stress. SPE Prod. Oper. 2012, 27, 158–169. [Google Scholar] [CrossRef] [Green Version]
  14. Asadollahpour, E. The Etching and Hydraulic Conductivity of Acidized Rough Fractures. J. Pet. Sci. Eng. 2018, 166, 704–717. [Google Scholar] [CrossRef]
  15. Trejos, D.Y.; Valverde, J.C.; Venturino, E. Dynamics of infectious diseases: A review of the main biological aspects and their mathematical translation. Appl. Math. Nonlinear Sci. 2022, 7, 1–26. [Google Scholar] [CrossRef]
  16. Sabir, Z.; Umar, M.; Raja, M.A.Z.; Fathurrochman, I.; Hasan, H. Design of Morlet wavelet neural network to solve the non-linear influenza disease system. Appl. Math. Nonlinear Sci. 2022. ahead of print. [Google Scholar] [CrossRef]
  17. Yan, L.; Sabir, Z.; Ilhan, E.; Asif Zahoor Raja, M.; Gao, W.; Mehmet Baskonus, H. Design of a Computational Heuristic to Solve the Nonlinear Liénard Differential Model. Comput. Model. Eng. Sci. 2023, 136, 201–221. [Google Scholar] [CrossRef]
  18. Dubey, R.S.; Goswami, P.; Baskonus, H.M.; Gomati, A.T. On the existence and uniqueness analysis of fractional blood glucose-insulin minimal model. Int. J. Model. Simul. Sci. Comput. 2022, 2350008. [Google Scholar] [CrossRef]
  19. Veeresha, P.; Ilhan, E.; Prakasha, D.G.; Baskonus, H.M.; Gao, W. Regarding on the fractional mathematical model of Tumour invasion and metastasis. Comput. Model. Eng. Sci. 2021, 127, 1013–1036. [Google Scholar] [CrossRef]
  20. Sui, Y.; Cao, G.; Guo, T.; Li, Z.; Bai, Y.; Li, D.; Zhang, Z. Development of Gelled Acid System in High-Temperature Carbonate Reservoirs. J. Pet. Sci. Eng. 2022, 216, 110836. [Google Scholar] [CrossRef]
  21. Alhamad, L.; Alrashed, A.; Al Munif, E.; Miskimins, J. Organic Acids for Stimulation Purposes: A Review. SPE Prod. Oper. 2020, 35, 952–978. [Google Scholar] [CrossRef]
  22. Al-Douri, A.F. A New Organic Acid to Stimulate Deep Wells in Carbonate Reservoirs. Master’s Thesis, Texas A&M University, College Station, TX, USA, 2014. [Google Scholar]
  23. Wang, Q.; Zhou, F.; Zou, Y.; Yao, E. Study on the Performance of High-Temperature Resistant Cross-Linked Acid for Acid Fracturing of Tight Carbonate Reservoirs. In All Days; ARMA: Santa Fe, NM, USA, 2022; p. ARMA-2022-0318. [Google Scholar] [CrossRef]
  24. Avtar, S.P.; David, L.H. A New Stimulation Technique: High Strength Crosslinked Acid; Society of Petroleum Engineers; SPE Production & Operations: Richardson, TX, USA, 1980; pp. 49–68. [Google Scholar]
  25. Li, N.; Dai, J.; Liu, P.; Luo, Z.; Zhao, L. Experimental Study on Influencing Factors of Acid-Fracturing Effect for Carbonate Reservoirs. Petroleum 2015, 1, 146–153. [Google Scholar] [CrossRef] [Green Version]
  26. Buijse, M.; Maier, R.; Casero, A.; Fornasari, S. Successful High-Pressure/High-Temperature Acidizing with In-Situ Crosslinked Acid Diversion; Society of Petroleum Engineers; SPE Production & Operations: Richardson, TX, USA, 2000; pp. 803–810. [Google Scholar]
  27. Patil, P.; Sarda, A.; George, S.; Choudhary, Y.K.; Kalgaonkar, R. Non-Iron-Based Composition for In-Situ Crosslinked Gelled Acid System. In All Days; SPE: Doha, Qatar, 2012; p. SPE-156190-MS. [Google Scholar] [CrossRef]
  28. Wang, Z.; Fu, M.; Song, Q.; Wang, M.; Zhao, X.; Wang, Y. Preparation and Characteristic of Cross-linked Acid for High-temperature Acid Fracturing System of Deep Carbonate Reservoirs. Oilfield Chem. 2016, 33, 601–606. [Google Scholar]
  29. Fang, H.; Mou, J.; Wang, Y.; Li, C.; Luo, P. Development and evaluation of new high-temperature crosslinked acid. Fault-Block Oil Gas Field 2018, 25, 815–818. [Google Scholar]
  30. Mehrjoo, H.; Norouzi-Apourvari, S.; Jalalifar, H.; Shajari, M. Experimental Study and Modeling of Final Fracture Conductivity during Acid Fracturing. J. Pet. Sci. Eng. 2021, 208, 109192. [Google Scholar] [CrossRef]
  31. Chacon, O.G.; Pournik, M. Matrix Acidizing in Carbonate Formations. Processes 2022, 10, 174. [Google Scholar] [CrossRef]
  32. Wang, Y.; Zhou, F.; Zhang, Y.; Wang, Y.; Su, H.; Dong, R.; Wang, Q.; Bai, H. Numerical studies and analysis on reaction characteristics of limestone and dolomite in carbonate matrix acidizing. Geoenergy Sci. Eng. 2022, 222, 211452. [Google Scholar] [CrossRef]
  33. Zhang, L.; Zhou, F.; Mou, J.; Xu, G.; Zhang, S.; Li, Z. A New Method to Improve Long-Term Fracture Conductivity in Acid Fracturing under High Closure Stress. J. Pet. Sci. Eng. 2018, 171, 760–770. [Google Scholar] [CrossRef]
  34. Jiang, Q.; Yang, X.; Gong, F. Development and evaluation of high temperature resistant cross-linked acid fracturing fluid system. Chem. Ind. Eng. 2022, 39, 51–57. [Google Scholar] [CrossRef]
  35. Hu, J.; Chen, T.; Cheng, F.; Cheng, X.; Zhao, C. Preparation and Application of Hydrophobic Associating Crosslinking Acid Thickener. Oilfield Chem. 2020, 37, 403–408. [Google Scholar] [CrossRef]
  36. Pournik, M. Laboratory-Scale Fracture Conductivity Created by Acid Etching. Ph.D. Thesis, Texas A&M University, College Station, TX, USA, 2008. [Google Scholar]
Figure 1. Rock slab size diagram.
Processes 11 00722 g001
Figure 2. Haake Mars III rheometer.
Processes 11 00722 g002
Figure 3. Equipment for acid etching and conductivity test: (a) Rock slab acid etching device, (b) CT scanner, (c) Fracture conductivity test.
Processes 11 00722 g003
Figure 4. Viscosity–time curve of 20% cross-linked acid at 170 s−1 and 60 °C.
Processes 11 00722 g004
Figure 5. Viscosity test results of 20% cross-linked acid at different temperatures.
Processes 11 00722 g005
Figure 6. Relationship between viscosity of cross-linked acid and shear rate.
Processes 11 00722 g006
Figure 7. Mass of acid-etched rock slab.
Processes 11 00722 g007
Figure 8. Photos of the first group of rock slabs before and after reaction.
Processes 11 00722 g008
Figure 9. CT reconstruction of acid-etching morphology under different injection rates. (ac) represents the injection rate of 40, 50 and 60 mL/min.
Processes 11 00722 g009
Figure 10. CT reconstruction of acid-etching morphology under different acid concentrations. (a,b) represents the acid concentration of 15% and 10%.
Processes 11 00722 g010
Figure 11. Variation of conductivity with closure pressure at different injection rates.
Processes 11 00722 g011
Figure 12. Variation of conductivity with closure pressure at different acid concentrations.
Processes 11 00722 g012
Figure 13. Core inlet (left) and outlet (right) after damage.
Processes 11 00722 g013
Figure 14. Pressure difference curve before and after damage.
Processes 11 00722 g014
Figure 15. Core permeability in different treatment stages.
Processes 11 00722 g015
Figure 16. Core entrance observed by microscope.
Processes 11 00722 g016
Table 1. XRD mineral analysis results.
No.Mineral Contents (%)
QuartzCalciteDolomite
1-1#0.996.22.9
1-2#0.795.73.6
1-3#1.296.32.5
Table 2. Porosity and permeability analysis results.
No.Length
(cm)
Diameter
(cm)
Porosity
(%)
Permeability
(mD)
2-1#5.9792.50610.850.149
2-2#5.6892.5019.820.074
2-3#5.7142.50211.170.305
Table 3. Acid-etching experimental scheme.
Slab No.AcidInjection Rate
(mL/min)
Total Volume
(mL)
Width
(mm)
1#20% cross-linked acid4010002
2#20% cross-linked acid5010002
3#20% cross-linked acid6010002
4#15% cross-linked acid5010002
5#10% cross-linked acid5010002
Disclaimer/Publisher’s Note: The statements, opinions and data contained in all publications are solely those of the individual author(s) and contributor(s) and not of MDPI and/or the editor(s). MDPI and/or the editor(s) disclaim responsibility for any injury to people or property resulting from any ideas, methods, instructions or products referred to in the content.

