Article

Creep Characteristics and Creep Model of Coal Based on Pore Water Pressure

1
The Institute of Architectural Design and Research of Taiyuan University of Technology Corporation Limited, Taiyuan 030024, China
2
College of Mining Engineering, Taiyuan University of Technology, Taiyuan 030024, China
3
State Key Laboratory of Mining Response and Disaster Prevention and Control in Deep Coal Mines, Anhui University of Science and Technology, Huainan 232000, China
*
Author to whom correspondence should be addressed.
Processes 2023, 11(2), 638; https://doi.org/10.3390/pr11020638
Submission received: 30 January 2023 / Revised: 14 February 2023 / Accepted: 17 February 2023 / Published: 20 February 2023

Abstract

:
Anthracite in a specific area of Shanxi Province is the subject of this essay’s research. In the creep studies, different porosity intervals and pore water pressures were employed to evaluate the mechanical properties of creep under various test paths. The conventional Burges model was coupled in series with the nonlinear viscous elements and plastic elements. The key parameters in the equation are fitted, and a creep model is created to describe the nonlinear viscosity-elastic-plastic characteristics of coal under the influence of pore water pressure with varying porosities. The creep tests used varied porosity intervals, pore water pressures, and test paths to study the mechanical properties of creep. The conventional Burges model was coupled in series with the nonlinear viscous element and plastic element. To represent the nonlinear viscosity-elastic-plastic properties of coal under the effect of pore water pressure with variable porosities, the main parameters in the equation are fitted, and a creep model is developed. The results show that the porosity and strength of the coal sample are negatively correlated. In comparison to coal samples with a porosity of 5–10%, the uniaxial compressive strength of coal samples with a porosity of 10–15% and 15–20% reduced by 9.6% and 22.3%. Throughout the creep process, instantaneous strain rises with porosity, and changes in pore water pressure and porosity have an effect on instantaneous creep under low-stress loading, resulting in different creep curve starting strain values. The duration from stress loading to the accelerated creep stage in the failure stage and the time from the deceleration creep stage to the accelerated creep stage are both gradually shortened with an increase in porosity and pore water pressure. For regression analysis and parameter identification, a creep constitutive model was developed to describe the creep characteristics of coal samples with varying porosity under varying pore water pressure. The creep parameters of the new constitutive model were obtained, and they could very well reflect the creep characteristics of specimens with varying porosity intervals under the influence of pore water pressure.

1. Introduction

Until now, numerous academics both domestically and internationally have produced excellent results in experimental studies on the creep properties of coal and rock [1,2,3,4]. However, many research discoveries could not be effectively shared through engineering practise. There are two key reasons for this. First of all, the heterogeneous, inelastic, continuous, and anisotropic features of the coal rock mass cannot be concurrently incorporated into the theory that we have understood. Some scholars define coal rock mass as having the attributes of continuity in order to conduct pertinent research and then apply the findings to mining engineering practises in specific locations [5,6,7,8,9]. As science and technology improve, researchers and specialists are looking into additional ways to connect theory and practise in experimental research in order to make the environment as comparable to engineering as possible. The engineering community realised the value of the study of rock rheology tests after altering the experimental settings, and the research findings that can be applied in engineering practise have helped progress the theory of rock rheology and increase knowledge of rock rheology [10,11,12,13,14,15].
The whole “stress-strain” curve of the two types of rock when squeezed in one direction was obtained by many academics who conducted an experimental inquiry to establish the creep qualities of rocks such as sandstone and marble. Using the strain curve and data from the creep experiment, a constitutive model of rock creep was developed to explain the uniaxial creep process of marble and sandstone [16,17,18]. Numerous researchers constructed granite from the Three Gorges Dam’s foundation as a standard specimen, tested its uniaxial creep, and then collected it. The test findings demonstrated that even under conditions of high axial pressure and severe deformation, granite would exhibit some degree of creep deformation to research the mechanical characteristics of coal rock after being submerged in water [19,20]. Numerous researchers examined the mechanical characteristics of slate under various soaking times as well as the concept of slate under the influence of water softening. According to the test results, the water absorption of slate steadily decreased as soaking time increased, and slate has a noticeable softening impact early on. Numerous researchers examined the mechanical characteristics of slate under various soaking times as well as the concept of slate under the influence of water softening. According to the test results, the water absorption of slate steadily decreased as soaking time increased, and slate has a noticeable softening impact early on. The uniaxial compressive strength of SLATE progressively drops as water absorption rises, and its declining curve is compatible with the negative exponential function [21,22]. Many scholars conducted a short-term creep experiment on coal and rock mass and concluded that certain plastic failures would occur in the creep process [23,24]. A non-viscous body model is presented to replicate the accelerated creep process after extensive research on the accelerated creep process of coal rock mass and the original model. A novel creep model was established by introducing nonlinear Newtonian bodies based on Nishihara’s model after many researchers researched the nonlinear creep process of soft rock. By researching the faster soft rock creep process [25,26], many scholars improved the Nishihara Masao model and obtained a new model that could describe the creep process [27,28]. The strength of the coal pillar under long-term adverse conditions, particularly under long-term immersion in goaf water and the action of goaf water pressure, will differ from the long-term strength of the coal pillar under the natural state, and its creep characteristics are also quite different because of the complex occurrence conditions of coal [29,30,31,32,33,34]. When the mined-out water volume is large, the mined-out water pressure will form pore water pressure inside the coal pillar in the form of equivalent pressure. Firstly, pore water has a softening effect on the coal body. Secondly, pore water pressure will expand the pores or cracks inside the coal body, thus reducing the internal friction Angle and cohesion of the coal body, and further reducing the strength of the coal pillar. Therefore, by studying the creep characteristics of anthracite under the action of pore water pressure, this paper further reveals the creep law of coal and rock mass under the action of equivalent pore water pressure and enriches the content of coal and rock creep experimental research.
The anthracite used in this study serves as the examination object. The paper focuses on the negative characteristics of anthracite under the action of pore water tension using trial-and-error methods. It also examines and approves a model that gates the drag characteristics of anthracite with different porosities under the action of pore water pressure. Finally, it lays out another killjoy constitutive model that can depict sped-up creep regression and performs regression analysis on the anthracite.

2. Materials and Methods

2.1. Specimen Preparation

This paper selects anthracite as the experimental material and selects anthracite in Shanxi Province. Its main characteristics are hard black, metallic lustre, hardness, and density. Large anthracite samples are selected in the coal face and transported to the laboratory. The coal samples are taken by a line-cutting machine and processed into φ50 mm × 100 mm standard samples. The broken and relatively broken specimens are removed, and the generally broken specimens are polished to ensure that the prepared specimens meet the requirements: the upper and lower-end surface unevenness error is less than 0.02 mm. The error of non-parallelism is less than 0.005 mm, the end face is perpendicular to the axis of the sample, and the diameter error along the axis is less than 0.1 mm. The coal sample processing process is shown in Figure 1. The processed coal sample is shown in Figure 2.

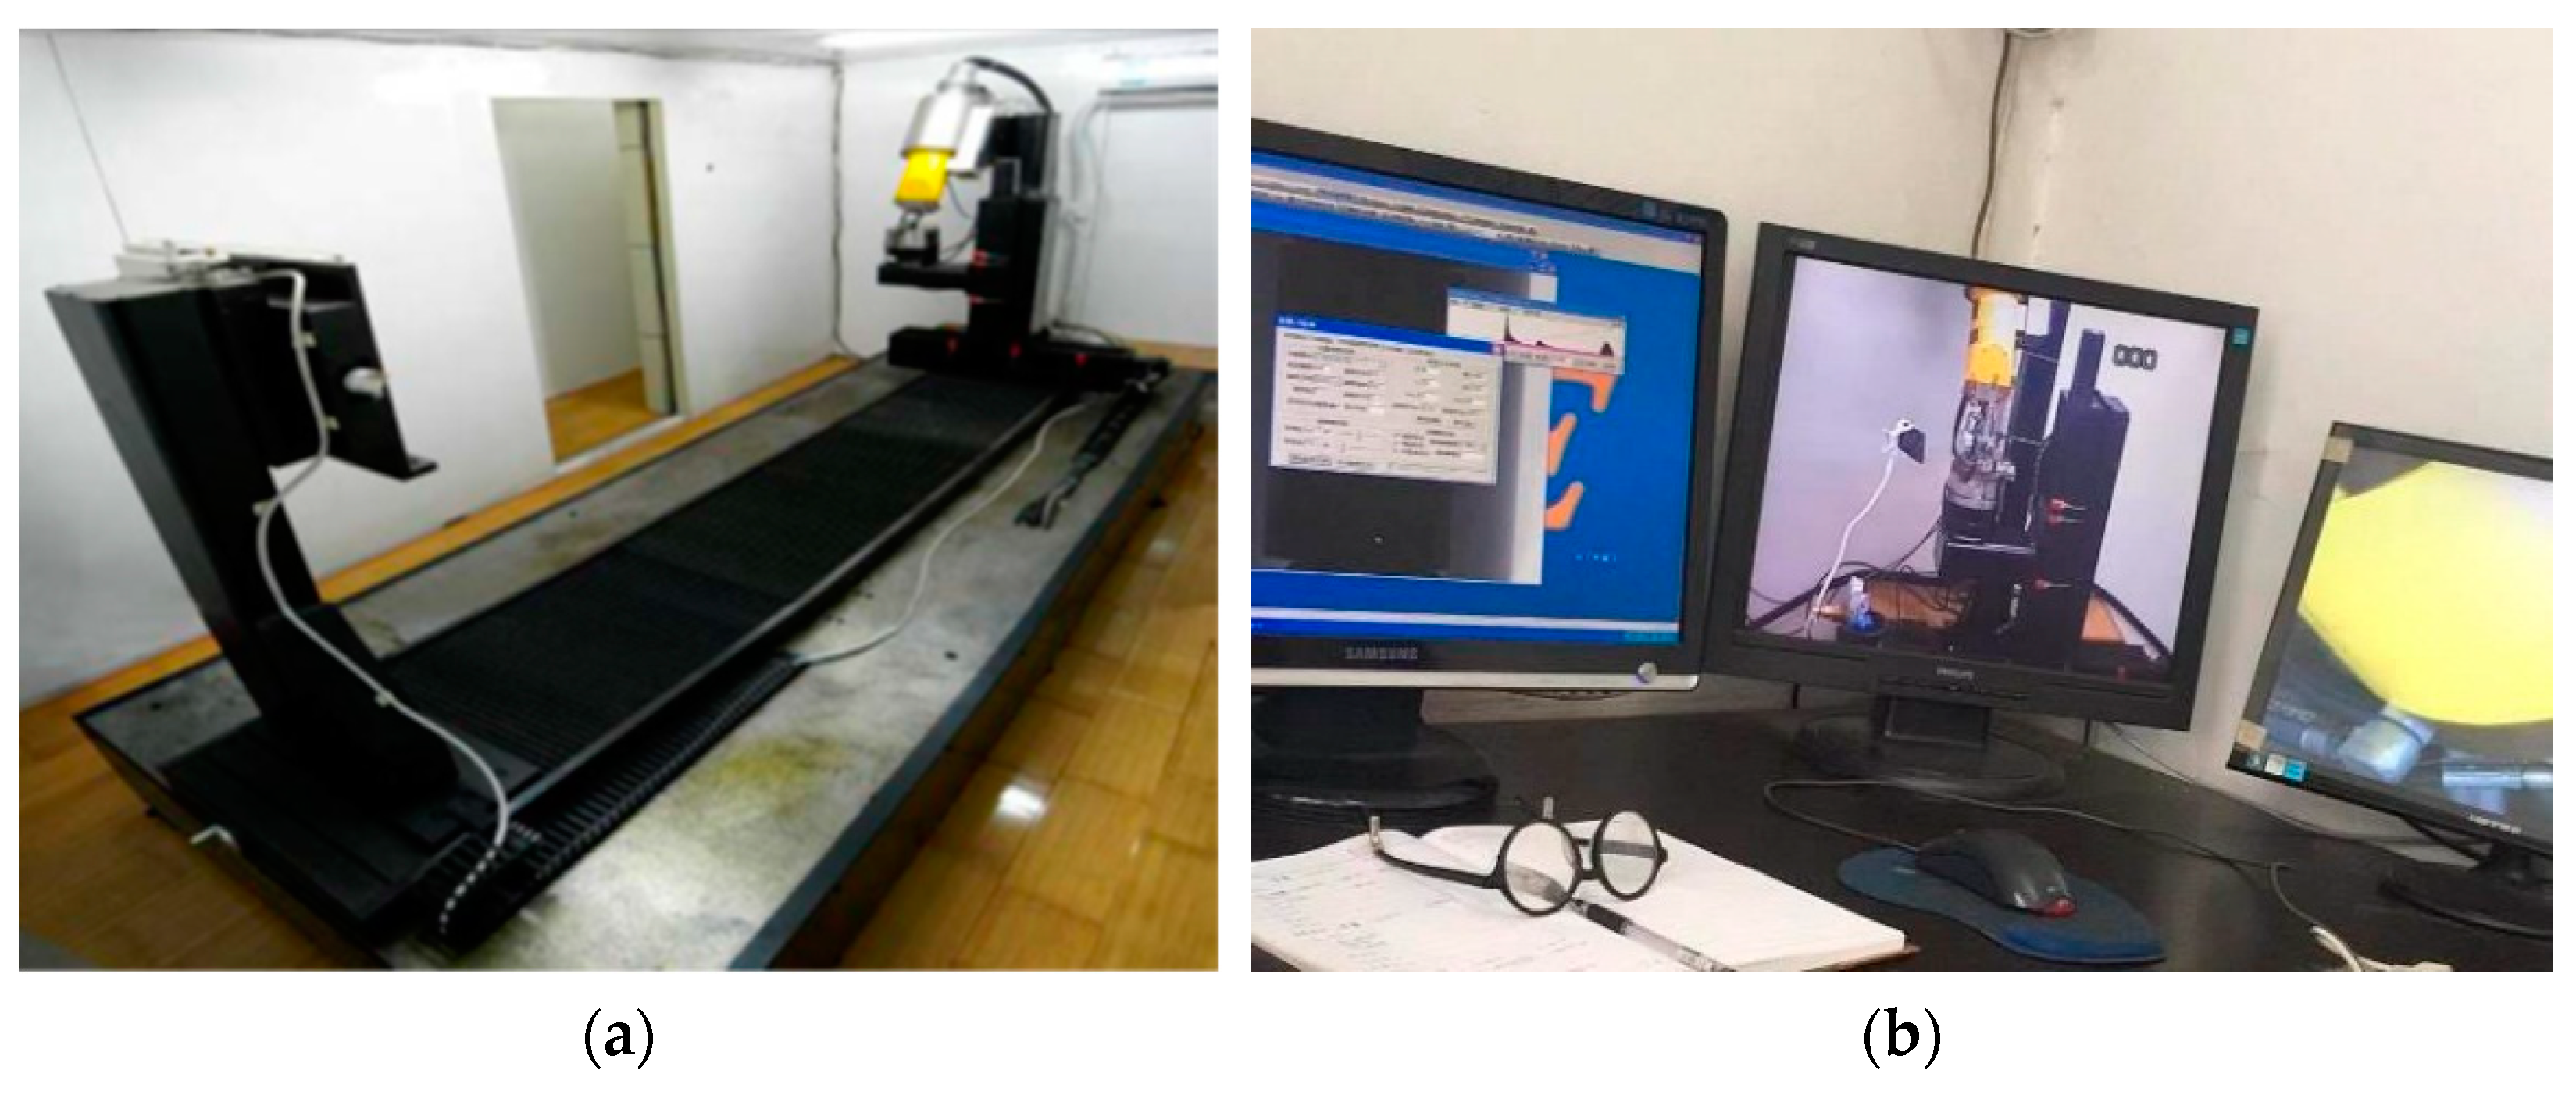
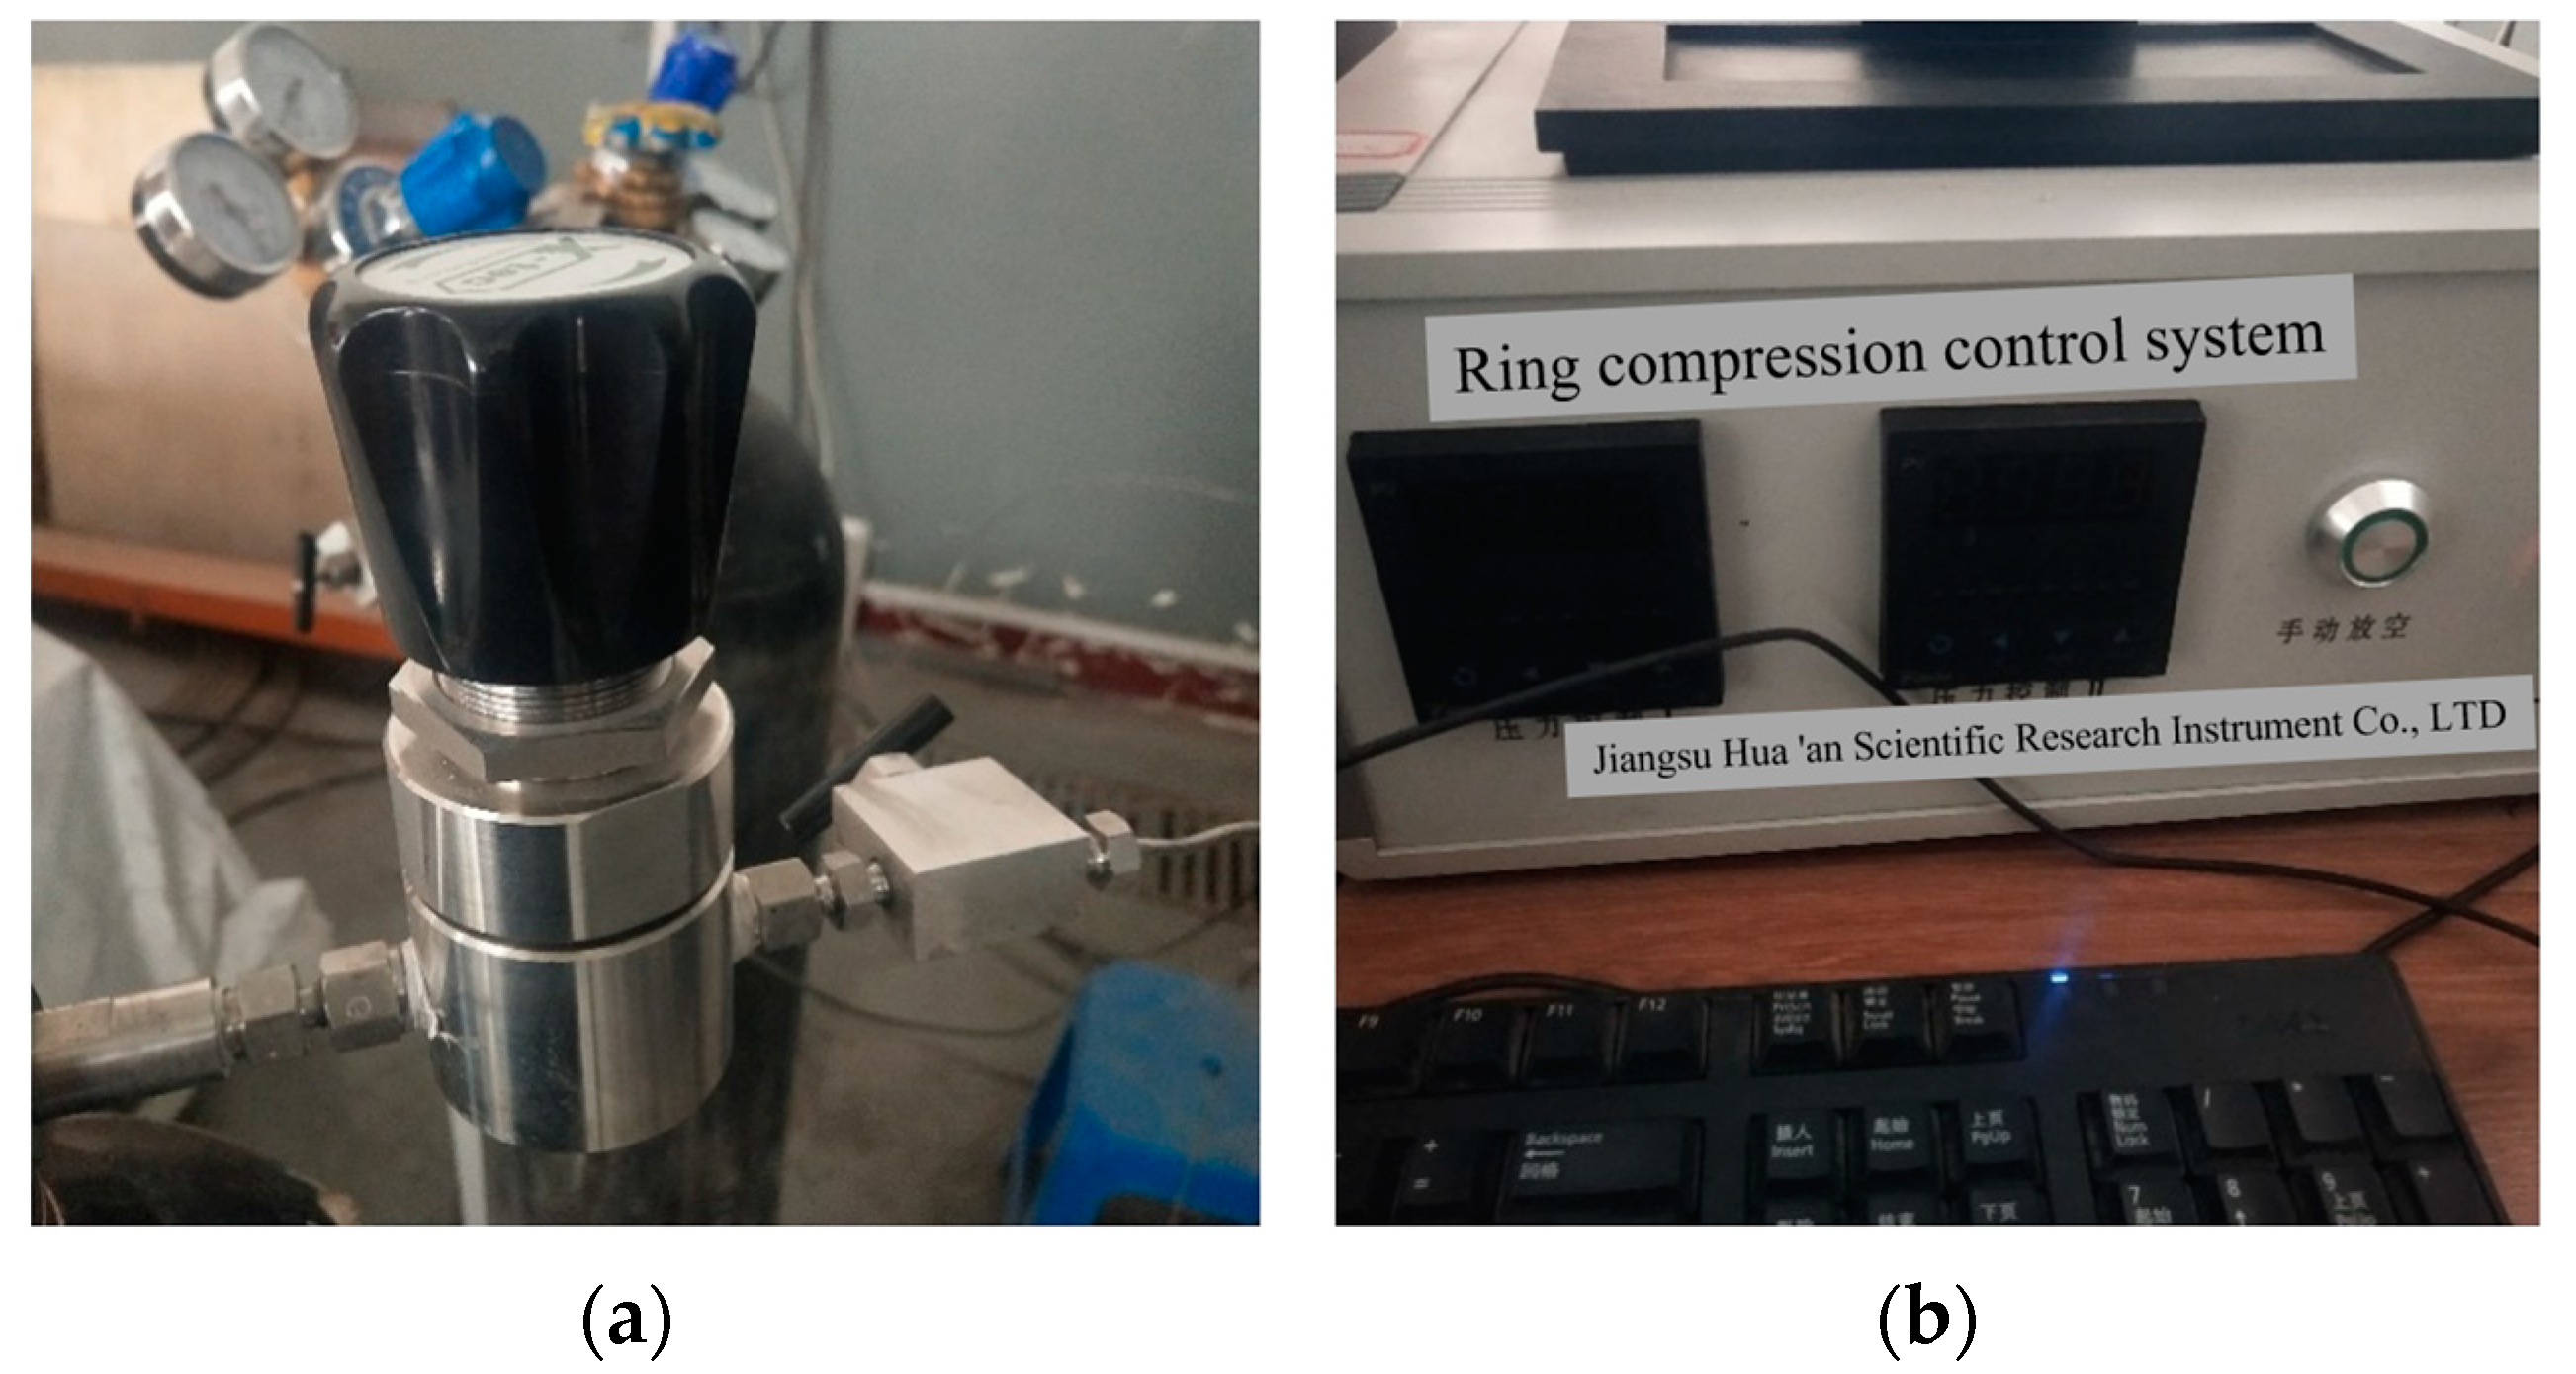
2.2. Testing Equipment

Porosity measurement based on CT scanning: CT scanning technology, computer-assisted X-ray object tomography, and stacking of each tomography image to obtain the entire image of the object are used. The computer CT reconstruction program is used to recreate each area after the scan data is acquired. To generate the CT reconstruction figure of the entire object following the reconstruction section, each section figure is overlaid. CT test system is shown in Figure 3.
Axial compression loading system: Figure 4 shows the axial compression loading system in the experimental device. The system is composed of a gas cylinder, precision pressure valve, pressure loading cylinder, pressure buffer container, and precision pressure regulator. When loading the axial pressure, first open the gas cylinder, adjust the precision pressure valve, pressure buffer container stamping, pressure loading cylinder by pressure loading began to load the axial stress, in the process of axial pressure loading slowly adjust the precision pressure valve, at the same time pay attention to the pressure parameters of the precision pressure regulator, until the pressure reaches the required test axial pressure, at this time stop adjusting the precision pressure valve, when the strain occurs in the specimen, Precision pressure valve will automatically punch the pressure buffer container to ensure the stability of axial stress. Figure 4 shows the axial compression loading system in the experimental device. The system is composed of a gas cylinder, precision pressure valve, pressure loading cylinder, pressure buffer container, and precision pressure regulator. When loading the axial pressure, first open the gas cylinder, adjust the precision pressure valve, pressure buffer container stamping, pressure loading cylinder by pressure loading began to load the axial stress, in the process of axial pressure loading slowly adjust the precision pressure valve, at the same time pay attention to the pressure parameters of the precision pressure regulator, until the pressure reaches the required test axial pressure, at this time stop adjusting the precision pressure valve, when the strain occurs in the specimen, Precision pressure valve will automatically punch the pressure buffer container to ensure the stability of axial stress.
Water pressure loading and stabilising system: Figure 5 shows the confining pressure stabilising system in the experimental device. The system also uses the idea of feedback regulation to realise automatic pressure when the reactor pressure is less than the set value, and automatic pressure relief when it is greater than the set value, to ensure the stability of the pressure in the reactor, to realise the long-term stability of the environment of the specimen, and the test data is accurate, stable and reliable. The system can control the confining pressure error within ±0.02 MPa.
Strain monitoring system: Figure 6 shows that the axial strain monitoring system is composed of a precision displacement sensor, a data conversion interface, and computer operating displacement monitoring software. The precision displacement sensor is fixed on the loading cylinder. When the axial stress is applied, the strain of the specimen can be reflected by the sliding momentum of the loading cylinder. After the displacement sensor detects the slip momentum of the loading cylinder, the data is transmitted to the data conversion interface, which transmits the displacement data to the displacement detection software run by the computer for real-time monitoring of specimen deformation. The device connection diagram is shown in Figure 7.

2.3. Test Methods

The pore water pressure loading mode: the pore water pressure of coal and rock mass mainly simulates the low-stress confining pressure of the coal pillar under the action of mined-out water, and the pore water pressure formed when mined-out water enters the coal and rock mass through pore cracks under the action of confining pressure. During the test, the coal rock specimen was first put into the reactor, and then the mine water taken from the site was added into the reactor, and the water surface is required to exceed the upper surface of the specimen. Then, the reactor is sealed and the external confining pressure control system is opened to load the air pressure into the reactor, and the air pressure acts on the water surface in the form of equivalent pressure, thus forming equivalent pore water pressure inside the coal rock mass. The loading mode of pore water pressure is shown in Figure 8.
Stress loading mode: The following tests are carried out in a hierarchical loading mode.
Testing program: Step 1: under the action of no pore water pressure, specimens with porosity intervals of 5–10%, 10–15%, and 10–20% in the creep experiment under uniaxial stepwise loading were tested.
Step 2: creep test under fractional loading is carried out under the action of pore water pressure of 0.5 MPa, 1.0 MPa, and 1.25 MPa, respectively.
Step 3: under the condition that the pore water pressure is determined to be 1.0 MPa, creep experiments are carried out under stepwise loading with porosity intervals of 5–10%, 10–15%, and 10–20%.
In the creep experiment under uniaxial fractional loading, the loading grade of specimens with different porosity levels is the same in the loading process, and the loading stress at each level is as follows: 2 MPa, 4 MPa, 6 MPa, 8 MPa, 10 MPa, etc., the loading rate is 0.1 MPa/s, and the creep time is 25 h. When the creep time is reached, the next stage of the creep process is entered until the failure test of the specimen is completed.

3. Analysis of Test Results

3.1. Creep Deformation Analysis under Different Conditions

Figure 9a illustrates the uniaxial creep process of specimens with various porosities and the various deformation rules that apply to the creep process of specimens with various porosity intervals. (1) The strain variable of various porosity interval samples in each loading grade steadily declined with the rise in loading grade during the entire creep process, and the instantaneous strain also gradually decreased with the increase in loading grade during the loading process. (2) The specimen’s immediate strain value is also impacted by porosity. The specimen with porosity intervals of 5–10%, 10–15%, and 15–20% has an instantaneous strain value of 2.2 × 10⁻³, 2.7 × 10⁻³, and 3.1 × 10⁻³, respectively. Its variable for instantaneous strain also steadily rises. This is mostly caused by the initial stage of stress loading; because there is porosity present, the pores gradually contract during stress loading. The distortion will be more visible the more porous the material is. (3) The specimen’s uniaxial compressive strength diminishes as porosity rises. As a result, the specimen’s loading grade decreases over the course of the loading operation. The specimen with a porosity interval of 5–10% and 10–15% will be damaged when loading to the fifth grade, and the specimen with a porosity interval of 15–20% will be damaged when loading to the fourth grade. (4) The strain variable of the specimens in this grade is smaller than that in the preceding grade throughout the process of graded loading of the three pore interval specimens, and the deformation gradually decreases with the loading of stress. The fact that the coal mass is porous, the support impact of the pores on the coal mass is minimal, and the skeleton deformation is relatively simple are the main causes of this. Therefore, the specimen with greater porosity experiences greater distortion during the early stages of creep. However, as the creep loading level increases, the specimen’s interior pores gradually contract, making it relatively less susceptible to deformation.
The creep characteristic curves of specimens in the same porosity interval at various pore water pressures are shown in Figure 9b. (1) The deceleration creep stage and stable creep stage occur at all stress levels of loading under the influence of varying pore water pressure, and the acceleration creep stage occurs at the last stress level at which the specimen is injured. The deformation of the specimen steadily reduces as the loading grade rises, which is the same as the law discovered by uniaxial creep studies on specimens with various porosities. (2) The instantaneous stress variables of the specimen are 2.2 × 10⁻³, 2.5 × 10⁻³, and 2.6 × 10⁻³, respectively, with the pore water pressure increasing from 0.5 MPa to 1.25 MPa, and their initial stress variables are lower than 2.7 × 10⁻³ of the specimen with porosity interval of 10–15% in the uniaxial creep experiment. Therefore, it can be concluded that the presence of pore water pressure somewhat lessens the creep effect of the specimen. The pore water pressure supports the pore fracture during the low-stress loading stage. The softening effect depends on the pore water pressure, and it gets stronger the higher the pore water pressure is. (3) The initial stress variable will be decreased when the pore water pressure rises from 0.5 MPa to 1.25 MPa; however, the opposite is also true. This is mostly because water is the source of the constricting pressure. Water intruded into the specimen through the pores during the confining pressure loading procedure, resulting in pore collapse and to some extent softening the specimen. The softening effect of water invasion becomes stronger with an increase in pore water pressure, and it is stronger than the supportive effect of pore water pressure on pores. (4) At the same porosity level, as the stress level rises, the coal rock specimen’s internal starting pores are crushed more closely, causing more internal damage to accumulate quickly, some of which is irreversible plastic deformation. As the stress level rises, the irreversible plastic deformation becomes more apparent, and the window for entering the stable creep stage gets smaller and smaller. The stable creep deformation of coal rock between different stress levels with an increase in stress levels after the coal rock pores have been compressed is mostly brought on by internal damage. When a lot of stress is applied continuously, a lot of new cracks are created in the coal rock, and the internal particles and cement materials separate, which causes a lot of dislocation between the internal particles, which causes a lot of deformation, and the coal rock transitions from a stable creep state to a non-stable state.
From the creep curves of specimens with different porosity under the effect of pore water pressure and the uniaxial creep test in Figure 9c, it could be seen that with the increase of pore water pressure, the instantaneous strain value of specimens in the creep process increases to a certain extent, indicating that the presence of pore water pressure has a softening effect on specimens, leading to a certain increase in the instantaneous strain value of specimens. In the uniaxial creep experiment, the instantaneous strain values of the specimen with the porosity interval of 5–10%, 10–15%, and 10–20% are 2.2 × 10⁻³, 2.7 × 10⁻³ and 3.1 × 10⁻³, respectively, while the instantaneous strain values under the pore water pressure are 2.5 × 10⁻³, 3.3 × 10⁻³ and 3.6 × 10⁻³, respectively. (2) In the case of applying pore water pressure, the law that the strain value gradually decreases with the increase of loading level does not change. (3) Compared with the uniaxial creep curve of specimens with different porosity under the effect of pore water pressure, the strain difference between the lower level and the upper level of the creep curve increases when the specimen reaches stable creep, which is mainly due to the effect of pore water pressure (the specimen is softened and the stress threshold for creep decreases, so the strain value of the specimen increases at the early stage of loading). However, with the accumulation of strain in the later stage of loading, the strain variable of the specimen decreases.

3.2. Creep Curve Analysis under Different Stress Levels

According to the creep deformation curves of specimens with different porosity at all levels of stress in Figure 10, the following is obtained:
(1)
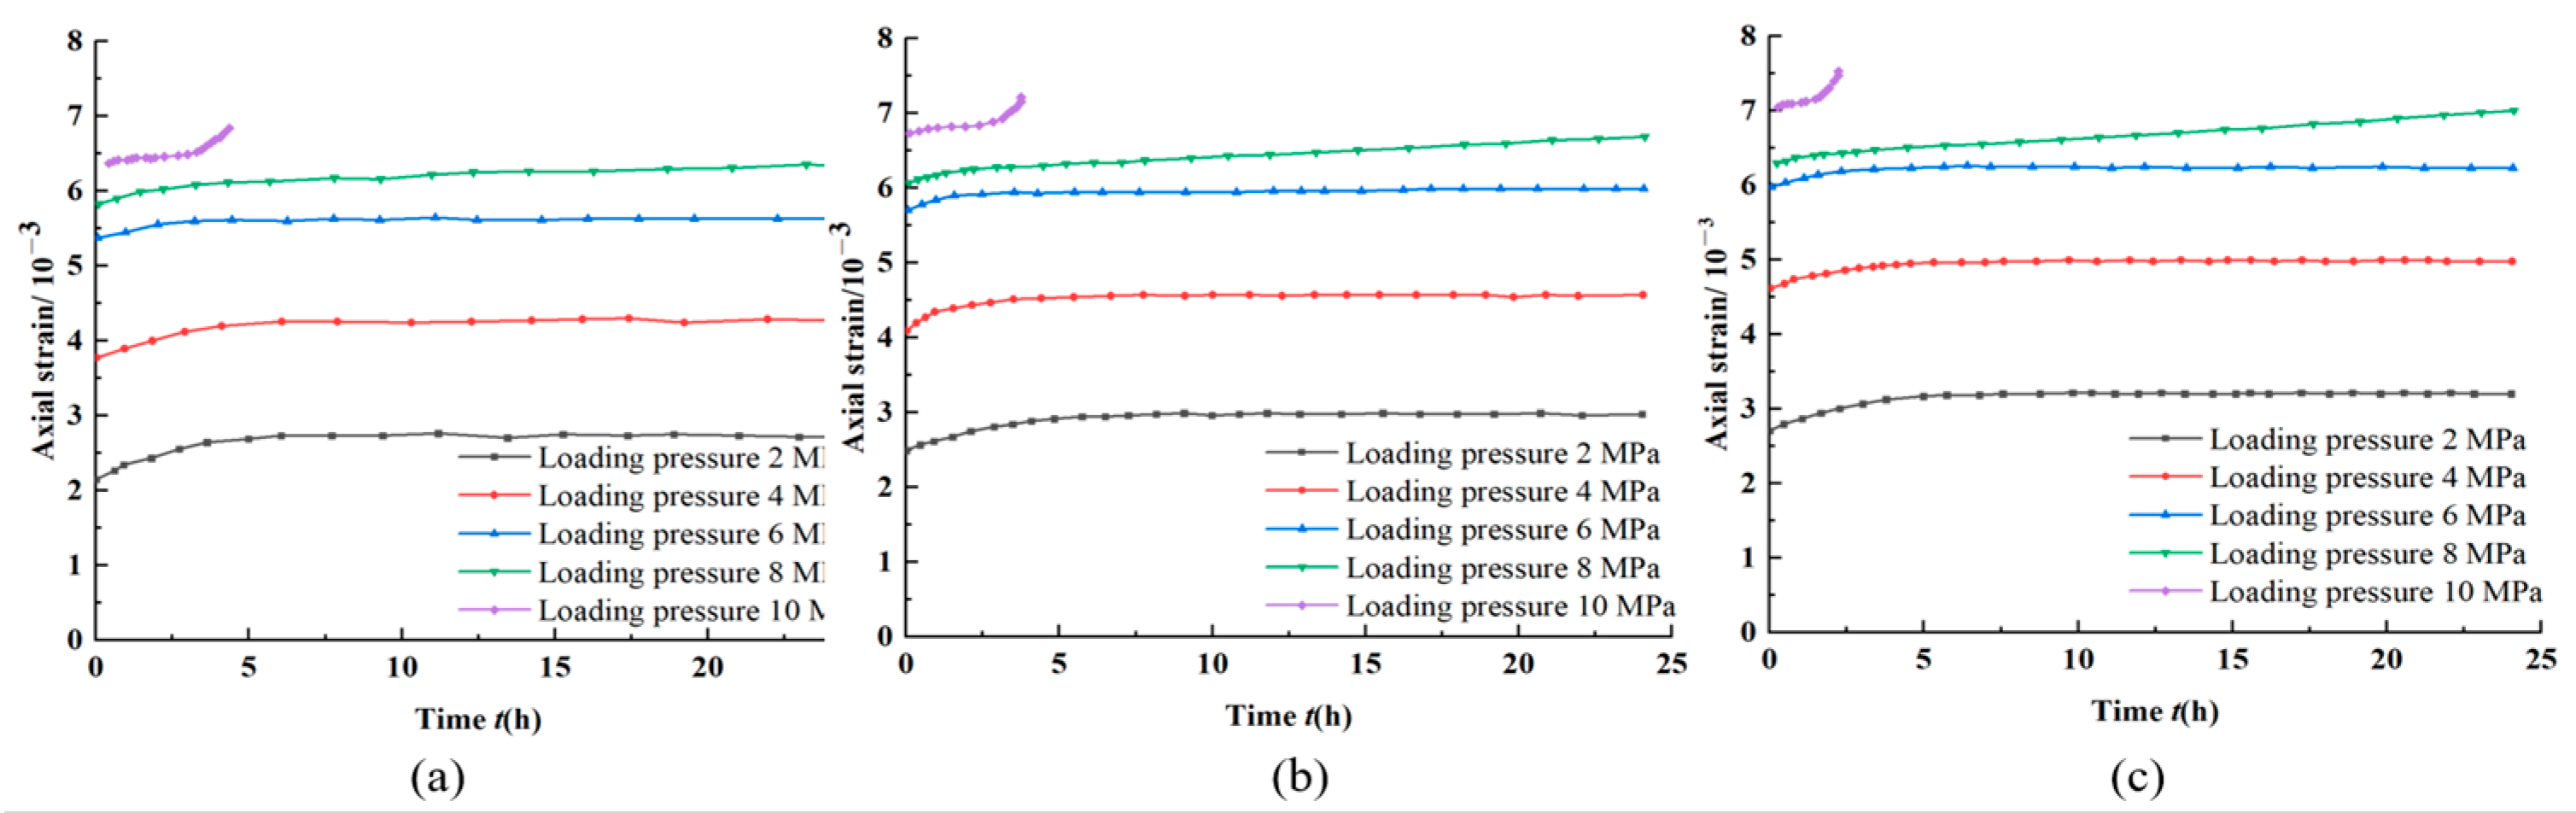
With the increase in stress (the increase in stress grading), the strain difference of specimens with different porosity intervals gradually decreased compared to the previous grading during stress loading. The strain value of the specimen ceased increasing at the start of the first stage of loading, and the total strain variable of the specimen was around 2.5 × 10⁻³, using the specimen with a porosity interval of 5–10% as an example. At the end of the second stage of loading, the total strain variable of the specimen was about 4.5 × 10⁻³. When the third stage of loading was completed, the value was about 5.7 × 10⁻³. The total strain difference of each grade was 2.0 × 10⁻³ and 1.2 × 10⁻³, respectively. In addition, the strain difference between other porosity interval samples is also consistent with this rule.
(2)
In the first, second, and third stage loading process, the deformation of the specimen with larger porosity is larger. The deformation of the specimen with porosity of 5~10%, 10~15%, and 15~20% in the first stage loading process is 0.4 × 10⁻³, 0.5 × 10⁻³, and 0.6 × 10⁻³, respectively. In the second graded loading operation, the deformation of the specimens with various porosities was 0.2 × 10⁻³, 0.3 × 10⁻³, and 0.4 × 10⁻³, respectively. After the first and second graded creep process was completed, the deformation of the specimens with different porosity had little relative change, and the specimens with smaller porosity had more grades. The specimens with porosity of 5–10%, 10–15%, and 15–20% were damaged in the fifth and fourth grades, respectively.
(3)
With an increase in loading grade, the duration of the deceleration creep stage of each grade gradually decreased for specimens with varying porosities. The porosity interval was 5–10%, and the duration of deceleration creep from the first to the fifth grade was 6 h, 4 h, 3 h, 2 h, and 1.2 h, respectively.
According to the creep deformation curves of different pore water pressure and the same porosity classification in Figure 11, it can be seen that (1) at all stress levels of loading, there are instantaneous creep stages, deceleration creep phases, and stable creep stages, and ultimately instantaneous failure occurs in specimens with considerable axial compression deformation. (2) The specimen gradually becomes less deformed as the loading grade rises. Additionally, as with the uniaxial creep experiment, the instantaneous strain variable of the specimen steadily decreases as the stress grade increases. The primary cause is that as the loading grade increases, the specimen gradually becomes compacted, making deformation difficult to occur.
Figure 12 shows the stress loading creep curves of specimens with different porosity at all levels under the same pore water pressure. Through the analysis of the test data, it is concluded that
(1)
With the increase in the porosity of the specimen, the instantaneous strain of the specimen gradually increases at the initial stress loading stage (the stress level is low). The porosity interval of the specimen is 5–10%, 10–15%, and 15–20%, respectively, and the instantaneous strain of the specimen is 2.5 × 10⁻³, 3.3 × 10⁻³, and 3.7 × 10⁻³ during the first-grade stress loading process, respectively.
(2)
The specimen’s distortion gradually reduces when the stress level is raised. Additionally, as with the uniaxial creep test procedure, the instantaneous stress variable of the specimen steadily decreases as the stress level rises. The fundamental cause is that as the force level is increased, the specimen gradually contracts, making deformation difficult to occur.
Before the failure of the specimen, there will be an instantaneous creep, deceleration creeps stage, and stable creep stage in each loading grade, which indicates that the stage before the creep failure of the specimen can be described by the commonly used five-element model of rock. However, it is necessary to introduce new components to describe the accelerated creep in the stage of specimen failure classification. A nonlinear creep model describing accelerated creep can be established to simulate the creep characteristics of coal and rock masses with different porosity under the action of pore water pressure.

3.3. Accelerated Creep Phase Analysis

The creep strain rate of coal rock refers to the strain speed of creep of coal rock per unit time, which can reflect four typical stages of coal rock, namely instantaneous creep stage, deceleration creeps stage, stable creep stage, and acceleration creep stage.
By calculating the curve slope of the strain curve with time, the relationship between the creep rate of the specimen and the specimen during the whole creep test can be determined. However, the creep curves of the uniaxial creep test, the effect of pore water pressure on creep characteristics, and the effect of porosity on creep characteristics studied in the previous study show the same curve characteristics under low-stress conditions. Therefore, the creep curves of the specimen in the loading failure stage are only studied here, and the creep velocity rate in the loading failure stage is analysed. The effect of porosity and pore water pressure on the condition of coal rock entering the accelerated creep stage is obtained.

3.3.1. Rate Analysis of Accelerated Creep Phase in a Uniaxial Creep Test

When specimens with different porosities are loaded with lower stress levels, the strain rates of creep curves at all levels exhibit two stages: the first is the deceleration creep stage, in which the strain rate gradually decreases at the initial low-stress loading stage, and the second is the stable creep stage, in which the strain rate tends to be stable after a period. This is evident from the analysis of the accelerated creep curve of specimens with the same porosity in Figure 13. The accelerated creep stage, however, in which the creep rate increased quickly in a short period, and the specimens’ deformation grew suddenly and swiftly, caused the specimens to fail when they were loaded to the failure threshold.
The strain rate analysis mainly concentrates on the creep rate of the accelerated creep stage with evident changes since the properties of the specimens in the lower stress loading stage are the same and the two stages previously described appear. In addition, the examination of the accelerated creep stage creep rate gives trustworthy data support for the creation of the creep model. Give instructions for choosing a creep model. So that the deformation characteristics of the creep acceleration phase can be better described by the suggested creep model.
It has been determined through rate analyses of the creep failure stages of specimens with various porosities that the porosity not only significantly affects the specimens’ strength but also significantly affects the creep rate of the accelerated creep stage. It is clear that when porosity increases, the law of the creep rate that is observed when the specimens approach the failure threshold varies significantly. The specimen’s creep rate curve for the porosity ranges of 5–10% and 10–15% reveals that when the specimen is loaded to the failure level, it first exhibits a primary creep stage with a reduced creep rate and then, at a certain degree of creep, it exhibits a stable creep stage with a constant creep rate. The creep rate then enters an exponentially increasing phase known as accelerated creep, which lasts until failure. The creep rate curve of the specimen with 15–20% porosity demonstrates that the initial loading stage also experiences the deceleration creep stage, during which the creep rate decreases, and that the inflection point then immediately transitions into the acceleration creep stage, during which the creep rate increases. The duration of the deceleration creep stage of the specimen with porosity of 5–10%, 10–15%, and 15–20% is 1.5 h, 1.0 h, and 0.5 h, respectively. Continuous specimens in the deceleration creep stage of the specimen gradually become shorter as porosity increases.

3.3.2. Effect of Porosity on Creep Rate under Pore Water Pressure

By analysing the acceleration phase of the creep test curve of the specimens with the same porosity interval under the action of different pore water pressure, the creep strain rate change curve of the specimens in the loading failure stage was obtained, and the influence law of pore water pressure on the accelerated creep stage of coal rock was obtained.
Figure 14 depicts the specimens’ accelerated creep curve under various pore water pressures. The accelerated creep rate of coal rock under pore water pressure is significantly influenced by the pore water pressure, and there are obvious differences in the creep rate during the creep failure stage, according to the analysis of the coal rock’s accelerated creep rate curve when loaded to the failing grade of the specimens. The period between the deceleration creep stage to the acceleration creep stage is shorter in the failure stage due to an increase in pore water pressure. When the pore water pressure is 0.5 MPa, it takes roughly 2 h from the start of loading in the failure stage to go from the deceleration creep stage to the acceleration creep stage. The transition from the failure stage loading to the accelerated creep stage takes around 1.7 h when the pore water pressure is 1 MPa. The transition from the failure stage loading to the accelerated creep stage takes roughly 0.7 h when the pore water pressure is 1.25 MPa. There is a deceleration creep stage in the failure stage under the influence of various pore water pressures, but unlike the uniaxial creep experiment, there is no steady-state creep stage (the creep rate is unchanged).

3.3.3. Effect of Porosity on Creep Rate

The creep loading failure stage is where porosity’s impact on creep rate is most noticeable. The creep rate law of various porosity samples is the same during the creeping stage with a lower loading level. The deceleration creep from the first loading stage to the stable stage of the specimen with a time creep rate of zero represents the creep rate in the early stage of creep with a low loading level. The specimen creep rate curves under the three porosity settings differ at the specimen failure stage.
The acceleration creep phase curves of specimens with different porosity are shown in Figure 15. Through the analysis of the creep rate curve of the specimens with different porosity in the loading failure stage, it is concluded that there are obvious differences in the creep curve of the specimens with different porosity in the loading failure stage of the coal rock specimens, and the effect of porosity on the accelerated creep stage of the coal rock specimens is more significant. With the increase in the porosity of the coal rock specimens, the time from the loading stage to the accelerated creep stage of the coal rock specimens is gradually shortened. For the samples with porosity intervals of 5–10%, 10–15%, and 15–20%, the time from loading to the accelerated creep phase in the failure stage was 1.25 h, 0.5 h, and 0.25 h, respectively.
The creep strain rate of coal rock under various situations was examined using the curve analysis of the specimen’s failure stage under various conditions. The failure stage of the specimens from the stress loading to the accelerated creep stage gradually reduced with a rise in porosity and pore water pressure, and the increase in porosity and pore water pressure had an impact on the specimen’s entrance time into the accelerated creep stage.

4. Creep Constitutive Model of Coal Rock under Pore Water Pressure

Through the laboratory creep test of anthracite, it is found that the specimens with different porosity will show nonlinear creep characteristics (accelerated creep stage) under the corresponding stress conditions. The combined model alone cannot express the accelerated creep phase and cannot match the creep characteristics in the experiment. Therefore, it is necessary to establish a model that can describe the accelerated creep phase.

4.1. Deformation Mechanism of Porous Media

Through the laboratory creep test of anthracite, it is found that the specimens with different porosity will show nonlinear creep characteristics (accelerated creep stage) under the corresponding stress conditions. The failure of rock is mainly due to the generation of new cracks in the rock under the action of load, and the expansion of the original cracks under the action of stress, resulting in the increasing ratio of internal cracks in the material, and finally the failure of the mutual penetration between the cracks. It can be concluded that the viscosity coefficient of the material will gradually decrease with the generation and expansion of the fracture in the creep process. When the fracture expands to a certain extent, the viscosity coefficient will decrease rapidly, and accelerated creep will occur until the failure occurs. The internal stress of the rock will gradually decrease with time under the condition of the same deformation rate, which is similar to the deformation described in non-Newtonian fluids. The combined model alone cannot express the accelerated creep phase and cannot match the creep characteristics in the experiment. Therefore, it is necessary to establish a model that can describe the accelerated creep phase.
For the anthracite introduced above, the same characteristics will also be realised in the creep process. However, the three basic elements commonly used in the combined model cannot accurately describe the essential characteristics of the anthracite creep process under the action of pore water pressure, so it is necessary to introduce new mechanical elements to describe it. Combined with the above analysis, the new component model is established as shown in Figure 16.
In the new component model, there is a smooth cylinder in the original component, and the cylinder is relatively backward due to friction, because the length of the piston is no longer considered, so the friction exists until the end. Because the rock strain value is not a variable that tends to infinity, failure will occur after a certain value, and there is no friction in the part where the piston is located. If this strain value is exceeded, the cohesion is zero and the rock becomes loose and scattered. Its viscosity coefficient is as follows:
η ( t ) = C η 0 A t 2 B t + C
A, B, and C are all constants, which are determined by the deformation properties of coal and rock mass, and B2–4 ac ≥ 0
d ε d t = σ η ( t ) = σ ( C η 0 A t 2 B t + C ) = σ ( A t 2 B t + C ) C η 0
The creep equation of this element is solved as,
ε ( t ) = σ η 0 ( A 3 C t 3 B 2 C t 2 + t )
In the formula, σ is the stress and η 0 is the rock viscosity parameters.

4.2. Creep Constitutive Models of Coal and Rock with Different Porosity under Pore Water Pressure

According to the creep test curve of anthracite under graded loading under pore water pressure, the instantaneous elastic strain is reflected in the curve at the beginning of stress loading, so the creep constitutive model must contain elastic elements (Hooking body), and then the creep curve reflects the obvious creep stage of building speed. Since the starting value of the slow creep stage is not zero, the initial value of the slow creep stage is not zero. To reflect this feature, a viscous element (Newtonian body) is connected in series in the creep model. To reflect the characteristics of the creep reaching stability and entering the steady-state creep stage in the model at the same time, a Kelvin body is connected in series in the model. When the creep enters the accelerated creep phase, the newly established components reflecting the accelerated creep phase are connected in parallel with the plastic components and then connected in series into the Burgers model. The new model is obtained by combining the new components with the Burgers model, as shown in Figure 17. The strength of the plastic element in the model is set as.
The following are the creep constitutive equations of the new creep model in 1D and 3D states.
In the one-dimensional state:
(1)
When the creep model is shown in Part I, the constitutive model will return to the Burger model, and the equation of the creep model is the following:
ε Ι ( t ) = σ 0 ( 1 E 1 + t η 1 ) + σ 0 E 2 ( 1 e E 2 η 2 t )
(2)
When part II is involved in the model, the model is the integration of part I and part II, and the equation of part II creep model is as follows:
ε ( t ) = σ 0 - σ s η 0 ( A 3 C t 3 B 2 C t 2 + t )
In this case, the overall creep model equation is given by
ε ( t ) = ε Ι ( t ) + ε ( t ) = σ 0 ( 1 E 1 + t η 1 ) + σ 0 E 2 ( 1 e E 2 η 2 t ) + σ 0 - σ s η 0 ( A 3 C t 3 B 2 C t 2 + t )
where E1 and E2 are the elastic moduli of the model; η 1 , η 2 ,   and   η 0 are the viscosity coefficients of the model.
In the three-dimensional state, the stress tensor can be decomposed into spherical stress tensor and deviatoric stress tensor.
σ m = 1 3 ( σ 11 + σ 22 + σ 33 ) = 1 3 σ kk
e ij = ε ij δ ij ε m = ε ij 1 3 δ ij ε kk
Let the shear modulus of the rock be G and the bulk modulus be K, then
G = E 2 ( 1 + v ) ,   K = E 3 ( 1 2 v )
where E and v represent the elastic modulus and Poisson’s ratio of the rock, respectively.
Combined with the creep model equation of coal rock under uniaxial stress, the creep model equation of coal rock under triaxial stress can be deduced. The creep model equation in the three-dimensional state is measured as
When σ < σs,
e ij ( t ) = ( S ij ) 0 ( 1 2 G 1 + t η 1 ) + ( S ij ) 0 2 G 2 ( 1 e G 2 η 2 t )
When σ ≥ σs,
e ij ( t ) = ( S ij ) 0 ( 1 2 G 1 + t η 1 ) + ( S ij ) 0 2 G 2 ( 1 e G 2 η 2 t ) + ( S ij ) 0 σ s η 0 ( A 3 C t 3 B 2 C t 2 + t )
is the constant deviatoric stress during the test, and the shear modulus of the model is the Newton viscosity coefficient in the Burgers model and is the initial Newton viscosity coefficient in the new model. The long-term strength of rock deviatoric stress can be determined by conventional experiments.
The main process of the rock creep test is to obtain the creep law of the specimen under pore water pressure from the relevant data obtained from the creep test and establish the applicable creep model and give the corresponding creep parameters according to the creep test law. At present, the method of obtaining the creep parameters mainly uses the method of test curve fitting.

4.3. Analysis of the Applicability of the New Model to Specimens with Specific Porosity

According to the coal rock classification chart, the average uniaxial compressive strength σ c of samples with a porosity interval of 10~15% is 8.5 MPa. The loading stress of the first grade (fourth grade) for creep failure of the specimen with a porosity interval of 10~15% under the action of 1 MPa pore water pressure is 8.0 MPa. That is, σ s = 8.0 MPa. After the fourth-grade loading, the accelerated creep time of coal and rock specimens is set as t, and the creep test curve shows that t = 3 h.
When the creep model of coal rock under the action of pore water pressure degenerates into the Burgers model, its one-dimensional constitutive equation is as follows:
ε ( t ) = σ ( 1 E m + t η m ) + σ E k ( 1 e E k η k t )
ε ( t ) = σ E 1 + σ E 2 + σ η 1 t σ E 2 e E 2 η 2 t
Let P 1 = σ E 1 ,   P 2 = σ E 2 ,   P 3 = σ η 1 ,   P 4 = E 2 η 2 , and then the above formula can be simplified as
y = P 1 + P 2 + P 3 x P 2 e x P 4
where y represents ε and x represents t.
Using the function of Origin custom function, the strain-time relationship of the Burgers model shown in the equation was fitted with the test data, and the parameters of the constitutive model were obtained.
First, the parameters of the creep constitutive equation were fitted for the first three stress levels. Table 1 and Table 2 show the fitting parameters and creep parameters obtained.
When σ > σ s , the creep model under the action of pore water pressure includes the accelerated creep stage model, so the one-dimensional constitutive equation is as follows:
ε ( t ) = σ ( 1 E 1 + t η 1 ) + σ E 2 ( 1 e E 2 η 2 t ) + σ - σ s η 0 ( A 3 C t 3 B 2 C t 2 + t )
ε ( t ) = σ E 1 + σ E 2 + σ η 1 t σ E 2 e E 2 η 2 t + σ - σ s η 0 ( A 3 C t 3 B 2 C t 2 + t )
Let P 1 = σ E m ,   P 2 = σ E k ,   P 3 = σ η 1 ,   P 4 = E 2 η 2 ,   P 5 = σ - σ s η 0 ,   P 6 = A ,   P 7 = B ,   P 8 = C .
The relevant parameters obtained are shown in Table 3.
The creep parameters including the accelerated creep stage are obtained by fitting the parameter formula 16 above. The relevant parameters obtained are shown in Table 4.
As shown in the tables, the correlation coefficients of parameter identification of the creep equation are all greater than 0.96 after parameter fitting. The correlation coefficients of model parameters under different loading levels under pore water pressure are all close to one, indicating that the model can well describe the creep characteristics of coal rock mass under pore water pressure, according to the above identification results under different parameters. The obtained parameters were used to fit curves at each stage, as shown in Figure 18. Through the analysis of the fitted curve, the following conclusions can be drawn:
(1)
According to the observation of the curves, the specimens with porosity interval of 10~15% are nearly identical with the curves of the test data under the three stress loading levels of 2 MPa, 4 MPa, and 6 MPa, indicating that the model can well describe the creep characteristics of coal mass.
(2)
By analysing the fitting parameters of the model under the first three loading levels, it is found that the correlation coefficients of model parameter identification under the first three loading levels are all above 0.99, which verifies the correctness of the model at this stage and shows that the model can well describe the creep characteristics of coal samples with porosity interval of 10~15%.
(3)
When the loading stress reaches 8 MPa, with the increase of creep time, the coal and rock specimens transition from the deceleration creep stage at the beginning of loading to accelerated creep after 3 h. The fitting curve is consistent with the test curve when the stress is loaded to 8 MPa (the fourth stage loading), indicating that the established creep model can accurately describe the accelerated creep process of the specimen.
(4)
(It can be seen from Figure 15 and Figure 16 that the fitting curves of coal and rock specimens with porosity intervals of 5–10% and 15–20% are almost identical with the creep curves under different loading stages of the test, indicating that the theoretical values of the creep equation derived from the creep model are consistent with the data obtained from the test.
(5)
According to the tables, the correlation of coal creep parameters identification is strong, with all values greater than 0.93. When applied to different grades in different porosity intervals, the fitting accuracy is high, and the correlation coefficients of model parameters are close to one, indicating that the model is applicable to coal samples of varying porosity.
In summary, the model uses the data obtained from the coal rock test with pore intervals of 5–10%, 10–15%, and 15–20%, respectively, for parameter identification, and the identification correlation coefficients are all above 0.93, which verifies the rationality of the model. It can be concluded that this model can well reflect the creep characteristics of specimens with different porosity intervals under the action of pore water pressure.

5. Conclusions

The research object in this paper is anthracite, and the basic data was obtained through laboratory experiments using the results of uniaxial creep tests on specimens with varying porosity intervals. In order to determine the accelerated creep laws for various scenarios, the results of creep tests performed on specimens with varying pore water pressure and porosity intervals are compared to those of uniaxial creep tests. Regression analysis is used to develop and validate a model that accurately represents the creep properties. The following are the outcomes:
(1)
It is obvious how porosity influences a specimen’s strength. As porosity increases, specimen strength gradually decreases. When the porosity of specimens increases from 5–10% to 10–15% and 15–20%, the uniaxial compressive strength decreases by 9.6% and 22.3%, respectively.
(2)
Porosity has an impact on the instantaneous strain value of specific materials, according to a uniaxial creep test. For samples with porosity ranges of 5–10%, 10–15%, and 15–20%, the corresponding instantaneous strain values are 2.2 × 10⁻³, 2.7 × 10⁻³, and 3.1 × 10⁻³, respectively. It is possible to conclude that as porosity increases, so does the instantaneous strain of species in different porosity intervals. This is primarily due to the fact that the pores of the specimen gradually become compact during the initial stress loading, and the greater the porosity, the more pronounced the deformation. However, as the loading stage increased, the compression phenomenon subsided.
(3)
At all stress loading levels, there are deceleration creep stages, steady creep stages, and accelerated creep stages at the last stress level where failure happens. Additionally, when the loading grading increases, the deformation of the specimens gradually reduces, just as it did in the uniaxial creep experiment with specimens of various porosities.
(4)
With increased porosity and pore water pressure, the time for specimens to enter the accelerated creep stage of stress loading in the failure stage is gradually shortened. The time for specimens to enter the accelerated creep stage from the deceleration creep stage is also shortened, according to the analysis of the creep rate in the accelerated creep stage under various conditions.
(5)
To more accurately represent the accelerated creep stage, a new mechanical component is added to the conventional Newtonian body. The creep constitutive model, which can accurately represent the creep characteristics of coal samples with variable pore water pressure and porosity, is developed in sequence with the traditional Burgers model. After performing a regression analysis and determining the parameters of the creep model, the creep parameters for the new constitutive model are acquired. The application of the model is confirmed, and it is found that the model accurately depicts the creep characteristics of specimens in different porosity zones under pore water pressure.

Author Contributions

Data curation: F.Z.; Funding acquisition: S.H.; Resources: D.Z. All authors have read and agreed to the published version of the manuscript.

Funding

This research was supported by the China Scholarship Council (Nos.202108340064).

Data Availability Statement

Not applicable.

Conflicts of Interest

The authors declare no conflict of interest.

References

  1. Yang, H.W.; Xu, J.; Peng, S.J.; Nie, W. Study of sandstone creep characteristics under stepwise loading pore water pressures. Rock Soil Mech. 2015, 36, 365–370. (In Chinese) [Google Scholar]
  2. Huang, P.; Zhang, J.X.; Damascene, N.J.; Dong, C.W.; Wang, Z.J. A fractional order viscoelastic-plastic creep model for coal sample considering initial damage accumulation. Alex. Eng. J. 2021, 60, 3921–3930. [Google Scholar] [CrossRef]
  3. Huang, P.; Zhang, J.X.; Spearing, A.J.S.; Chai, J.; Dong, C.W. Experimental study of the creep properties of coal considering initial damage. Int. J. Rock Mech. Min. Sci. 2021, 139, 1365–1609. [Google Scholar] [CrossRef]
  4. Zhang, T.J.; Ling, Z.Q.; Pang, M.K.; Meng, Y.K. Experimental Study of Creep Acoustic Emission Characteristics of Coal Bodies around Boreholes under Different Moisture Contents. Energies 2021, 14, 3103. [Google Scholar] [CrossRef]
  5. Liu, D.Y.; Jiang, H.F.; Li, D.S.; Zhao, Y.B. Creep properties of rock under high confining pressure and high water pore pressure. J. Cent. South Univ. 2014, 45, 1916–1923. (In Chinese) [Google Scholar]
  6. Song, J.F.; Lu, C.P.; Zhan, Z.W.; Cui, H.F.; Wang, Y.P.; Wang, J.H. Numerical and Field Investigations of Acoustic Emission Laws of Coal Fracture under Hydro-Mechanical Coupling Loading. Materials 2022, 15, 6510. [Google Scholar] [CrossRef]
  7. Ma, H.F.; Wang, L.J.; Niu, X.G.; Yao, F.F.; Zhang, K.X.; Chang, J.C.; Li, Y.M.; Li, C.M.; Hu, Z.X. Mechanical Characteristics of Coal and Rock in Mining under Thermal-Hydraulic-Mechanical Coupling and Dynamic Disaster Control. Math. Probl. Eng. 2021, 2021, 9991425. [Google Scholar] [CrossRef]
  8. Jie, J.; Wang, D.; Suo, Z.; Xu, Y.; Xu, S.F. Study on direct coal liquefaction residue influence on mechanical properties of flexible pavement. Int. J. Pavement Res. Technol. 2018, 11, 355–362. [Google Scholar] [CrossRef]
  9. Chen, M.; Hosking, L.J.; Sandford, R.J.; Thomas, H.R. Dual porosity modeling of the coupled mechanical response of coal to gas flow and adsorption. Int. J. Coal Geol. 2019, 205, 115–125. [Google Scholar] [CrossRef] [Green Version]
  10. Zhang, Z.L.; Xu, W.Y.; Wang, W. Triaxial creep tests of rock from the compressive zone of dam foundation in Xiangjiaba Hydropower Station. Int. J. Rock Mech. Min. Sci. 2012, 50, 133–139. [Google Scholar] [CrossRef]
  11. Yuan, Y.; Liu, Z.H.; Zhu, C.; Yuan, C.F.; Wang, S.Z. The effect of burnt rock on inclined shaft in shallow coal seam and its control technology. Energy Sci. Eng. 2019, 7, 1882–1895. [Google Scholar] [CrossRef]
  12. Danesh, N.N.; Chen, Z.W.; Connell, L.D.; Connell, L.D.; Kizil, M.S.; Pan, Z.; Aminossadati, S.M. Characterisation of creep in coal and its impact on permeability: An experimental study. Int. J. Coal Geol. 2017, 173, 200–211. [Google Scholar] [CrossRef] [Green Version]
  13. Chen, W.Z.; Lu, C.; Yu, H.D.; Li, F.F.; Lei, J.; Ma, Y.S.; Li, H.H. Progress in long-term mechanical properties of clay rocks under thermo-hydro-mechanical coupling conditions. Chin. J. Rock Mech. Eng. 2021, 40, 233–247. (In Chinese) [Google Scholar]
  14. Yuan, Y.; Zuo, L.; Chen, Z.S.; Meng, G.C.; Yan, C.L.; Gong, Z.X. Improvement of coalbed methane recovery rate by carbon dioxide phase transition blast fracturing. Energy Sources Part A Recovery Util. Environ. Eff. 2022, 44, 3659–3672. [Google Scholar] [CrossRef]
  15. Huang, X.W.; Guo, J.; Li, K.Q.; Wang, Z.Z.; Wang, W. Predicting the thermal conductivity of unsaturated soils considering wetting behavior: A meso-scale study. Int. J. Heat Mass Transf. 2023, 204, 123853. [Google Scholar] [CrossRef]
  16. Zhou, R.H.; Cheng, H.; Cai, H.B.; Wang, X.J.; Guo, L.H. Creep characteristics and creep model of siltstone under triaxial compression and graded unloading. Chin. J. Rock Mech. Eng. 2022, 41, 1136–1147. [Google Scholar]
  17. Jiang, Y.Z.; Zhang, M.M.; Li, L.Q. Study on Nonlinear Viscoelasto-plastic Creep Model of Rock And Its Parameter Identification. Chin. J. Rock Mech. Eng. 2008, 27, 832–839. (In Chinese) [Google Scholar]
  18. Shu, Z.L.; Liu, B.X.; Huang, S.; Wei, Y.H.; Zhao, B.Y. Nonlinear viscoelasto-plastic creep model of soft rock and its parameters identification. J. Min. Saf. Eng. 2017, 34, 803–809. (In Chinese) [Google Scholar]
  19. Li, B.; Liu, C.W.; Xie, H.; Liu, D.F.; Wang, C.; Zhou, J.L. Experimental Study on the Creep Characteristics of Sandstone Under Water Pressure Environment. Adv. Eng. Sci. 2017, 49, 119–124. (In Chinese) [Google Scholar]
  20. Hu, X.J.; Bian, K.; Liu, J.; Li, B.Y.; Chen, M. Discrete element simulation study on the influence of microstructure heterogeneity on the creep characteristics of granite. Chin. J. Rock Mech. Eng. 2019, 38, 2069–2083. (In Chinese) [Google Scholar]
  21. Zhang, Q.Y.; Zhang, L.Y.; Xiang, W.; Jiang, L.Y.; Ding, Y.Z. Triaxial creep test of gneissic granite considering thermal effect. Rock Soil Mech. 2017, 38, 2507–2514. (In Chinese) [Google Scholar]
  22. Zhou, C.Y.; Deng, Y.M.; Tan, X.S.; Liu, Z.Q.; Shang, W.; Zhan, S. Experimental Research on The softening of Mechanical Properties of saturated soft rocks and application. Chin. J. Rock Mech. Eng. 2005, 24, 33–38. (In Chinese) [Google Scholar]
  23. Jiang, Y.Z.; Wang, B.; Wang, R.H.; Lu, B.; Li, C.; Zhu, J.B. Study on viscoelastic-plastic creep model of rock based on strain yield threshold. J. Yangtze River Sci. Res. Inst. 2017, 34, 89–95. (In Chinese) [Google Scholar]
  24. Sha, Z.H.; Pu, H.; Li, M.; Cao, L.L.; Liu, D.; Ni, H.Y.; Lu, J.F. Experimental study on the creep characteristics of coal measures sandstone under seepage action. Processes 2018, 6, 110. [Google Scholar] [CrossRef] [Green Version]
  25. Kang, J.H.; Zhou, F.B.; Liu, C.; Liu, Y.K. A fractional non-linear creep model for coal considering damage effect and experimental validation. Int. J. Non-Linear Mech. 2015, 76, 20–28. [Google Scholar] [CrossRef]
  26. Li, X.B.; Liu, X.S.; Tan, Y.L.; Ma, Q.; Wu, B.Y.; Wang, H.L. Creep constitutive model and numerical realization of coal-rock combination deteriorated by immersion. Minerals 2022, 12, 292. [Google Scholar] [CrossRef]
  27. Yang, S.Q.; Xu, P.; Ranjith, P.G. Damage model of coal under creep and triaxial compression. Int. J. Rock Mech. Min. Sci. 2015, 80, 337–345. [Google Scholar] [CrossRef]
  28. Du, F.; Wang, K.; Zhang, X.; Xin, C.P.; Shu, L.Y.; Wang, G.D. Experimental Study of Coal–Gas Outburst: Insights from Coal–Rock Structure, Gas Pressure and Adsorptivity. Nat. Resour. Res. 2020, 29, 2481–2493. [Google Scholar] [CrossRef]
  29. Sun, Q.; Li, B.; Cai, C.; Xia, Y.J. Creep properties of geopolymer cemented coal gangue-fly ash backfill under dynamic disturbance. Constr. Build. Mater. 2018, 191, 644–654. [Google Scholar] [CrossRef]
  30. Xue, D.J.; Zhou, J.; Liu, Y.T.; Gao, L. On the excavation-induced stress drop in damaged coal considering a coupled yield and failure criterion. Int. J. Coal Sci. Technol. 2020, 7, 58–67. [Google Scholar] [CrossRef] [Green Version]
  31. Tu, Q.Y.; Cheng, Y.P.; Xue, S.; Ren, T.; Cheng, X. Energy-limiting factor for coal and gas outburst occurrence in intact coal seam. Int. J. Min. Sci. Technol. 2021, 31, 729–742. [Google Scholar] [CrossRef]
  32. Zhang, Z.; Guo, Q.; Liu, W. Evaluation of Long-Term Tightness of the Coal Pillar Dam of Underground Reservoir and Protection Countermeasures. Energies 2022, 15, 7229. [Google Scholar] [CrossRef]
  33. Huang, X.; Yao, Z.; Cai, H.; Li, X.; Chen, H. Performance evaluation of coaxial borehole heat exchangers considering ground non-uniformity based on analytical solutions. Int. J. Therm. Sci. 2021, 170, 107162. [Google Scholar] [CrossRef]
  34. Guo, Y.; Zheng, X.G.; Guo, G.Y.; Zhao, Q.F.; Zhou, W.; An, T.L. Study on deformation failure and control of surrounding rock in soft rock roadway in close range coal seam with overhead mining. J. Min. Saf. Eng. 2018, 35, 1142–1149. [Google Scholar]
Figure 1. Yarn Cutting Machine (a) Fixed coal sample; (b) Sample take-up.
Processes 11 00638 g001
Figure 2. Prepared coal samples.
Processes 11 00638 g002
Figure 3. CT Test System. (a) CT scanner; (b) Data acquisition and processing system.
Processes 11 00638 g003
Figure 4. Axial loading system (a) Place coal sample; (b) Precision pressure valve.
Processes 11 00638 g004
Figure 5. Axial compression loading system. (a) Confining pressure regulating valve; (b) Confining pressure controller.
Processes 11 00638 g005
Figure 6. Strain monitoring system (a) Place coal sample; (b) Strain collection.
Processes 11 00638 g006
Figure 7. Schematic diagram of device connection.
Processes 11 00638 g007
Figure 8. Schematic diagram of pore pressure loading mode.
Processes 11 00638 g008
Figure 9. Creep deformation curves under different conditions. (a) Deformation curves of different porosity without water pressure; (b) Porosity deformation curve of different pore water pressure; (c) Deformation curves of different porosity under pore water pressure.
Processes 11 00638 g009
Figure 10. Creep deformation curves at different porosity levels. (a) The porosity interval is 5~10%; (b) the porosity interval is 10~15%; (c) the porosity interval is 15~20%.
Processes 11 00638 g010
Figure 11. Creep deformation curves of different pore water pressure and the same porosity classification; (a) the pore water pressure is 0.5 MPa; (b) the pore water pressure is 1.0 MPa; (c) the pore water pressure is 1.25 MPa.
Processes 11 00638 g011
Figure 12. Creep deformation curves of different porosity grades under the same pore water pressure; (a) the porosity interval is 5~10%; (b) the porosity interval is 10~15%; (c) the porosity interval is 15~20%.
Processes 11 00638 g012
Figure 13. The curve of the accelerated creep stage of specimens with different porosity. (a) The porosity interval is 5~10%; (b) the porosity interval is 10~15%; (c) the porosity interval is 15~20%.
Processes 11 00638 g013
Figure 14. Curve of accelerated creep stage under different pore pressure; (a) Pore water pressure 0.5 MPa; (b) Pore water pressure 1.0 MPa; (c) Pore water pressure 1.25 MPa.
Processes 11 00638 g014
Figure 15. Curve of accelerated creep stage of specimens with different porosity; (a) Poriness 5~10%; (b) Poriness 10~15%; (c) Poriness 15~20%.
Processes 11 00638 g015
Figure 16. Creating a new component model.
Processes 11 00638 g016
Figure 17. New creep model of coal and rock.
Processes 11 00638 g017
Figure 18. Fitting curves of 10–15% in each stage of pore interval. (a) First stage; (b) Second stage; (c) Third stage; (d) Fourth stage; (e) Fifth stage.
Processes 11 00638 g018
Table 1. Fitting parameters under the first four stress levels.
σ P 1 P 2 P 3 P 4 R2
20.00130.00183.98 × 10−77.0130.9903
40.00320.00262.25 × 10−712.9850.9985
60.00650.00351.26 × 10−718.9760.9632
80.00830.00439.85 × 10−719.5340.9565
Table 2. Creep parameters under the first four stress grades.
σ E1E2 η1 η2R2
21538.461111.115.03 × 106158.440.9335
412501538.461.78 × 107118.480.9658
6923.071714.294.76 × 10790.340.9532
8963.851860.478.12 × 10795.240.9415
Table 3. Fitting parameters under the fifth stress.
P 1 P 2 P 3 P 4 P 5 P 6 P 7 P 8 R2
0.0524.12 × 10−30.35215.32156.320.0529.3250.1280.9403
Table 4. Creep parameters under the fifth stress grade.
E1E2η1η2η0ABCR2
192.312427.1828.41965.87734.280.00265.180.030.9512
Disclaimer/Publisher’s Note: The statements, opinions and data contained in all publications are solely those of the individual author(s) and contributor(s) and not of MDPI and/or the editor(s). MDPI and/or the editor(s) disclaim responsibility for any injury to people or property resulting from any ideas, methods, instructions or products referred to in the content.

