Article

Modeling Vehicle Insurance Adoption by Automobile Owners: A Hybrid Random Forest Classifier Approach

1
Department of Finance, College of Administrative and Financial Sciences, Saudi Electronic University, Riyadh 13316, Saudi Arabia
2
Department of Applied Informatics, Silesian University of Technology, 44-100 Gliwice, Poland
3
Department of Management Studies, NIT Hamirpur, Hamirpur 177005, India
4
School of Engineering & IT, UNSW Canberra at ADFA, Canberra, ACT 2610, Australia
5
Capability Associates, Canberra, ACT 2610, Australia
*
Author to whom correspondence should be addressed.
Processes 2023, 11(2), 629; https://doi.org/10.3390/pr11020629
Submission received: 9 January 2023 / Revised: 12 February 2023 / Accepted: 13 February 2023 / Published: 18 February 2023
(This article belongs to the Special Issue Advances in Intelligent Manufacturing Systems and Process Control)

Abstract

:
This study presents a novel hybrid framework combining feature selection, oversampling, and machine learning (ML) to improve the prediction performance of vehicle insurance. The framework addresses the class imbalance problem in binary classification tasks by employing principal component analysis for feature selection, the synthetic minority oversampling technique for oversampling, and the random forest ML classifier for prediction. The results demonstrate that the proposed hybrid framework outperforms the conventional approach and achieves better accuracy. The purpose of this study is to provide insurance managers and practitioners with novel insights into how to improve prediction accuracy and decrease financial risks for the insurance industry.

1. Introduction

The global insurance sector has seen continuous growth, with insurance premiums rising by 2.9% in 2019. The vehicle insurance market is expected to grow at a CAGR of 5.03% by 2024 [1], making it a crucial component of the economy. Vehicle insurance provides financial protection against damage or injury caused by traffic accidents and also protects against theft and other damage [2]. Specific terms, conditions and requirements of automobile insurance differ from region to region based on local laws and regulations [3]. For example, some regions may require certain minimum levels of coverage, while others may have specific rules about which types of vehicles can be insured. It is important for vehicle owners to familiarize themselves with the specific terms and conditions of their insurance policy.
In the insurance industry, the two most important factors are the risk of claim and the contracted premium that acts as the source of expenditure and profit [2]. The risk of claim—that is, the likelihood that a policyholder will make a claim for coverage—is a key determinant in setting the premium. The premium—the amount that the policyholder pays in exchange for insurance coverage—provides the insurance company with a source of revenue. This revenue is used to cover the costs of administering the policy and to generate profit for the company [3]. The balance between the risk of claim and the contracted premium is crucial for the insurance industry, as it ensures that insurance companies remain financially viable while providing coverage to policyholders. If the risk of claim is too high, it can result in substantial losses for the insurance company, while a low premium can result in inadequate revenue to cover costs and generate profit.
However, the insurance industry faces a challenge in estimating the expected cost of insurance contracts and targeting the right prospects. Any insurance contract is considered best when the contract sustains both insurance provider and consumer interests and simultaneously offers the most appropriate insurance to customers [4]. An insurance company’s primary issue in providing appropriate insurance policies is to estimate the expected cost of the insurance contracts. Targeting the right prospect is very important in the insurance sector because contact between the insurer and consumer is rare, and consumers perceive insurance “mostly as a necessary evil” [5].
Technology has played a significant role in the vehicle insurance industry through the integration of automation and machine learning (ML). Traditionally, the process of predicting customer adoption of vehicle insurance is manual and can depend on the profile of the insurance holder and a number of other factors. Manual prediction requires significant human expertise and time, which is not feasible for a large number of users. In such cases, advanced techniques are required for rapid and accurate prediction [6]. Such approaches include ML, which can process large volumes of data and make accurate predictions compared with traditional approaches. ML algorithms automatically learn relationships among given data and make predictions based on learned relations, which means that they perform better than the earlier manual paradigm [7]. For instance, the success of ML has been driven by massive amounts of data, inexpensive data storage, and powerful processing [8], which enable industries to develop robust ML models to analyse big and intricate data simultaneously, delivering quicker and more useful results on broad scales [9]. ML tools equip organizations to pinpoint moneymaking opportunities and potential instability more quickly [10], so new techniques in ML are progressing swiftly and have extended the application of ML to nearly every field [11,12]. Industries that need to inspect a considerable amount of data efficiently and make accurate predictions have moved towards ML as the best way to build a model, make strategies, and plan [12].
The vehicle insurance sector of the insurance industry faces an issue of class imbalance in binary classification tasks, where one class has a disproportionate number of examples compared to the other. However, there has been limited research based on ML in the vehicle insurance domain, and the problem of class imbalance has not yet been explored. Feature selection and dimension reduction are essential steps in an ML-based problem [13], as it involves feature selection approaches through which the number of features can be reduced by retaining as much information as possible from the original dataset [14]. In other words, dimensionality reduction involves transforming data of higher dimensions into a lower dimensional subspace while minimizing information loss. Thus, this research aims to address the class imbalance problem in vehicle insurance by proposing a framework that consists of two steps: feature selection and imbalance handling. Importantly, when working with imbalanced datasets, many ML techniques ignore the imbalance, resulting in poor performance for the minority class [15,16]. This type of model is not useful in real-world scenarios since models are then biased towards one class, leading to misinformation. As a result, the current study uses principal component analysis (PCA) for feature selection and the synthetic minority over-sampling technique (SMOTE) for imbalance handling [17]. The proposed hybrid framework is evaluated using a dataset of customer adoption of vehicle insurance.
The research gap in the field of vehicle insurance lies in the lack of attention paid to the class imbalance problem. The research questions addressed in this study are: (1) How effective is the proposed framework in addressing the class imbalance problem in vehicle insurance? (2) How does the proposed framework compare with traditional approaches in terms of accuracy and efficiency? The research objectives are to: (1) propose a framework for class imbalance handling in vehicle insurance, (2) evaluate the effectiveness of the proposed framework, and (3) compare the proposed framework with traditional approaches.
This study makes two significant methodological contributions.
  • First, we combined PCA and SMOTE with an ML technique (random forest) and proposed a framework that significantly improves the prediction performance as compared with a conventional classifier. In doing so, we utilized PCA to perform feature selection to identify the essential features for enhancing accuracy. Additionally, we employed SMOTE to address the class imbalance in vehicle insurance by generating synthetic examples for the underrepresented minority class.
  • Secondly, we propose the random forest classifier for prediction, developing a hybrid random forest classifier that produces high accuracy.
In summary, this study aims to improve ML-based vehicle insurance prediction accuracy by proposing a novel framework involving feature selection using PCA, addressing the class imbalance problem using SMOTE, and prediction using a random forest classifier. Consequently, this proposed hybrid approach is called PS-RandomForest.

2. Literature Review

Customer adoption of vehicle insurance is a complex phenomenon that depends on various factors, such as the company’s insurance policies. As such, the nature of the company’s policies plays a crucial role in determining the level of customer interest. For instance, a company that offers comprehensive coverage and competitive rates is likely to attract more customers compared to a company that offers limited coverage and higher rates. On the other hand, customer interest in vehicle insurance can be influenced by factors such as driving experience, financial stability, and the likelihood of accidents.
Despite the significance of customer adoption of vehicle insurance, the literature on predicting customer adoption of vehicle insurance using ML is limited. Most studies in this area have focused on traditional statistical methods, such as regression analysis, rather than advanced ML techniques, such as deep learning or reinforcement learning. This is partly due to the lack of large, high-quality datasets that are necessary for training ML models. However, some preliminary ML techniques such as association rules, classification, and clustering are employed in distinct insurance domains to predict the product recommendation, premium rate, and insurance claim, forecast the chances and quantity of loss (risk), and detect insurance claim fraud [18,19]. For example, Weerasinghe et al. [18] compared ML methods to predict a policyholder’s claim size, comparing three ML methods, namely neural networks, decision trees, and logistic regression and concluding that the neural network had the best performance. Similarly, a study was conducted by Smith et al. [19], who employed decision trees and neural network techniques to forecast whether the insurance holder would file a claim or not.
Additionally, predicting customer adoption of vehicle insurance is a challenging task due to the complex and dynamic nature of customer behavior. Despite these challenges, the use of ML techniques in predicting customer adoption of vehicle insurance has the potential to provide valuable insights into customer behavior and help insurance companies better understand the factors that influence customer adoption.
In recent years, there has been a growing interest in using ML algorithms for predicting customer decisions in the car insurance industry. For instance, Thakur et al. [20] conducted a comparative study of a decision tree and a Bayesian classifier for online vehicle prediction. Their findings showed that the decision tree algorithm outperformed the Bayesian classifier in terms of accuracy and efficiency. However, this study only addressed the performance comparison of two algorithms and did not consider the imbalanced class issue. Similarly, Pesantez-Narvaez et al. [21] conducted a comparison between logistic regression and XGBoost for motor insurance claim prediction using telematics data. The results indicated that logistic regression was a better option due to its better understandability and adequate forecasting capacity. The study also noted that a tuning procedure may be necessary to optimize the results from XGBoost. However, as in the previous study, this study also did not address the imbalanced class issue in vehicle insurance prediction.
Neumann et al. [22] conducted a study on the ML-based prediction of customer decisions in car insurance, comparing decision trees, perceptrons, AdaBoost, logistic regression, and gradient boosting, along with feature engineering. The study demonstrated the importance of ML in the car insurance industry.
Khalili-Damghani et al. [23] proposed a dual-stage clustering-classification technique for advising appropriate insurance coverage for insurance holders. During the first stage, data were pre-processed, and insurance holders were clustered based on their records of insurance coverage. The Davies–Bouldin metric was used to choose a clustering algorithm. In the second stage, feature selection methods were used, and the selected feature was input into a K-nearest neighbor classification algorithm. The study showed that the model could suggest suitable insurance coverage based on customer characteristics.
Bian et al. [24] proposed a new driver risk classification classifier that examines the driver’s risk level based on in-car sensor data. Their main objective was to improve the classification accuracy of risk levels and offer improved performance and usability. The authors developed a behavior-centric vehicle insurance pricing model (BVIP), which helped in calculating the premium for a vehicle. The results showed that the prototype attained good performance in terms of effectiveness and usability and improved the accuracy of the risk level classification.
Wu et al. [25] explored the use of data-mining techniques such as KDD/DM for the examination of decision rules to examine the potential customers for new and current insurance products. The authors reported that these techniques are useful in identifying the latent customers who could be interested in availing themselves of insurance services.
Kim et al. [26] proposed a framework for evaluating customer value and clustering customers based on their value. The framework first evaluates the customer value and then clusters them based on their characteristics. The authors used a decision tree for mining the characteristics of customers and found that this method was effective in clustering customers based on their value.
Kuo et al. [27] designed a mining framework that first segments the data and then applies association mining rules for customer clustering. The authors used an ant system-based clustering algorithm (ASCA) and ant K-means (AK) to cluster the database. The results showed that the ant colony system-based association rules mining algorithm was employed effectively to find the useful order for each customer group.
With this backdrop, the above studies highlight the potential of ML algorithms and data-mining techniques in predicting customer decisions in the car insurance industry. Although different ML algorithms have different strengths and weaknesses, choosing the appropriate algorithm depends on the specific needs of the problem. Further research is needed to optimize the results and enhance the performance of these algorithms.
The current study presents a novel framework to address the research gap in vehicle insurance prediction by addressing the imbalanced class issue. The proposed framework also employs feature selection techniques to select important features, which is a crucial step in improving the accuracy and efficiency of the prediction models. The current study aims to contribute to the literature by addressing the imbalanced class issue and providing a comprehensive framework for vehicle insurance prediction.

3. Method

This study introduces a novel framework to alleviate the imbalanced class issue in vehicle insurance prediction. The first step in the framework utilizes PCA, a feature selection technique to select essential features, and SMOTE to solve the class imbalance problem in the dataset. The second step uses the random forest classifier for prediction. As compared to random forest classifiers, the proposed framework yields higher accuracy. The section discusses the vehicle insurance prediction problem in detail, and the combination of PCA, SMOTE, and random forest is proposed.

3.1. Predicting Customer’s Adoption of Vehicle Insurance

The goal of vehicle insurance is to predict whether a customer will adopt vehicle insurance, knowing some knowledge about the customer. Let us assume that X is a collection of samples xi, which represents all information of the i-th customer, and let Y = {0, 1} be the achievable output class, with 0, 1 being categorical values that represent ‘customer does not adopt vehicle insurance’ and ‘customer adopts vehicle insurance’, respectively. Then, vehicle insurance adoption forecasting seeks the probability pair-up:
(Pr (Y = 0|X = xi), Pr (Y = 1|X = xi))
where every probability is accommodated by a probability classifier after being fitted to X. In practice, we only care about the second value in the pair-up, which is the probability of the i-th customer adopting the vehicle insurance. This does not result in any loss in generality because there are only two possible output classes.

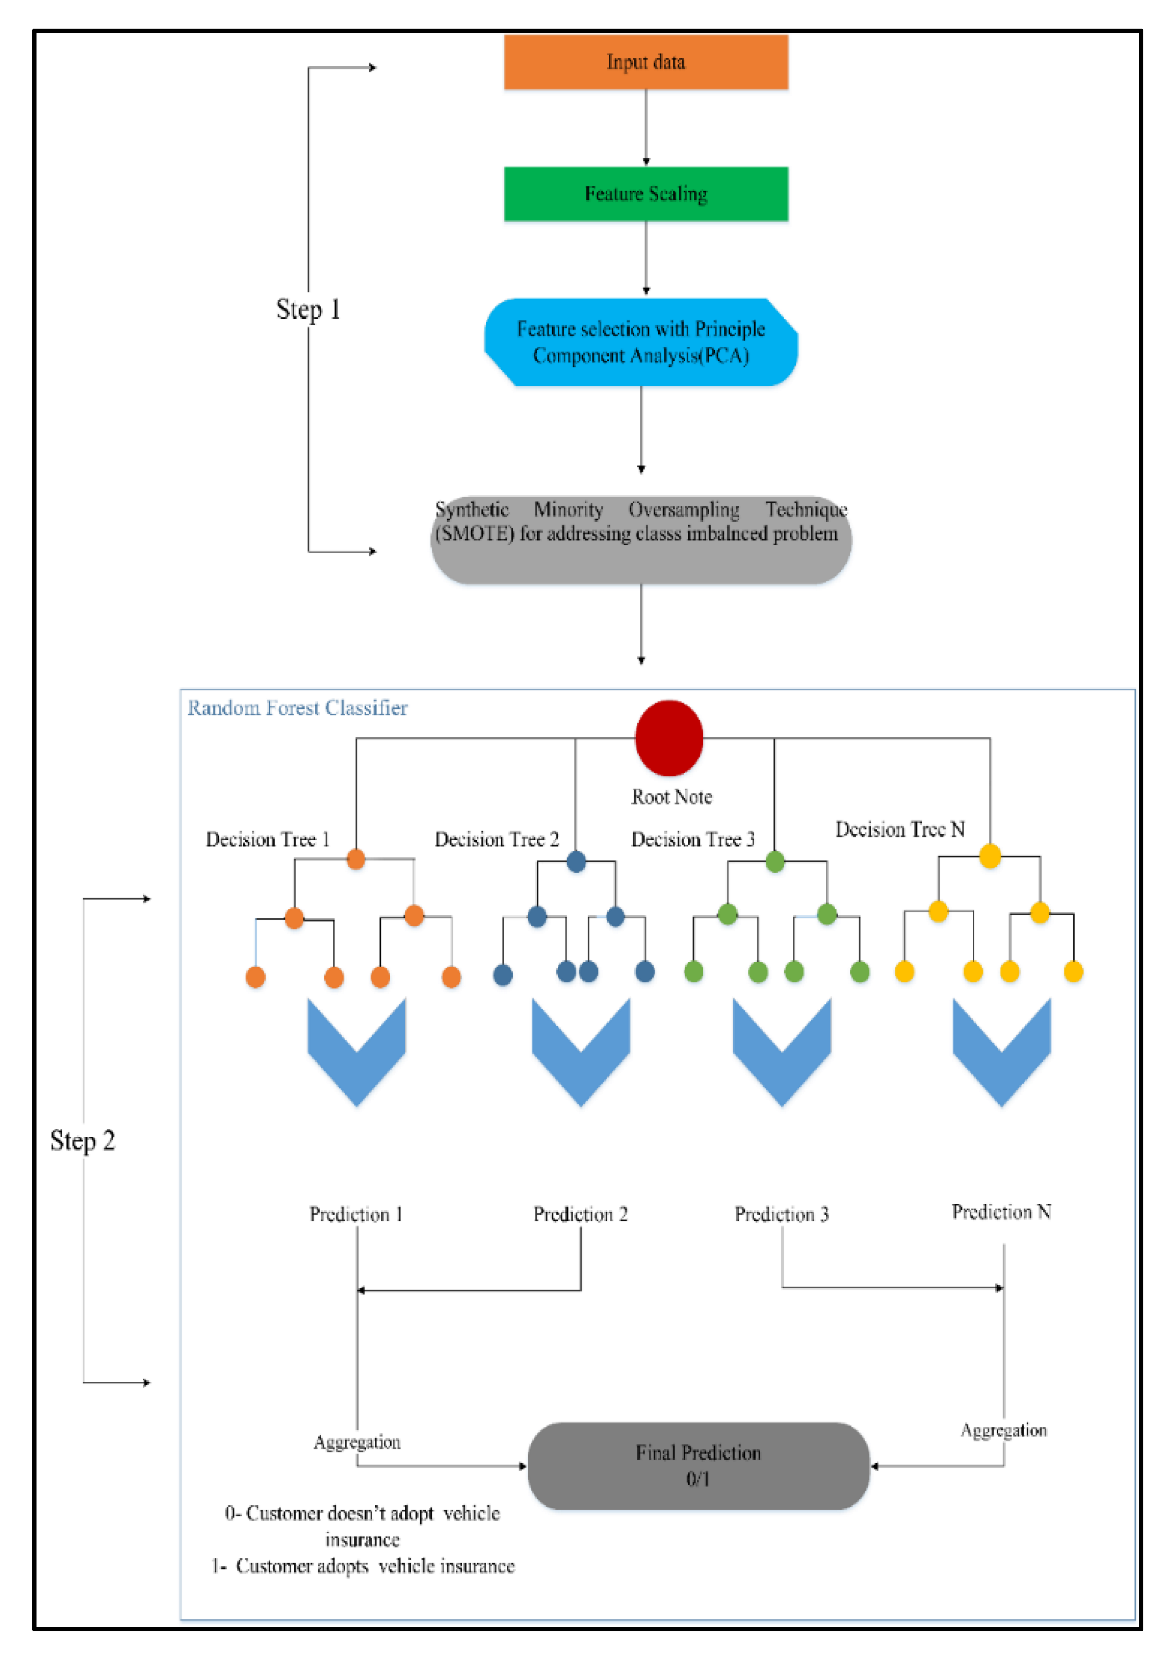
3.2. Conceptual Framework of Vehicle Insurance Prediction: PS-RandomForest

The goal of vehicle insurance is to predict whether a customer will adopt vehicle insurance. The conceptual framework of PS-RandomForest is shown in Figure 1. This method can be accomplished in two main steps: Step 1 involves insurance data collection, feature scaling, feature selection using PCA, and class balancing with SMOTE. Step 2 involves prediction using random forest.

3.2.1. Vehicle Insurance Data Collection (Step 1)

Vehicle insurance data are generally taken from insurance institutions in the destination market. For this work, the dataset were collected from Kaggle’s Cross-Sell Prediction Challenge [27]. Building a model that can predict the customers who can take vehicle insurance will help the company to accordingly plan their blueprint to reach those customers only, optimize their business model, and increase company earnings. The dataset contains the customer attributes for customer response prediction: gender, age, driving license, region code, previously insured, vehicle age, vintage, policy sales channel, and annual damage.

3.2.2. Feature Scaling (Step 2)

Data scaling or normalization is one of the main pre-processing techniques in which a dataset is either transformed or changed to allow equal contribution for every feature [28]. The success of an ML algorithm also depends on the quality of the data to achieve a generalized forecasting model for the classification problem [29]. We applied feature scaling for customers’ adaptation to a vehicle insurance dataset to ensure all features were of the same scale; this ensures that the ML algorithms will converge faster.

3.2.3. Feature Selection with PCA (Step 3)

After the data pre-processing, PCA was applied for feature selection. PCA is an unsupervised ML algorithm used for feature selection that uses dimensionality reduction techniques [13]. As the name suggests, it identifies from the data the principal components, which are the derived features that describe the most variance in the data [30]. Feature selection results in the complexity of higher-dimensional data being reduced to lower-dimensional data, which significantly helps the ML model fit better on data during training and results in improved accuracy. This can be seen as a projection method where data with m columns (features) project into a subspace with m or fewer columns while regaining the basis of the original data. Features selected by PCA are those features that have an essential contribution to improving accuracy.

3.2.4. SMOTE (Step 4)

After feature selection, SMOTE was used to solve the class imbalance problem that exists in the vehicle insurance problem. SMOTE ensures the equal distribution of majority and minority classes, which helps the ML classifier distinguish both classes efficiently, which in turn significantly improves classifier performance [16]. Figure 2 illustrates the oversampling technique.
SMOTE was first proposed by Chawla et al. [17] to generate synthetic examples for the minority class based on the feature affinity in minority values. SMOTE first identifies K-nearest neighbors (NNs) for every minority sample, after which it selects neighbors randomly, and an artificial example is generated at a randomly taken point in feature space between the two examples. Suppose Xi is a set of minority class Xi Є Xminority, and SMOTE selects k-nearest neighbors denoted by KXi. Figure 3A shows the three NNs of Xi that are connected by a line with Xi. SMOTE creates a new example (Xnew) by randomly selecting an element X ^ i from KXi and X ^ i from Xminority. The feature vector for Xnew is the sum of the feature vector Xi and the value. This can be achieved by multiplying the difference between Xi and X ^ i and the random value theta (θ), whose value ranges from 0 to 1.
X new = X i + ( X ^ i X i ) × θ
where X ^ i is an element in KXi: X ^ i ∈ Xminority. The generated sample is a point along the line segment joining Xi and the randomly selected X ^ i ∈ KXi. Figure 3B shows an example of the SMOTE algorithm. The new sample Xnew is in the line between Xi and X ^ i .

3.2.5. Random Forest Classifier (Step 5)

After PCA and SMOTE, a random forest classifier is applied to the equal class distribution of training data. After training the classifier, separate predictions are conducted on test data to check the progress of the classifier. Random forest is a classification algorithm that consists of a number of decision trees developed from a randomly selected subset of the training data. A detailed description of a decision tree and the workings of the decision can be found in [31,32]. Each discrete tree in the random forest provides a potential class prediction, and the class with the maximum number of votes is selected as the classifier prediction. The steps below describe the working of the random forest algorithm (also illustrated in Figure 4).
  • Step 1—The first step selects random samples from the dataset.
  • Step 2—In the next step, a decision tree is made for each sample, and a prediction result is obtained for every single tree.
  • Step 3—The third step performs voting for every predicted result.
  • Step 4—The algorithm selects the most voted prediction result as a final prediction result.
A grid search is used to find the best parameters for training the random forest classifier model. A grid search is a way to tune parameters that will methodically create and estimate a model for each combination of parameters arranged in a grid. A search space is established as a grid of hyperparameter values estimating every position in the grid. Grid searches are excellent for spot-checking combinations that are known to perform well generally.

4. Empirical Study

The Cross-Sell Prediction dataset was chosen as a case study to examine the proposed method performance—the dataset is based on real-life circumstances collected by another study [27]. Detailed information about the data collection process is given in [27]. After collecting the dataset of vehicle insurance prediction, the training data were expressed as {Xt, Yt}, where Xt is an N-dimensional vector representing features of customers and Yt is the corresponding response (i.e., 1 or 0) depending on whether they will adopt the company’s vehicle insurance policy.

4.1. PCA Results

An essential part of using PCA in practice is to find the number of components that are required to describe the data. This is decided by checking the number of components that can capture at least 95% of the variance. Figure 5 shows that eight components achieved 95% of the total variance. Hence, eight components (features) were chosen for training in the random forest classifier.

4.2. SMOTE Results

The dataset was heavily imbalanced, with 334,399 examples for the majority class and only 46,710 examples for the minority class—that is, 334,399 examples will not adopt vehicle insurance, and only 46,710 examples will adopt vehicle insurance. After applying SMOTE to this imbalanced data, synthesized examples were added to the minority class to ensure an equal number of examples for both classes. After applying SMOTE, both classes had 334,399 examples each. The equal distribution of classes was then sent for training to the random forest classifier, which was more robust in separating both classes accurately. The Scikit-learn library was used to implement the proposed methodology in the Python language. All methods were implemented on a Windows machine with 4 Gb RAM and an AMD processor. All optimized results were obtained through the grid search method.

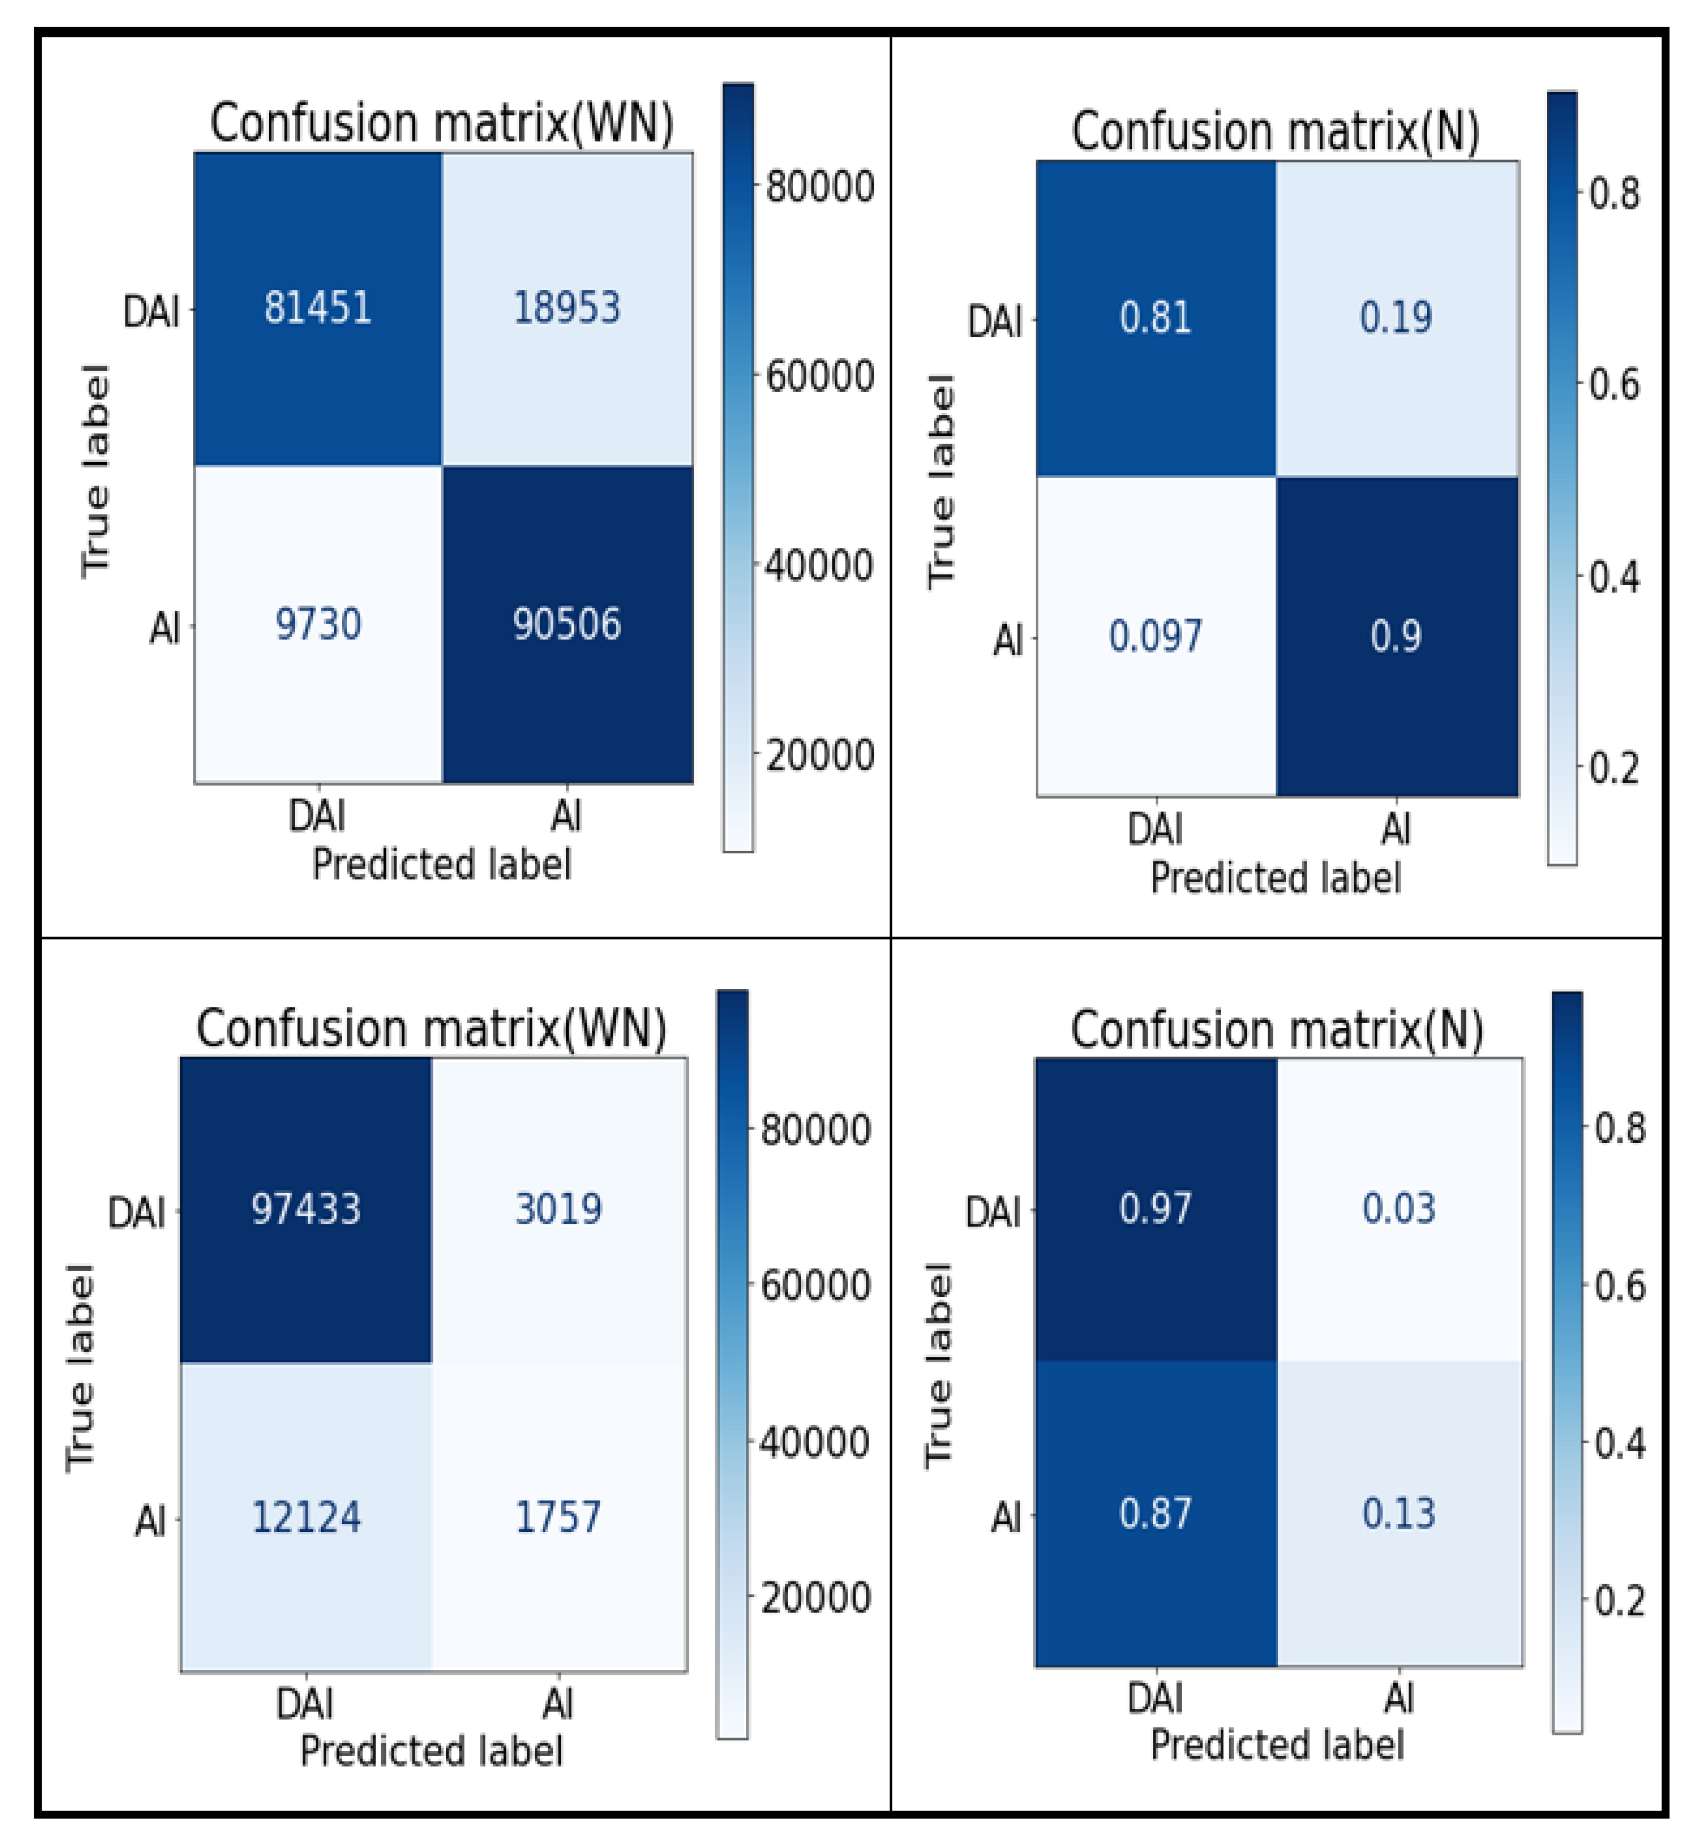
4.3. Performance Evaluation

To examine the performance of the proposed framework, results were matched up for prediction using a simple random forest classifier and a decision tree classifier. The AUC (area under the curve) and the ROC (receiver operating characteristic) curve were used to check the performance of the proposed architecture [33]. We used grid search methods to find the random forest classifier’s best parameters to optimize classifier performance. Table 1 shows the list of parameters for random forest and decision tree classifiers, from which the best parameter is achieved using grid search implemented using the Scikit-learn library.
After using grid search for the decision tree approach, the best parameters were ‘criterion’: ‘gini’,’ max features’: ‘auto’, ‘min_samples_leaf’: 5, ‘min samples split’: 8, and ‘splitter’: ‘random’. For the random forest classifier, the best parameters that achieved the highest accuracy were ‘criterion’: ‘entropy’, ’max features’: ‘auto’, ‘min samples leaf’: 1, ‘min samples split’: 4, and ‘n_estimators’: 90. It should also be noted that the optimal parameters selected for the random forest classifier were also adopted for the proposed PS-RandomForest approach. The evaluation of the performance of a classification model is based on the counts of test data correctly and incorrectly forecasted by the model. These counts are organized in a table called a confusion matrix. Table 2 depicts the confusion matrix for the binary vehicle insurance classification problem in our study.
Each entry Eij in this table stands for the number of values for class i predicted to be of class j. For example, E01 is the number of samples from class 0 incorrectly classified as class 1. In accordance with the confusion matrix entries, the classifier’s total number of correct predictions is (E11 + E00), and the total number of incorrect predictions is (E10 + E01). A true positive in the table classifier predicts that a customer will take vehicle insurance, and the customer actually takes vehicle insurance. A true negative indicates that the model predicted that a customer would not adopt vehicle insurance, and the customer actually does not adopt vehicle insurance. A false positive means the classifier predicted that a customer would adopt vehicle insurance, but the customer actually does not adopt vehicle insurance. A false-negative means the model predicted that a customer would not adopt vehicle insurance, but the customer actually adopts vehicle insurance. Figure 4 shows the confusion matrix results for the vehicle insurance dataset used in this study.
The first row of Figure 6 shows a confusion matrix for the proposed PS-RandomForest classifier, and the second row shows the confusion matrix for the standard random forest classifier.
From Figure 6, it can be observed that, after applying SMOTE on the dataset, classifier performance in distinguishing true positive and true negative examples improved significantly. False-positive and false-negative examples decrease drastically, and only a small proportion of examples were misclassified. The proposed classifier correctly classified 81,244 true positive and 90,715 true negative examples, with only 19,160 false positives and 9521 false negative examples misclassified. The second row shows the confusion matrix of the standard random forest classifier. Figure 6 illustrates that the classifier can classify the negative class (majority class), but it fails to perform well on the positive class (minority class). There are also more false-positive examples compared with the true-positive example, which shows that the classifier is not able to classify well on the minority class.
Even though a confusion matrix produces the information needed to decide classifier performance, characterizing this information with a single number allows the comparison of different model performances. This can be done using a performance metric such as the AUC-ROC curve used in this study, which provides a single-digit score whose value ranges between 0 to 1. A value of 0 is the worst-performing classifier, and a value of 1 is the best-performing classifier.

AUC and ROC Curves

AUC and ROC curves are common performance measures for classification models at different threshold values. The AUC represents the separability measures of a classification model which tells how much a model can classify the positive class as positive and the negative class as negative, and the ROC represents the probability. Higher AUC values mean that the classifier is more competent in distinguishing two classes. The ROC curve is plotted with a true-positive rate (TPR) against the false-negative rate (FPR). The metrics used in calculating the AUC-ROC curve are:
  • Sensitivity/true-positive rate/recall: This metric evaluates the proportion of positive class that is correctly classified (i.e., customers who will adopt insurance are correctly identified by the classifier that they will adopt insurance).
Re c a l l = ( t r u e _ p o s i t i v e   ) ( t r u e _ p o s i t i v e + f a l s e _ n e g a t i v e )
  • True-negative rate: This metric shows the negative class proportion correctly classified as negative with respect to all the negative classes (i.e., customers who will not adopt insurance are correctly identified by the classifier).
S p e c i f i c i t y / T r u e N e g a t i v e R a t e = ( t r u e _ n e g a t i v e   ? ) ( t r u e _ n e g a t i v e + f a l s e _ p o s i t i v e )
  • False-positive rate: This rate shows the proportion of the negative class incorrectly classified as belonging to the positive class (i.e., customers who will not adopt insurance who are misclassified by the classifier that they will adopt insurance).
F a l s e P o s i t i v e R a t e = ( f a l s e _ p o s i t i v e   ? ) ( t r u e _ n e g a t i v e + f a l s e _ p o s i t i v e )
  • False-negative rate: This rate shows the proportion of the positive class incorrectly classified as belonging to the negative class (i.e., customers who will adopt insurance who are misclassified by the classifier that they will not adopt insurance).
F a l s e N e g a t i v e R a t e = ( f a l s e _ n e g a t i v e   ? ) ( t r u e _ p o s i t i v e + f a l s e _ n e g a t i v e )
Figure 7 shows the AUC-ROC curves individually for both classifiers for vehicle insurance prediction, which plots the true-positive rate on the y-axis and the false-positive rate on the x-axis, which are computed at the varying thresholds.
The AUC calculates the area under the ROC curve, which is carried out to assess the classification model’s performance. The individual graphs illustrate that the standard random forest model covers the least area, and the proposed hybrid random forest covers the most area. Figure 8 displays the AUC-ROC curves for the random forest, decision tree, and hybrid-based classifiers.
The x-axis represents the true-positive rate, and the y-axis represents the false-positive rate. This figure depicts the overall performance of the classifier in a more accurate view. We can clearly observe from the figure that the red curve of the random forest classifier covers the least area, performing even worse than the decision tree classifier. The green curve displays the ROC curve of the proposed hybrid random forest classifier (PS-RandomForest), which covers almost 86% of the area, compared with a simple random forest classifier, which covers only around 55%. The ROC curve shows that the proposed hybrid classifier is correctly able to classify positive and negative classes for an imbalanced dataset by a very large margin compared with the standard random forest classifier and the decision tree classifier.
Table 3 shows the AUC scores for the decision tree, random forest, hybrid decision tree, and the proposed PS-RandomForest classifiers.
The proposed framework for the imbalanced dataset outperforms the standard classifier by a huge margin for the imbalanced dataset. The standard random forest classifier achieved a 54.80 AUC score, which shows that it fails badly in classifying positive and negative classes correctly. However, the proposed hybrid random forest classifier has improved the standard random forest performance by 30%, which is a considerable margin. The proposed framework has achieved almost 20% better performance compared with the decision tree case, which shows that the proposed framework is robust in increasing classifier performance for the imbalanced dataset.

5. Conclusions, Implications, and Limitations of the Study

5.1. Conclusions

This study focuses on the challenges faced by insurance companies in predicting vehicle insurance adoption and their efforts to minimize their financial risk. The proposed hybrid framework provides a solution to the problem of imbalanced datasets in vehicle insurance prediction. The framework comprises two steps. In the first step, feature selection and oversampling are applied to address the issue of imbalanced datasets. In the second step, the proposed hybrid random forest classifier is used to predict the adoption of vehicle insurance.
To validate the proposed framework, the data from Kaggle’s Cross-Sell Prediction Challenge dataset were used. The results showed that the proposed hybrid random forest classifier, with the combination of PCA for feature selection and SMOTE for oversampling, outperforms the standard random forest classifier by a significant margin. Hence, the hybrid framework presents a significant contribution to the field of insurance prediction and can benefit insurance companies by reducing their financial risk and helping them reach out to potential customers who are likely to take vehicle insurance.

5.2. Implications for Managers

The proposed model can be advantageous for managers and companies within the insurance sector to make informed choices and plan for their operations. First, by adopting the proposed hybrid random forest classifier, managers could enhance their accuracy in predicting vehicle insurance adoption by passenger and commercial vehicle owners. Second, the proposed method may enable managers to make data-driven decisions to improve their organizational and strategic decisions. Third, practitioners and managers may collaborate with other industry stakeholders (such as banks [34,35], vehicle dealerships/workshops, transportation, etc.) to share best practices and knowledge to improve the prediction of vehicle sales and drive the industry forward. Last, study results can assist stakeholders involved in the insurance industry in planning and improving revenue.

5.3. Limitations of the Study and Future Directions

Despite the systematic and scientific methodology followed in designing this study, there are still some limitations. Future investigations may find ways to overcome these limitations.
  • First, the generalization of the results might have suffered due to the configuration of the limited parameters (for instance, vehicle age, vehicle damage, annual premium and policy sales channel). Future studies may identify additional key parameters and develop more advanced models for vehicle insurance prediction.
  • Second, the outcomes of this research are based on existing insurance data obtained from a previous study; therefore, the proposed model may be replicated with caution.
  • Finally, the current study has not considered management’s willingness to invest in high-end technology. Future researchers may consider this important parameter to encourage insurance companies to allocate resources toward technology and data analytics so as to drive better decision making and improve revenue.

Author Contributions

Conceptualization, M.U., M.F.A., M.A. and R.K.C.; methodology, M.U., M.F.A. and M.J.R.; software, M.F.A.; validation, M.F.A., M.A. and R.K.C.; formal analysis, M.F.A.; investigation, M.U., R.K.C. and M.A.; resources, R.K.C. and M.J.R.; data curation, M.F.A. and M.A.; writing—original draft preparation, M.U., M.F.A. and M.A.; writing—review and editing, M.A.; R.K.C. and M.J.R.; visualization, M.U., M.F.A. and M.J.R.; supervision, M.A.; project administration, M.F.A., M.A. and R.K.C.; funding acquisition, M.U. All authors have read and agreed to the published version of the manuscript.

Funding

This research received no external funding.

Institutional Review Board Statement

Not applicable.

Informed Consent Statement

Not applicable.

Data Availability Statement

Not applicable.

Conflicts of Interest

The authors declare no conflict of interest.

References

  1. Global motor insurance market report. Growth, Trends, and forecast 2018–2024. 2019. Available online: https://www.researchandmarkets.com/reports/4771935/e-retail-market-growth-trends-and-forecast (accessed on 20 January 2022).
  2. Bastürk, F.H. Insurance Fraud: The Case in Turkey. In Contemporary Issues in Audit Management and Forensic Accounting; Grima, S., Boztepe, E., Baldacchino, P.J., Eds.; Emerald Publishing Limited: Bingley, UK, 2020; Volume 102, pp. 77–97. [Google Scholar] [CrossRef]
  3. Nasir, M.; Adil, M. Exploring the applicability of SERVPERF model in Indian two-wheeler industry: A CFA approach. Int. J. Product. Qual. Manag. 2020, 29, 329–354. [Google Scholar] [CrossRef]
  4. Dodge, E.; Gamez, C.; Jauregui, A.; Keenan, D.; MacDonald, D.; Richardson, C.; Moledina, A.; Shapiro, D. Principles of Micro-economics 2e. for AP® Courses; Rice University: Houston, TX, USA, 2016. [Google Scholar]
  5. Mau, S.; Pletikosa, I.; Wagner, J. Forecasting the next likely purchase events of insurance customers. Int. J. Bank Mark. 2018, 36, 0265–2323. [Google Scholar] [CrossRef]
  6. Adil, M.; Wu, J.-Z.; Chakrabortty, R.K.; Alahmadi, A.; Ansari, M.F.; Ryan, M.J. Attention-Based STL-BiLSTM Network to Forecast Tourist Arrival. Processes 2021, 9, 1759. [Google Scholar] [CrossRef]
  7. Di Franco, G.; Santurro, M. Machine learning, artificial neural networks and social research. Qual. Quant. Int. J. Methodol. 2020, 33, 2007851. [Google Scholar] [CrossRef]
  8. Schmidt, J.; Marques, M.R.G.; Botti, S. Recent advances and applications of machine learning in solid-state materials science. Nat. Partn. J. (Npj) Comput. Mater. 2019, 6, 19375. [Google Scholar] [CrossRef] [Green Version]
  9. Ahmed, O.; Fatima-Zahra, B.; Ayoub, A.L.; Samir, B. Big Data technologies: A survey. J. King Saud Univ. 2018, 19, 171–209. [Google Scholar] [CrossRef]
  10. Attaran, M.; Deb, P. Machine learning: The new ‘big thing’ for competitive advantage. Int. J. Knowl. Eng. Data Min. 2018, 5, 277–305. [Google Scholar] [CrossRef]
  11. Dimiduk, D.M.; Holm, E.A.; Niezgoda, S.R. Perspectives on the Impact of Machine Learning, Deep Learning, and Artificial Intelligence on Materials, Processes, and Structures Engineering. Integr. Mater. Manuf. Innov. 2018, 7, 157–172. [Google Scholar] [CrossRef] [Green Version]
  12. Adil, M.; Ansari, M.F.; Alahmadi, A.; Wu, J.-Z.; Chakrabortty, R.K. Solving the problem of class imbalance in the prediction of hotel cancelations: A hybridized machine learning approach. Processes 2021, 9, 1713. [Google Scholar] [CrossRef]
  13. Parveen, A.; Inbarani, H.; Sathishkumar, E. Performance analysis of unsupervised feature selection methods. In Proceedings of the 2012 International Conference on Computing, Communication and Applications, Dindigul, India, 22–24 February 2012; pp. 1–7. [Google Scholar] [CrossRef] [Green Version]
  14. Khalid, S.; Khalil, T.; Nasreen, S. A survey of feature selection and feature extraction techniques in machine learning. In Proceedings of the 2014 Science and Information Conference, SAI, London, UK, 27–29 August 2014; pp. 372–378. [Google Scholar]
  15. Chen, R.C.; Dewi, C.; Huang, S.W. Selecting critical features for data classification based on machine learning methods. J. Big Data 2020, 7, 52. [Google Scholar] [CrossRef]
  16. Leevy, J.L.; Khoshgoftaar, T.M.; Bauder, R.A. A survey on addressing high-class imbalance in big data. J. Big Data 2018, 5, 42. [Google Scholar] [CrossRef]
  17. Chawla, N.V.; Bowyer, K.W.; Hall, L.O.; Kegelmeyer, W.P. SMOTE: Synthetic Minority Over-sampling Technique. J. Artif. Intell. Res. 2002, 16, 321–357. [Google Scholar] [CrossRef]
  18. Weerasinghe, K.P.M.L.P.; Wijegunasekara, M.C. A comparative study of data mining algorithms in the prediction of auto insurance claims. Eur. Int. J. Sci. Technol. 2016, 5, 47–54. [Google Scholar]
  19. Smith, K.A.; Willis, R.J. An analysis of customer retention and insurance claim patterns using data mining: A case study. J. Oper. Res. Soc. 2017, 51, 532–541. [Google Scholar] [CrossRef]
  20. Thakur, S.S.; Singh, J.K. Prediction of Online Vehicle Insurance System using Decision Tree Classifier and Bayes Classifier–A Comparative Analysis. Int. J. Comput. Appl. 2014, 975, 8887. [Google Scholar]
  21. Pesantez-Narvaez, J.; Guillen, M.; Alcañiz, M. Predicting Motor Insurance Claims Using Telematics Data—XGBoost versus Logistic Regression. Risks 2019, 7, 70. [Google Scholar] [CrossRef] [Green Version]
  22. Neumann, L.; Nowak, R.M.; Okuniewski, R.; Wawrzyński, P. Machine Learning-based predictions of customers’ decisions in car insurance, Applied Artificial Intelligence. Appl. Artif. Intell. 2019, 33, 817–828. [Google Scholar] [CrossRef]
  23. Khalili-Damghani, K.; Abdi, F.; Abolmakarem, S. Solving customer insurance coverage recommendation problem using a two-stage clustering-classification model. Int. J. Manag. Sci. Eng. Manag. 2019, 14, 9–19. [Google Scholar] [CrossRef]
  24. Bian, Y.; Yang, C.; Zhao, J.L.; Liang, L. Good drivers pay less: A study of usage-based vehicle insurance models. Transp. Res. Part. A 2018, 107, 20–34. [Google Scholar] [CrossRef]
  25. Wu, C.-H.; Kao, S.-C.; Su, Y.-Y.; Wu, C.C. Targeting customers via discovery knowledge for the insurance industry. Expert Syst. Appl. 2005, 29, 291–299. [Google Scholar] [CrossRef]
  26. Kim, S.-Y.; Jung, T.-S.; Suh, E.-H.; Hwang, H.S. Customer segmentation and strategy development based on customer lifetime value: A case study. Expert Syst. Appl. 2006, 31, 101–107. [Google Scholar] [CrossRef]
  27. Kuo, R.J.; Lin, S.Y.; Shih, C.W. Mining association rules through integration of clustering analysis and ant colony system for health insurance database in Taiwan. Expert Syst. Appl. 2007, 33, 794–808. [Google Scholar] [CrossRef]
  28. Kumar, A. Health Insurance Cross Sell Prediction dataset. Available online: https://www.kaggle.com/anmolkumar/health-insurance-cross-sell-prediction (accessed on 13 February 2023).
  29. Singh, D.; Singh, B. Investigating the impact of data normalization on classification performance. Appl. Soft Comput. 2020, 97, 1568–4946. [Google Scholar] [CrossRef]
  30. Christopher, B. Pattern Recognition and Machine Learning (Information Science and Statistics); Springer: New York, NY, USA, 2007. [Google Scholar]
  31. Le, T.; Vo, M.; Vo, B.; Lee, M.; Baik, S. A Hybrid Approach Using Oversampling Technique and Cost-Sensitive Learning for Bankruptcy Prediction. Complexity 2019, 2019, 1–12. [Google Scholar] [CrossRef] [Green Version]
  32. Patel, H.; Prajapati, P. Study and analysis of Decision Tree based classification algorithms. Int. J. Comput. Sci. Eng. 2018, 6, 74–78. [Google Scholar] [CrossRef]
  33. Hassan, S.G.; Ahmed, S.; Iqbal, S.; Elahi, E.; Hasan, M.; Li, D.L.; Zhou, Z.; Abbas, A.; Song, C. Fish as a source of acoustic signal measurement in an aquaculture tank: Acoustic sensor based time frequency analysis. Int. J. Agric. Biol. Eng. 2019, 12, 110–117. [Google Scholar] [CrossRef] [Green Version]
  34. Sadiq, M.; Adil, M.; Khan, M.N. Automated banks’ service quality in developing economy: Empirical evidences from India. J. Serv. Oper. Manag. 2019, 33, 331–350. [Google Scholar] [CrossRef]
  35. Adil, M.; Nasir, M.; Sadiq, M.; Bharti, K. SSTQUAL model: Assessment of ATM service quality in an emerging economy. Int. J. Bus. Excell. 2020, 22, 114–138. [Google Scholar] [CrossRef]
Figure 1. Conceptual framework of the proposed method.
Processes 11 00629 g001
Figure 2. Illustration of the SMOTE oversampling technique.
Processes 11 00629 g002
Figure 3. An example of the three nearest neighbors for Xi (A) and a synthetic example using SMOTE (B) [12].
Processes 11 00629 g003
Figure 4. Workings of random forest classifier.
Processes 11 00629 g004
Figure 5. Feature selection after applying PCA.
Processes 11 00629 g005
Figure 6. Confusion matrix results for the PS-RandomForest and standard random forest classifiers for vehicle insurance. Confusion matrix (WN): confusion matrix without normalization; confusion matrix (N): confusion with normalization; DAI: does not adopt insurance; and AI: adopts insurance.
Processes 11 00629 g006
Figure 7. Showing the ROC curves for both models.
Processes 11 00629 g007
Figure 8. Analysis of ROC curve for all models.
Processes 11 00629 g008
Table 1. Parameter list used in grid search algorithm to find the best parameter.
List of ParametersParameter ValueMethod
Criterion(‘Gini’, ‘Entropy’)Decision Tree
Min Samples Leaf(1, 2, 3, 4, 5)
Min Samples Split(4, 5, 6, 7, 8)
Max Features(‘Auto’,’Log2′)
Splitter(‘Best’, ‘Random’)
N_Estimators(90, 100, 115)Random Forest
Criterion(‘Gini’, ‘Entropy’)
Min Samples Leaf(1, 2, 3, 4, 5)
Min Samples_Split(4, 5, 6, 7, 8)
Max Features(‘Auto’,’Log2′)
Table 2. Confusion matrix for two classes.
Predicted Class
Class 1Class 0
Actual ClassClass 1E11 (True_positive)E10 (False_positive)
Class 0E01 (False_negative)E00 (True_negative)
Table 3. Results for decision tree and random forest classifiers.
MethodsAUC Score
Decision Tree60.56
Hybrid Decision Tree 81.17
Random Forest54.80
PS-RandomForest (Ours)85.71
Disclaimer/Publisher’s Note: The statements, opinions and data contained in all publications are solely those of the individual author(s) and contributor(s) and not of MDPI and/or the editor(s). MDPI and/or the editor(s) disclaim responsibility for any injury to people or property resulting from any ideas, methods, instructions or products referred to in the content.

