
The Impact of Forestry Carbon Sink on Land Use Space Based on FLUS Model
Abstract
:1. Introduction
2. FLUS Model and Land Use
2.1. Probability Calculation of Suitability Based on Artificial Neural Network Model (ANN)
2.2. Adaptive Inertial Mechanism Cellular Automata
3. Experiment
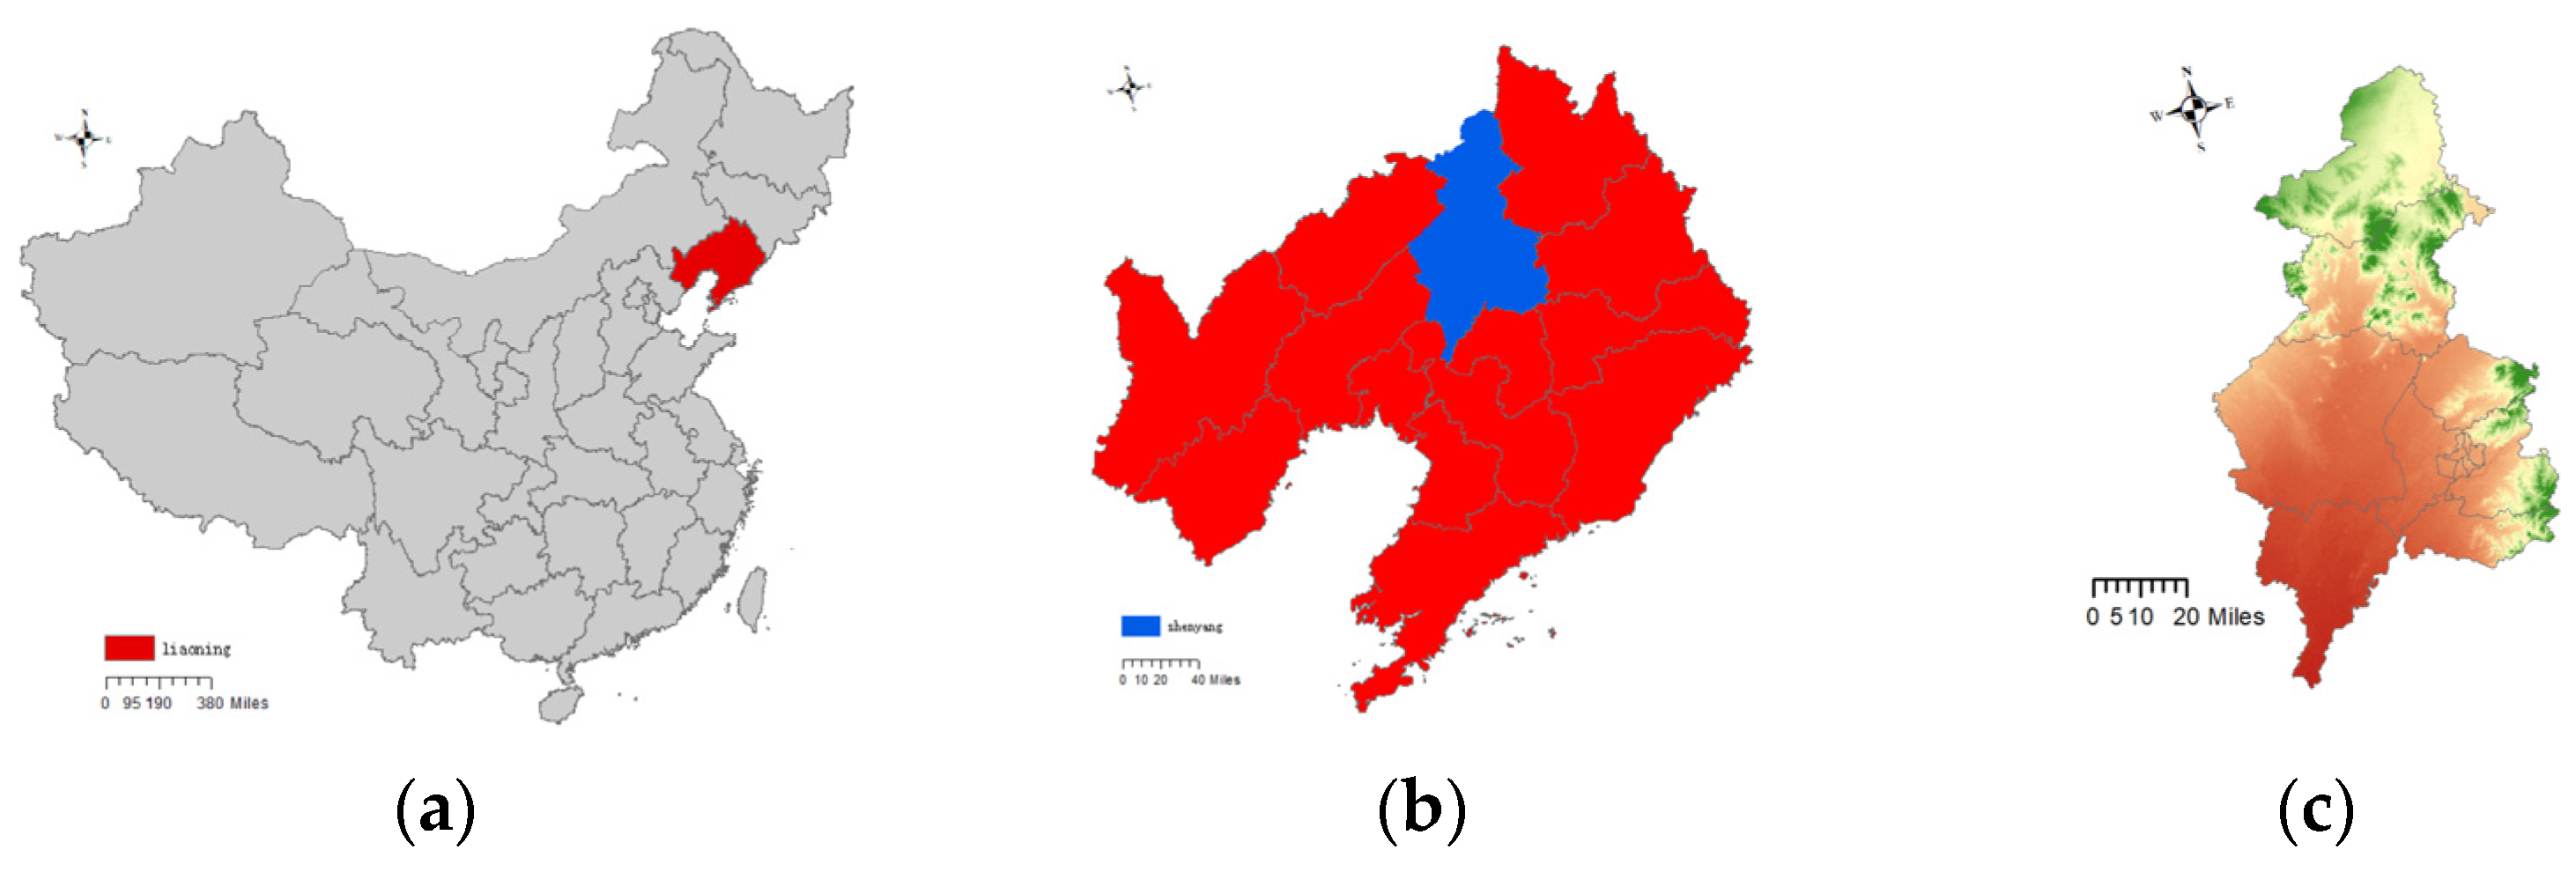
3.1. Study Area
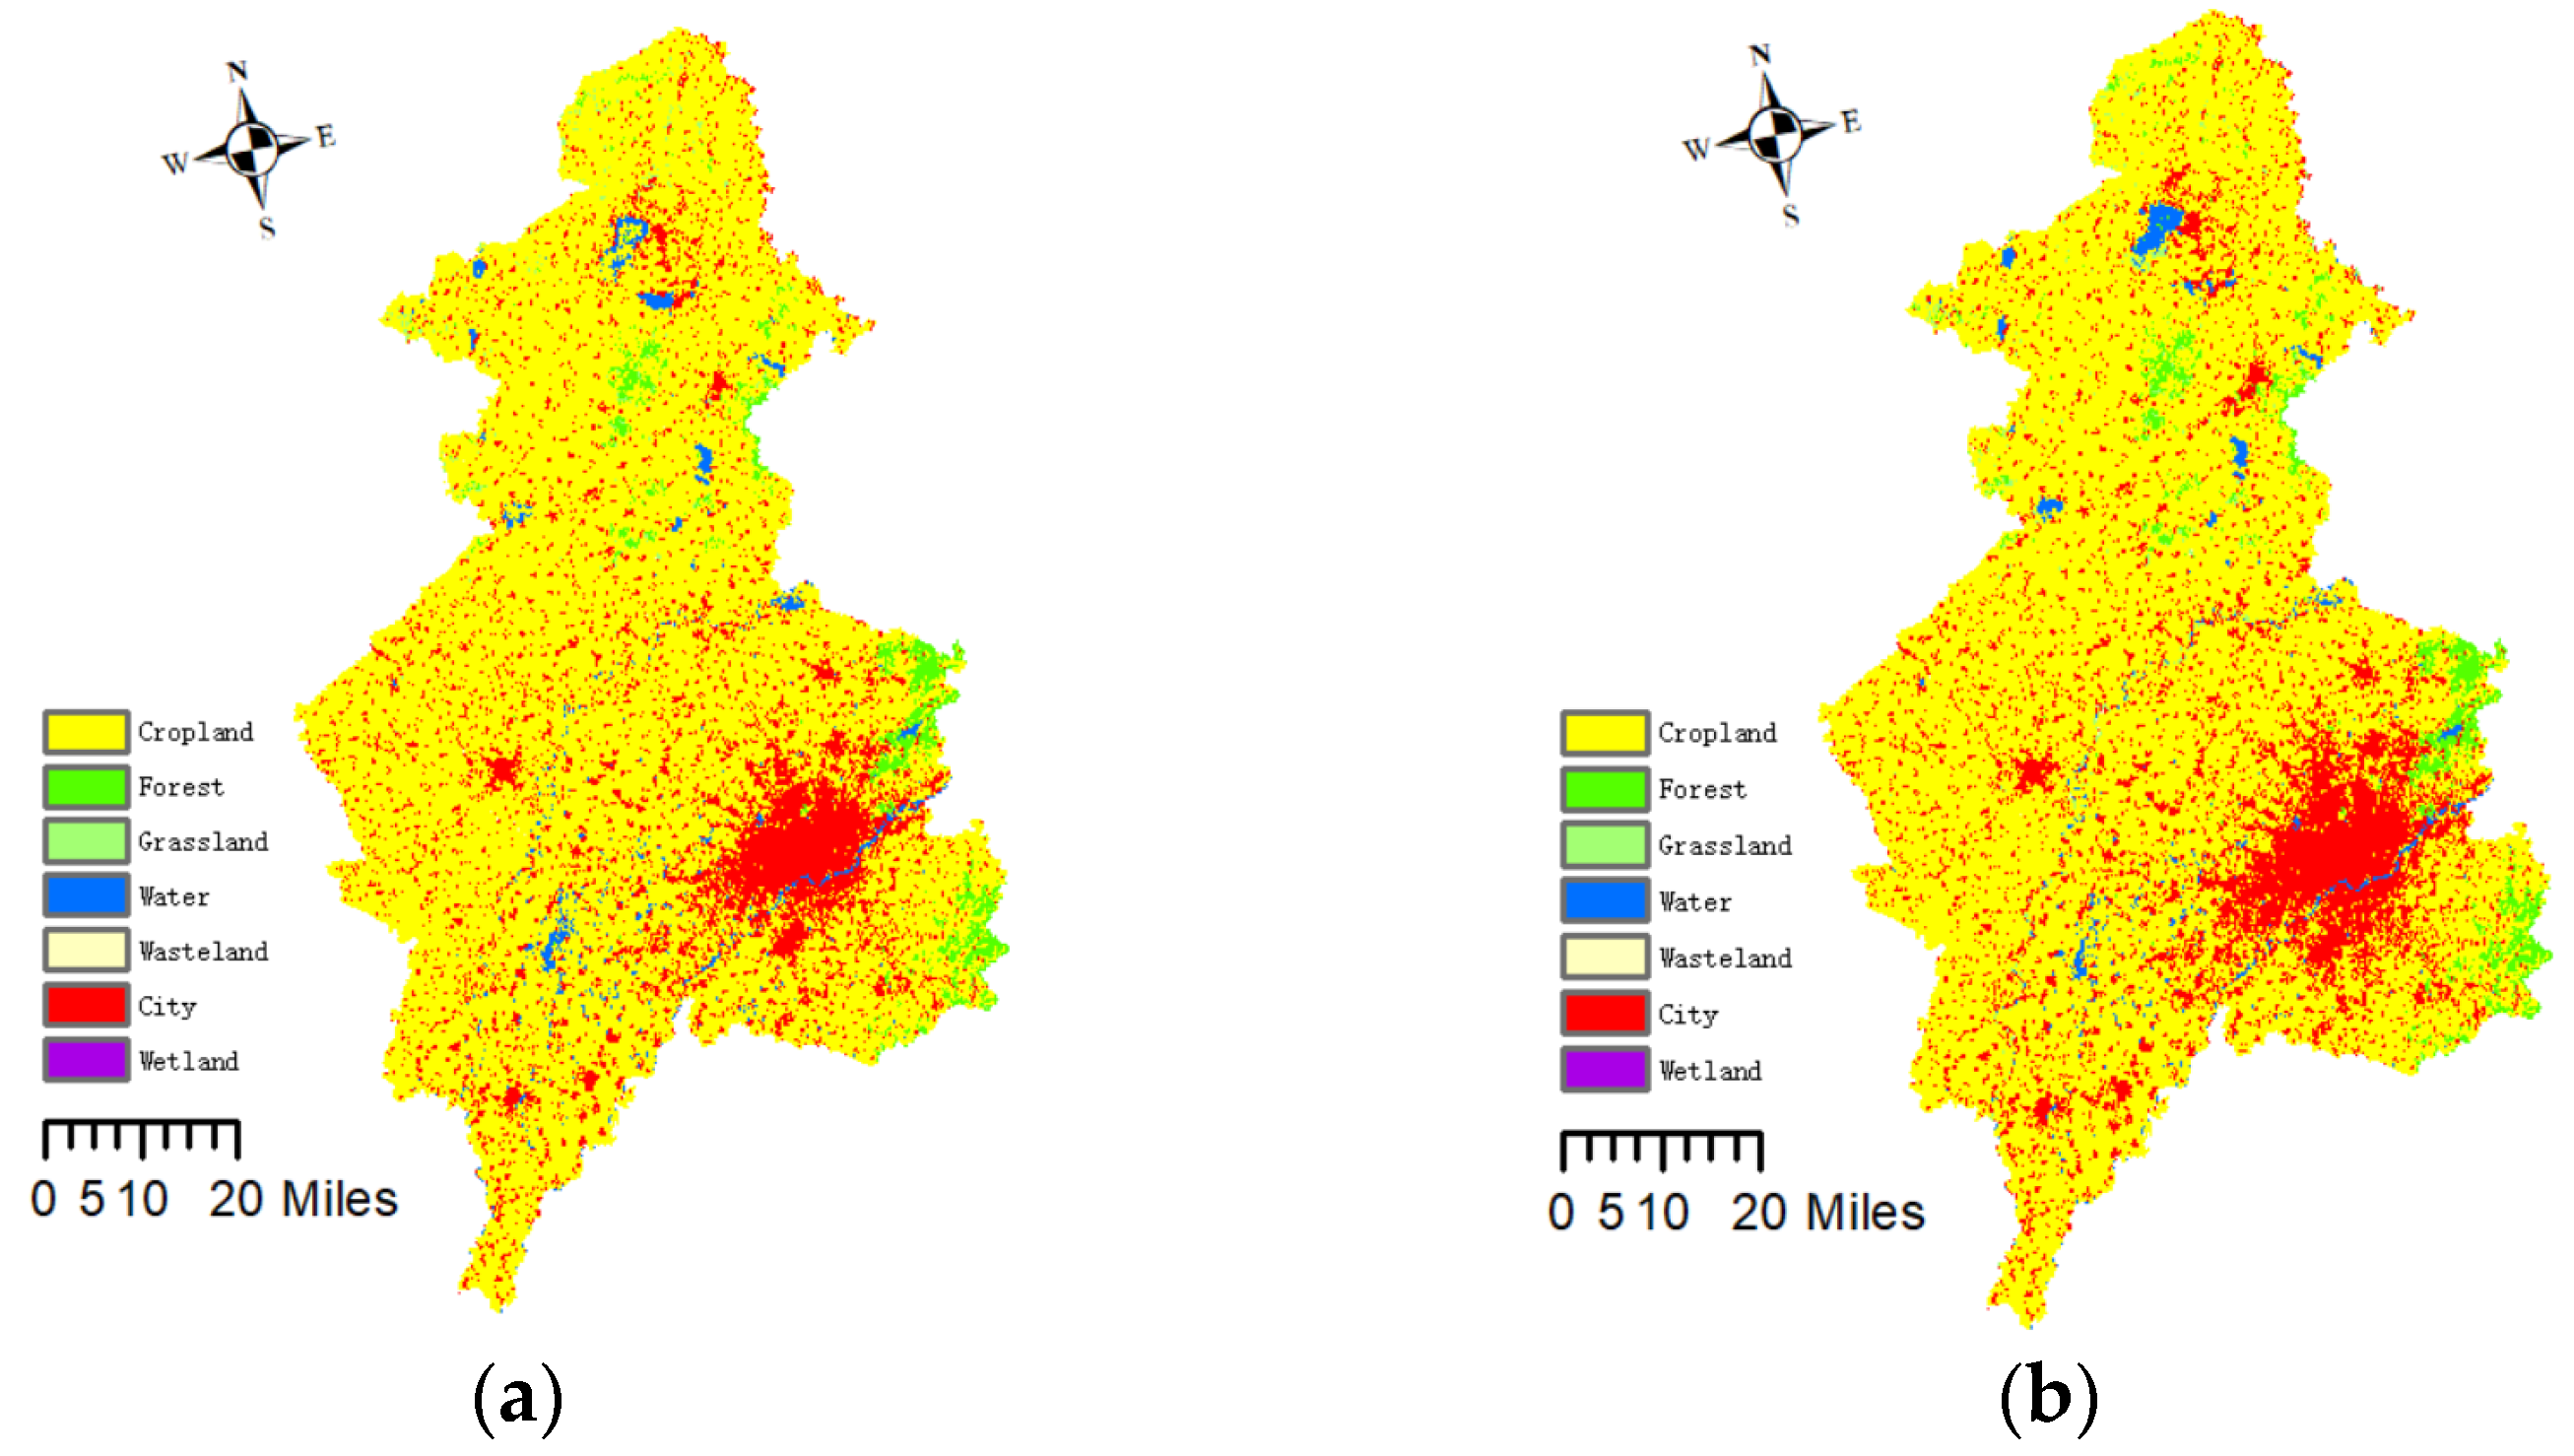
3.2. Land Use Data Processing in the Study Area
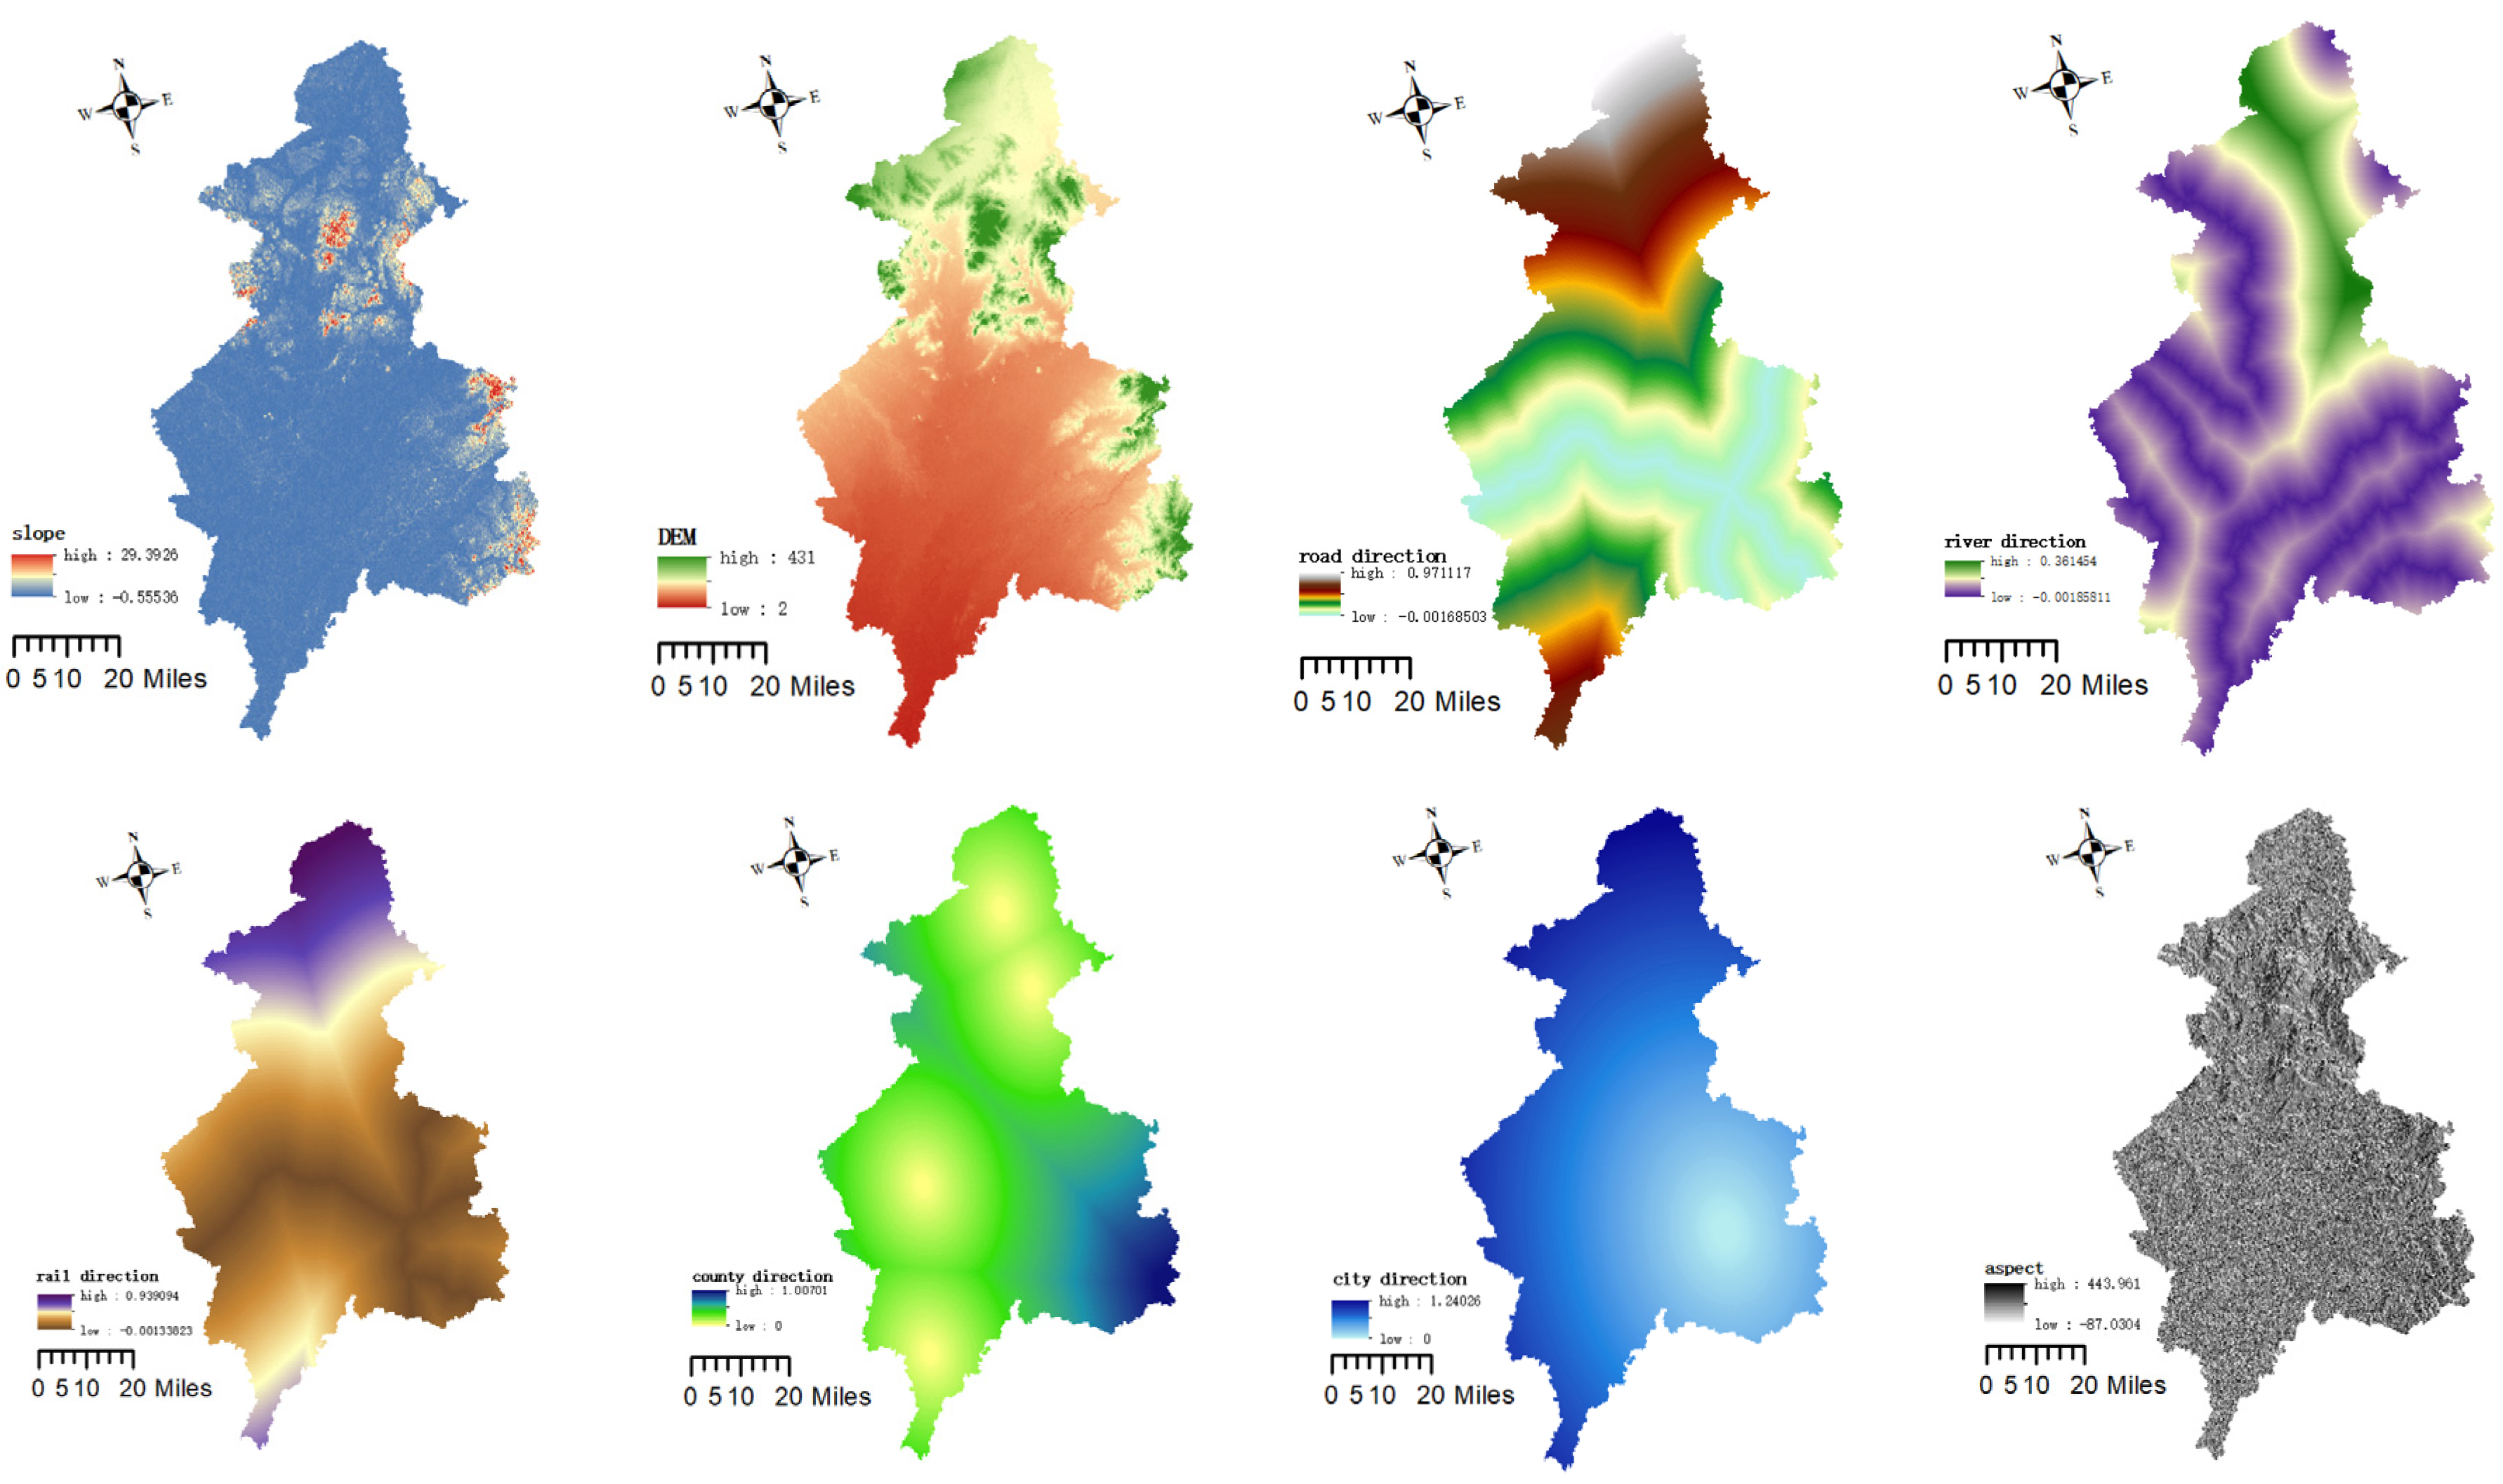
3.3. Calculation and Evaluation of Suitability Probability Based on ANN
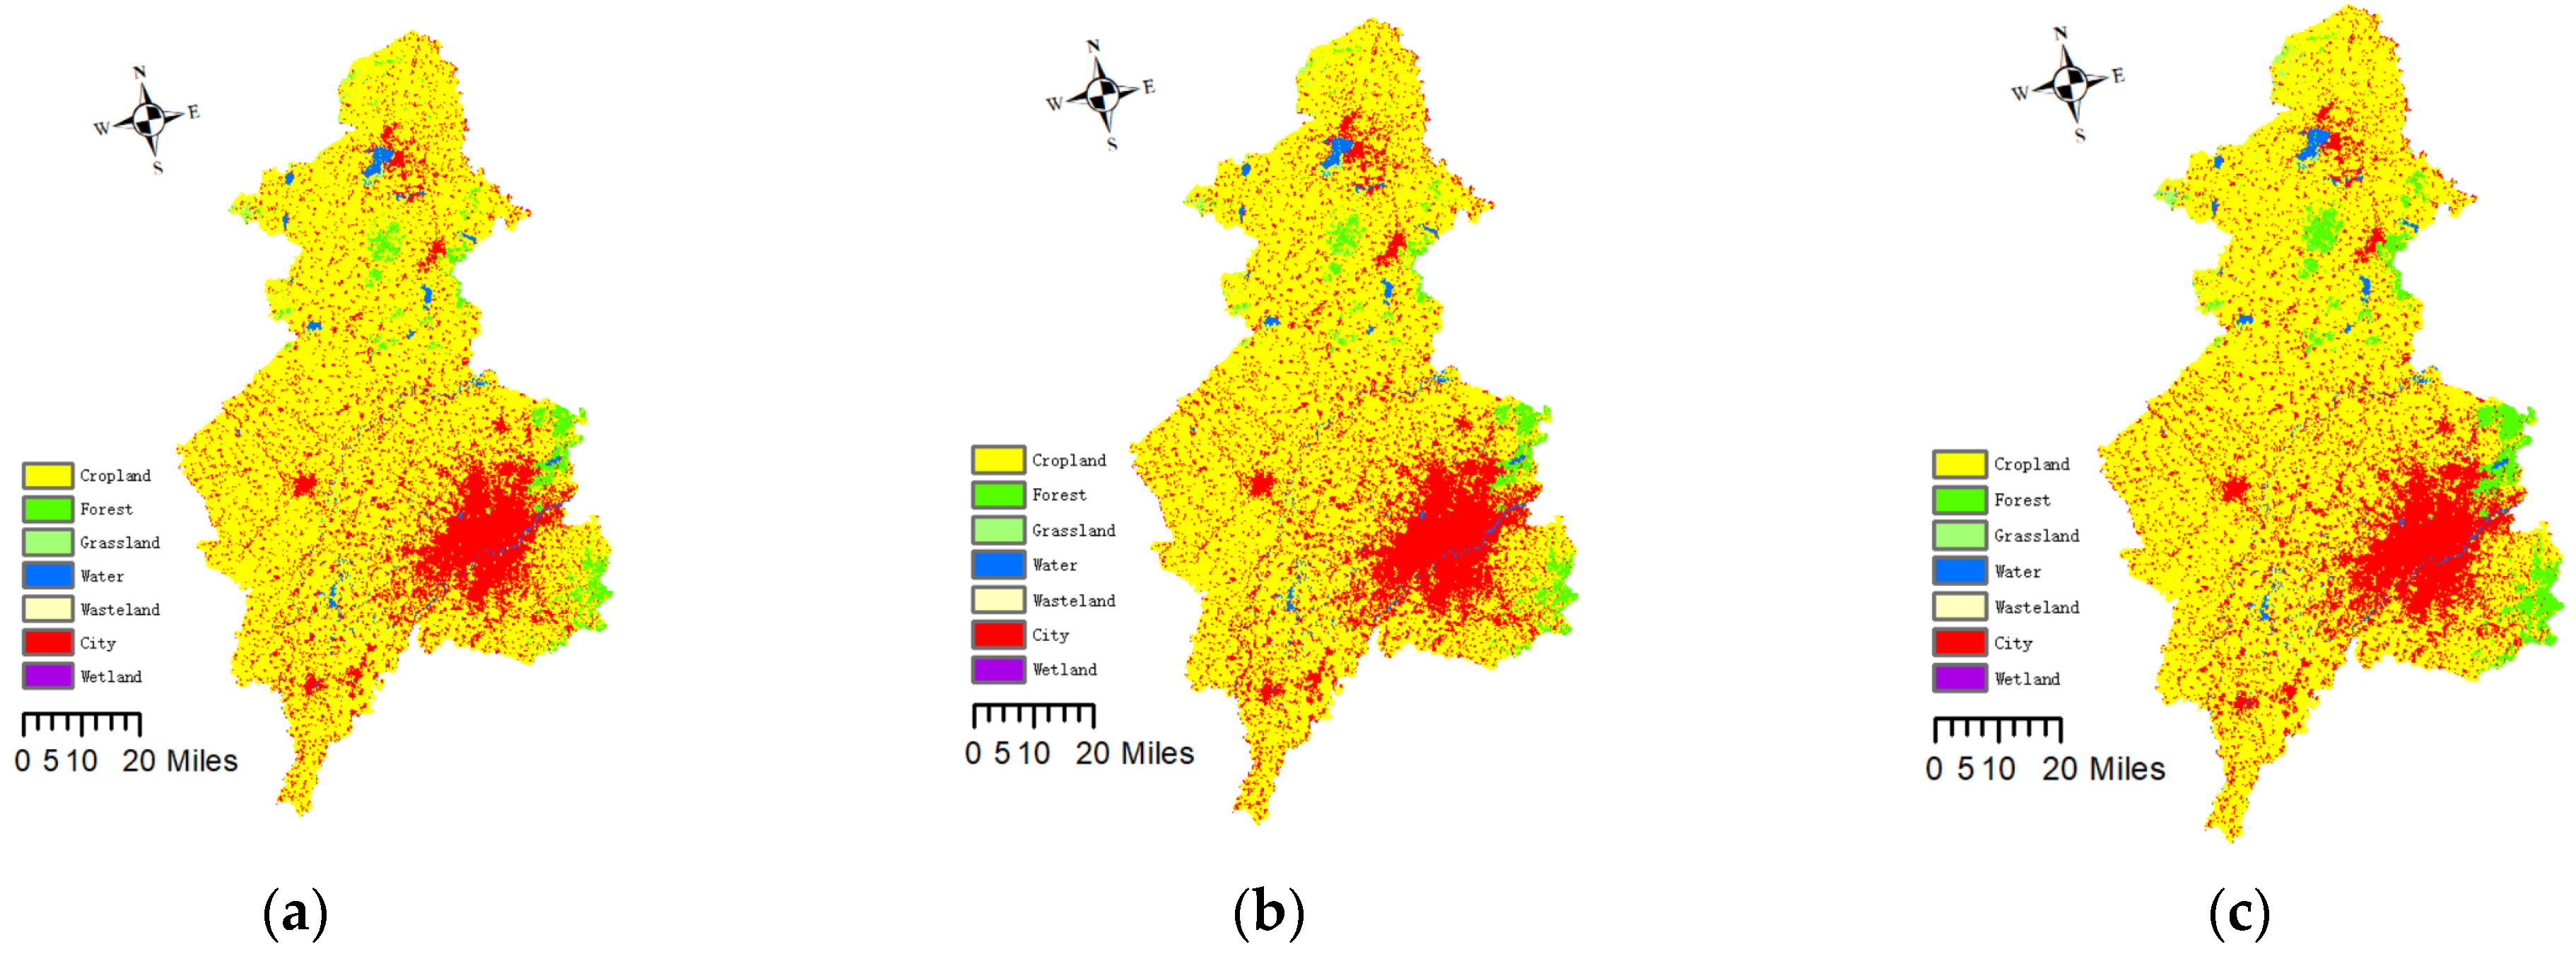
3.4. Cellular Automata Based on Adaptive Inertial Mechanism
4. Conclusions
Author Contributions
Funding
Data Availability Statement
Conflicts of Interest
References
- Zhang, Y.; Shan, Y.J. Analysis of supply, demand and trade in my country’s forest carbon sink market. Environ. Prot. 2016, 44, 37–41. [Google Scholar]
- Dixon, R.K.; Solomon, A.M.; Brown, S.; Houghton, R.A.; Trexier, M.C.; Wisniewski, J. Carbon pools and flux of global forest ecosystems. Science 1994, 263, 185–190. [Google Scholar] [CrossRef] [PubMed]
- Pan, Y.; Birdsey, R.; Fang, J.; Houghton, R.; Kauppi, P.E.; Kurz, W.A.; Phillips, O.L.; Shvidenko, A.; Lewis, S.L.; Canadell, J.G.; et al. A large and persistent carbon sink in the world’s forests. Science 2011, 300, 988–993. [Google Scholar] [CrossRef] [PubMed] [Green Version]
- Li, Z.; Zhang, K. Comparison of Three GIS-Based Hydrological Models. J. Hydrol. Eng. 2008, 13, 364–370. [Google Scholar] [CrossRef]
- Guo, B.; Wang, Y.; Zhou, H.; Hu, F. Can environmental tax reform promote carbon abatement of resource-based cities? Evidence from a quasi-natural experiment in China. Environ. Sci. Pollut. Res. 2022, 26. [Google Scholar] [CrossRef]
- Zhuo, Z.; Du, L.; Lu, X.; Chen, J.; Cao, Z. Smoothed lv distribution based three-dimensional imaging for spinning space debris. IEEE Trans. Geosci. Remote Sens. 2022, 60, 1–13. [Google Scholar] [CrossRef]
- Jiang, X. Analysis of China’s forestry carbon sink potential under the new economic normal. China Rural. Econ. 2016, 11, 57–67. [Google Scholar]
- Li, S.L. Research on the Economic Problem of Forest Carbon Sink. Doctoral Dissertation, Northeast Forestry University, Harbin, China, 2005. [Google Scholar]
- Yan, Y.; Jarvie, S.; Liu, Q.; Zhang, Q. Effects of fragmentation on grassland plant diversity depend on the habitat specialization of species. Biol. Conserv. 2022, 275, 109773. [Google Scholar] [CrossRef]
- Liu, X.; Li, X.; Tan, Z.; Chen, Y. Zoning farmland protection under spatial constraints by integrating remote sensing, GIS and artificial immune systems. Int. J. Geogr. Inf. Sci. 2011, 25, 1829–1848. [Google Scholar] [CrossRef]
- Liu, X.; Liang, X.; Li, X.; Xu, X.; Ou, J.; Chen, Y.; Li, S.; Wang, S.; Pei, F. A future land use simulation model (FLUS) for simulating multiple land use scenarios by coupling human and natural effects. Landsc. Urban Plan. 2017, 168, 94–116. [Google Scholar] [CrossRef]
- Xia, L.; Yeh, A.G.O. Knowledge discovery for geographical cellular automata. Sci. China Ser. D: Earth Sci. 2005, 48, 1758–1767. [Google Scholar]
- Openshaw, S. Neural network, genetic, and fuzzy logic models of spatial interaction. Environ. Plan. A 1998, 30, 1857–1872. [Google Scholar] [CrossRef]
- Wang, F. The use of artificial neural networks in a geographical information systems for agricultural land suitability assessment. Environ. Urban Syst. 1994, 24, 265–284. [Google Scholar] [CrossRef]
- Zhou, J.; Civco, D. Using genetic learning neural networks for spatial decision making in GIS. Photogramm. Eng. Remote Sens. 1996, 62, 1287–1295. [Google Scholar]
- Zhu, S.H.; Shu, B.G.; Ma, X.D.; Liang, X.; Yao, Q. Research on the boundary delineation of urban land use growth based on the concept of “anti-planning” and FLUS model—Taking Jiawang District of Xuzhou City as an example. Geogr. Geogr. Inf. Sci. 2017, 33, 80–86+127. [Google Scholar]
- White, R.; Engelen, G. Cellular automata and fractal urban form: A cellular modelling approach to the evolution of urban land use patterns. Environ. Plan. A 1993, 25, 1175–1199. [Google Scholar] [CrossRef] [Green Version]
- Batty, M.; Xie, Y. From cells to cities. Environ. Plan. B 1994, 21, 531–548. [Google Scholar] [CrossRef]
- Wu, F. An experiment on the generic polycentricity of urban growth in a cellular automatic city. Environ. Plan. B 1998, 25, 103–126. [Google Scholar] [CrossRef]
- Liang, X.; Liu, X.P.; Li, D.; Zhao, H.; Chen, G.Z. Urban growth simulation by incorporating planning policies into a CA-based future land-use simulation model. Int. J. Geogr. Inf. Sci. 2018, 32, 2294–2316. [Google Scholar] [CrossRef]
- Liang, X.; Liu, X.P.; Li, X.; Chen, Y.M.; Tian, H.; Yao, Y. Delineating multi-scenario urban growth boundaries with a CA-based FLUS model and morphological method. Landsc. Urban Plan. 2018, 177, 47–63. [Google Scholar] [CrossRef]
- Liang, X.; Liu, X.P.; Chen, G.L.; Leng, J.Y.; Wen, Y.Y.; Chen, G.Z. Coupling fuzzy clustering and cellular automata based on local maxima of development potential to model urban emergence and expansion in economic development zones. Int. J. Geogr. Inf. Sci. 2020, 34, 1930–1952. [Google Scholar] [CrossRef]
- Li, J.; Charles, L.S.; Yang, Z.; Du, G.; Fu, S. Differential mechanisms drive species loss under artificial shade and fertilization in the alpine meadow of the tibetan plateau. Front. Plant Sci. 2022, 13, 832473. [Google Scholar] [CrossRef] [PubMed]
- Deng, Y.J.; Yao, S.B.; Huo, M.Y.; Zhang, T.Y.; Lu, Y.N.; Gong, Z.W.; Wang, Y.F. Assessing the effects of the Green for Grain Program on ecosystem carbon storage service by linking the InVEST and FLUS models: A case study of Zichang county in hilly and gully region of Loess Plateau. J. Nat. Resour. 2020, 35, 826–844. [Google Scholar]
- Li, L.; Hu, R.; Li, S. Scenario simulation of low-carbon land use in Beijing City based on the improved FLUS model. Remote Sens. Nat. Resour. 2022, 1–9. [Google Scholar]
- Fang, J.; Guo, Z.D.; Piao, S.L.; Chen, A.P. Estimation of terrestrial vegetation carbon sink in china from 1981 to 2000. Sci. Sin. (Terrae) 2007, 6, 804–812. [Google Scholar]


| Training Sample Name | Data Type | Rows | Columns |
|---|---|---|---|
| Status of land use in Shenyang in 2010.tif | Int8 | 7184 | 7740 |
| Elevation.tif | Float16 | 7184 | 7740 |
| slope.tif | Float32 | 7184 | 7740 |
| Distance to nearest river.tif | Float32 | 7184 | 7740 |
| Distance to nearest highway.tif | Float32 | 7184 | 7740 |
| Distance to nearest rail.tif | Float32 | 7184 | 7740 |
| Distance to nearest city.tif | Float32 | 7184 | 7740 |
| Distance to nearest county seat.tif | Float32 | 7184 | 7740 |
| Aspect.tif | Float32 | 7184 | 7740 |
| Basic Data Required for Simulation | Data Content | Type of Data |
|---|---|---|
| Land use data for initial year | Status quo data of land use in Shenyang in 2010 | raster data |
| Suitability Probabilistic Data | The output data after ANN training | raster data |
| Restricted data to constrain land use changes | Unrestricted area in this study | raster data |
| Ground Type | Cropland | Forest | Grassland | Water | Barren | Impervious | Wetland |
|---|---|---|---|---|---|---|---|
| Cropland | 1 | 1 | 1 | 0 | 0 | 1 | 0 |
| Forest | 1 | 1 | 0 | 0 | 0 | 0 | 0 |
| Grassland | 1 | 1 | 1 | 0 | 0 | 1 | 0 |
| Water | 0 | 0 | 0 | 1 | 0 | 1 | 1 |
| Barren | 1 | 1 | 1 | 0 | 1 | 1 | 0 |
| Impervious | 0 | 0 | 0 | 0 | 0 | 1 | 0 |
| Wetland | 0 | 0 | 0 | 0 | 0 | 0 | 1 |
| Ground Type | Cropland | Forest | Grassland | Water | Barren | Impervious | Wetland |
|---|---|---|---|---|---|---|---|
| Cropland | 1 | 1 | 1 | 0 | 0 | 1 | 0 |
| Forest | 1 | 1 | 0 | 0 | 0 | 1 | 0 |
| Grassland | 1 | 1 | 1 | 0 | 0 | 1 | 0 |
| Water | 0 | 0 | 0 | 1 | 0 | 1 | 1 |
| Barren | 1 | 1 | 1 | 0 | 1 | 1 | 0 |
| Impervious | 0 | 0 | 0 | 0 | 0 | 1 | 0 |
| Wetland | 0 | 0 | 0 | 0 | 0 | 0 | 1 |
| Cropland | Forest | Grassland | Water | Barren | Impervious | Wetland | |
|---|---|---|---|---|---|---|---|
| run its course | 0.1 | 0.6 | 0.5 | 0.2 | 0.3 | 0.7 | 0.4 |
| Economic priority | 0.1 | 0.5 | 0.5 | 0.1 | 0.1 | 0.9 | 0.1 |
| Forestry carbon sequestration transaction | 0.1 | 0.9 | 0.8 | 0.1 | 0.1 | 0.7 | 0.1 |
Disclaimer/Publisher’s Note: The statements, opinions and data contained in all publications are solely those of the individual author(s) and contributor(s) and not of MDPI and/or the editor(s). MDPI and/or the editor(s) disclaim responsibility for any injury to people or property resulting from any ideas, methods, instructions or products referred to in the content. |
© 2023 by the authors. Licensee MDPI, Basel, Switzerland. This article is an open access article distributed under the terms and conditions of the Creative Commons Attribution (CC BY) license (https://creativecommons.org/licenses/by/4.0/).
Share and Cite
Feng, S.; Chen, K. The Impact of Forestry Carbon Sink on Land Use Space Based on FLUS Model. Processes 2023, 11, 608. https://doi.org/10.3390/pr11020608
Feng S, Chen K. The Impact of Forestry Carbon Sink on Land Use Space Based on FLUS Model. Processes. 2023; 11(2):608. https://doi.org/10.3390/pr11020608
Chicago/Turabian StyleFeng, Shuo, and Ke Chen. 2023. "The Impact of Forestry Carbon Sink on Land Use Space Based on FLUS Model" Processes 11, no. 2: 608. https://doi.org/10.3390/pr11020608