Article

Experimental Study on CO2 Geochemical Reaction Characteristics in Marine Weakly Consolidated Sandstone Saline Aquifers

1
Shenzhen Branch of CNOOC China Limited, Shenzhen 518000, China
2
School of Petroleum Engineering, China University of Petroleum (East China), Qingdao 266580, China
3
Key Laboratory of Unconventional Oil & Gas Development, China University of Petroleum (East China), Ministry of Education, Qingdao 266580, China
*
Author to whom correspondence should be addressed.
Processes 2023, 11(12), 3345; https://doi.org/10.3390/pr11123345
Submission received: 19 October 2023 / Revised: 28 November 2023 / Accepted: 29 November 2023 / Published: 30 November 2023
(This article belongs to the Special Issue Trends in Carbon Capture, Storage and Utilisation)

Abstract

:
Geological storage is one of the most important measures to reduce carbon emissions. The newly developed oilfield A in the Pearl River Mouth Basin of the South China Sea is associated with a large amount of CO2 with a purity of up to 95%. Two weakly consolidated sandstone saline aquifers located above the oil reservoir can be used for CO2 storage, but the CO2 geochemical reaction characteristics in the aquifers should be investigated clearly, which may cause significant damage to the physical properties of the reservoirs and caprocks of the aquifers. In this paper, static CO2 geochemical reaction experiments and rock thin section identifications were carried out using drill cuttings and sidewall cores, respectively. A numerical simulation was conducted according to the reactor conditions to explore the equilibrium state of the CO2 geochemical reaction. Through these studies, the characteristics of the geochemical reaction, its impact on the physical properties of the formation, and the CO2 storage potential by mineral trapping in the target aquifers were revealed. The results show that the two saline aquifers have similar physical properties. The reservoirs are mostly made up of fine-to-medium-grained sandstones as quartz arenite with a considerable amount of feldspar, which can provide favorable pore space for CO2 storage, while the caprocks are fine-grained felsic sedimentary rocks that can have a good sealing effect. However, both the reservoirs and caprocks contain a certain amount of carbonate and clay minerals. Mineral dissolution dominates in the CO2 geochemical reaction process, and more Ca2+ and Mg2+ is released into the formation water. The theoretical maximum CO2 mineral trapping capacity in the aquifers is 0.023–0.0538 mol/100 g rock, but due to the dynamic equilibrium of the geochemical reaction, the amount of mineralized CO2 in most of the rock samples is negative, and the average utilization factor is only −55.43%. As a result, the contribution of mineral trapping to the CO2 storage capacity takes −0.32%, which can be ignored. In the future, it is necessary to conduct detailed research to reveal the effect of a CO2 geochemical reaction on storage safety, especially in offshore weakly consolidated sandstone saline aquifers, which could be important sites for large-scale CO2 storage in China.

Graphical Abstract

1. Introduction

CO2 capture, utilization, and storage (CCUS) are important technical measures to reduce carbon emissions [1,2]. CO2 discharged from large-scale gas sources during the use of fossil fuels can be captured using chemical absorption, physical adsorption, or membrane separation methods. Purified CO2 can be used as an industrial product for chemical conversion, desalination, and enhanced oil/gas recovery (EOR/EGR) [3]. The amount of CO2 used in industrial activities is relatively small. CO2 injection underground can achieve large-scale geological storage for permanent disposal. Oil and gas reservoirs, saline aquifers, and deep coal beds can be used as geological structures for CO2 storage. The injected CO2 can be sequestered in geological structures mainly by structural trapping, dissolution trapping, residual gas trapping, and mineral trapping. In coalbed and shale formations, the adsorption trapping mechanism will also take effect [4,5,6]. Among these CO2 trapping mechanisms, structural trapping is the most important, which dominates in the injection and the long-term storage process, but it heavily depends on the sealing properties of caprock. Relatively, mineral trapping is the safest mechanism that can convert CO2 into stable solid carbonate minerals [7,8]. We are mostly concerned with the safety of CO2 geological storage. The failure of trapping mechanisms will induce a CO2 leakage risk. CO2 injection can cause formation deformation, caprock fracturing, fault opening, formation erosion, and wellbore corrosion. When the failure condition is reached, CO2 leakage channels will be generated in the geological structure, and then the risk of CO2 leakage occurs. Actually, CO2 storage in geological structures is a thermal–hydrological–mechanical–chemical (THMC) coupling process. The CO2 leakage risk evaluation should consider more coupled factors, such as the effect of CO2 geochemical reactions on structural trapping [9,10,11].
Mineral trapping of CO2 is mainly achieved through a CO2 geochemical reaction. Many studies have been carried out to reveal the CO2 geochemical reaction characteristics and mineral storage capacities under different reservoir conditions [12,13,14,15]. The numerical simulation results of Zhang (2011) indicated that a CO2 geochemical reaction in the clean sandstone aquifer (the main rock mineral is quartz with a small amount of calcite and feldspar) can only contribute less than 2% to CO2 storage potential. When the saline aquifer lithology is sandstone or carbonate rock containing a large amount of soluble minerals such as calcite, clay, and feldspar, the dissolution/precipitation reaction of rock minerals has an important impact on CO2 storage, and the contribution of a geochemical reaction to CO2 storage is determined by the specific interaction process and time between CO2, formation water, and rock minerals, which can reach up to 4–23% [12]. In recent years, the advantages of CO2 storage in basalt reservoirs have attracted more and more attention [13,14,15]. This kind of reservoir contains a large amount of carbon fixation minerals that can release bivalent cations Ca, Mg, and Fe to react with CO2. All CO2 can be converted into carbonate minerals in a short period, which can reduce the dependence of CO2 trapping on traditional caprock sealing properties. Injecting CO2 into basalt reservoirs for storage is an important development direction for mineral trapping. Basalts are widely distributed in the United States, India, Iceland, and other countries [16,17]. Terrestrial basalts in China are mainly distributed in the basin margin, which can provide a huge potential for CO2 mineralization and storage and have broad application prospects [14]. Based on the current published studies, it can be concluded that different geological structures have different CO2 geochemical reaction characteristics and mineral storage capacities depending on the specific geological conditions. Geochemical reaction analysis and potential evaluation is an important research direction for a new structure for CO2 storage.
Compared with other structures, saline aquifers are the most promising site for large-scale CO2 storage projects because of their wide distribution and large storage capacity [18,19,20,21]. Offshore saline aquifers are often selected to dispose of the associated CO2 in the offshore oil and gas fields, such as Sleipner, Snohvit, and Gorgon projects, which have the unique advantages of being close to the CO2 gas source and far from densely populated places [22,23,24,25]. In China, CO2 geological storage is preferentially carried out in oil reservoirs, which can obtain additional income from EOR. Only two small-scale pilot experiments of CO2 storage in saline aquifers have been carried out, in the Ordos basin and Junggar area, respectively [26,27]. In recent years, China National Offshore Oil Corporation (CNOOC) has been planning China’s first CO2 storage project in an offshore saline aquifer. The CO2 comes from the associated gas in the newly developed oil field A in the Pearl River Mouth Basin in the eastern South China Sea. CO2 will be purified on a platform and injected into the nearby saline aquifers for storage. Two aquifers are available. Due to the high content of carbonate and clay minerals, and the weak cementation of sandstone, the CO2 geochemical reaction may have a significant effect on the aquifer’s physical properties and further affect the CO2 storage safety, which needs to be investigated as soon as possible.
In this study, typical drill cuttings and sidewall cores were sampled at different depths from the reservoirs and caprocks of the two aquifers. Drill cuttings were used for static CO2 geochemical reaction experiments to obtain the geochemical reaction pathway based on the change in rock mineral and formation water compositions. Complete sidewall cores were used for rock thin section identification to observe the CO2 corrosion to rock pore throat. Numerical simulation was applied to explore the equilibrium state of the CO2 geochemical reaction. Through these studies, the characteristics of the geochemical reaction, its impact on the physical properties of the formation, and the CO2 storage potential by mineral trapping in the target aquifers were revealed. Finally, the impact of the geochemical reaction on CO2 storage safety was discussed.

2. Geological Setting

China’s eastern coastline is 32,600 km long, inhabiting 40% of the Chinese population and responsible for 60% of gross domestic product (GDP). A large number of CO2 emission sources such as thermal power plants, steel plants, and chemical plants have been constructed. There are eight big basins distributed from north to south along the eastern coast [28]. A lot of offshore oil and gas fields are located there. Some oil and gas fields in the basins of the South China Sea are associated with a great amount of CO2. The CO2 content in natural gas can be up to 10–65% in DF1-1 and YC13-1 gas fields [29,30]. The captured CO2 does not have the technical conditions or time window for EOR or being reinjected back to the original reservoirs. To dispose of the associated CO2, the offshore saline aquifers near the oil and gas fields are undoubtedly one of the best storage sites.
In the designed offshore CO2 storage project, the CO2 is from the gas cap of oilfield A located in the Pearl River Mouth Basin of the South China Sea. The CO2 content is up to 95%, and it is further purified and injected into the nearby saline aquifers for storage. The peak injection rate of CO2 is about 300,000 tons/a, and the cumulative CO2 injection will exceed 1.5 million tons within a 20-year project period. There are two saline aquifers above the oil reservoir. Aquifer Y is buried at a depth of 800–900 m, and the reservoir temperature and pressure are 52.4 °C and 8.39 MPa, respectively, while aquifer H is buried at a deeper depth of 1100–1200 m, and the reservoir temperature and pressure are 66.9 °C and 11.64 MPa, respectively. The reservoirs have excellent porosity and permeability for CO2 injection, seepage, and storage. These two aquifers are all anticline structures, and the structural trapping mechanism will play an important role. Stably distributed mudstone and mud–sand interlayers with a large thickness can be good caprocks to prevent the CO2 in the reservoirs from escaping. In addition, saline aquifers Y and H are of moderate size and have a large potential to store all the CO2. However, it should be noted that the aquifers are marine weakly consolidated sandstone reservoirs. Due to the shallow burial depth and poor compaction degree, the rock mechanical strength of the aquifers is relatively low. The CO2 geochemical reaction may have a great impact on the aquifer’s physical properties [31,32,33]. It can not only convert part of CO2 into carbonate minerals to achieve permanent trapping but also change the porosity, permeability, and mechanical properties of the reservoir and caprock, which may greatly impact the safety of structural storage and other mechanisms [34,35,36,37].

3. Methodology

3.1. Preparation of Samples

The flowchart of the methodology of this study is shown in Figure 1. Three parts are involved, including sample preparation, laboratory experiment, and numerical simulation. To carry out the laboratory experiment, the drill cuttings, sidewall cores, formation water, and CO2 gas were prepared first.
(1)
Drill cuttings: The drill cuttings in the typical exploration well located at the top of the anticline drilled through aquifers Y and H were used for static CO2 geochemical reaction experiments. Ten typical samples at different depths were selected. Five samples are from aquifer Y, while the other five samples are from aquifer H. There are 2 caprock samples and 3 reservoir samples for each aquifer. The sample number represents the sampling depth of cuttings from shallow to deep, as shown in Table 1.
(2)
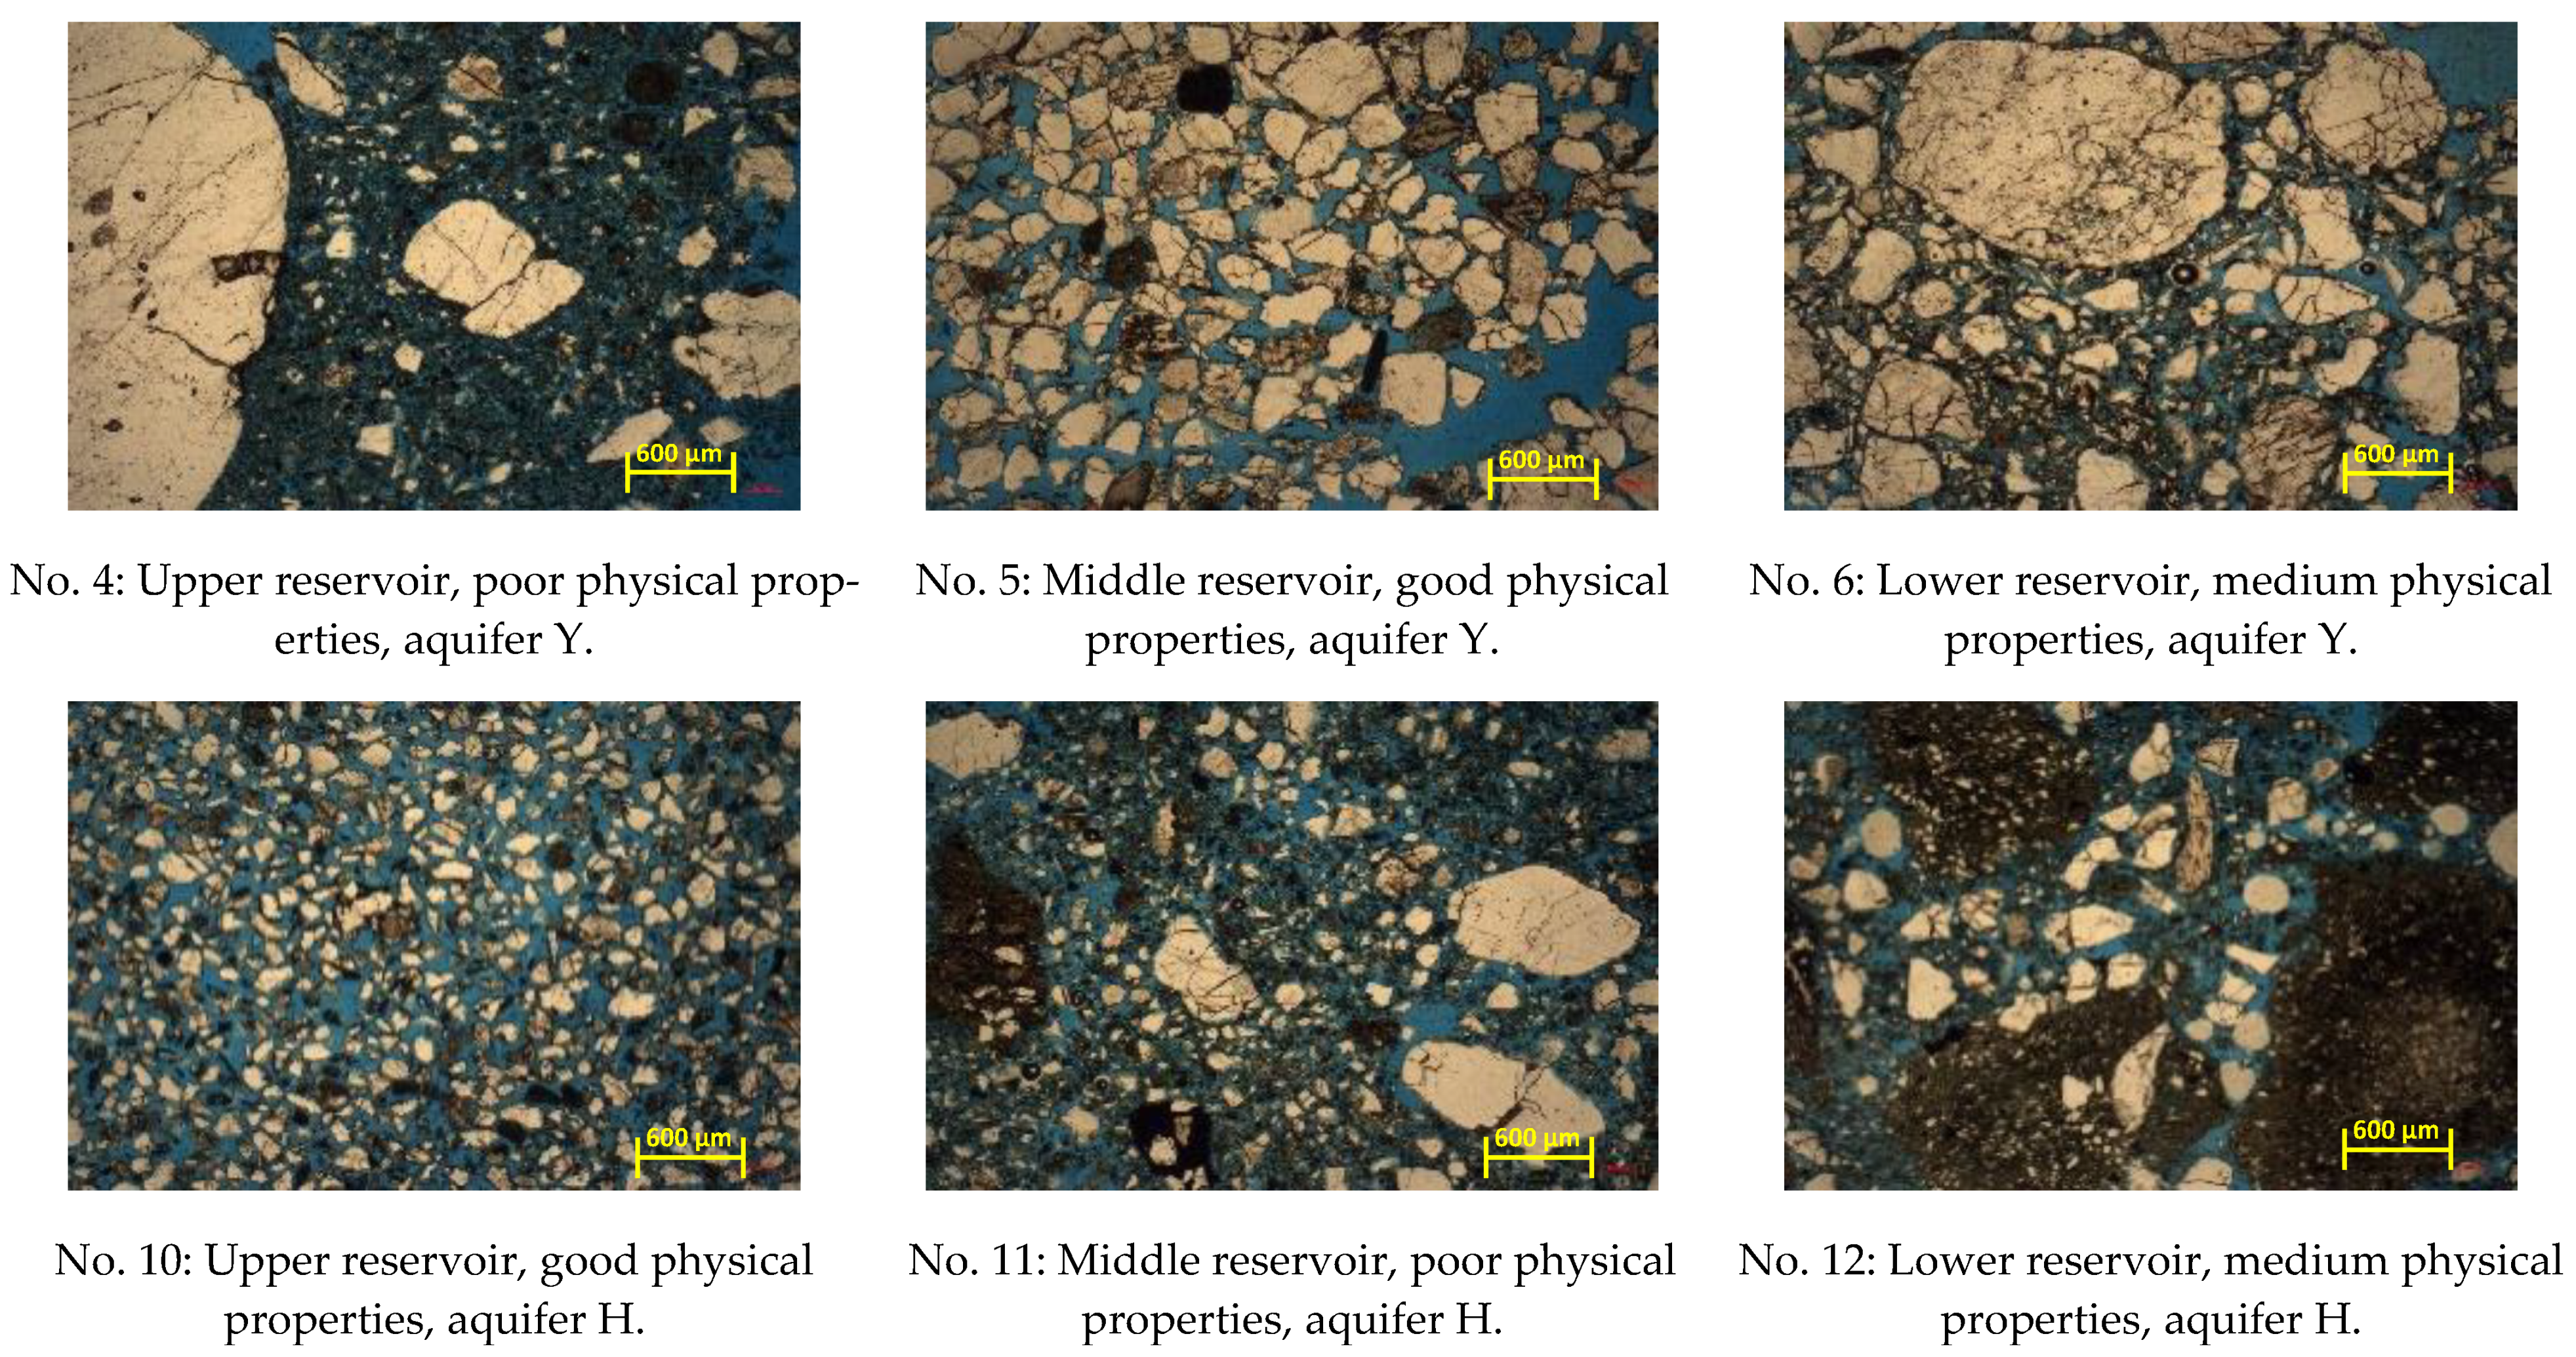
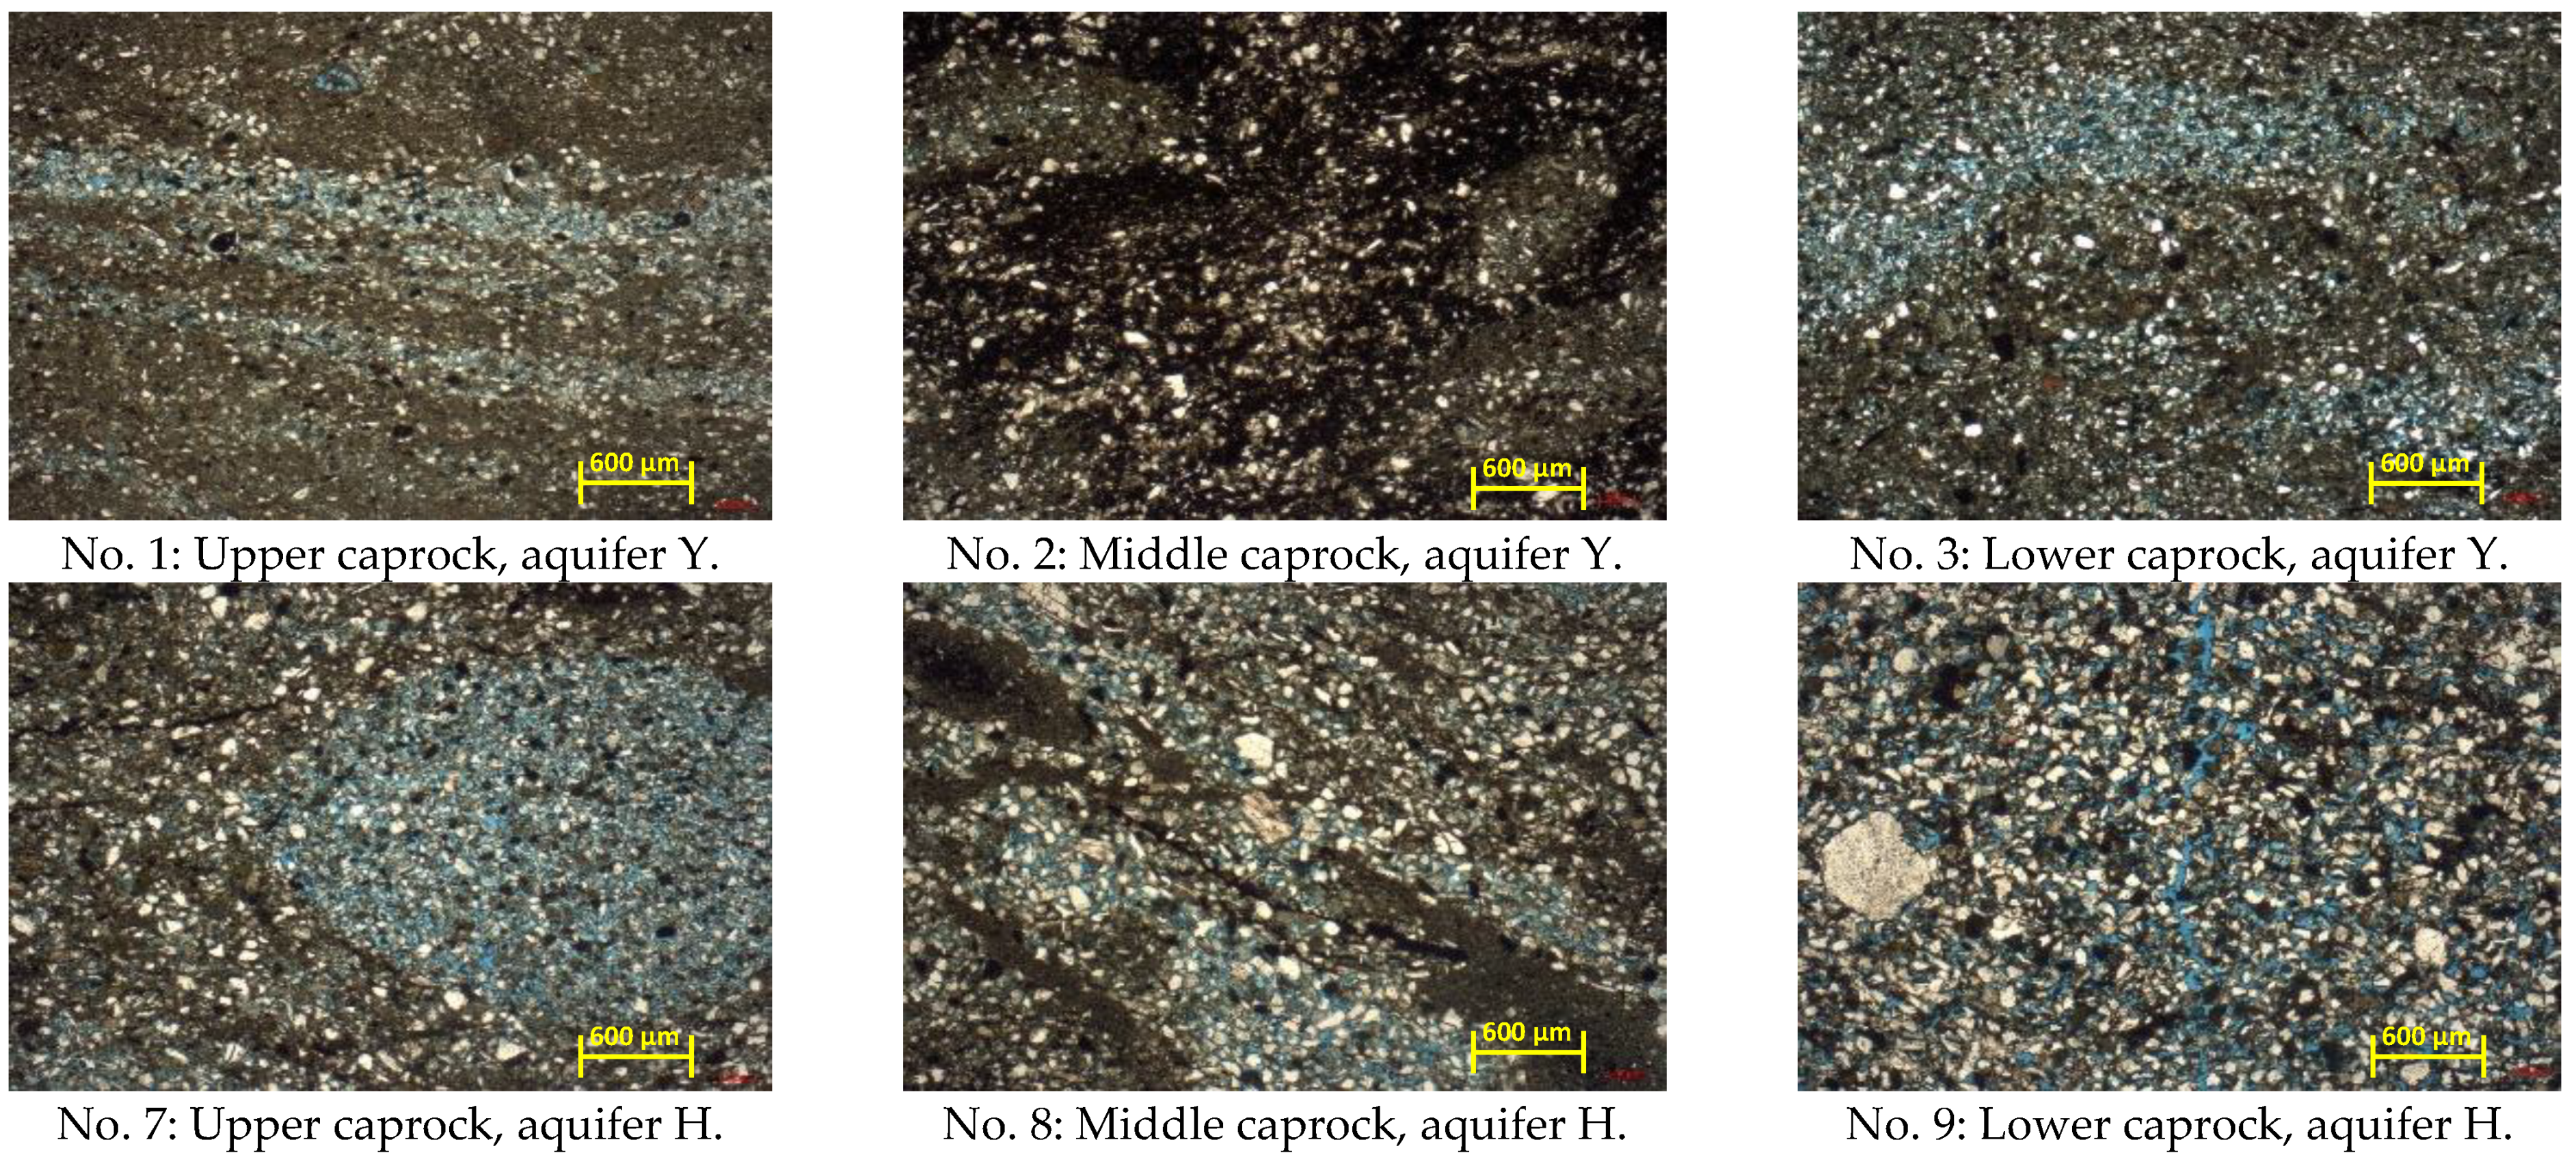
Sidewall cores: The complete sidewall cores sampled from an exploration well in a nearby block were used for thin section identification before and after the CO2 geochemical reaction. The nearby block has the same sedimentary environment and reservoir physical properties as aquifers Y and H. Twelve typical samples at different depths were selected, of which six samples stand for aquifer Y and the other six samples stand for aquifer H. There are 3 caprock samples and 3 reservoir samples for each aquifer. The sample number also represents the sampling depth of the sidewall cores from shallow to deep and corresponds to the depth of drill cuttings one by one, as shown in Table 1.
(3)
Formation water: The real formation waters taken from the aquifers Y and H were used for the CO2 geochemical reaction experiment, with a salinity of 37,806 mg/L and 36,991 mg/L, respectively, and their main ion compositions are similar, as shown in Table 2.
(4)
Gas sample: The CO2 content of associated gas in oil reservoir A is up to 95%. After purification, the purity of CO2 will be further improved to larger than 99%; hence, pure CO2 (99.99%) was purchased from Yantai Deyi Gas Co., Ltd. for the experiment.
Using the above samples, two kinds of experiments were designed to investigate the CO2 geochemical reaction characteristics and their effect on the rock physical properties in the target aquifers, as shown in Table 3. There are 10 sets of static CO2 geochemical reaction experiments and 12 sets of thin section identification which use drill cuttings and sidewall cores, respectively. The rock samples were chosen carefully at different depths, and the reservoir samples cover good, medium, and poor physical properties, which can help us to compare the CO2 geochemical reaction characteristics in the vertical direction.

3.2. Analytical Methods

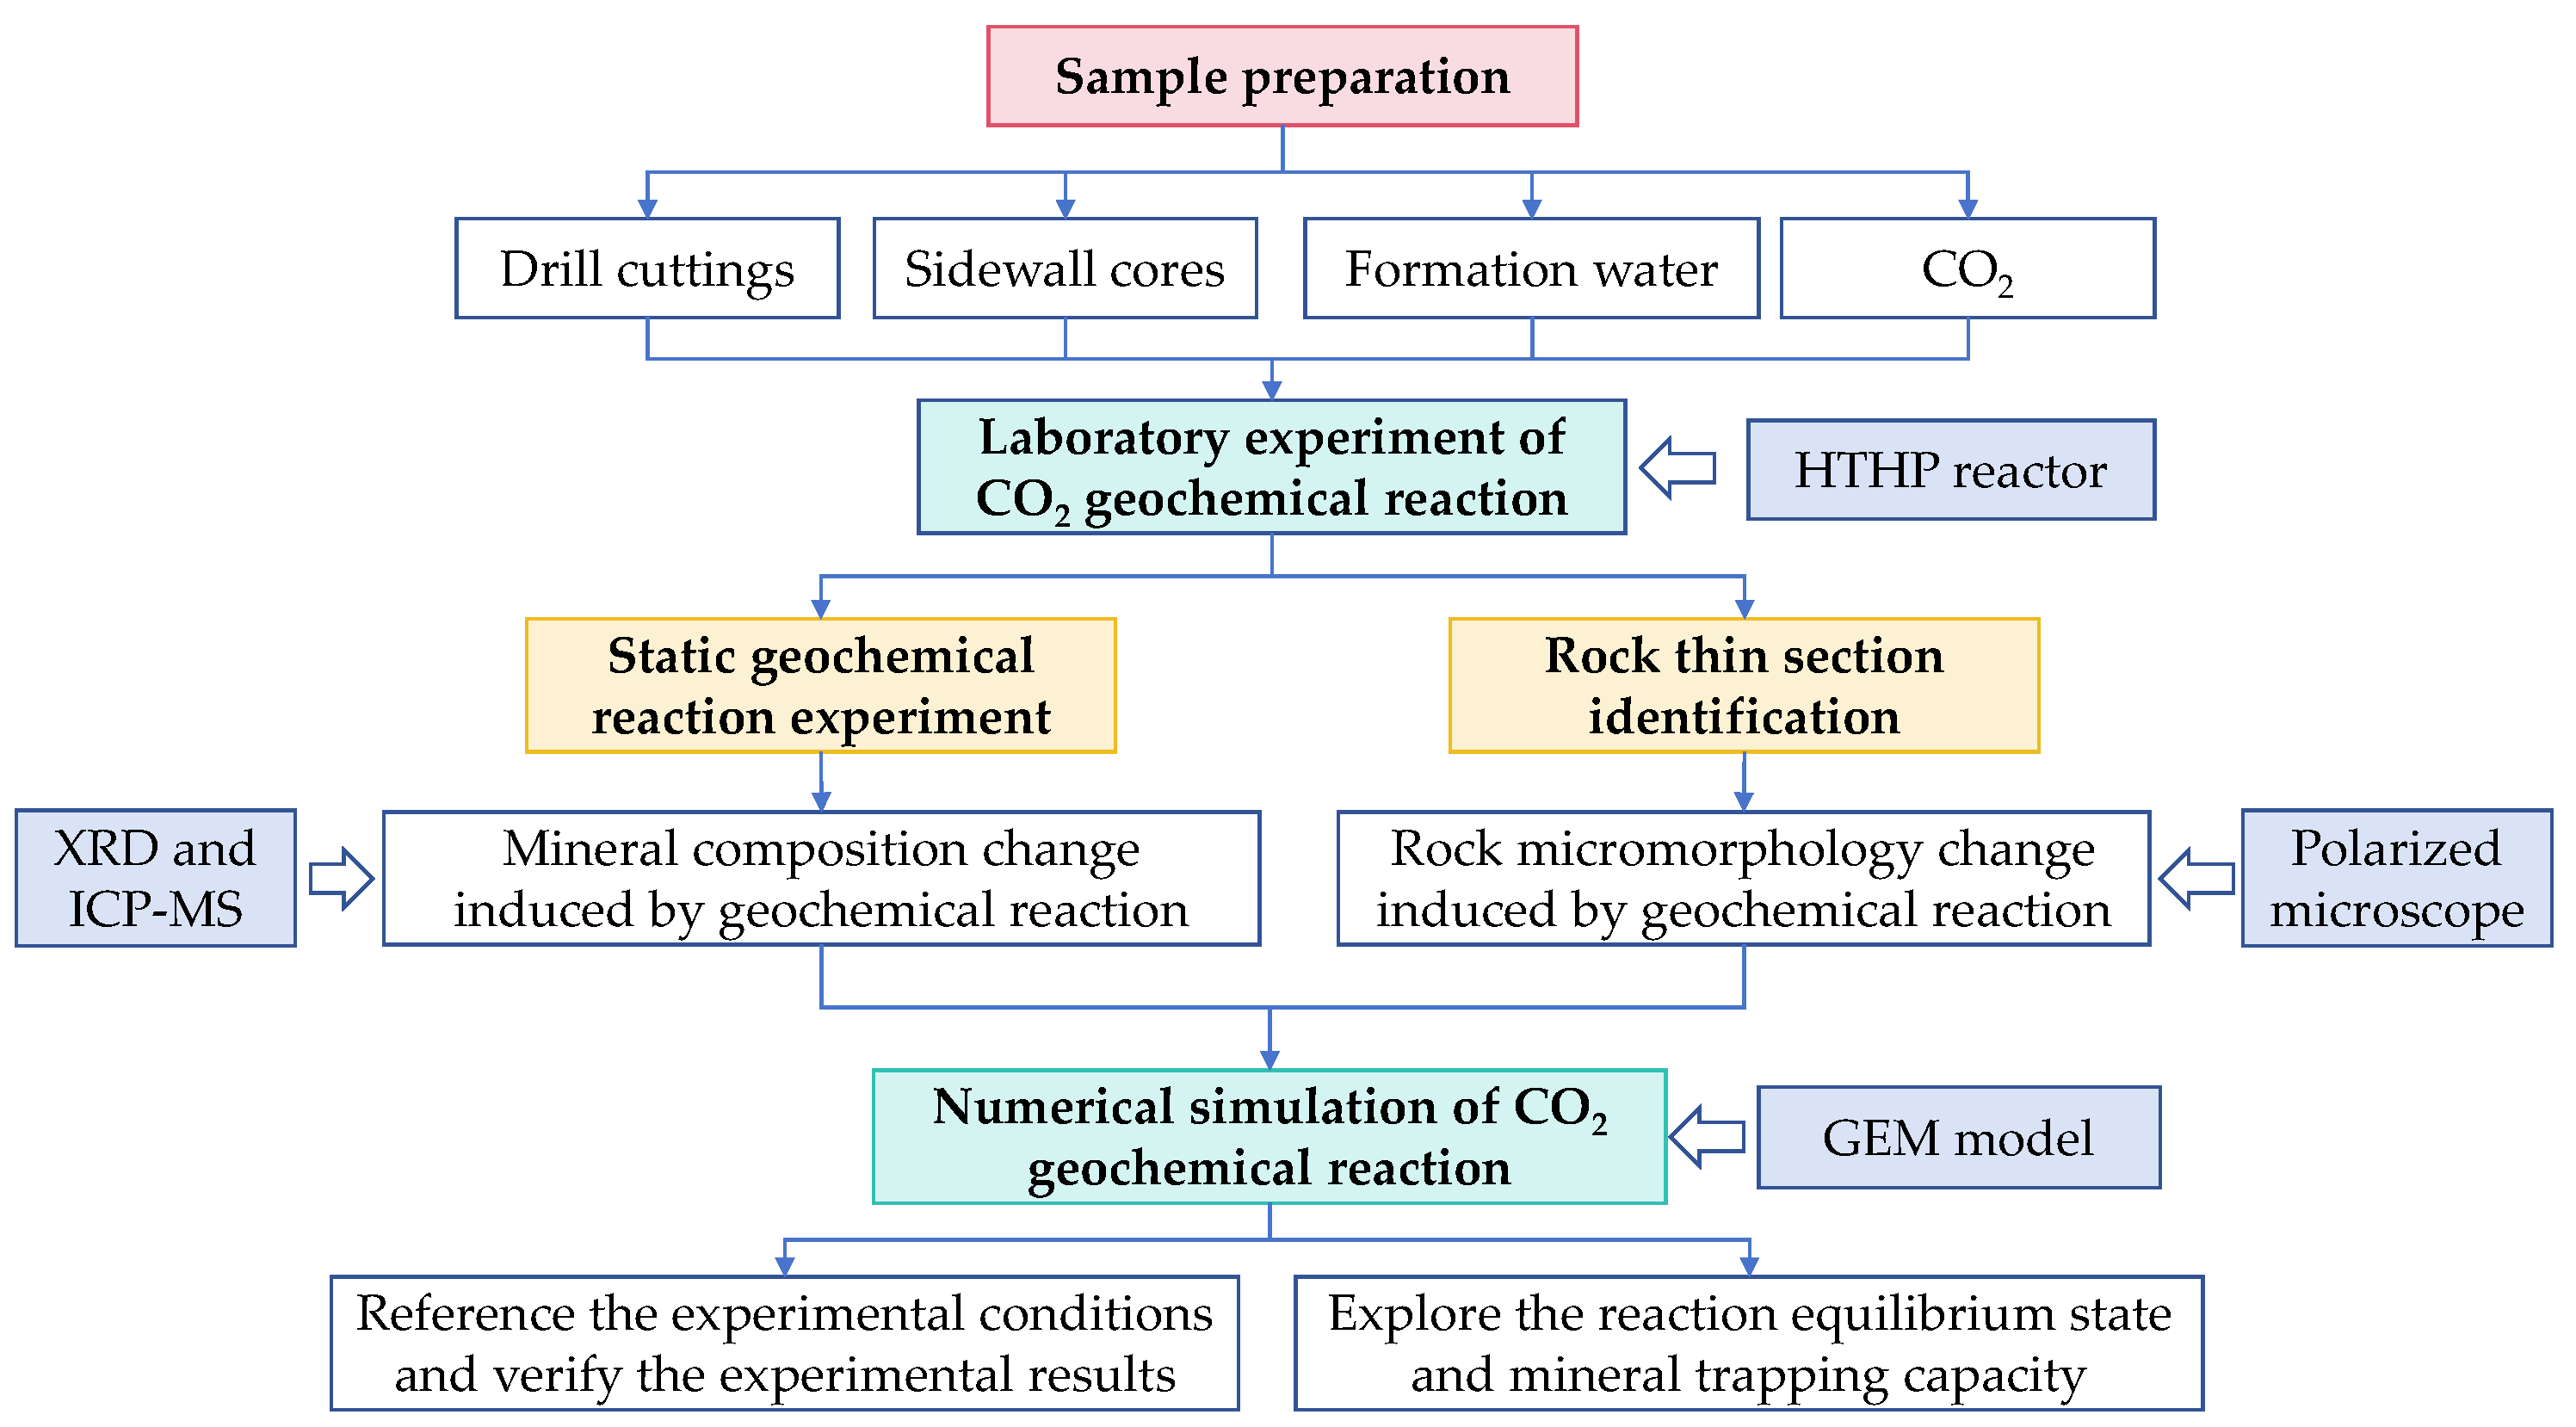
3.2.1. Static CO2 Geochemical Reaction Experiment

The static CO2 geochemical reaction experiment aims to reveal the mineral composition change in rock induced by the CO2 geochemical reaction. The main experimental equipment is shown in Figure 2. It is mainly composed of a reactor, incubator, CO2 gas cylinder, and booster pump. The effective volume of the reactor is 200 mL. The maximum working pressure and working temperature are 30 MPa and 150 °C, respectively. The maximum working temperature of the thermotank is 300 °C with a control accuracy of ±0.1 °C. There are two sensors installed at the top of the reactor for P-T monitoring. The temperature sensor has a measuring range of 0–300 °C with an accuracy of ±0.1 °C, while the pressure sensor has a measuring range of 0–60 MPa with an accuracy of ±0.1 MPa. The inlet of the sampling pipeline is immersed below the gas–water interface with a filter screen to prevent cutting powder from blocking the pipeline during the sampling process.
Limited by the contact surface area, the geochemical reaction process of CO2 in the pores of rocks is usually slow. To accelerate the reaction rate and shorten the experimental time, the drill cutting samples were ground into a powder with a certain particle size before the experiment. The specific steps are as follows [38,39]:
(1)
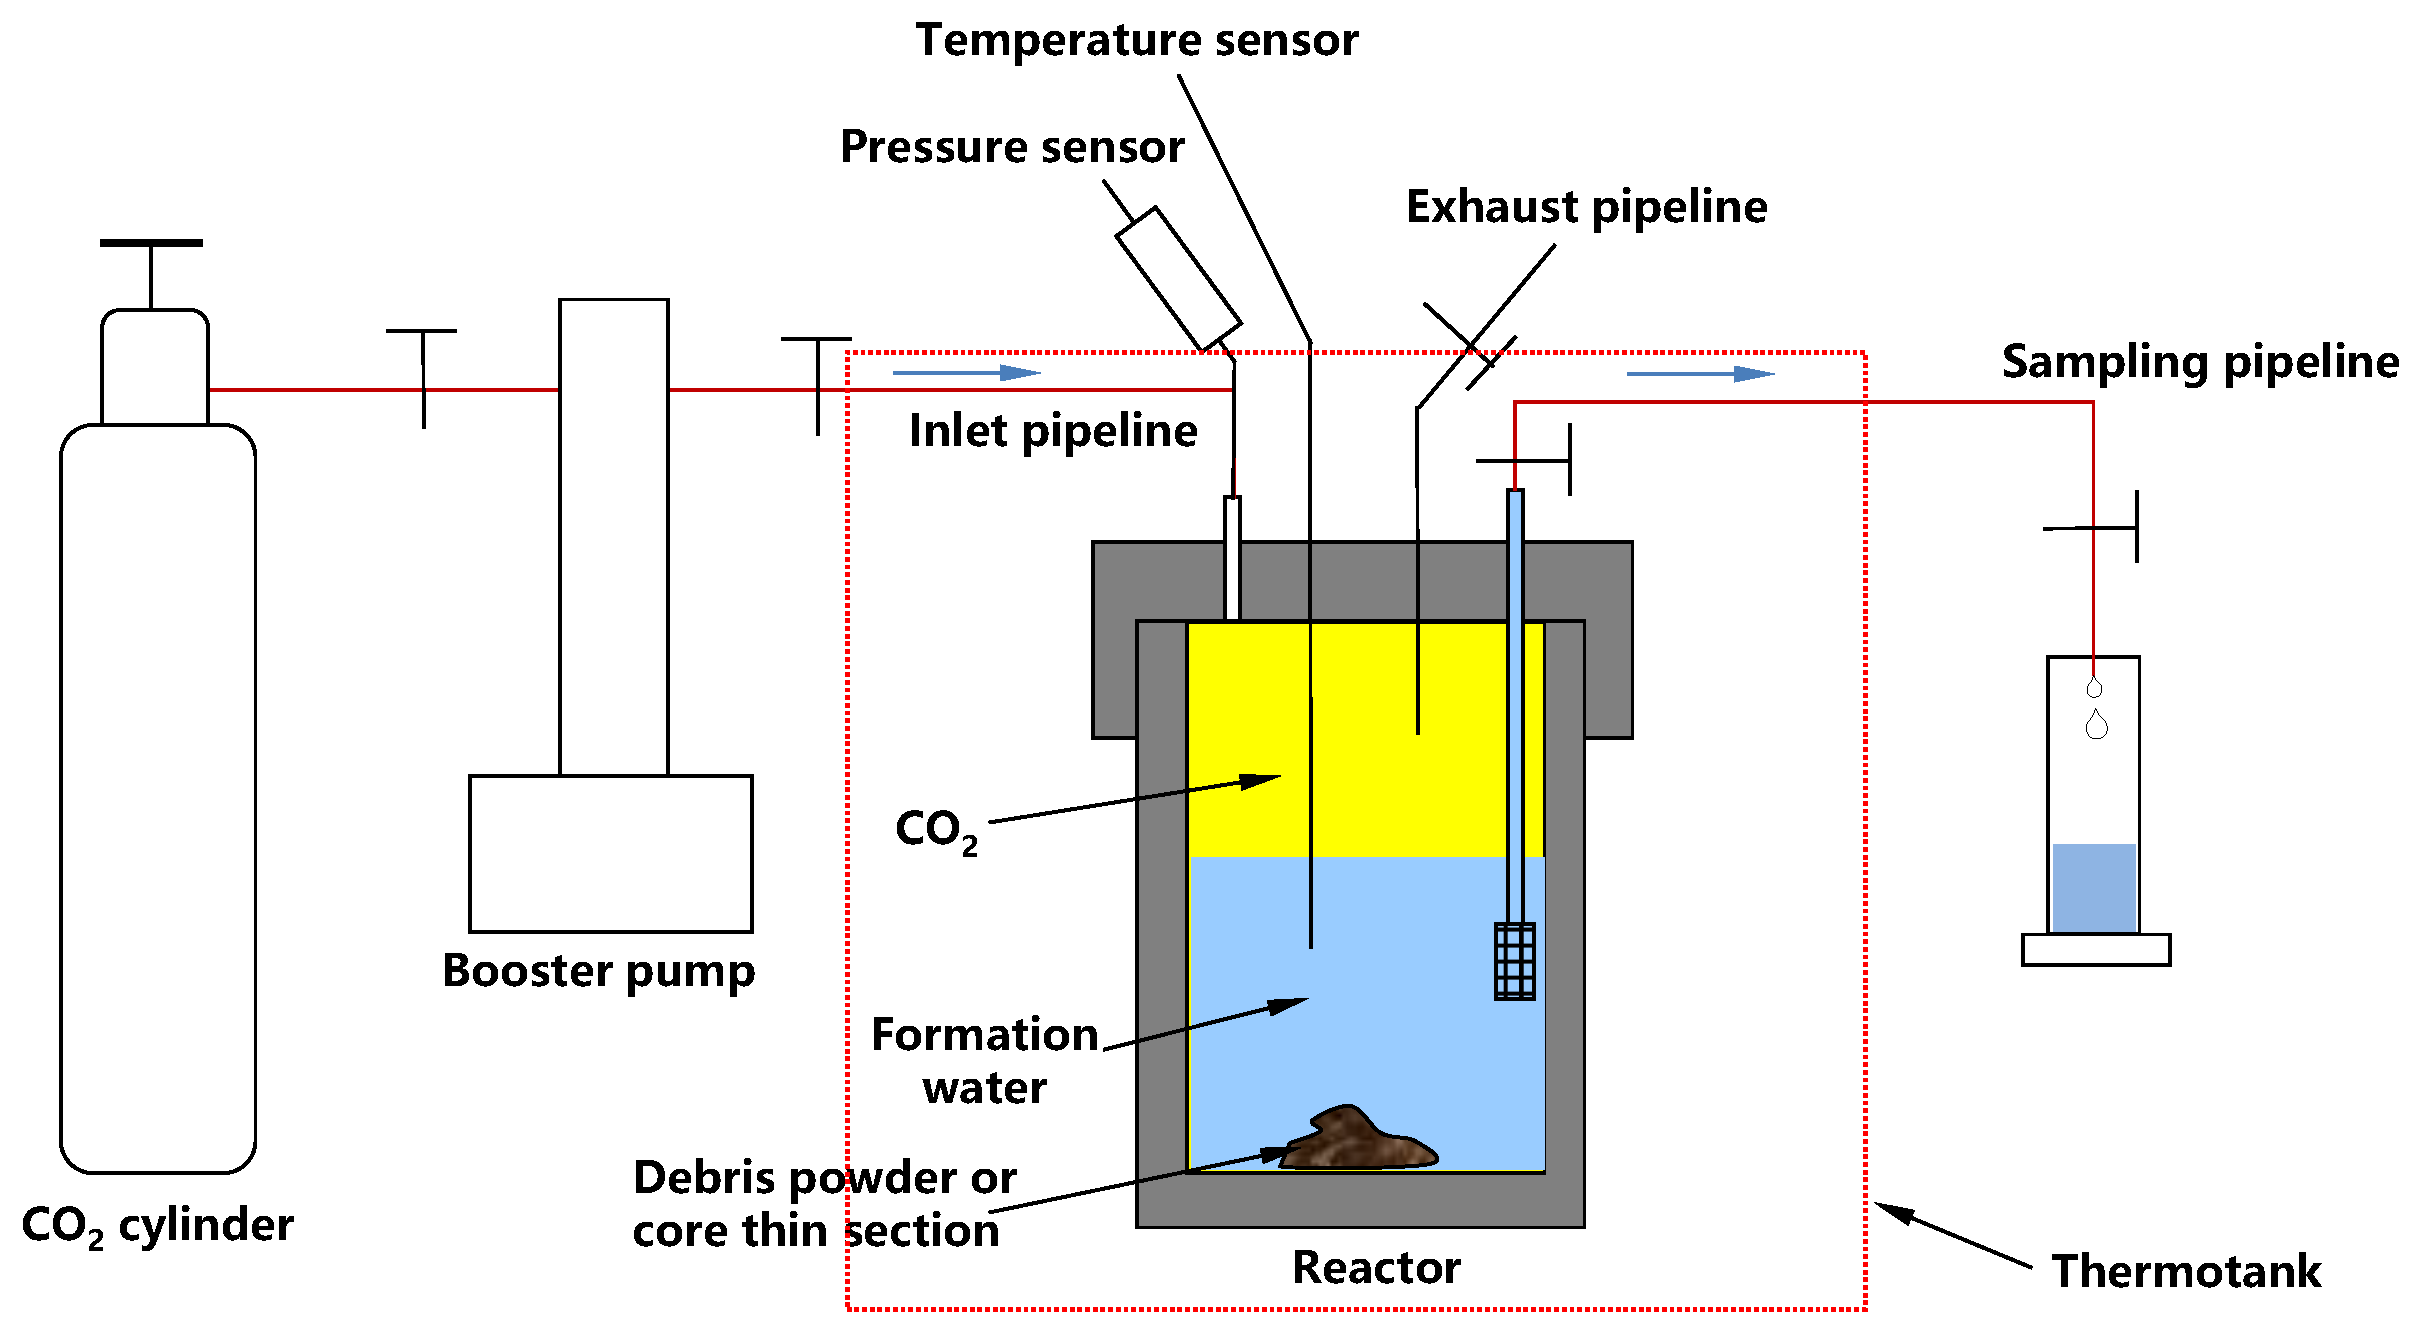
Experimental preparation: (a) The cuttings were cleaned using deionized water to remove the residual drilling mud, dried at 90 °C, and ground into a powder with an average particle size of 200 mesh (45–125 μm) for use. (b) In total, 20 g of cutting powder was taken to analyze the mineral compositions of whole rock and clay minerals using the X-ray diffractometer (XRD) produced by PANalytical B.V. (Model X’Pert PRO MPD, Cu target, and manual mineral identification). (c) In total, 30 g of cutting powder with 150 mL of formation water was put into the reactor, the reactor was sealed with the upper air vacuumed, high-pressure CO2 was injected into the reactor, and the reactor was put into the thermotank for heating; finally, the P and T of the reactor were stabilized at the design values to let the CO2 react with the formation water and cutting powder.
(2)
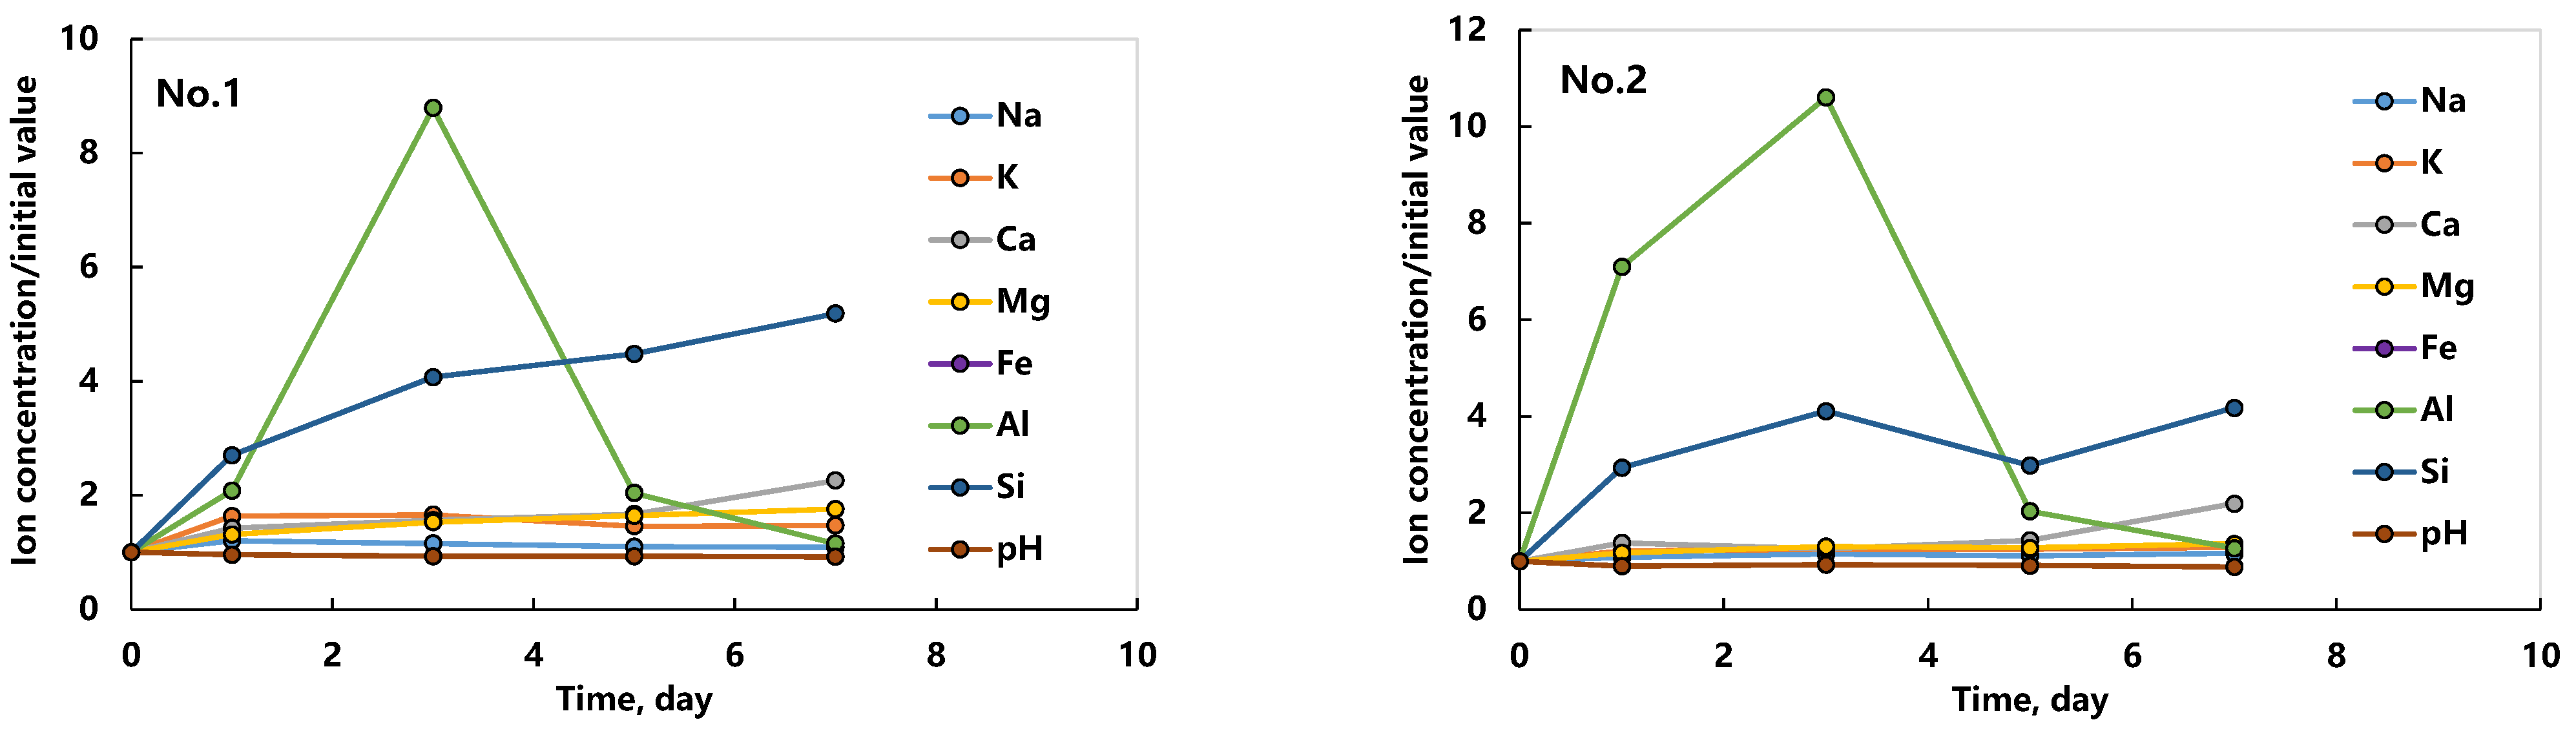
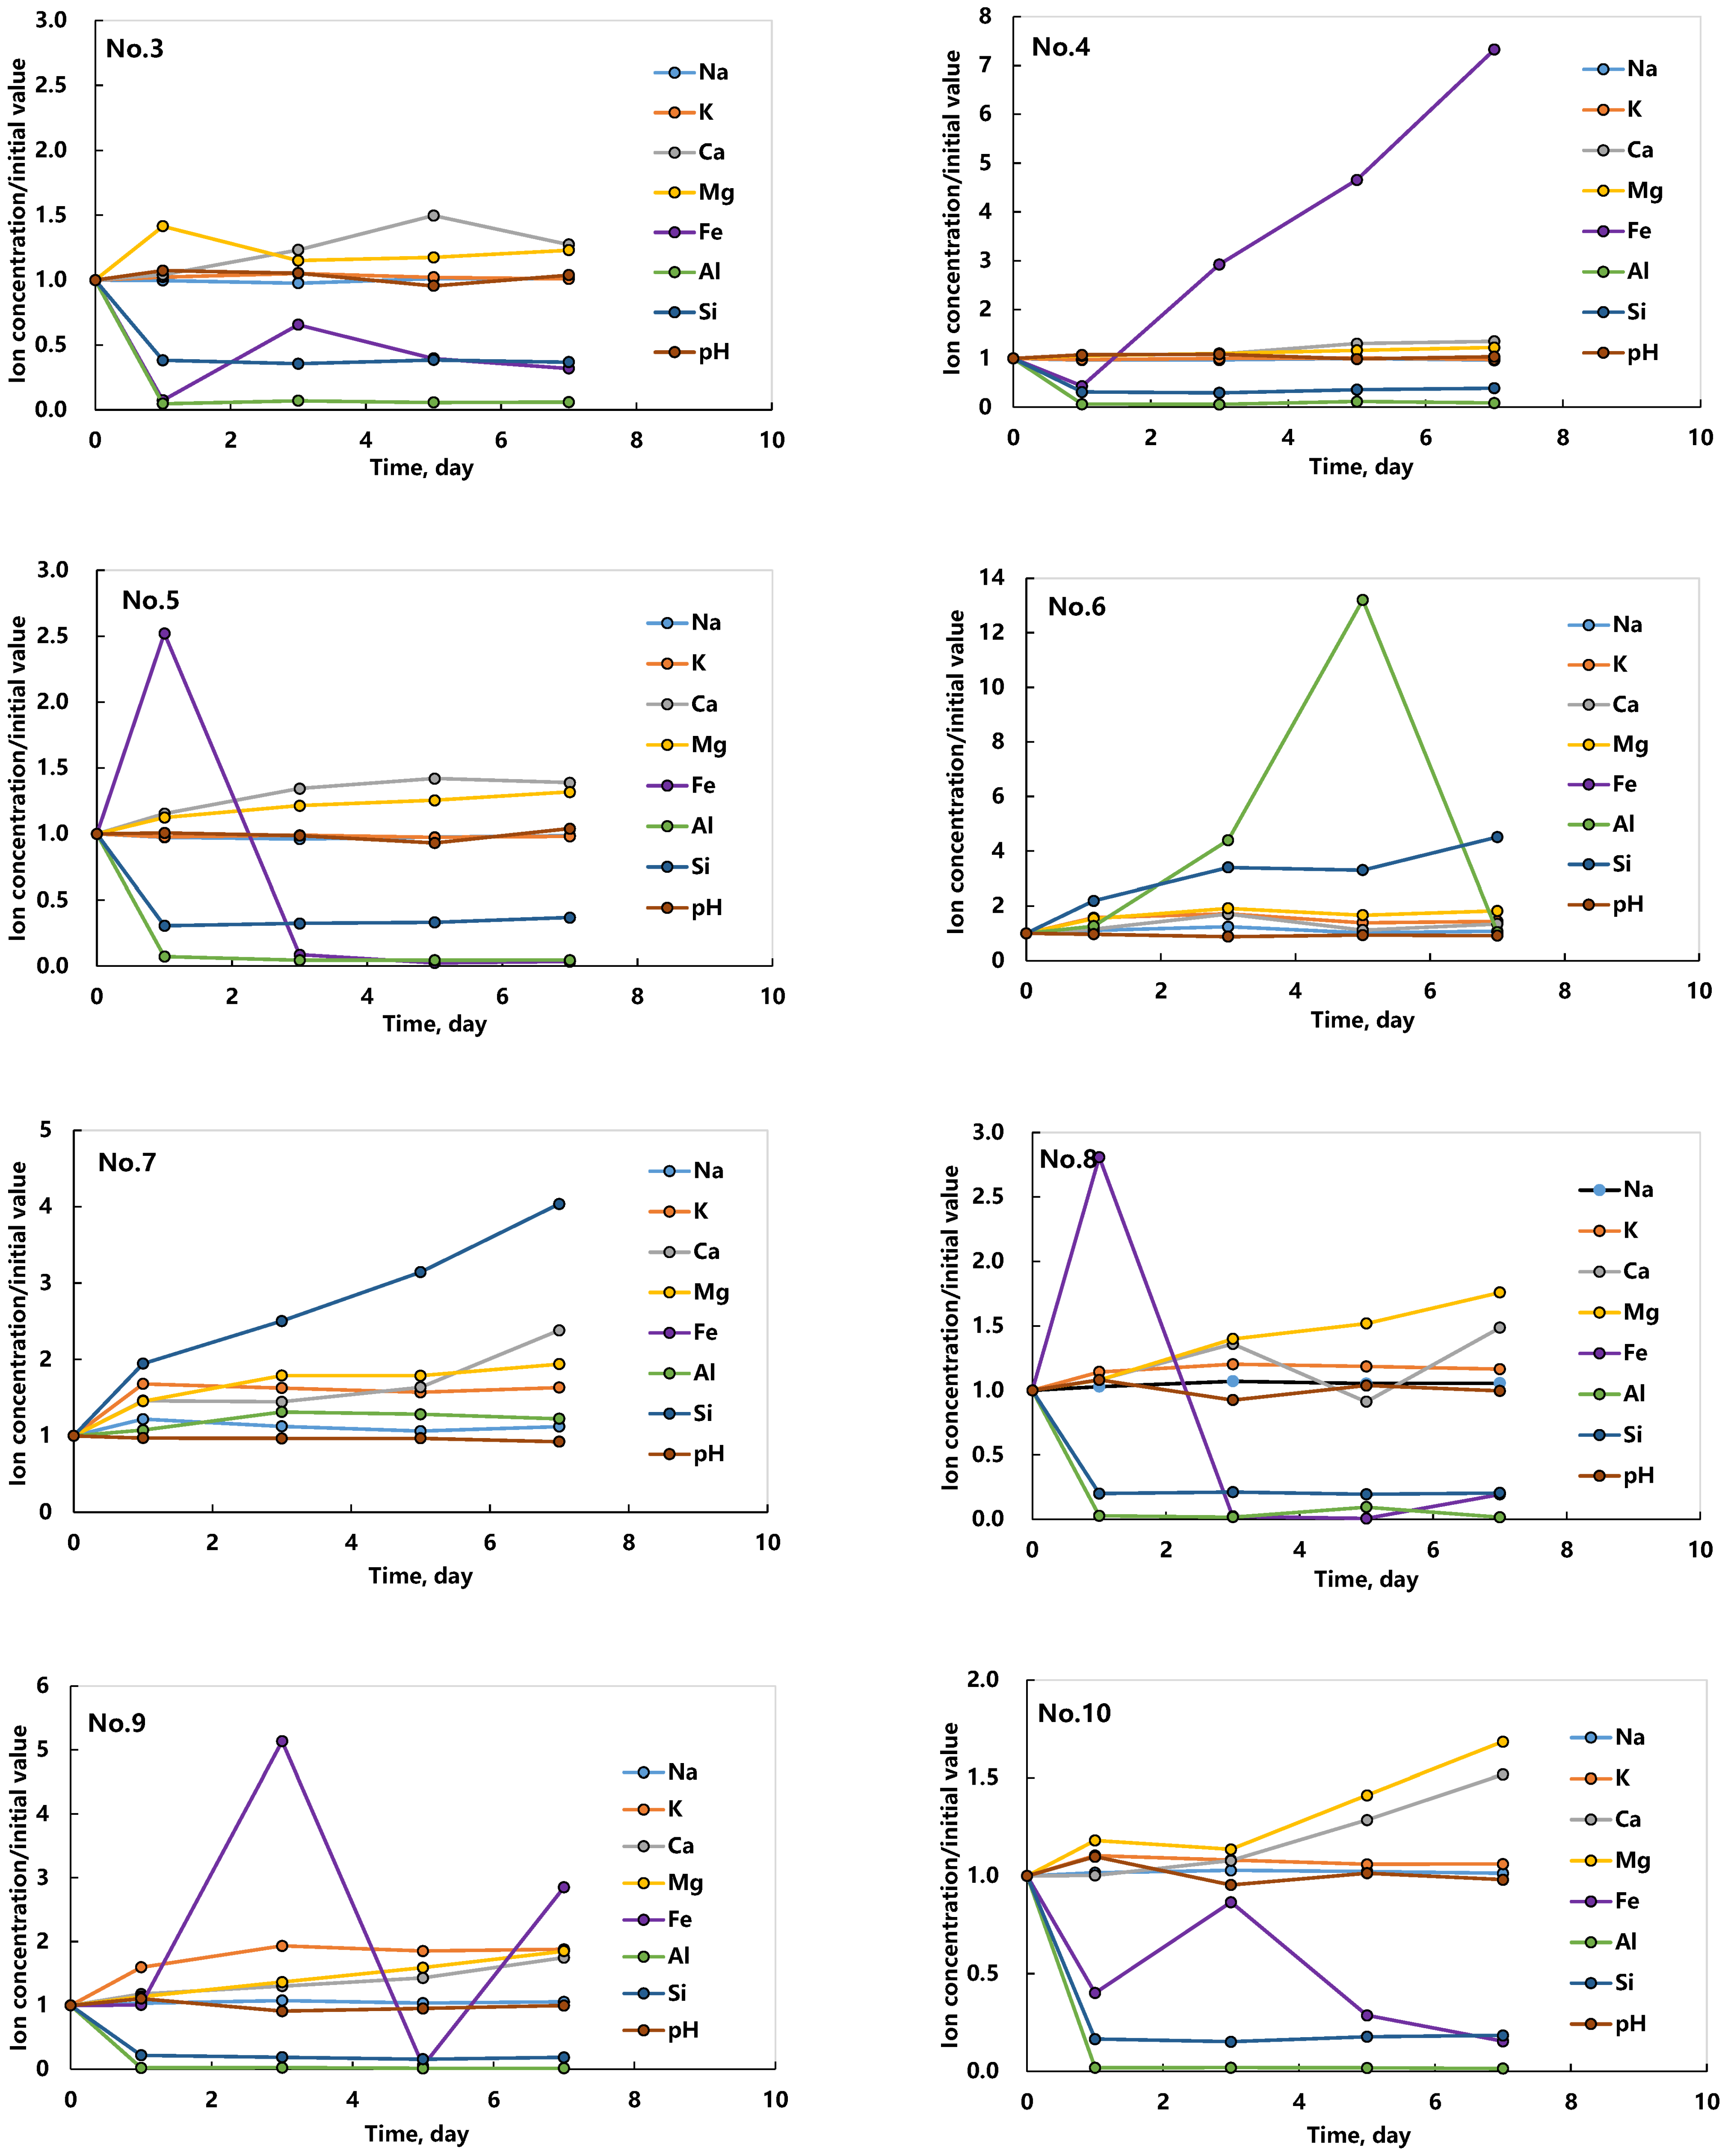
Experimental process: (a) Each set of the CO2 geochemical reaction experiments lasted for 7 days; in the meantime, the reactor was shaken several times to make sure that the bottom cutting powder was fully in contact with the formation water and CO2. (b) The formation water in the reactor was sampled on the 1st, 3rd, 5th, and 7th day, respectively, 5–10 mL at a time, and the contents of K, Na, Ca, Mg, Fe, Al, Si, and pH in the water samples were determined using the inductively coupled plasma mass spectrometer (ICP-MS) produced by Agilent (Model 7500a, the precision is 2.7–4.6%, and the range of error is −3% to 2%).
(3)
Experimental analysis: (a) A total of 7 days later, the reactor was opened, the cutting powder after the CO2 geochemical reaction was filtered, dried, and weighed, and 20 g of powder was taken for mineral composition analysis using the XRD method. (b) The CO2 geochemical reaction pathway was analyzed by comparing the compositions of the cutting powder and formation water before and after the CO2 geochemical reaction.

3.2.2. Rock Thin Section Identification before and after CO2 Geochemical Reaction

Rock thin section identification can be used to observe the particle size, pore structure, and mineral composition of rocks. The original particle size and pore structure of the drill cuttings have been damaged by the drilling process, which is no longer suitable for thin section identification. Therefore, sidewall cores with similar physical properties sampled from the nearby block were used for the experiment. Because of the weak consolidation, the sidewall cores were molded into epoxy resin castings and polished into thin sections with a thickness of 0.03 mm. The German Zeiss polarized microscope (Model Axio Scope A1, ICCS optical system, 5 kinds of lens bodies with FEM design and ACR coding, maximum sample height up to 380 mm) was used to analyze the thin sections before the CO2 geochemical reaction [40,41], and then the sections were placed in the reactor and immersed in the CO2-saturated formation water at the designed temperature and pressure. After 7 days of reaction, these thin sections were taken out and examined again.

3.2.3. Numerical Simulation of CO2 Geochemical Reaction

The geochemical reaction between CO2, formation water, and rock minerals is a complex process. It is not only related to the compositions of formation water and rock minerals and the P-T conditions but also related to the contact condition and the reaction time [42]. In the CO2 geochemical reaction experiment, the rock samples were ground into powder to increase the reaction surface area and accelerate the reaction rate to reach equilibrium quickly. It reflected the strong geochemical interaction between CO2 and rocks, which is mainly characterized by the dissolution and formation of carbonate and clay minerals. However, each set of static CO2 geochemical reaction experiments only lasted for 7 days, so it is unknown if the reaction reached the final state. Hence, referring to the experimental conditions, the GEM model of reservoir numerical simulation software CMG (v2021.10) was used to simulate the long-term CO2 geochemical reaction process to verify the reasonability of the experimental results and analyze the finial CO2 mineral trapping potential [43]. The GEM model is multicomponent. It has a GHG function that can simulate the various CO2 trapping mechanisms during its geo-storage process. For the CO2 geochemical reaction simulation, the GEM model refers to the studies of Nghiem et al. who gave the main governing equations and checked the reliability [44].
According to the volume of the reactor, an equivalent geological model with a size of 7.37 cm × 7.37 cm × 7.37 cm was established. It was divided vertically into four uniform grids that can simulate the CO2 dissolution and diffusion from the top to the bottom water. The porosity of the model is 50%, and the total pore volume is 200 mL. The lower 150 mL volume (three grids) is saturated with formation water, and the initial content of rock minerals for the CO2 geochemical reaction is 30 g. The upper 50 mL volume (one grid) is full of CO2 (Figure 3). According to the mineral composition analysis of the rock samples, three aqueous reactions and thirteen mineral reactions were mainly involved, whose commonly used reaction kinetic parameters in rock pores are shown in Table 4 and Table 5, respectively [12,38,39,45]. The Henry model was used to calculate CO2 solubility in formation water, and the effect of salinity was considered [46]. The CO2 diffusion coefficients were set to be 3.15 × 10⁻⁹ m2/s and 4.03 × 10⁻⁹ m2/s for aquifers Y and H, respectively, estimated by the Wilke–Chang equation [47]. Based on the static contact conditions, CO2 dissolution and diffusion in formation water can quickly reach stability without flow in such a small-size geological model during numerical simulation; hence, the grid mesh will have little affect on the simulation results. Ten sets of static CO2 geochemical reaction experiments were simulated, and the amount of mineralized CO2 after 7 days, 10 years, 200 years, and finally 1000 years was predicted.

4. Results and Analysis

4.1. Mineral Composition Change Induced by CO2 Geochemical Reaction

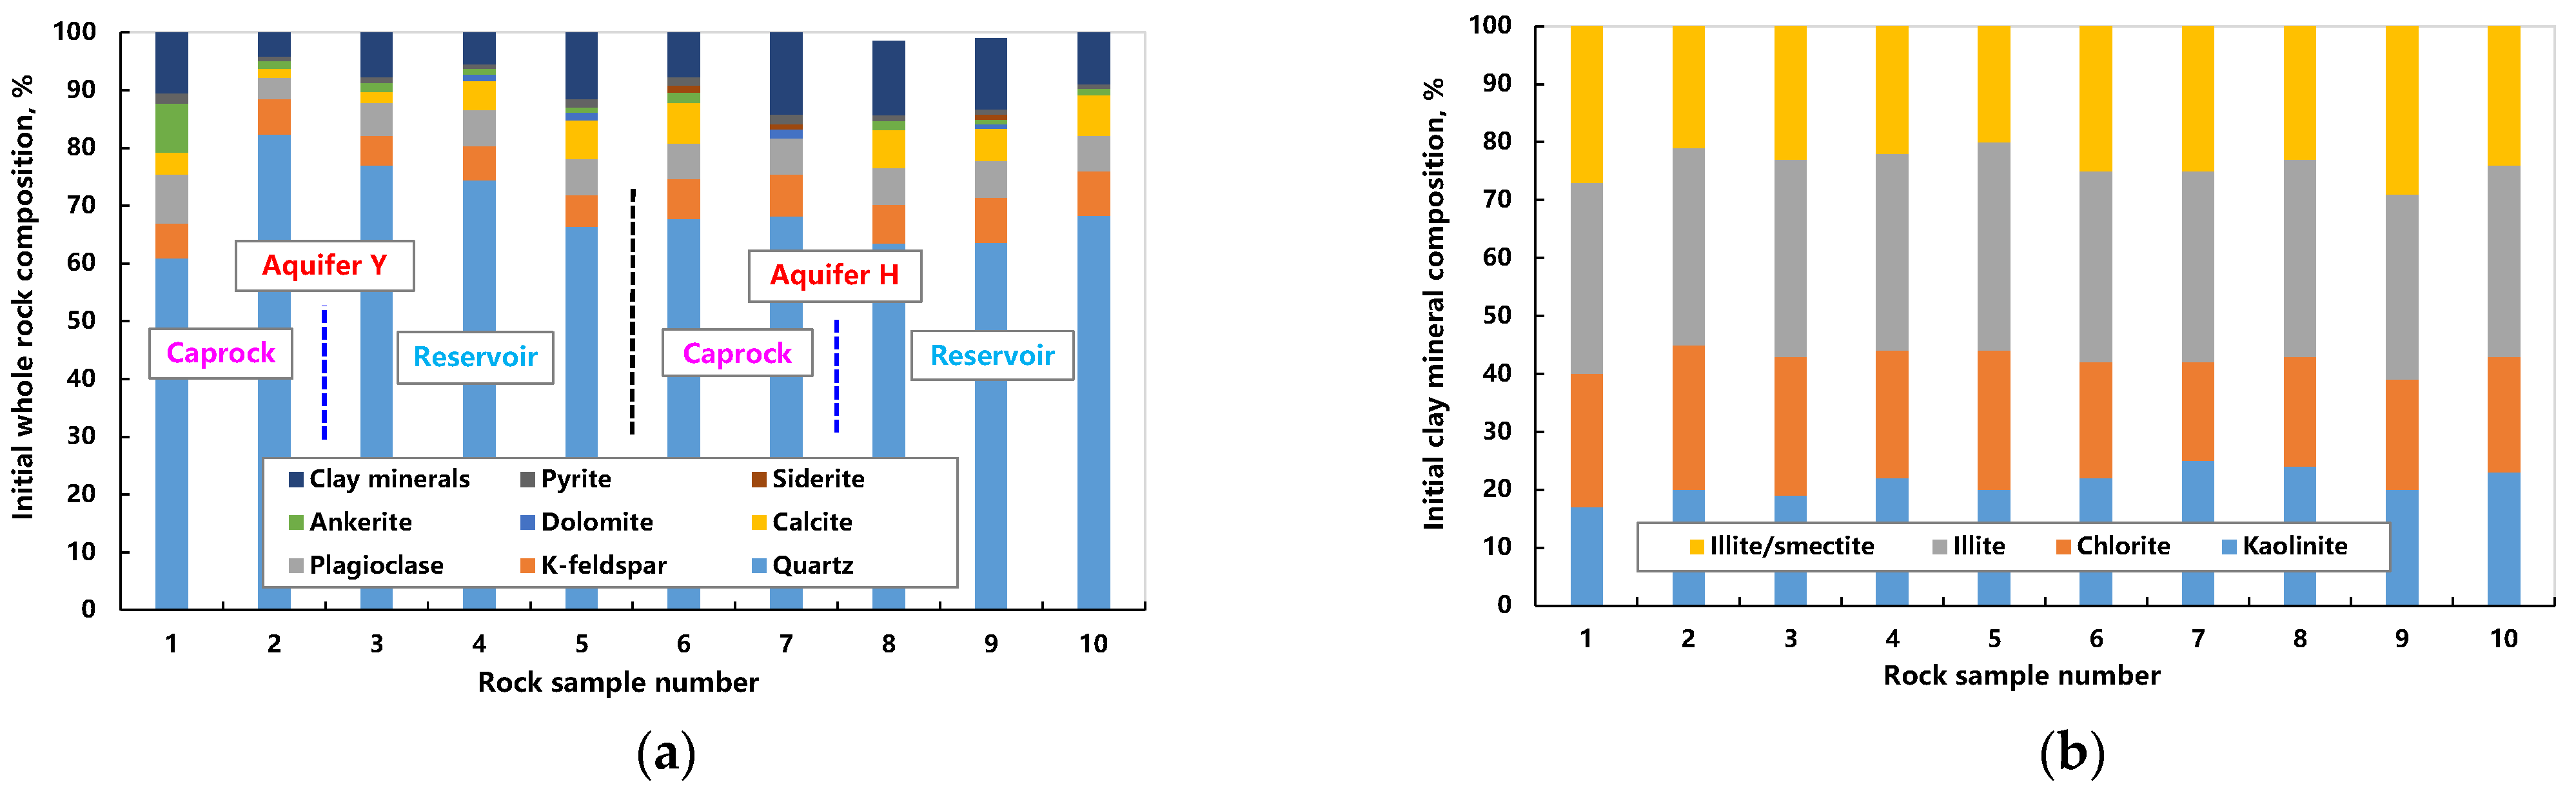
4.1.1. Mineral Compositions before CO2 Geochemical Reaction

The original mineral compositions of rock samples at different depths in the reservoirs and caprocks of aquifers Y and H are shown in Table 6. The whole rock mainly consists of nine kinds of minerals ranging from quartz to clay minerals, with a total composition of 100%. The clay minerals can be further divided into kaolinite, chlorite, illite, and an illite−smectite interlayer. The total content of these minerals in clay minerals is also 100%. The mineral composition of the whole rock and the composition of clay minerals are summarized in two cumulative histograms and ordered by the sample number (depth), as shown in Figure 4. The relative sizes of the different mineral contents of each rock sample at different sampling depths can be observed and compared visually.
In terms of reservoir minerals, with the increase in depth, the content of quartz, which accounts for the largest proportion in the reservoir of aquifer Y, gradually decreases from 76.97% to 66.43%, while the contents of calcite and clay minerals gradually increase, of which the content of calcite increases from 1.95% to 6.74%, and that of clay minerals from 5.46% to 11.51%. The reservoir also contains 0.9–1.52% ankerite, 1.17–1.28% dolomite, and 0.76–1.47% pyrite, while the contents of K-feldspar and plagioclase remain relatively stable, at 5.16–5.99% and 5.67–6.25%, respectively. Compared with aquifer Y, the clay mineral content in the reservoir of aquifer H is larger, which decreases from 12.78% to 9% with the increase in depth, while the calcite content remains relatively stable at 5.55–6.63%, the ankerite content is 0.79–1.55%, the pyrite content is 0.72–1.06%, and some of its rock samples also contain 0.9% siderite. In addition, the contents of the four minerals in clay minerals are stable. In the reservoir of aquifer Y, the contents of kaolinite, chlorite, illite, and the illite-smectite interlayer are 19–22%, 22–24%, 34–36%, and 20–23%, respectively. The corresponding clay mineral contents in the reservoir of aquifer H are 20–24%, 19–20%, 32–34%, and 23–29%, respectively, which are similar to those in aquifer Y.
In terms of caprock minerals, as the depth increases, the quartz content in the caprock of aquifer Y increases from 60.86% to 82.37%, the clay mineral content decreases from 10.52% to 4.2%, and the calcite and ankerite contents decrease from 3.84% and 8.42% to 1.58% and 1.26%, respectively. In the caprock of aquifer H, the quartz content is relatively stable, at 67.7–68.14%, and the content of clay minerals increases from 7.75% to 14.14%. The upper caprock contains 7% calcite and 1.84% ankerite, while the lower caprock only contains 1.47% calcite. The compositions of the clay minerals in the caprocks of aquifers Y and H are also relatively stable.
In general, the main mineral of the reservoirs and caprocks of aquifers Y and H is quartz. The contents of plagioclase and K-feldspar are relatively stable, while those of easily reactive minerals such as carbonate and clay are relatively high. The mineral compositions in the reservoirs have an obvious relationship with depth and the heterogeneity is small, while the mineral contents in the caprocks vary significantly with depth, and the heterogeneity is strong. In addition, it should be noted that the rock samples evaluated are generally high in clay minerals and that there was no significant difference in the clay contents of the reservoir and caprock, which may be related to the fact that the drilling debris is a mixture collected along a well section and might have been contaminated with drilling mud.

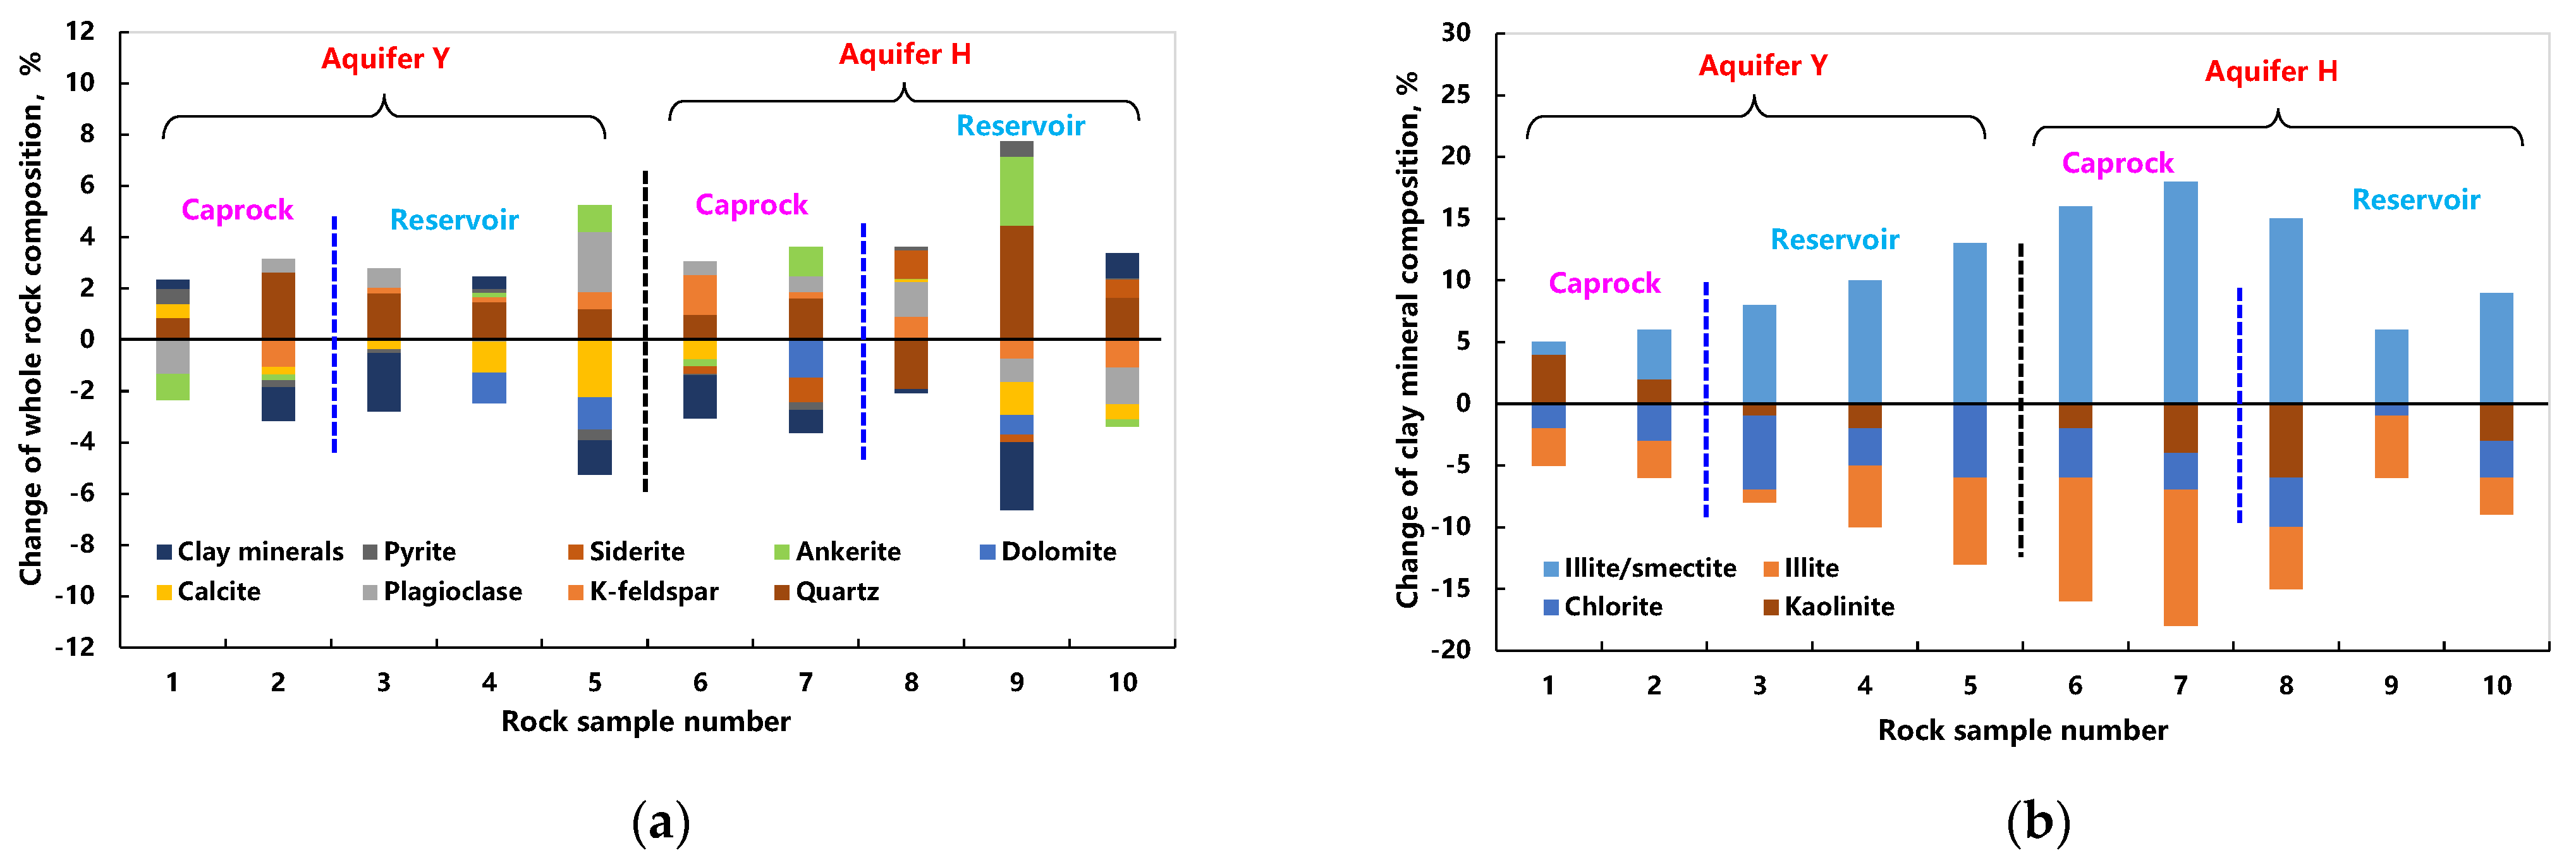
4.1.2. Mineral Compositions after CO2 Geochemical Reaction

Following the experimental scheme, ten rock samples reacted with formation water and CO2 for 7 days under the target aquifer conditions. The mineral compositions after the CO2 geochemical reaction were measured, as shown in Table 7. In order to compare the content change in each mineral of each rock sample induced by the geochemical reaction conveniently, the mineral content after the geochemical reaction was subtracted from the mineral content before, and the minerals that increased and decreased in content were added up separately, and finally, two cumulative histograms of the mineral composition change in each rock sample at different depths were plotted in Figure 5. In addition, due to the great difference in the concentration between different ions in formation water, which vary from tens of thousands mg/L to several mg/L, it is hard to show the details of ions with a low concentration when all the ions are drawn in one figure. Therefore, the ratio of the measured value to the initial value was used to present the concentration change in each ion over time during the CO2 geochemical reaction, as shown in Figure 6.
For the rock samples in the reservoir of aquifer Y, after 7 days of the CO2 geochemical reaction, most of the carbonate minerals such as calcite and dolomite, and some of the clay minerals, were dissolved. Accordingly, the contents of quartz, K-feldspar, and plagioclase increased. Some of the rock samples also generated a small amount of ankerite and clay minerals. The contents of kaolinite, chlorite, and illite in the clay minerals decreased, while the content of the illite-smectite interlayer increased. In addition, the concentrations of Na+ and K+ in formation water were stable during the CO2 geochemical reaction, but those of ions with a small content changed greatly, which are sensitive to the geochemical reaction. The dissolution of carbonate minerals can make the Ca2+ and Mg2+ concentrations gradually increase and tend to be stable. The formation of feldspar and quartz can cause the decrease in the Al3+ and Si concentrations, and the Fe (Fe2+ + Fe3+) concentration varied significantly. Among them, the Fe in the water of No. 4 and No. 5 rock samples increased, corresponding to the formation of a small amount of ankerite.
For the rock samples in the reservoir of aquifer H, after 7 days of the CO2 geochemical reaction, most of the carbonate minerals, K-feldspar, and plagioclase in the rock samples were dissolved, and additional quartz, siderite, and ankerite were generated accordingly. Among them, the clay content of rock sample No. 9 (mudstone interlayer) decreased significantly, while the quartz content increased markedly. The changes in the clay mineral composition are similar to those of the aquifer Y. Due to the dissolution of feldspar and clay minerals, the concentrations of Na+ and K+ in formation water increased slowly and reached stability, especially the K+ concentration, which in the case of the mudstone interlayer increased significantly. The dissolution of carbonate minerals caused a gradual increase in the Ca2+ and Mg2+ concentrations in water, while the formation of siderite and dolomite led to the overall decrease in the Fe concentration, and the formation of quartz and clay minerals led to decline in the Al3+ and Si concentrations in water.
For the rock samples in the caprock of aquifer Y, after 7 days of the CO2 geochemical reaction, the ankerite and plagioclase in the upper caprock were dissolved, forming quartz, calcite, and clay minerals, while the dissolution of clay minerals, calcite, ankerite, and K-feldspar dominated in the lower caprock, forming more quartz and plagioclase. For the clay mineral composition in the upper and lower caprocks, the contents of illite and chlorite decreased, while those of kaolinite and the illite-smectite interlayer increased. Accordingly, with the geochemical reaction, the concentrations of Na+ and K+ in formation water increased first and then quickly stabilized, while the concentrations of Ca2+ and Mg2+ gradually increased, and there was still an upward trend after 7 days. In addition, the concentration of Al3+ increased first and then decreased rapidly, while the concentration of Si gradually increased.
For the rock samples in the caprock of aquifer H, after 7 days of the CO2 geochemical reaction, the dissolution of clay minerals, siderite, ankerite, and calcite in the upper caprock mainly occurred to form quartz, K-feldspar, and plagioclase, while in the lower caprock, the clay minerals, dolomite, and siderite were dissolved, and the quartz, ankerite, and a small amount of feldspar formed. The content of the illite-smectite interlayer in the clay minerals both in the upper and lower caprocks increased significantly. In formation water, except for the small change in the Al3+ concentration in the lower caprock, the changes in each ion in the water of upper and lower caprocks are similar to those of the caprocks of aquifer Y.
To sum up, it can be seen that with the CO2 geochemical reaction, the contents of quartz and feldspar in aquifers Y and H will increase, while those of calcite, dolomite, and clay minerals will decrease. The contents of carbonate and clay minerals in the reservoir of aquifers are relatively high, which are prone to causing dissolution reactions. The contents of typical ions, including Ca2+ and Mg2+ in formation water, can increase obviously, and the change in the mineral composition after the geochemical reaction will also be great. Comparatively, the original mineral compositions of aquifer caprocks are quite different. They will change slightly after the geochemical reaction, but the geochemical reaction process is more complicated. The specific process of the geochemical reaction should be determined by the compositions of minerals and formation water, as well as the kinetic parameters of the reaction [48].

4.2. Rock Micromorphology Change Induced by CO2 Geochemical Reaction

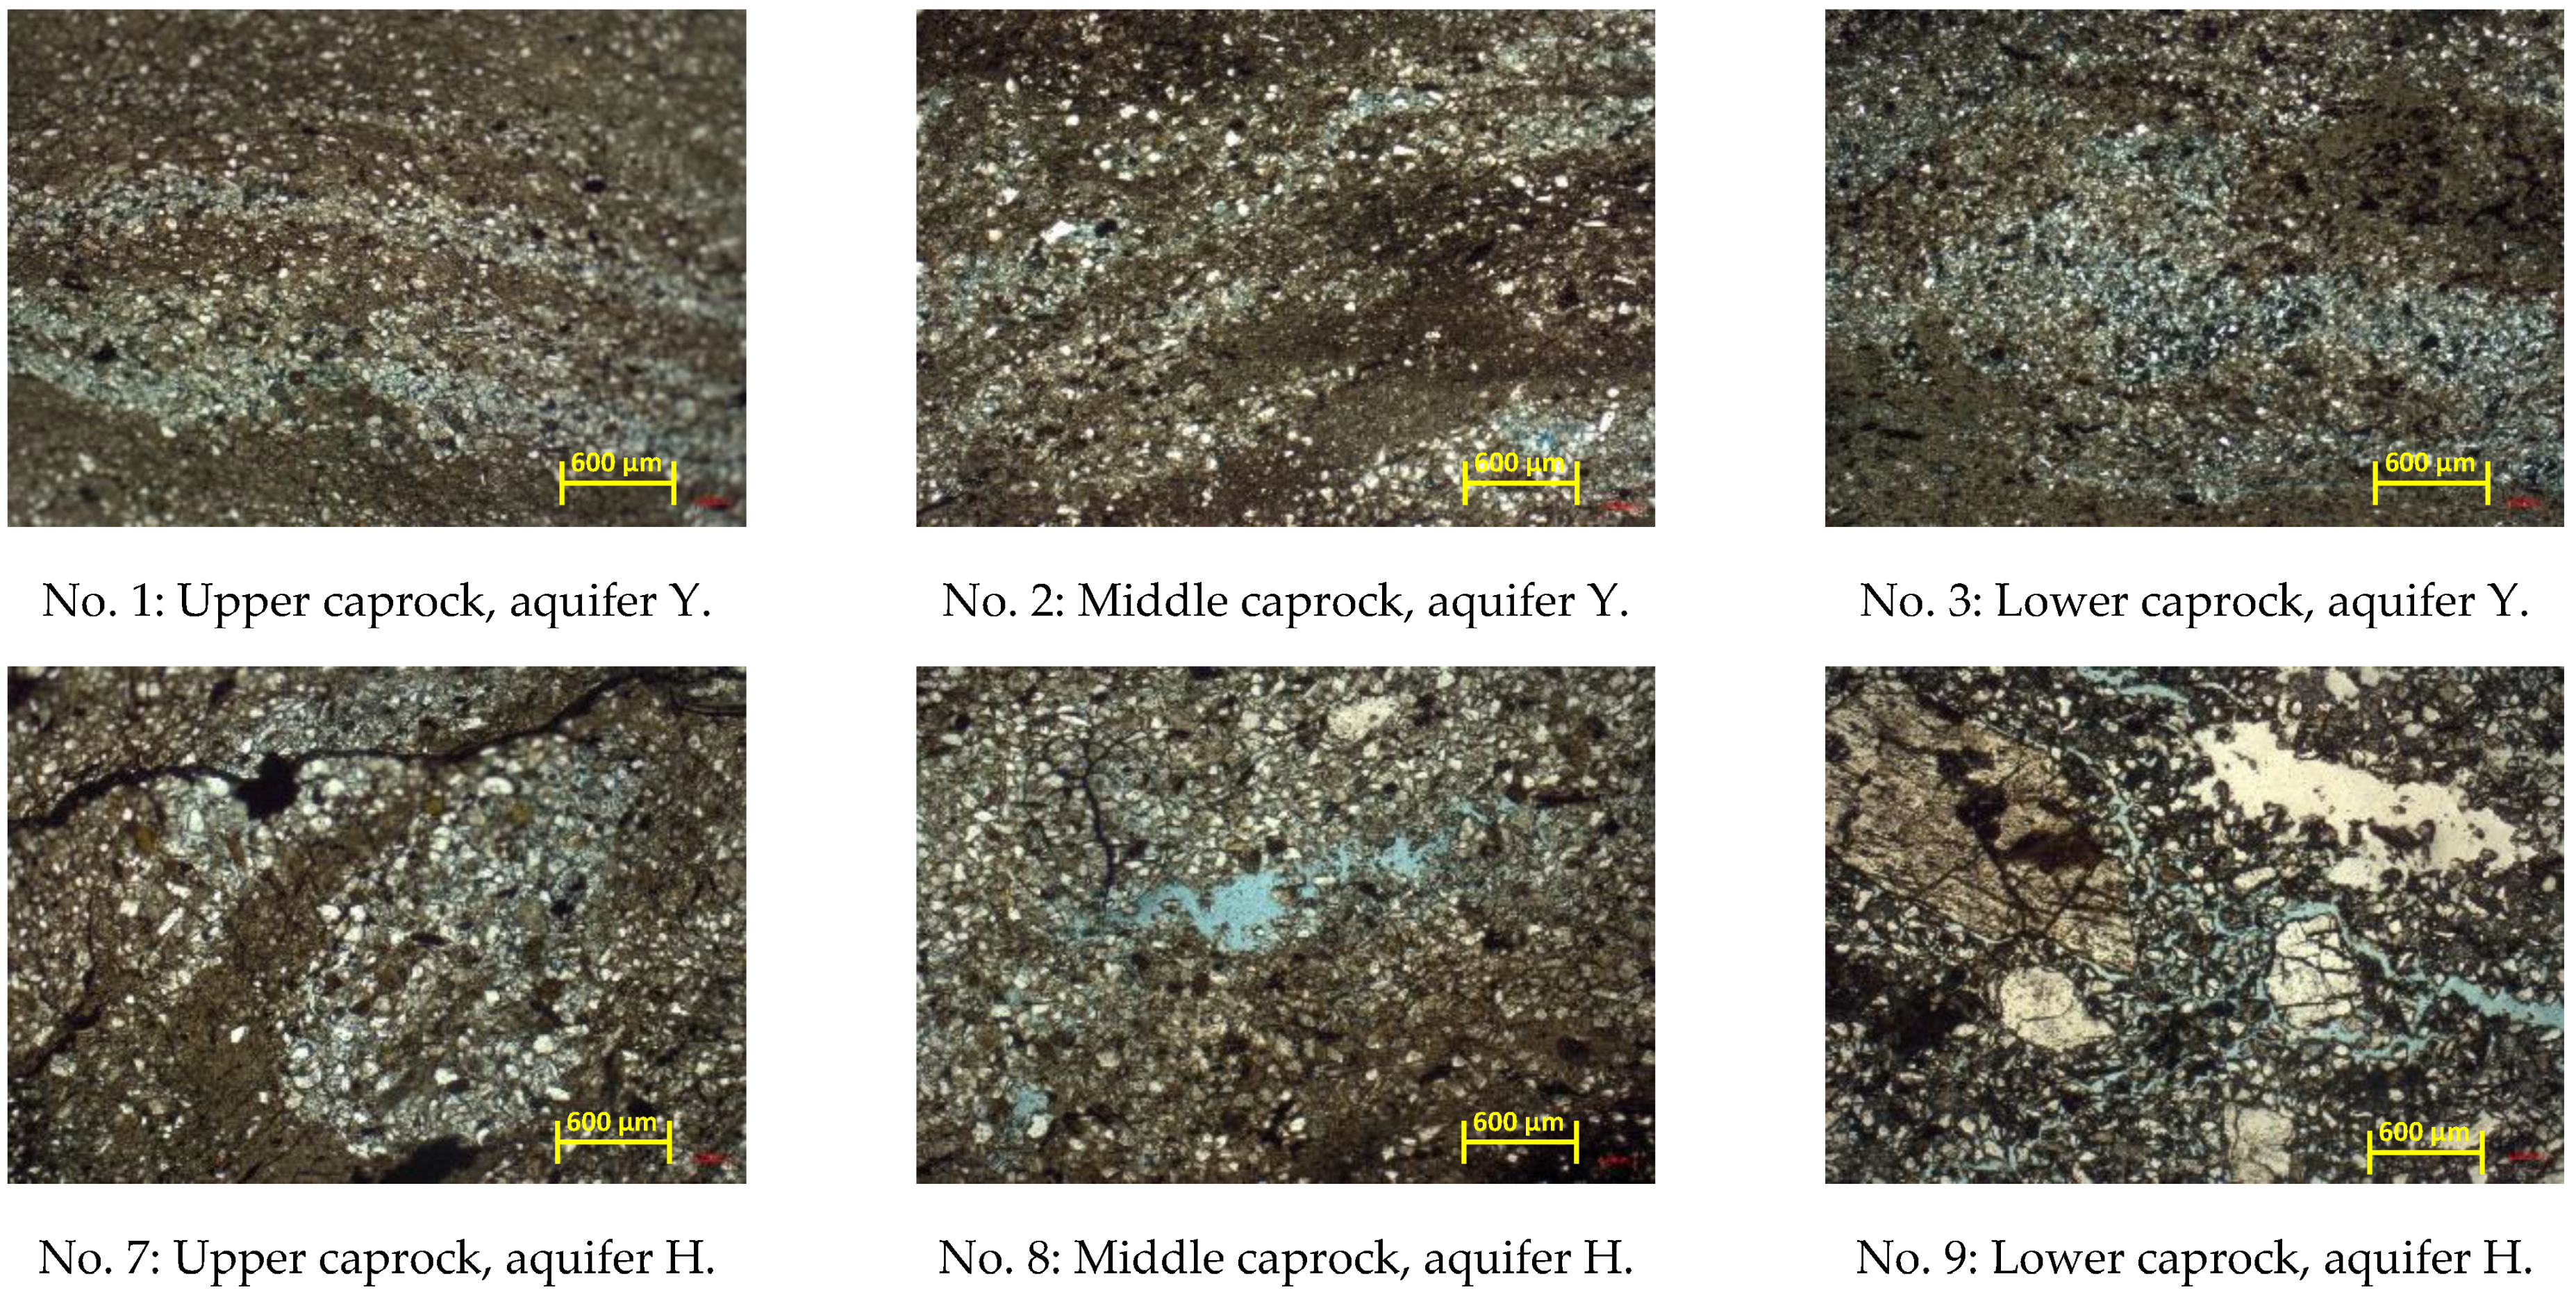
4.2.1. Thin Section Analysis before CO2 Geochemical Reaction

In order to obtain the original rock micromorphology, a thin section identification of sidewall cores sampled at different depths in aquifers Y and H was conducted before the CO2 geochemical reaction. The micrographs of the thin sections are shown in Figure 7 and Figure 8.
The thin section identification of reservoir cores shows that the reservoirs of aquifers Y and H are mainly made up of medium-to-fine-grained sandstones with feldspathic quartz, and a small number of rock samples are pebbly siltstone with lithic quartz. The reservoir rocks have a detrital structure. The content of detrital grains is up to 66–88%, which are mainly quartz and feldspar, associated with a small amount of biological debris in some rock samples. The intergranular fillings are mainly clay, dolomite, and calcite with a total content of only 3–10%, but in some rock samples, the content of dolomite in the fillings is up to 25%. Comparatively, the reservoir of aquifer H contains more clay matrix than that of aquifer Y. The rocks are mostly porous and poorly sorted. The intergranular pores are mainly original pores with a small number of dissolved pores. The pore size is 50–200 μm, and the total porosity is usually 9–29%, while in some cases it is 0.5–3.5%.
The thin section identification of caprock cores shows that the caprocks of aquifers Y and H mainly consist of fine-grained felsic sedimentary rocks. The felsic detrital grains and argillaceous, siliceous, and ferruginous fillings are deposited together with the felsic detrital grains locally enriched in pellets. The rock samples have a fine-grained detrital structure. The main minerals of the detrital grains are quartz, feldspar, and biotite (a few samples contain biological debris), accounting for about 55–80%. The intergranular pores are filled with argillaceous, siliceous, calcareous, and dolomite minerals, with a total content of 14–40%. They are of basal cementation with good grain sorting. The intergranular pores are mainly original pores, the pore size is 50–100 μm, and the total porosity is 1–6%.
Based on the above analysis, it can be seen that the physical properties of the reservoirs and caprocks of aquifers Y and H are very different. The reservoirs have detrital grains with a large size, distinct outline, poor sorting, low filling content, and large intergranular pores, which can provide favorable space for CO2 storage. Comparatively, the caprocks contain a low content of detrital grains with a small size and a high content of argillaceous, siliceous, and ferruginous fillings with basal cementation and good sorting, which can have a good sealing effect on CO2 storage.

4.2.2. Thin Section Analysis after CO2 Geochemical Reaction

After 7 days of the CO2 geochemical reaction under formation conditions, the 12 thin sections were investigated once again, and the micrographs of these core thin sections are shown in Figure 9 and Figure 10. The thin section identification of reservoir cores shows that after the CO2 geochemical reaction, the carbonate minerals such as calcite and dolomite in the reservoir rocks were dissolved. The number of intergranular pores was increased, and the siliceous content was enhanced by 2–4%. In addition, in the rock samples of No. 4 and No. 6, the content of clay minerals was increased, and the thin section color became deeper. The porosity of the No. 5 rock sample was increased from 13% to 15%, while that of the No. 11 and No. 12 rock samples was decreased from 10% and 15% to 5% and 10%, respectively.
The thin section identification of caprock cores show that after the CO2 geochemical reaction, the calcite and dolomite in the caprocks of aquifer Y were also dissolved and both the content of clay minerals and the porosity were increased slightly. In the caprocks of aquifer H, the dolomite was dissolved, and the siliceous content of some rock samples was also decreased. Accordingly, the porosity was increased, which may decrease the breakthrough pressure of caprock and increase the risk of CO2 leakage.

4.3. CO2 Mineral Trapping Capacity by Geochemical Reaction

The CO2 mineral trapping mechanism refers to the process where the divalent cations such as Ca, Mg, and Fe are released from non-carbonate minerals and react with CO2 to generate carbonate minerals for storage. Hence, from this point of view, the theoretical maximum CO2 mineral trapping capacity is the amount of CO2 required to convert all Ca, Mg, and Fe in the non-carbonate minerals into carbonate minerals. This parameter is often used for the preliminary assessment of CO2 mineral trapping potential [12]. In aquifers Y and H, the main non-carbonate minerals containing Ca, Mg, and Fe are anorthite, pyrite, illite, chlorite, and smectite. The theoretical maximum CO2 mineral trapping capacities of the rock samples were calculated to be 0.023–0.0538 mol/100 g rock. There is no significant difference in the calculated results of the caprocks and reservoirs of the two aquifers.
However, under the actual formation conditions, because of the dynamic equilibrium process of the geochemical reaction, only part of Ca, Mg, and Fe in the non-carbonate minerals can be released, and only part of them can convert into carbonate minerals. Meanwhile, part of the original carbonate minerals may be dissolved and release CO2. As a result, the real utilization factor of the theoretical maximum CO2 mineral trapping capacity is not high. This factor can be determined by experimental or numerical methods. Hence, the amount of mineralized CO2 in the static geochemical reaction experiment was calculated based on the composition change in the carbonate minerals before and after the geochemical reaction (including calcite, dolomite, ankerite, and siderite). The amount of mineralized CO2 after different reaction times was predicted using the GEM model. All these results are shown in Table 8 and Figure 11. Since the geochemical reaction of CO2 was simulated under the porous condition, the reaction surface area of each mineral is relatively small, and the reaction rate is also slow. Therefore, after 7 days of reaction, the change in the mineral composition and the CO2 mineralized amount is small. But with the reaction time extension, the geochemical reaction can reach stability after 200 years. Most of the rock samples own the dissolution feature of carbonate minerals, and the amount of mineralized CO2 is usually negative. By comparison, the experimental results (reaction for 7 days) are close to the predicted values after 10 years, which cannot represent the final state. In the final state (1000 years later), only three rock samples can realize the effective utilization of the theoretical maximum CO2 mineral trapping capacity, and the largest utilization factor is 75% (utilization factor = predicted final value/theoretical max. value), while the other rock samples all provide negative values. The average utilization factor is only −55.43%. Overall, under the reactor conditions, the mineralized CO2 amount only accounts for −0.32%, which can be ignored, while the dissolved CO2 and supercritical CO2 account for 33.46% and 66.85%, respectively.

5. Discussion

In this study, laboratory experiments and numerical simulations were carried out to study the characteristics of CO2 geochemical reactions in the target saline aquifers. Some research experiences have been obtained. First, 200 mesh rock powder was used in the static CO2 geochemical reaction experiment, aiming to quickly obtain the final equilibrium state of the CO2 geochemical reaction. However, the experimental results obtained after 7 days of the reaction are equivalent to the results after 10 years of numerical simulation, which is not the final state. This indicates that a longer reaction time or finer ground rock powder may be required in future experiments to reach reaction equilibrium. Because the experimental conditions of the static CO2 geochemical reaction are different from the real formation, the numerical simulation was mainly conducted to observe the performance of the geochemical reaction at different equilibrium degrees. The effects of mineral composition, reaction time, and P-T conditions were all involved in the experiment. This is similar to the sensitivity analysis of the influencing factors. However, due to the complexity of the geochemical reaction, the law of the geochemical reaction obtained was not obvious, but rather it indicates that the reaction was dominated by mineral dissolution. Comparatively, it is more meaningful to conduct and fit the dynamic geochemical reaction experiment which uses intact cores for flooding.
The CO2 geochemical reaction can not only provide the CO2 mineral trapping potential but also change the aquifer’s physical properties, affecting the law of CO2 seepage and the safety of structural trapping. In this study, the aquifers Y and H are located offshore with a shallow buried depth, and the content of carbonate and clay minerals is relatively high. This study has shown that the dissolution of carbonate minerals will dominate in the aquifers when CO2 is injected. Calcite, dolomite, and clay minerals mainly dissolve, while quartz and feldspar are mainly produced, and the corroded pore number and porosity will increase. The contribution of mineral trapping to the CO2 storage potential is negative, which can be ignored, but the impact of the geochemical reaction on the physical properties of the reservoir and caprock needs to attract more attention. The results obtained in this study are in good agreement with the published literature. A large number of studies have been conducted on caprock sealing performance under the effect of a CO2 geochemical reaction. Alemu et al. [49] used a high-temperature and high-pressure reactor to carry out an experiment of CO2 breakthrough in caprock under static conditions and obtained a change in the rule of the micro-structure properties and mineral dissolution of the caprock before and after the reaction. Wollenweber et al. [50] conducted experimental studies on the seepage, diffusion, and water-rock reaction of CO2 in caprocks and found that the effective diffusion coefficient of CO2 increased due to the change in the caprock’s minerals and pore structure. Through experiment and numerical simulation, Gherardi et al. [51] studied the changes in the physical properties of the caprocks after CO2 injection and concluded that CO2 would produce chemical dissolution on the caprocks, thus reducing the sealing effect of the caprocks and increasing the CO2 leakage risk. Luquot and Gouze [52] observed the phenomenon of increased permeability caused by mineral dissolution in the experiment of a CO2 geochemical reaction. In the studies of Kim et al. and Yang et al. [53,54], it was also observed that a CO2 geochemical reaction can lead to different changes in porosity and permeability at different locations; in their studies, the mineral dissolution of calcite and dolomite mainly occurred upstream, while carbonate mineral precipitation mainly occurred downstream, showing different geochemical reaction characteristics in the lower and upper caprock. In general, CO2 geochemical reactions can dissolve caprocks, the size of the pore throat may increase, the existing cracks may further develop, and the fault may be activated; all of these can reduce the caprock sealing performance and cause CO2 leakage.
It should be noted that the physical properties of weakly consolidated saline aquifers are more easily affected by CO2 geochemical reactions, which can further damage CO2 storage safety significantly. According to the investigation, the geological sedimentary age of offshore saline aquifers buried at a depth of 1000–3000 m in China is generally young [55]. The compaction of the formation rock is weak. Most of them are medium-to-high permeability reservoirs with typical mud-sand interlayers and strong heterogeneity, but the rocks are often weak and easily broken. These geological characteristics will significantly affect the migration and trapping process of CO2 in saline aquifers, and the CO2 geochemical reaction may also cause formation deformation and caprock failure. Therefore, it is very necessary to carry out detailed studies on saline aquifers with such geological conditions to reveal the effect of CO2 geochemical reactions on storage safety.

6. Conclusions

(1)
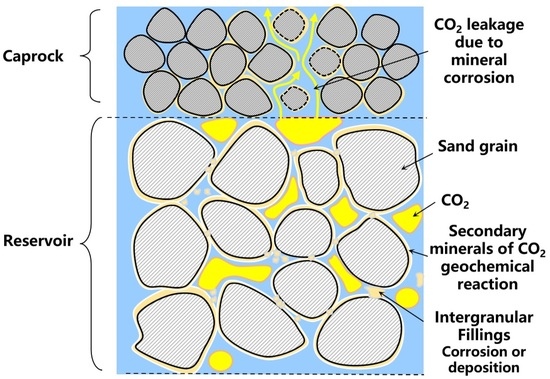
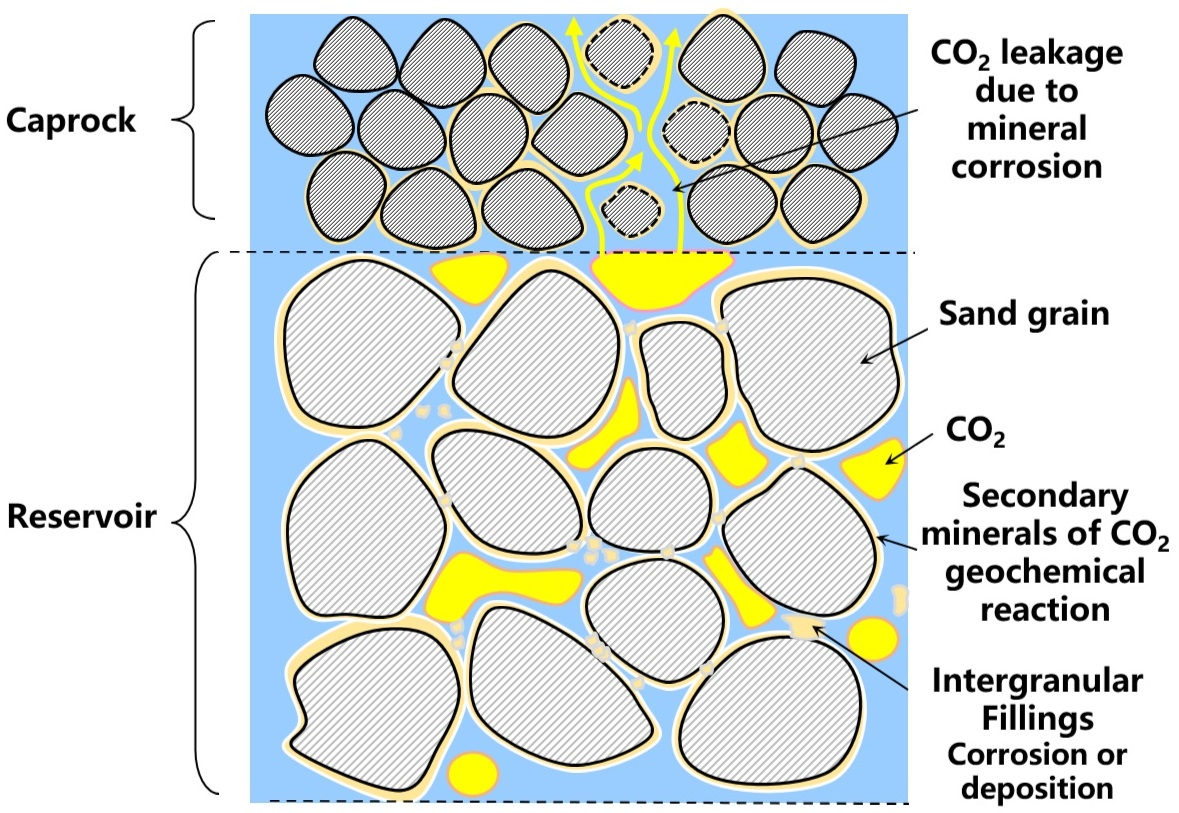
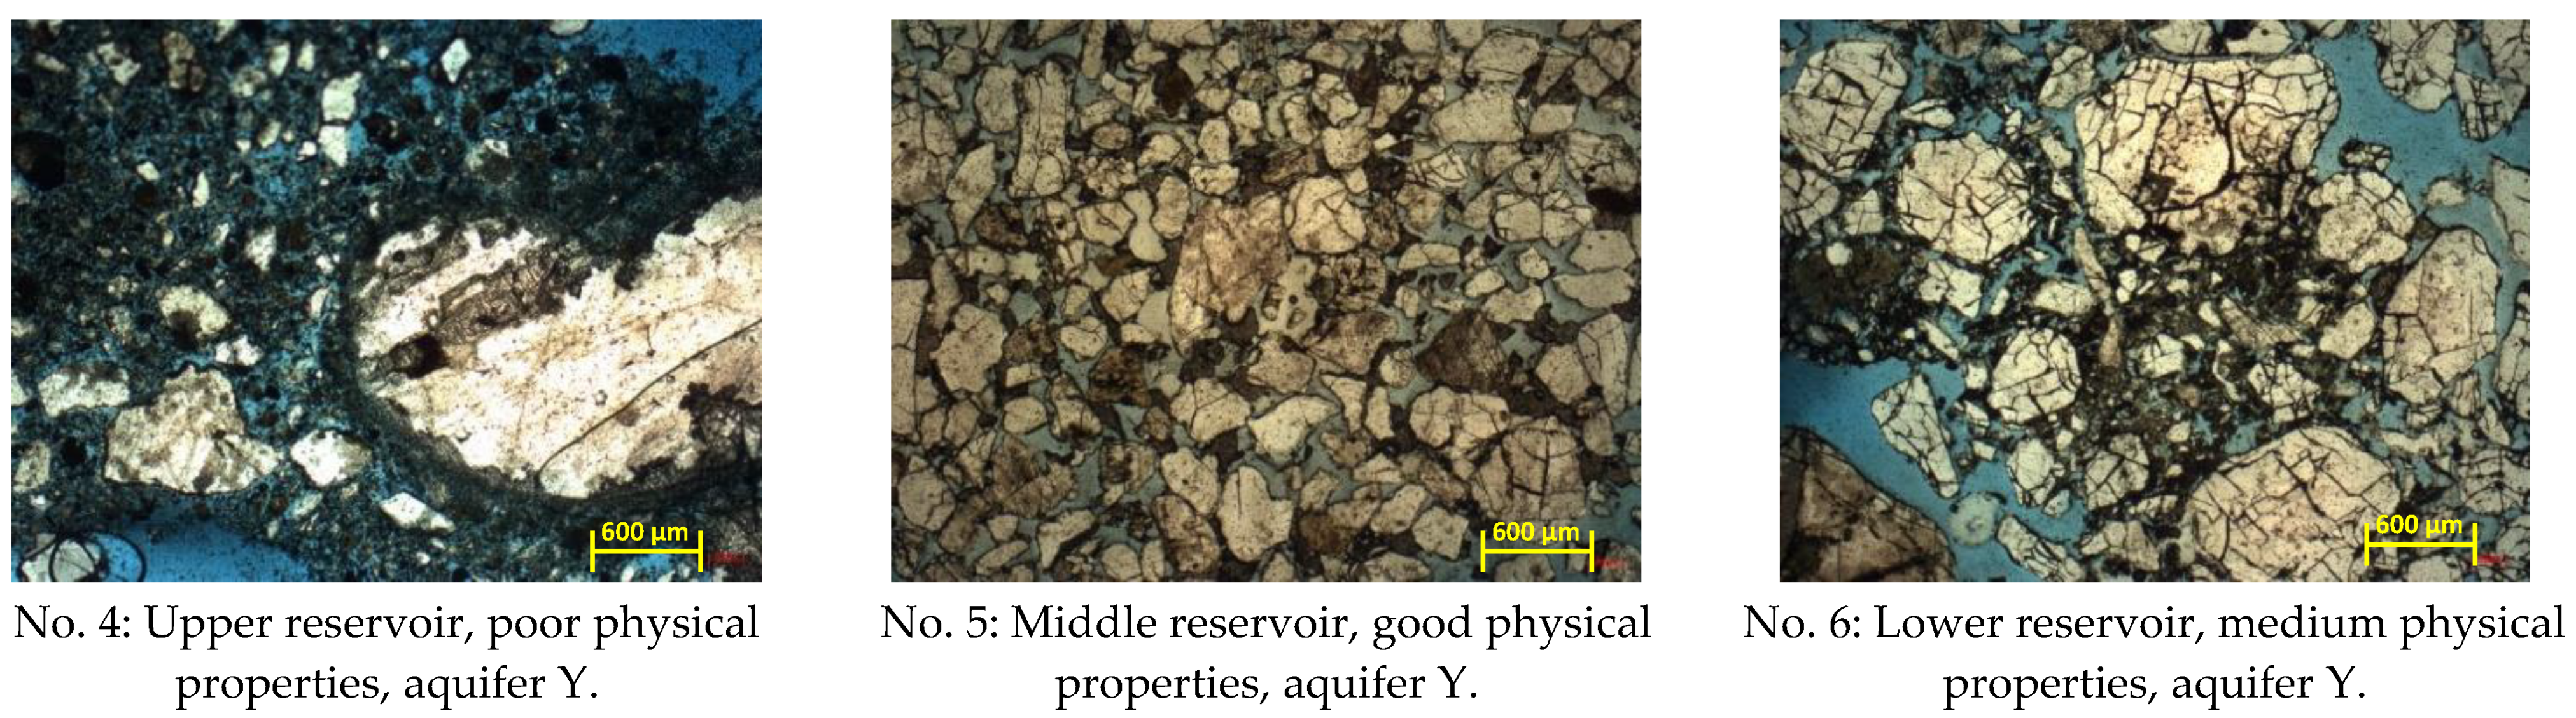
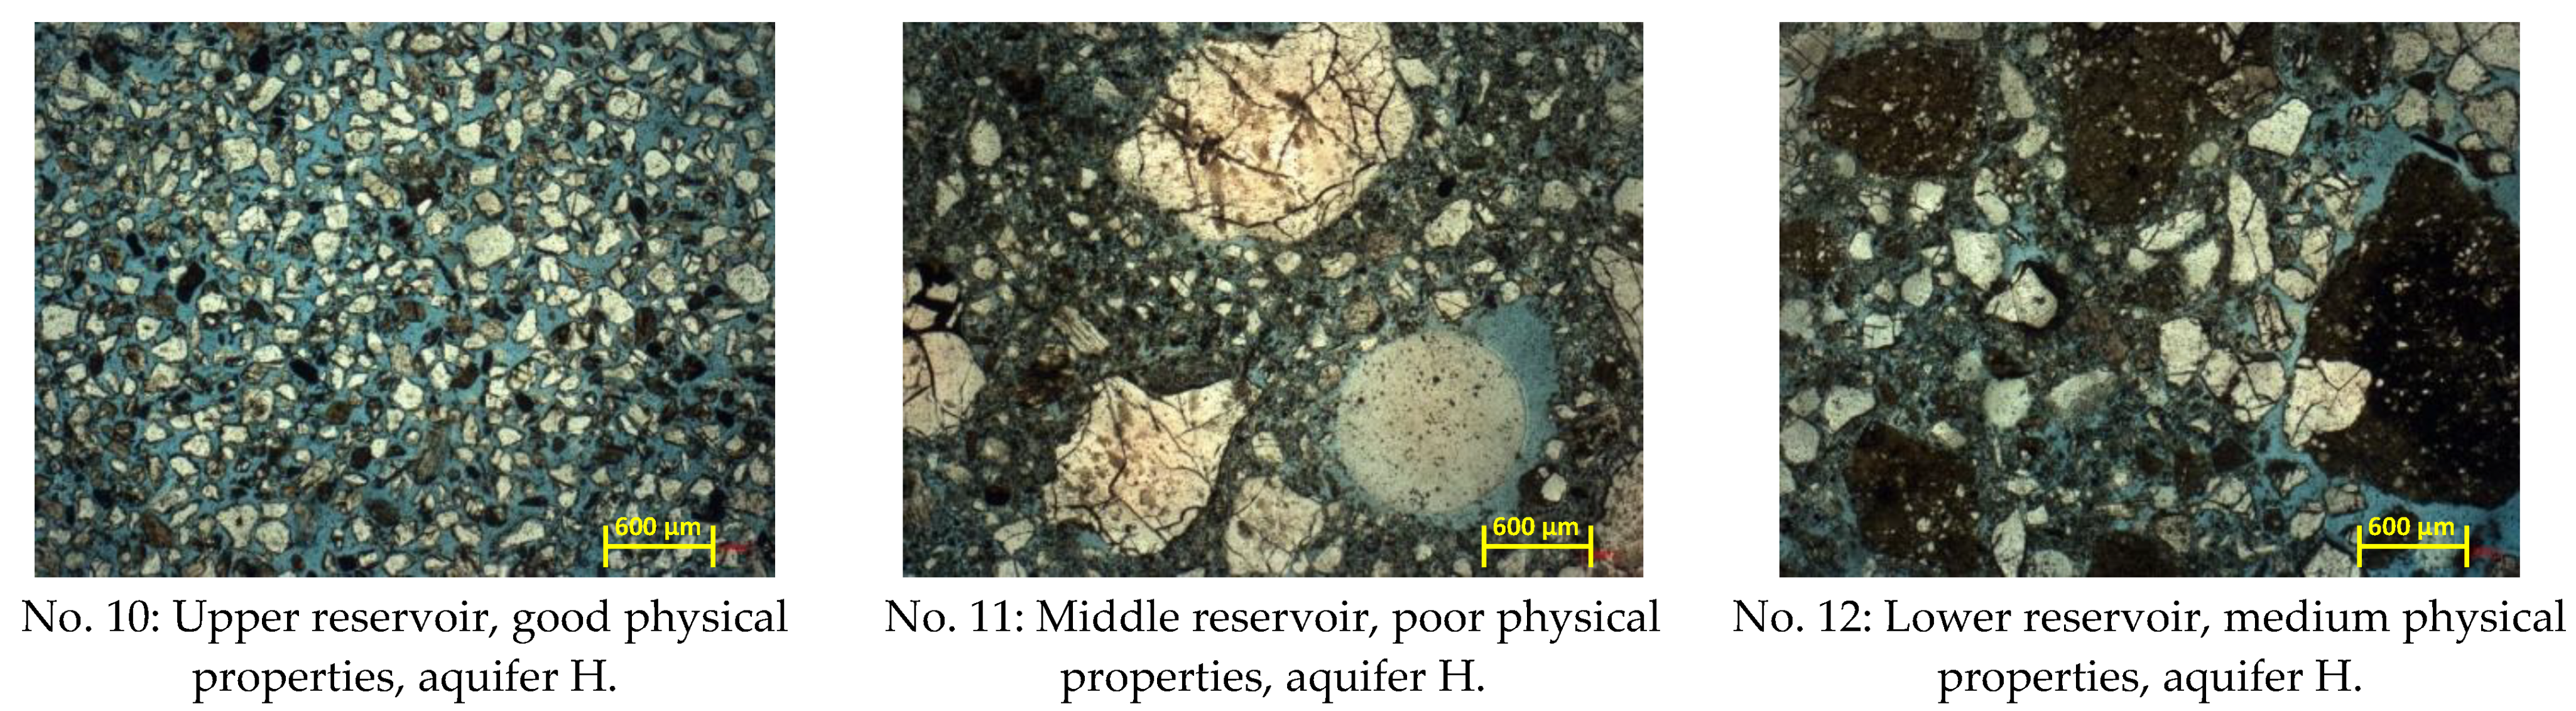
Saline aquifers Y and H are marine weakly consolidated sandstone formations. The reservoirs are mostly made up of fine-to-medium-grained sandstones as quartz arenite with a considerable amount of feldspar. The detrital grains have a large size, distinct outline, poor sorting, low content of fillings, and large intergranular pores, which can provide favorable pore space for CO2 storage. Comparatively, the caprocks contain a low content of detrital grains with a small size and a high content of argillaceous, siliceous, and ferruginous fillings with a basal cementation and good sorting, which can has a good sealing effect on CO2 storage.
(2)
Both the reservoirs and caprocks of aquifers Y and H contain a certain amount of carbonate and clay minerals. When CO2 is injected into aquifers, mineral dissolution will dominate. The contents of quartz and feldspar will increase, while the contents of calcite, dolomite, and clay minerals will decrease. At the same time, more Ca2+ and Mg2+ will be released into the formation water. Due to the different original mineral compositions, the CO2 geochemical reaction is more complicated in caprocks. The specific CO2 geochemical reaction process is determined jointly by the mineral composition, the ion concentrations, the contact surface, the P-T conditions, and the reaction time.
(3)
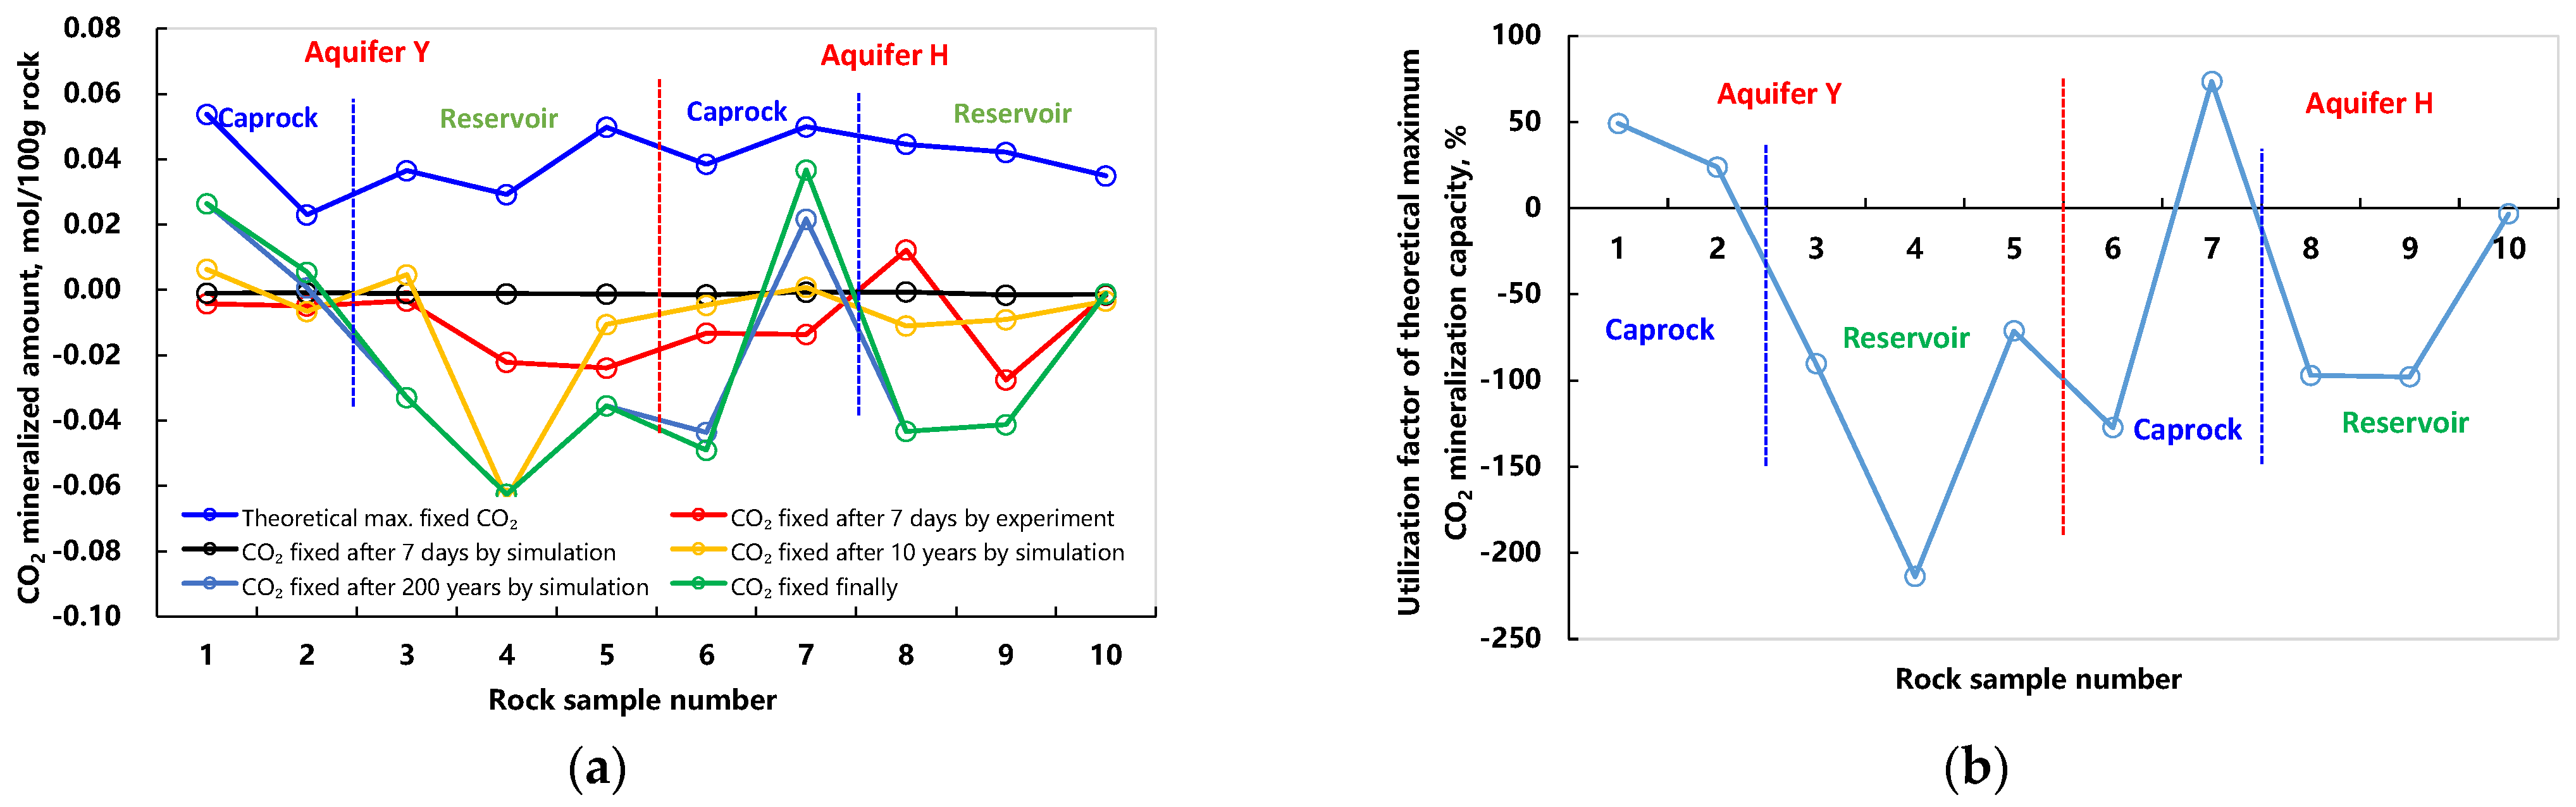
Aquifers Y and H have a theoretical maximum CO2 mineral trapping capacity of 0.023–0.0538 mol/100 g rock, but due to the dynamic equilibrium of the geochemical reaction, only a small number of rock samples can realize the effective utilization of this theoretical capacity, and the largest utilization factor is 75%, while the average utilization factor is only −55.43%. Overall, the amount of mineralized CO2 is negative, and the contribution of mineral trapping to CO2 storage capacity takes −0.32%, which can be ignored.
(4)
CO2 geochemical reaction can not only provide the CO2 mineral trapping potential but also change the aquifer’s physical properties and affect the law of CO2 seepage and the safety of CO2 storage. It is very necessary to conduct systematic and detailed research in the future to reveal the effect of geochemical reactions on CO2 storage safety, especially in offshore weakly consolidated sandstone saline aquifers which could be important potential sites for large-scale CO2 storage in China.

Author Contributions

Conceptualization, M.X.; methodology, Z.T.; validation, X.S.; investigation, Z.Y.; resources, S.F.; data curation, X.S.; writing—review and editing, F.L. and L.Z.; visualization, D.Z.; supervision, L.Z. All authors have read and agreed to the published version of the manuscript.

Funding

This research is supported by the Research Project of CNOOC China Limited (YXKY-SXSH-2021-SZ-01).

Data Availability Statement

We state that the data are unavailable due to the privacy or ethical restrictions of the company and university.

Acknowledgments

We appreciate the reviewers and editors for their constructive comments contributing to this paper’s high quality.

Conflicts of Interest

Authors Mingying Xie, Zhiyong Tu, Xiaona Sun, Zhenghe Yan, and Shasha Feng are employees of the company Shenzhen Branch of CNOOC China Limited. The remaining authors declare that the research was conducted in the absence of any commercial or financial relationships that could be construed as potential conflicts of interest.

References

  1. Zhu, W.Q.; Wang, Q. Key Technologies and prospects for the construction of global energy Internet under the background of carbon neutral. Power Gen. Technol. 2021, 42, 3–7, (In Chinese with English Abstract). [Google Scholar]
  2. Liu, P.; Yang, W.H.; Zhang, J.; Sun, H.R.; Cui, Z.X. Prospects for emission reduction technologies under carbon neutral targets. Mod. Chem. Ind. 2021, 41, 6–10, (In Chinese with English Abstract). [Google Scholar]
  3. Al-Mamoori, A.; Krishnamurthy, A.; Rownaghi, A.A.; Rezaei, F. Carbon capture and utilization update. Energy Technol. 2017, 5, 834–849. [Google Scholar] [CrossRef]
  4. Metz, B.; Davidson, O.; Coninck, H.D.; Loos, M.; Meyer, L. IPCC Special Report on Carbon Dioxide Capture and Storage; Cambridge University Press: New York, NY, USA, 2005; pp. 51–72. [Google Scholar]
  5. Damen, K.; Faaij, A.; Turkenburg, W. Health, Safety and environmental risks of underground CO2 storage—Overview of mechanisms and current knowledge. Clim. Chang. 2006, 74, 289–318. [Google Scholar] [CrossRef]
  6. Zhao, Y.; Rui, Z.H.; Zhang, Z.; Chen, S.W.; Yang, R.F.; Du, K.; Dindoruk, B.; Yang, T.; Stenby, E.H.; Wilson, M.A. Importance of conformance control in reinforcing synergy of CO2 EOR and sequestration. Petrol. Sci. 2022, 19, 3088–3106. [Google Scholar] [CrossRef]
  7. Ajayi, T.; Gomes, J.S.; Bera, A. A review of CO2 storage in geological formations emphasizing modeling, monitoring and capacity estimation approaches. Petrol. Sci. 2019, 16, 1028–1063. [Google Scholar] [CrossRef]
  8. Hameli, F.A.; Belhaj, H.; Dhuhoori, M.A. CO2 sequestration overview in geological formations: Trapping mechanisms matrix assessment. Energies 2022, 15, 7805. [Google Scholar] [CrossRef]
  9. Khan, S.; Al-Shuhail, A.A.; Khulief, Y.A. Numerical modeling of the geomechanical behavior of Ghawar Arab-D carbonate petroleum reservoir undergoing CO2 injection. Environ. Earth Sci. 2016, 75, 1499. [Google Scholar] [CrossRef]
  10. Newell, P.; Ilgen, A.G. Overview of Geological Carbon Storage (GCS); Report No. SAND2018-3352B662875; Sandia National Lab: Albuquerque, NM, USA, 2018. [Google Scholar]
  11. Khan, S.; Khulief, Y.A.; Al-Shuhail, A.A. Numerical modeling of the geomechanical behavior of Biyadh reservoir undergoing CO2 injection. Int. J. Geomech. 2017, 17, 04017039. [Google Scholar] [CrossRef]
  12. Zhang, L. Saline Aquifer Storage of CO2 from Natural Gas Reservoirs in the South China Sea: Trapping Mechanisms and Project Design; China University of Petroleum (East China): Qingdao, China, 2011; (In Chinese with English Abstract). [Google Scholar]
  13. Zhang, L.; Wen, R.; Geng, S.; Shi, X.; Hao, Y.; Ren, S. Research progress and key issues of CO2 sequestration in basalt minerals. J. Chem. Eng. Chin. Univ. 2022, 36, 473–480, (In Chinese with English Abstract). [Google Scholar]
  14. Zhang, L.; Wen, R.; Li, F.; Li, C.; Sun, Y. Assessment of CO2 mineral storage potential in the terrestrial basalts of China. Fuel 2023, 037, 157–172. [Google Scholar] [CrossRef]
  15. Matter, J.M.; Stute, M.; Snæbjornsdottir, S.O.; Oelkers, E.H.; Gislason, S.R.; Aradottir, E.S.; Sigfusson, B.; Gunnarsson, I.; Sigurdardottir, H.; Gunnlaugsson, E.; et al. Rapid carbon mineralization for permanent disposal of anthropogenic carbon dioxide emissions. Science 2016, 352, 1312–1314. [Google Scholar] [CrossRef]
  16. McGrail, B.P.; Schaef, H.T.; Ho, A.M.; Chien, Y.J.; Dooley, J.J.; Davidson, C.L. Potential for carbon dioxide sequestration in flood basalts. J. Geophys. Res. 2006, 111, B12201. [Google Scholar] [CrossRef]
  17. Zou, C.N.; Zhao, W.Z.; Jia, C.Z.; Zhu, R.K.; Zhang, G.Y.; Zhao, X.; Yuan, X.J. Formation and distribution of volcanic hydrocarbon reservoirs in sedimentary basins of China. Petrol. Explor. Dev. 2008, 35, 257–271, (In Chinese with English abstract). [Google Scholar] [CrossRef]
  18. Ren, S.R.; Zhang, L.; Zhang, L. Geological storage of CO2: Overseas demonstration projects and its implications to China. J. Chin. Univ. Petrol. 2010, 34, 93–98, (In Chinese with English Abstract). [Google Scholar]
  19. Liu, Z.; Zhang, N.; Zhang, F. A review on CO2 geological storage technologies and chemical behaviors of isotope in salty water layer. Sci. Technol. Rev. 2015, 33, 108–113. [Google Scholar]
  20. Osman, A.I.; Hefny, M.; Abdel Maksoud, M.I.A.; Elgarahy, A.M.; Rooney, D.W. Recent advances in carbon capture storage and utilisation technologies: A review. Environ. Chem. Lett. 2021, 19, 797–849. [Google Scholar] [CrossRef]
  21. Bachu, S.; Adams, J.J. Sequestration of CO2 in geological media in response to climate change: Capacity of deep saline aquifers to sequester CO2 in solution. Energ. Convers. Manag. 2003, 44, 3151–3175. [Google Scholar] [CrossRef]
  22. Czernichowski-Lauriol, I.; Rochelle, C.A.; Brosse, E.; Springer, N.; Bateman, K.; Kervevan, C.; Pearce, J.M.; Sanjuan, B.; Serra, H. Reactivity of Injected CO2 with the Usira Sand Reservoir at Sleipner, Northern North Sea. In Proceedings of the 6th International Conference on Greenhouse Gas Control Technologies, Kyoto, Japan, 1–4 October 2002; pp. 1617–1620. [Google Scholar]
  23. Gaus, I.; Azaroual, M.; Czernichowski-Lauriol, I. Reactive transport modelling of the impact of CO2 injection on the clayey cap rock at Sleipner (North Sea). Chem. Geol. 2005, 217, 319–337. [Google Scholar] [CrossRef]
  24. Maldal, T.; Tappel, I.M. CO2 underground storage for Snøhvit gas field development. Energy 2004, 29, 1403–1411. [Google Scholar] [CrossRef]
  25. Tenthorey, E.; Boreham, C.J.; Hortle, A.L.; Underschultz, J.R.; Golding, S.D. Importance of mineral sequestration during CO2 gas migration: A case study from the Greater Gorgon area. Energy Procedia 2011, 4, 5074–5078. [Google Scholar] [CrossRef]
  26. Ma, X.; Li, X.F.; Wen, D.G.; Luo, X.W.; Diao, Y.J.; Yang, G.D.; Yin, S.G.; Cao, W. A study of the potential of field-scale of CO2 geological storage and enhanced water recovery in the eastern Junggar area of Xinjiang. Hydrogeol. Eng. Geol. 2021, 48, 196–205, (In Chinese with English Abstract). [Google Scholar]
  27. Gan, M.G.; Nguyen, M.C.; Zhang, L.W.; Wei, N.; Li, J.; Lei, H.W.; Wang, Y.; Li, X.C.; Stauffer, P.H. Impact of reservoir parameters and wellbore permeability uncertainties on CO2 and brine leakage potential at the Shenhua CO2 Storage Site, China. Int. J. Greenh. Gas Control 2021, 111, 103443. [Google Scholar] [CrossRef]
  28. He, J.; Yao, Y.; Yu, J.; Zhang, J. Petroleum geological characteristics and exploration and development progress of offshore basins in China. Mar. Geol. Frontier. 2022, 38, 1–17, (In Chinese with English Abstract). [Google Scholar]
  29. Wang, J.Q.; Yuan, Y.; Chen, J.W.; Zhang, W.; Zhang, J.; Liang, J.; Zhang, Y.G. Geological conditions and suitability evaluation for CO2 geological storage in deep saline aquifers of the Beibu Gulf Basin (South China). Energies 2023, 16, 2360. [Google Scholar] [CrossRef]
  30. Su, L.; Zheng, J.J.; Chen, G.J.; Zhang, G.C.; Guo, J.M.; Xu, Y.C. The upper limit of maturity of natural gas generation and its implication for the Yacheng formation in the Qiongdongnan Basin, China. J. Asian Earth Sci. 2012, 54–55, 203–213. [Google Scholar] [CrossRef]
  31. Al-Khdheeawi, E.A.; Mahdi, D.S.; Ali, M.; Fauziah, C.A.; Barifcani, A. Impact of caprock type on geochemical reactivity and mineral trapping efficiency of CO2. In Proceedings of the Offshore Technology Conference Asia, Kuala Lumpar, Malaysia, 27 October 2020. [Google Scholar]
  32. Li, Y.; Tian, H.L.; Zhuo, Z.; Sun, Y. The potential effect of CO2-water-rock reaction on the caprock formation (mudstone) case study. Adv. Mater. Res. 2012, 518–523, 140–143. [Google Scholar] [CrossRef]
  33. Liu, F.Y.; Lu, P.; Griffith, C.; Hedges, S.W.; Soong, Y.; Hellevang, H.; Zhu, C. CO2-brine-caprock interaction: Reactivity experiments on Eau Claire shale and a review of relevant literature. Int. J. Greenh. Gas Control 2012, 7, 153–167. [Google Scholar] [CrossRef]
  34. Gaus, I. Role and impact of CO2-rock interactions during CO2 storage in sedimentary rocks. Int. J. Greenh. Gas Control 2010, 4, 73–89. [Google Scholar] [CrossRef]
  35. Pearce, J.; Underschultz, J.; Croix, A.L. Mineralogy, Geochemical CO2-Water-Rock Reactions and Associated Characterization; The University of Queensland: Brisbane, Australia, 2019. [Google Scholar]
  36. Soong, Y.; Crandall, D.; Howard, B.H.; Haljasmaa, I.; Dalton, L.E.; Zhang, L.W.; Lin, R.H.; Dilmore, R.M.; Zhang, W.; Shi, F.; et al. Permeability and mineral composition evolution of primary seal and reservoir rocks in geologic carbon storage conditions. Environ. Eng. Sci. 2018, 35, 391–400. [Google Scholar] [CrossRef]
  37. Li, J.; Chen, Z.Y.; Feng, Y.C.; Qu, L.S.; Liu, J.G.; Li, W.Y.; Dai, M.Y. Damage of reservoir rock induced by CO2 injection. Petrol. Sci. 2022, 19, 1674–1681. [Google Scholar] [CrossRef]
  38. Gysi, A.P.; Stefánsson, A. Experiments and geochemical modeling of CO2 sequestration during hydrothermal basalt alteration. Chem. Geol. 2012, 306–307, 10–28. [Google Scholar] [CrossRef]
  39. Pearce, J.K.; Brink, F.; Dawson, G.W.; Poitras, J.; Southam, G.; Paterson, D.J.; Wolhuter, A.; Underschultz, J.R. Core characterisation and predicted CO2 reactivity of sandstones and mudstones from an Australian oil field. Int. J. Coal Geol. 2022, 250, 103911. [Google Scholar] [CrossRef]
  40. Liu, H.; Ren, Y.L.; Li, X.; Hu, Y.X.; Wu, J.P.; Li, B.; Luo, L.; Tao, Z.; Liu, X.; Liang, J.; et al. Rock thin-section analysis and identification based on artificial intelligent technique. Petrol. Sci. 2022, 19, 1605–1621. [Google Scholar] [CrossRef]
  41. Ma, H.; Han, G.Q.; Peng, L.; Zhu, L.Y.; Shu, J. Rock thin sections identification based on improved squeeze-and-Excitation Networks model. Comput. Geosci. 2021, 152, 104780. [Google Scholar] [CrossRef]
  42. Apps, J.A.; Zheng, L.; Spycher, N.; Birkholzer, J.T.; Kharaka, Y.; Thordsen, J.; Kakouros, E.; Trautz, R. Transient changes in shallow groundwater chemistry during the MSU-ZERT CO2 injection experiment. Energy Procedia 2011, 4, 3231–3238. [Google Scholar] [CrossRef]
  43. CMG. GEM Manual v2021.10; Computer Modelling Group Ltd.: Calgary, AB, Canada, 2021. [Google Scholar]
  44. Nghiem, L.; Sammon, P.; Grabenstetter, J.; Ohkuma, H. Modeling CO2 Storage in Aquifers with a Fully-Coupled Geochemical EOS Compositional Simulator. In Proceedings of the SPE-89474, SPE/DOE Symposium on Improved Oil Recovery, Tulsa, OK, USA, 17 April 2004. [Google Scholar]
  45. Ji, L.; Zhang, T.; Milliken, K.; Qu, J.; Zhang, X. Experimental investigation of main controls to methane adsorption in clay-rich rocks. Appl. Geochem. 2012, 27, 2533–2545. [Google Scholar] [CrossRef]
  46. Garcia, J.E. Fluid Dynamics of Carbon Dioxide Disposal into Saline Aquifers. University of California: Berkeley, CA, USA, 2003. [Google Scholar]
  47. Wu, D.S. Fundamentals of Chemical Engineering; Higher Education Press: Beijing, China, 2000; Volume 1. (In Chinese) [Google Scholar]
  48. Cui, G.D.; Zhu, L.H.; Zhou, Q.C.; Ren, S.R.; Wang, J.Y. Geochemical reactions and their effect on CO2 storage efficiency during the whole process of CO2 EOR and subsequent storage. Int. J. Greenh. Gas Control 2021, 108, 103335. [Google Scholar] [CrossRef]
  49. Alemu, B.L.; Aagaard, P.; Munz, I.A.; Skurtveit, E. Caprock interaction with CO2: A laboratory study of reactivity of shale with supercritical CO2 and brine. Appl. Geochem. 2011, 26, 1975–1989. [Google Scholar] [CrossRef]
  50. Wollenweber, J.; Alles, S.; Busch, A.; Krooss, B.M.; Stanjek, H.; Littke, R. Experimental investigation of the CO2 sealing efficiency of caprocks. Int. J. Greenh. Gas Control 2010, 4, 231–241. [Google Scholar] [CrossRef]
  51. Gherardi, F.; Xu, T.; Pruess, K. Numerical modeling of self-limiting and self-enhancing caprock alteration induced by CO2 storage in a depleted gas reservoir. Chem. Geol. 2007, 244, 103–129. [Google Scholar] [CrossRef]
  52. Luquot, L.; Gouze, P. Experimental determination of porosity and permeability changes induced by injection of CO2 into carbonate rocks. Chem. Geol. 2009, 265, 148–159. [Google Scholar] [CrossRef]
  53. Kim, K.; Vilarrasa, V.; Makhnenko, R.Y. CO2 injection effect on geomechanical and flow properties of calcite-rich reservoirs. Fluids 2018, 3, 66. [Google Scholar] [CrossRef]
  54. Yang, G.; Ma, X.; Feng, T.; Yu, Y.; Yin, S.; Huang, M.; Wang, Y. Geochemical modelling of the evolution of caprock sealing capacity at the Shenhua CCS Demonstration Project. Minerals 2020, 10, 1009. [Google Scholar] [CrossRef]
  55. Huo, C.L. Study on Potential Evaluation and the Storage Areas of the Carbon Dioxide Seabed Storage in Offshore China; Dalian Maritime University: Dalian, China, 2014. [Google Scholar]
Figure 1. Flowchart of based on aims of study and methods utilized in the present study.
Processes 11 03345 g001
Figure 2. High-temperature and high-pressure CO2 geochemical reaction equipment.
Processes 11 03345 g002
Figure 3. Equivalent geological model of static CO2 geochemical reactor.
Processes 11 03345 g003
Figure 4. Mineral composition of each rock sample before the CO2 geochemical reaction. (a) Whole rock composition. (b) Clay mineral composition.
Processes 11 03345 g004
Figure 5. Mineral composition changes in each rock sample after the CO2 geochemical reaction. (a) Change in whole rock composition. (b) Change in clay mineral composition.
Processes 11 03345 g005
Figure 6. Concentration changes in ions in formation water with the CO2 geochemical reaction time.
Processes 11 03345 g006aProcesses 11 03345 g006b
Figure 7. Microphotographs of reservoir cores before the CO2 geochemical reaction.
Processes 11 03345 g007
Figure 8. Microphotographs of caprock cores before the CO2 geochemical reaction.
Processes 11 03345 g008
Figure 9. Microphotographs of reservoir cores after the CO2 geochemical reaction.
Processes 11 03345 g009aProcesses 11 03345 g009b
Figure 10. Microphotographs of caprock cores after the CO2 geochemical reaction.
Processes 11 03345 g010
Figure 11. Amounts of mineralized CO2 and the utilization factors of rock samples. (a) Amount of mineralized CO2. (b) Utilization factor of theoretical maximum CO2 mineral trapping capacity.
Processes 11 03345 g011
Table 1. Rock samples used for the CO2 geochemical reaction experiments.
AquifersFormationsDrill CuttingsSidewall Cores
No.Description No.Description
Aquifer YCaprock1Upper caprock1Upper caprock
//2Middle caprock
2Lower caprock3Lower caprock
Reservoir3Upper, poor physical properties4Upper, poor physical properties
4Middle, medium physical properties5Middle, good physical properties
5Lower, good physical properties6Lower, medium physical properties
Aquifer HCaprock6Upper caprock7Upper caprock
//8Middle caprock
7Lower caprock9Lower caprock
Reservoir8Upper, good physical properties10Upper, good physical properties
9Middle, mudstone interlayer11Middle, poor physical properties
10Lower, medium physical properties12Lower, medium physical properties
Table 2. Composition of formation water used for CO2 geochemical reaction experiments.
Ion Contents, mg/LAquifer YAquifer H
K+14551078
Na+12,80712,799
Ca2+494512
Mg2+214192
Fe2+0.310.14
Fe3+0.650.57
Al3+1.073.88
Ba2+1.393.57
Cl22,16321,670
SO42-289198
HCO3-338457
CO32-0.00.0
SiO235.769.1
Salinity37,80636,991
Free CO230.3028.4
pH6.997.15
Water typeCaCl2CaCl2
Table 3. Experimental scheme of CO2 geochemical reaction.
AquiferFormationT, °CP, MPaReaction Time, DayStatic Geochemical Reaction ExperimentThin Section Identification
Number, Set Rock SampleNumber, SetRock Sample
Aquifer YCaprock52.48.3972Drill cuttings3Sidewall cores
Reservoir52.48.3973Drill cuttings3Sidewall cores
Aquifer HCaprock66.911.6472Drill cuttings3Sidewall cores
Reservoir66.911.6473Drill cuttings 3Sidewall cores
Total10 12
Table 4. Reaction equations and kinetic parameters of aqueous components.
No.Reaction EquationlgKeqa(50 °C)
1H2O = H+ + OH-−13.2631
2CO2(aq) + H2O = H+ + HCO3-−6.3221
3CO2(aq) + H2O = 2H+ + CO32-−16.5563
Table 5. Reaction equations and kinetic parameters of various minerals.
No.MineralReaction EquationEquilibrium Constant lgKeq = a0 + a1 × t + a2 × t2 + a3 × t3 + a4 × t4, WHere, t Is Temperature, °CEquilibrium Constant lgKeq@52.4 °CEquilibrium Constant lgKeq@66.9 °CActivation Energy, J/molReaction Frequency Factor, mol/m2/s1 @25 ℃Reaction Surface Area, m2/m3
a0a1a2a3a4
1Quartz
SiO2
Quartz = SiO2(aq)−4.49702.1973 × 10−2−1.0732 × 10−43.2461 × 10−7−3.9670 × 10⁻¹⁰−3.5965−3.418087,500−13.97182
2K−feldspar
KAlSi3O8
K−feldspar + 4H+ = 2H2O + K+ + Al3+ + 3SiO2(aq)4.6130 × 10⁻¹−1.5114 × 10⁻²−3.8920 × 10−54.2895 × 10−7−9.2187 × 10⁻¹⁰−3.8279 × 10⁻¹−6.1408 × 10−167,830−12176
3Albite
NaAlSi3O8
Albite + 4H+ = 2H2O + Na+ + Al3+ + 3SiO2(aq) 3.9232−3.4500 × 10−22.5244 × 10−53.0994 × 10⁻⁷−8.3137 × 10−102.22301.804267,830−12250
4Anorthite
Ca [Al2Si2O8]
Anorthite + 8H+ = 4H2O + Ca2+ + 2Al3 + + 2SiO2(aq) 3.1746 × 10−2.0125 × 10−15.9589 × 10⁻⁴−9.0412 × 10−79.1539 × 10−112.2707 × 102.0680 × 1067,830−1288
5Calcite
CaCO3
Calcite + H+ = Ca2+ + HCO3 2.0689−1.4267 × 10⁻²−6.0610 × 10−61.4592 × 10−7−4.1893 × 10−101.32251.122641,870−8.888
6Dolomite
CaMg(CO3)2
Dolomite + 2H+ = Ca2+ + Mg2+ + 2HCO3 3.3944−3.5598 × 10−21.3261 × 10−52.4106 × 10⁻⁷−8.1493 × 10−101.59401.128141,870−9.221888
7Ankerite
CaMg0.3Fe0.7(CO3)2
Ankerite + 2H+ = Ca2+ + 0.3Mg2+ + 2HCO3 + 0.7Fe2+ 4.4773 × 10⁻¹−2.5961 × 10−23.3916 × 10−78.9790 × 10⁻⁸−3.4126 × 10⁻¹⁰−9.0135 × 10⁻¹−1.267546,276−8.888
8Siderite
FeCO3
Siderite + H+ = HCO3 + Fe2+2.5397 × 10⁻¹−1.9361 × 10−29.4810 × 10−61.1710 × 10⁻⁷−4.1245 × 10⁻¹⁰−7.2077 × 10⁻¹−9.7204 × 10−141,870−9.2288
9Pyrite
FeS2
Pyrite +H2O = Fe2+ + 0.25H+ + 0.25SO42− + 1.75HS −2.6441 × 107.6600 × 10−2−2.8402 × 10−44.6293 × 10−7−3.9254 × 10⁻¹⁰−2.3143 × 10−2.2457 × 1056.9−4.55C50.1
10Illite
K0.6Mg0.25Al1.8(Al0.5Si3.5O10)(OH)2
Illite + 8H+ = 5H2O + 0.6K+ + 0.25Mg2+ + 2.3Al3+ + 3.5 SiO2(aq) 1.2435 × 10−1.1227 × 10−12.7171 × 10⁻⁴−8.0564 × 10⁻⁸−8.3378 × 10−107.28026.099458,620−148573
11Chlorite
Fe2.5Mg2.5Al2Si3O10(OH)8
Chlorite + 16H+ = 2.5Fe2+ +2.5 Mg2+ + 12H2O+ 2Al3+ + 3SiO2(aq)6.6571−1.0170 × 10−12.0000 × 10−4−2.0000 × 10⁻⁷−5.0000 × 10−101.84466.7859 × 10−162,760−1414,178
12Kaolinite
Al2Si2O5(OH)4
Kaolinite + 6H+ = 5H2O + 2Al3+ + 2SiO2(aq) 9.7295−9.8898 × 10−22.9156 × 10−4−3.2703 × 10⁻⁷−3.3110 × 10−105.29834.313662,760−1317,600
13Smectite
Ca0.145Mg0.26Al1.77Si3.97O10(OH)2
Smectite + 6.12H+ = 0.145Ca2+ + 0.26Mg2+ + 1.77Al3+ + 3.97SiO2(aq) + 4.06H2O 2.3304 × 10−1.2959 × 10−14.6020 × 10⁻⁴−1.0434 × 10−68.4942 × 10−101.7633 × 101.6399 × 1058,620−1426,400
Table 6. Mineral compositions of rock samples before the CO2 geochemical reaction.
Sample # Mineral Composition of Whole Rock, %Composition of Clay Minerals, %
QuartzK-FELDSPARPlagioclaseCalciteDolomiteAnkeriteSideritePyriteClay MineralsKaoliniteChloriteIlliteIllite/Smectite
160.866.038.53.84-8.42-1.8310.5217233327
282.376.063.761.58-1.26-0.774.220253421
376.975.165.671.95-1.52-1.037.719243423
474.395.996.254.931.171.05-0.765.4622223422
566.435.466.216.741.280.9-1.4711.5120243620
667.76.986.087-1.841.21.457.7522203325
768.147.246.32-1.47-0.981.7114.1425173325
863.546.636.316.63-1.5-1.0612.7824193423
963.597.856.365.550.790.790.90.9112.1620193229
1068.287.676.127.06-1.15-0.72923203324
Note: 1–2 are caprock samples of aquifer Y, 3–5 are reservoir samples from aquifer Y, 6–7 are caprock samples from aquifer H, and 8–10 are reservoir samples from aquifer H.
Table 7. Mineral compositions of rock samples after the CO2 geochemical reaction.
Sample #Mineral Composition of Whole Rock, %Composition of Clay Minerals, %
QuartzK-FeldsparPlagioclaseCalciteAnkeriteSideritePyriteClay MineralsKaoliniteChloriteIlliteIllite/Smectite
161.736.017.184.377.41-2.4210.8821213028
28554.291.281.04-0.52.8922223125
378.795.386.411.571.52-0.95.4318183331
475.876.186.163.731.24-0.95.9220192932
567.646.128.554.51.95-1.0810.1620182933
668.78.526.596.231.570.91.416.0820162341
769.787.486.94-1.12-1.4213.2621142243
861.67.547.656.751.521.111.1912.6418152938
968.047.15.464.283.480.61.59.5420182735
1069.936.594.696.460.880.710.789.9620173033
Table 8. Amounts of mineralized CO2 and the utilization factors of rock samples.
No.Amount of Mineralized CO2, Mol/100 g RockFinial Utilization Factor, %
Theoretical Max. ValueExperimental Value (after 7 Days)Predicted Value
7 Days10 Years200 YearsFinally
10.0538−0.0042−0.00100.00630.02640.026449.15
20.0230−0.0049−0.0008−0.00660.00070.005523.78
30.0365−0.0034−0.00110.0047−0.0329−0.0329−90.19
40.0292−0.0221−0.0011−0.0638−0.0625−0.0625−213.79
50.0498−0.0239−0.0012−0.0106−0.0355−0.0355−71.22
60.0385−0.0132−0.0015−0.0047−0.0436−0.0491−127.39
70.0500−0.0136−0.00060.00080.02170.036873.55
80.04460.0122−0.0006−0.0110−0.0433−0.0433−97.04
90.0421−0.0276−0.0015−0.0091−0.0412−0.0412−97.86
100.0349−0.0015−0.0013−0.0034−0.0011−0.0011−3.28
Disclaimer/Publisher’s Note: The statements, opinions and data contained in all publications are solely those of the individual author(s) and contributor(s) and not of MDPI and/or the editor(s). MDPI and/or the editor(s) disclaim responsibility for any injury to people or property resulting from any ideas, methods, instructions or products referred to in the content.

