Article

The Influence of Hydraulic Characteristics on Structural Performance in a Pump-Turbine under No-Load Conditions

1
College of Energy and Electrical Engineering, Hohai University, Nanjing 211100, China
2
Huaishu New River Management Office of Jiangsu Province, Huaian 223001, China
3
Luoyun Water Conservancy Project Management Divison in Jiangsu Province, Suqian 223800, China
4
Technological Institute of Merida, Technological Avenue, Merida 97118, Mexico
*
Author to whom correspondence should be addressed.
Processes 2023, 11(12), 3422; https://doi.org/10.3390/pr11123422
Submission received: 8 November 2023 / Revised: 6 December 2023 / Accepted: 11 December 2023 / Published: 13 December 2023
(This article belongs to the Special Issue CFD Applications in Energy Engineering Research and Simulation)

Abstract

:
The operating state of a pump-turbine unit under no-load conditions is directly related to its safe and stable operation. In order to probe into the influence of hydraulic characteristics on structural performance, a pump-turbine assembled in China is selected for research by using CFD (computational fluid dynamics) and unidirectional FSI (fluid–structure interaction) methods. The vortex distribution and the law of pressure pulsation propagation are analyzed to capture the peculiar flow phenomena. The results show that the vortex distribution in the runner channel appears initially at the suction side of the blades but then propagates toward the pressure side with GVO. This produces rotating stall frequencies (0.7fn) and a combination of the RSI, asymmetry of the water ring in vaneless space, and high-amplitude pressure pulsations in the downstream channel close to the runner inlet and elbow section of the draft tube. This, in turn, is associated with the structural stress of the runner and guide vane. The stress level of the guide vane becomes alleviated under no-load conditions with large GVO, but the stress distribution of the runner is no longer symmetrical, which aligns with the vortex evolution in the runner passage. The stress concentration that develops further along the blade root increases the structural failure, which is also captured and verified as a crack in the prototype runner. The phenomena suggest that the RPT should avoid operating under no-load conditions with large GVO as far as possible. Therefore, in the design or optimization of the pump-turbine unit, the structures of the guide vanes and runner could be treated as a whole to investigate the resulting internal flow and structure characteristics.

1. Introduction

With the increasing proportion of renewable energy in electric power systems, the set goals mainly include the improvement of energy conversion [1,2,3] and the development of pumped storage units to ensure the power generation quality and safety of the reversible operating condition [4]. Nevertheless, this demands greater operating intensity in the reversible pump-turbines (RPTs), leading to failure if not properly contemplated. Therefore, the characteristic of the pumped storage technology determines the complexity of the operating conditions in the unit, such as off-design conditions [5,6] and extreme working conditions. Particularly, during the no-load condition, after the full-load rejection in generating mode, the RPT can suffer flow instability under the influence of “S” characteristics [7,8,9]; this is manifested as a high rotation speed and large flow fluctuation. If the slope of the point discharge relative to the rotation speed change under no-load conditions [10] is positive (i.e., the full characteristic curve is represented as the “S” region), the same rotation speed could correspond to multiple different flows. In other words, the internal flow rate of the unit changes, resulting in rotor–stator interaction (RSI) [11] and a severe pressure pulsation and rotating stall [12].
With regard to the above problems, Tanaka [13] proposed a radial vibration of a high head pump-turbine through theoretical and experimental tests. The results indicated that the inlet edges and the areas near the inlet, which were about 0.5 pitch chord length of the runner, concentrated the stress. Hu et al. [14] probed into the transition process of amplitude-frequency characteristics of a pump-turbine with splitter blades (4 + 4) under rated head and high discharge conditions, which are unlike equal-blade pump-turbines. As the flow rate decreased, the dominant frequency of pressure pulsation in the vaneless zone changed from 4fn to 8fn, corresponding to half and whole numbers of runner blades, respectively. Han et al. [15] investigated the influence of the distance between the rotor and stator on the RSI strength of mixed-flow centrifugal pumps. They demonstrated that the increasing rotor–stator distance could reduce the pressure change amplitude without varying the hydraulic performance of centrifugal pumps significantly. Some scholars [12,16,17] utilized numerical calculation and model experiments in research for rotating stalls in RPTs and concluded that the characteristic frequency of a rotating stall is approximately 50~70% of the runner rotational frequency. Moreover, the high-speed water retaining ring [18] in the vaneless zone is gradually blurred with the broadening of the GVO, and the blockage of the flow channel increases. This is manifested as the symmetry of the vortex structure distribution inside the runner worsens [5,19] and the pressure pulsation intensity augments.
For the enhancement of operating instability and improvement of the “S” characteristic of pump-turbine, Fu et al. [20] offered some corresponding measures using 1D + 3D coupled simulation, such as decreasing the runaway rotational speed, increasing the minimum head of pump-turbine, and increasing the height of guide vanes, etc. Some runners with equal-length blades were designed and modified with splitter blades by Hu [14,21], and the runner with splitter blades could markedly improve the S-shaped characteristic but decrease the hydraulic efficiency under design conditions. As the “S” characteristic is closely related to the geometric parameters of the leading edge of the runner blade, Li et al. [22,23] optimized the blade’s high-pressure side to reduce the pressure pulsation and suggested that the runner with the large negative blade lean behaves better in terms of operational stability.
As stated above, most of the currently published papers concentrate on the analysis of inner flow characteristics and pressure pulsation under operating conditions in the “S” region and propose improvement measures [24,25] correspondingly. The research object of structural performance is usually aimed at a single component, thus limiting knowledge on the effect of internal flow on the structural response of combined components (e.g., runner and guide vane) under no-load conditions.
Therefore, we model a prototype RPT assembled in China to investigate its internal flow characteristics, pressure pulsation under no-load conditions, and influence of hydraulic characteristics on the structural performance of the guide vane and runner. This paper is divided into five sections. Section 2 deals with the numerical calculations of working conditions using different GVO. Then, the internal flow characteristics and the law of pressure pulsation propagation of pump-turbine are discussed in Section 3 and Section 4, respectively. The influence on the structure of guide vanes and runner is analyzed in Section 5. This work could provide a reference for the design and optimization of pump-turbine structures and for the improvement of operational stability as well.

2. Numerical Model and Settings

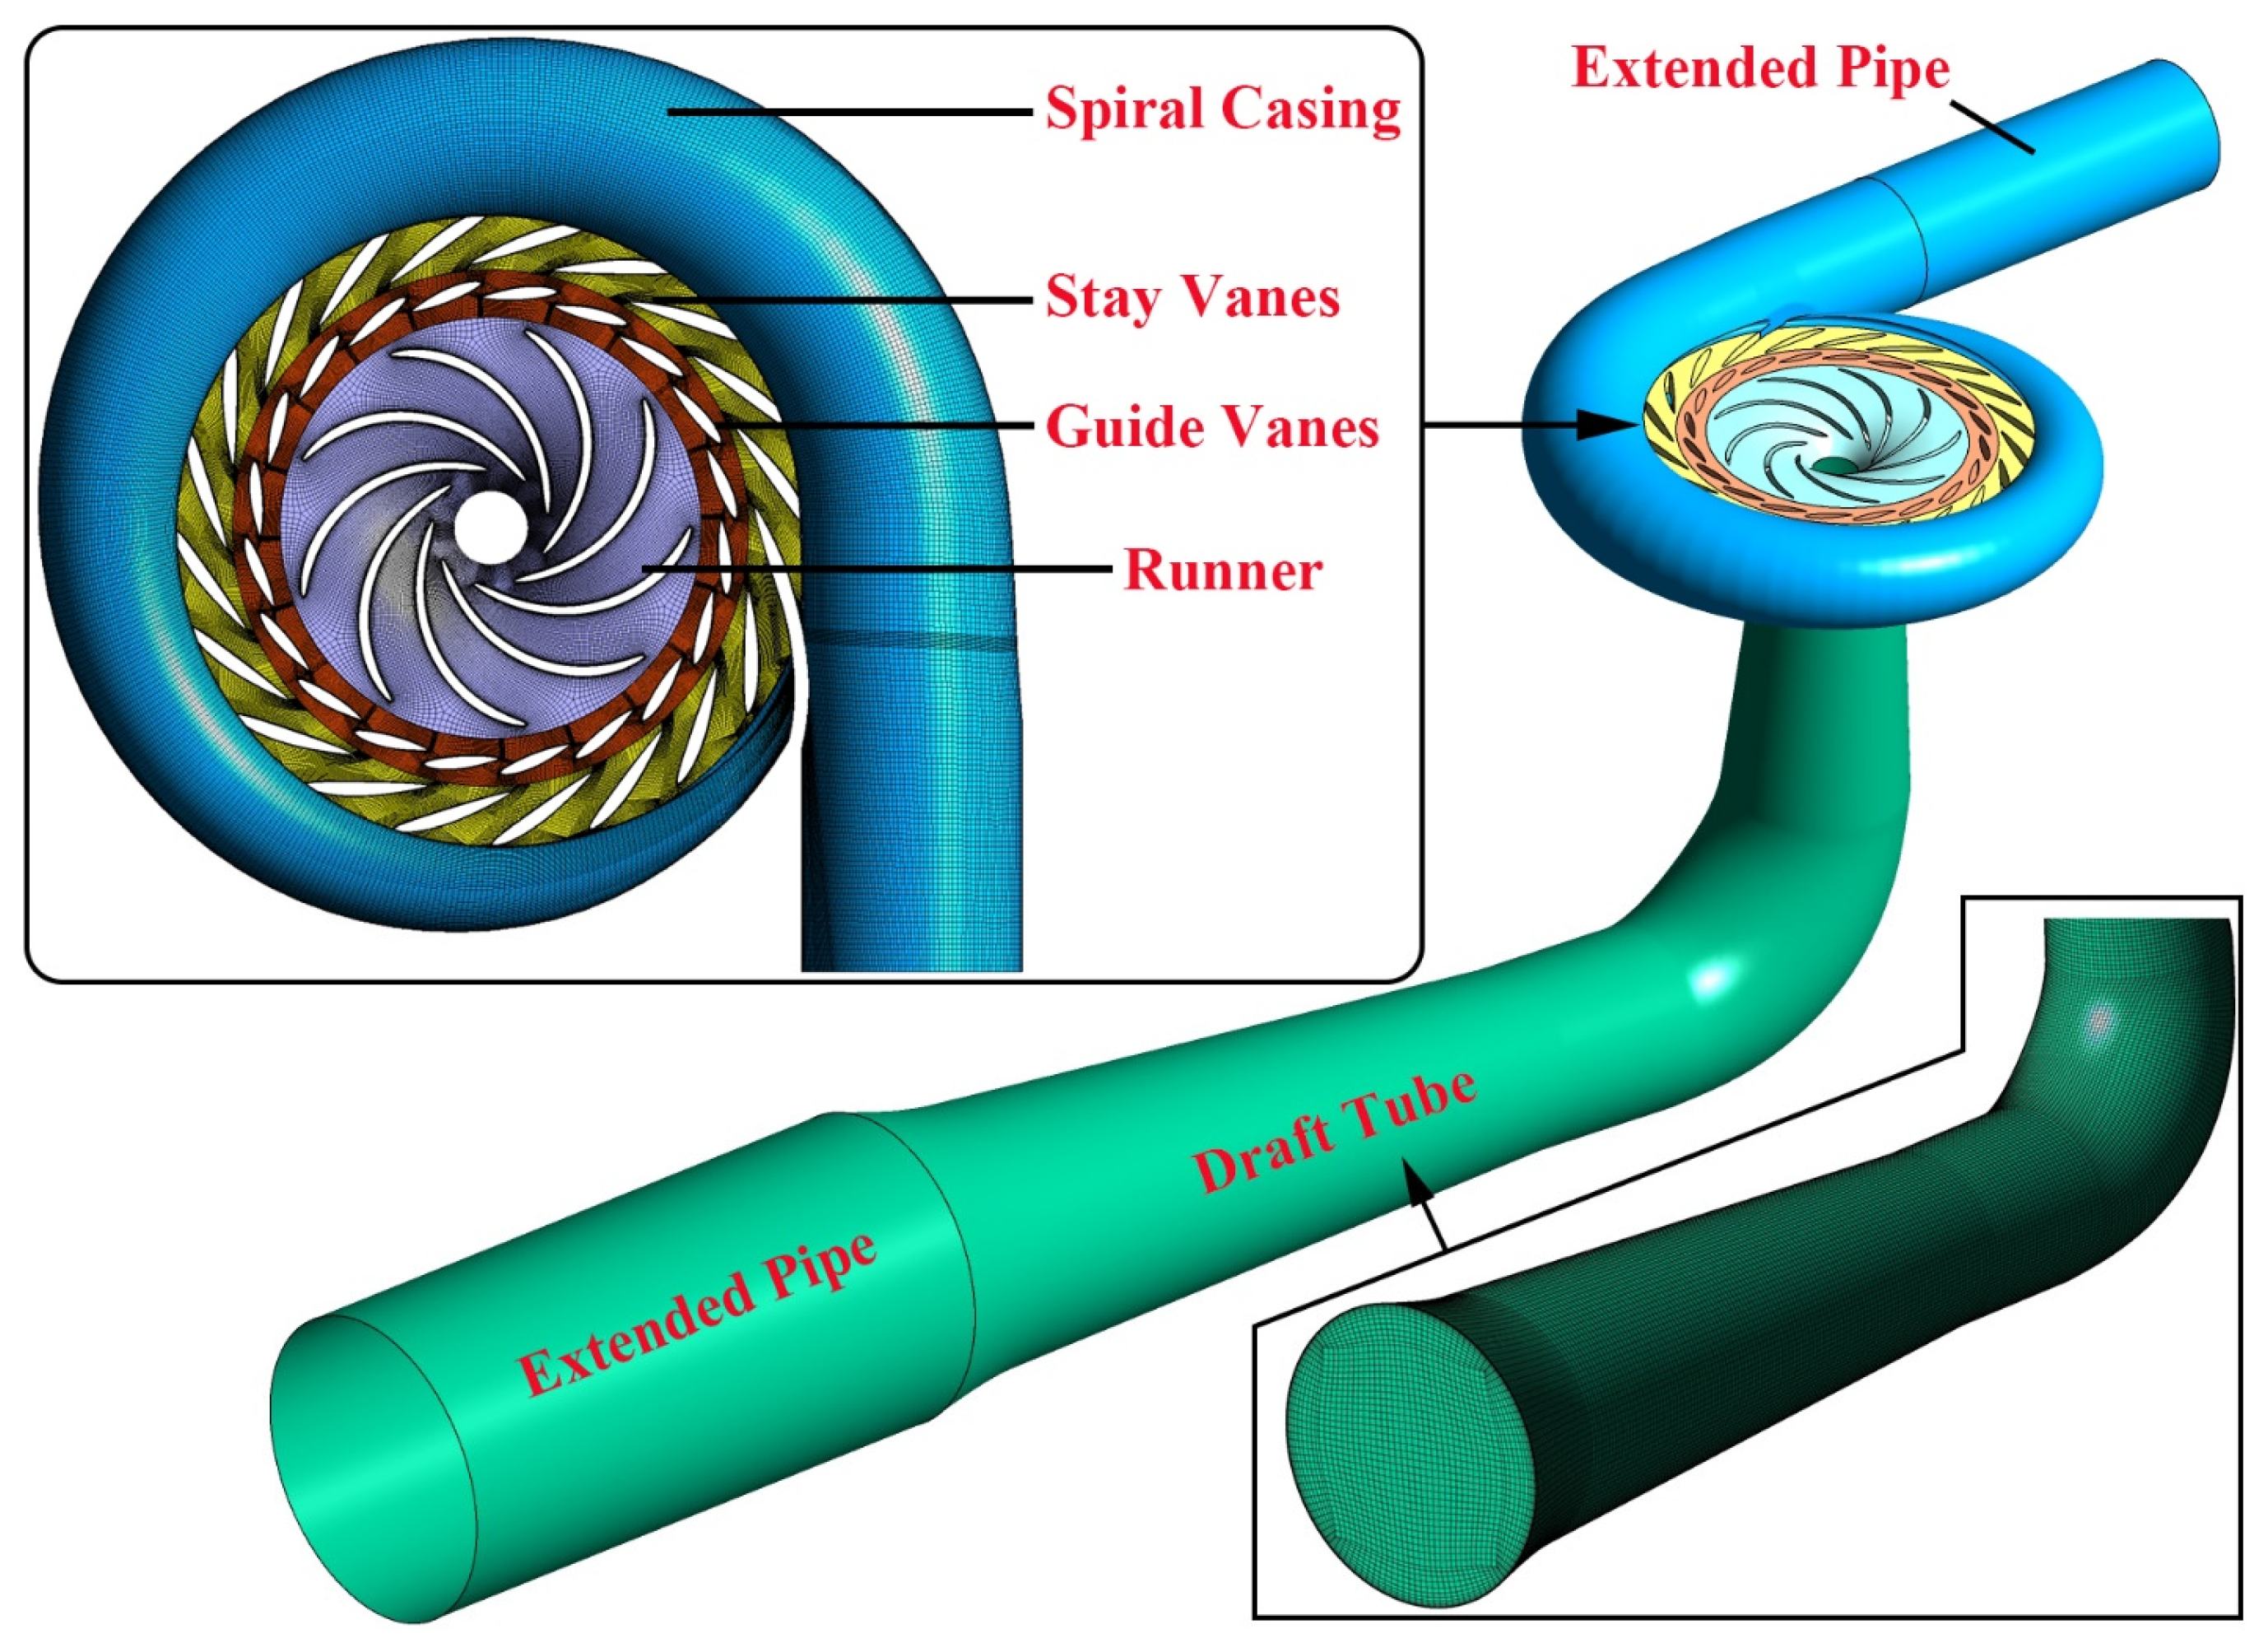
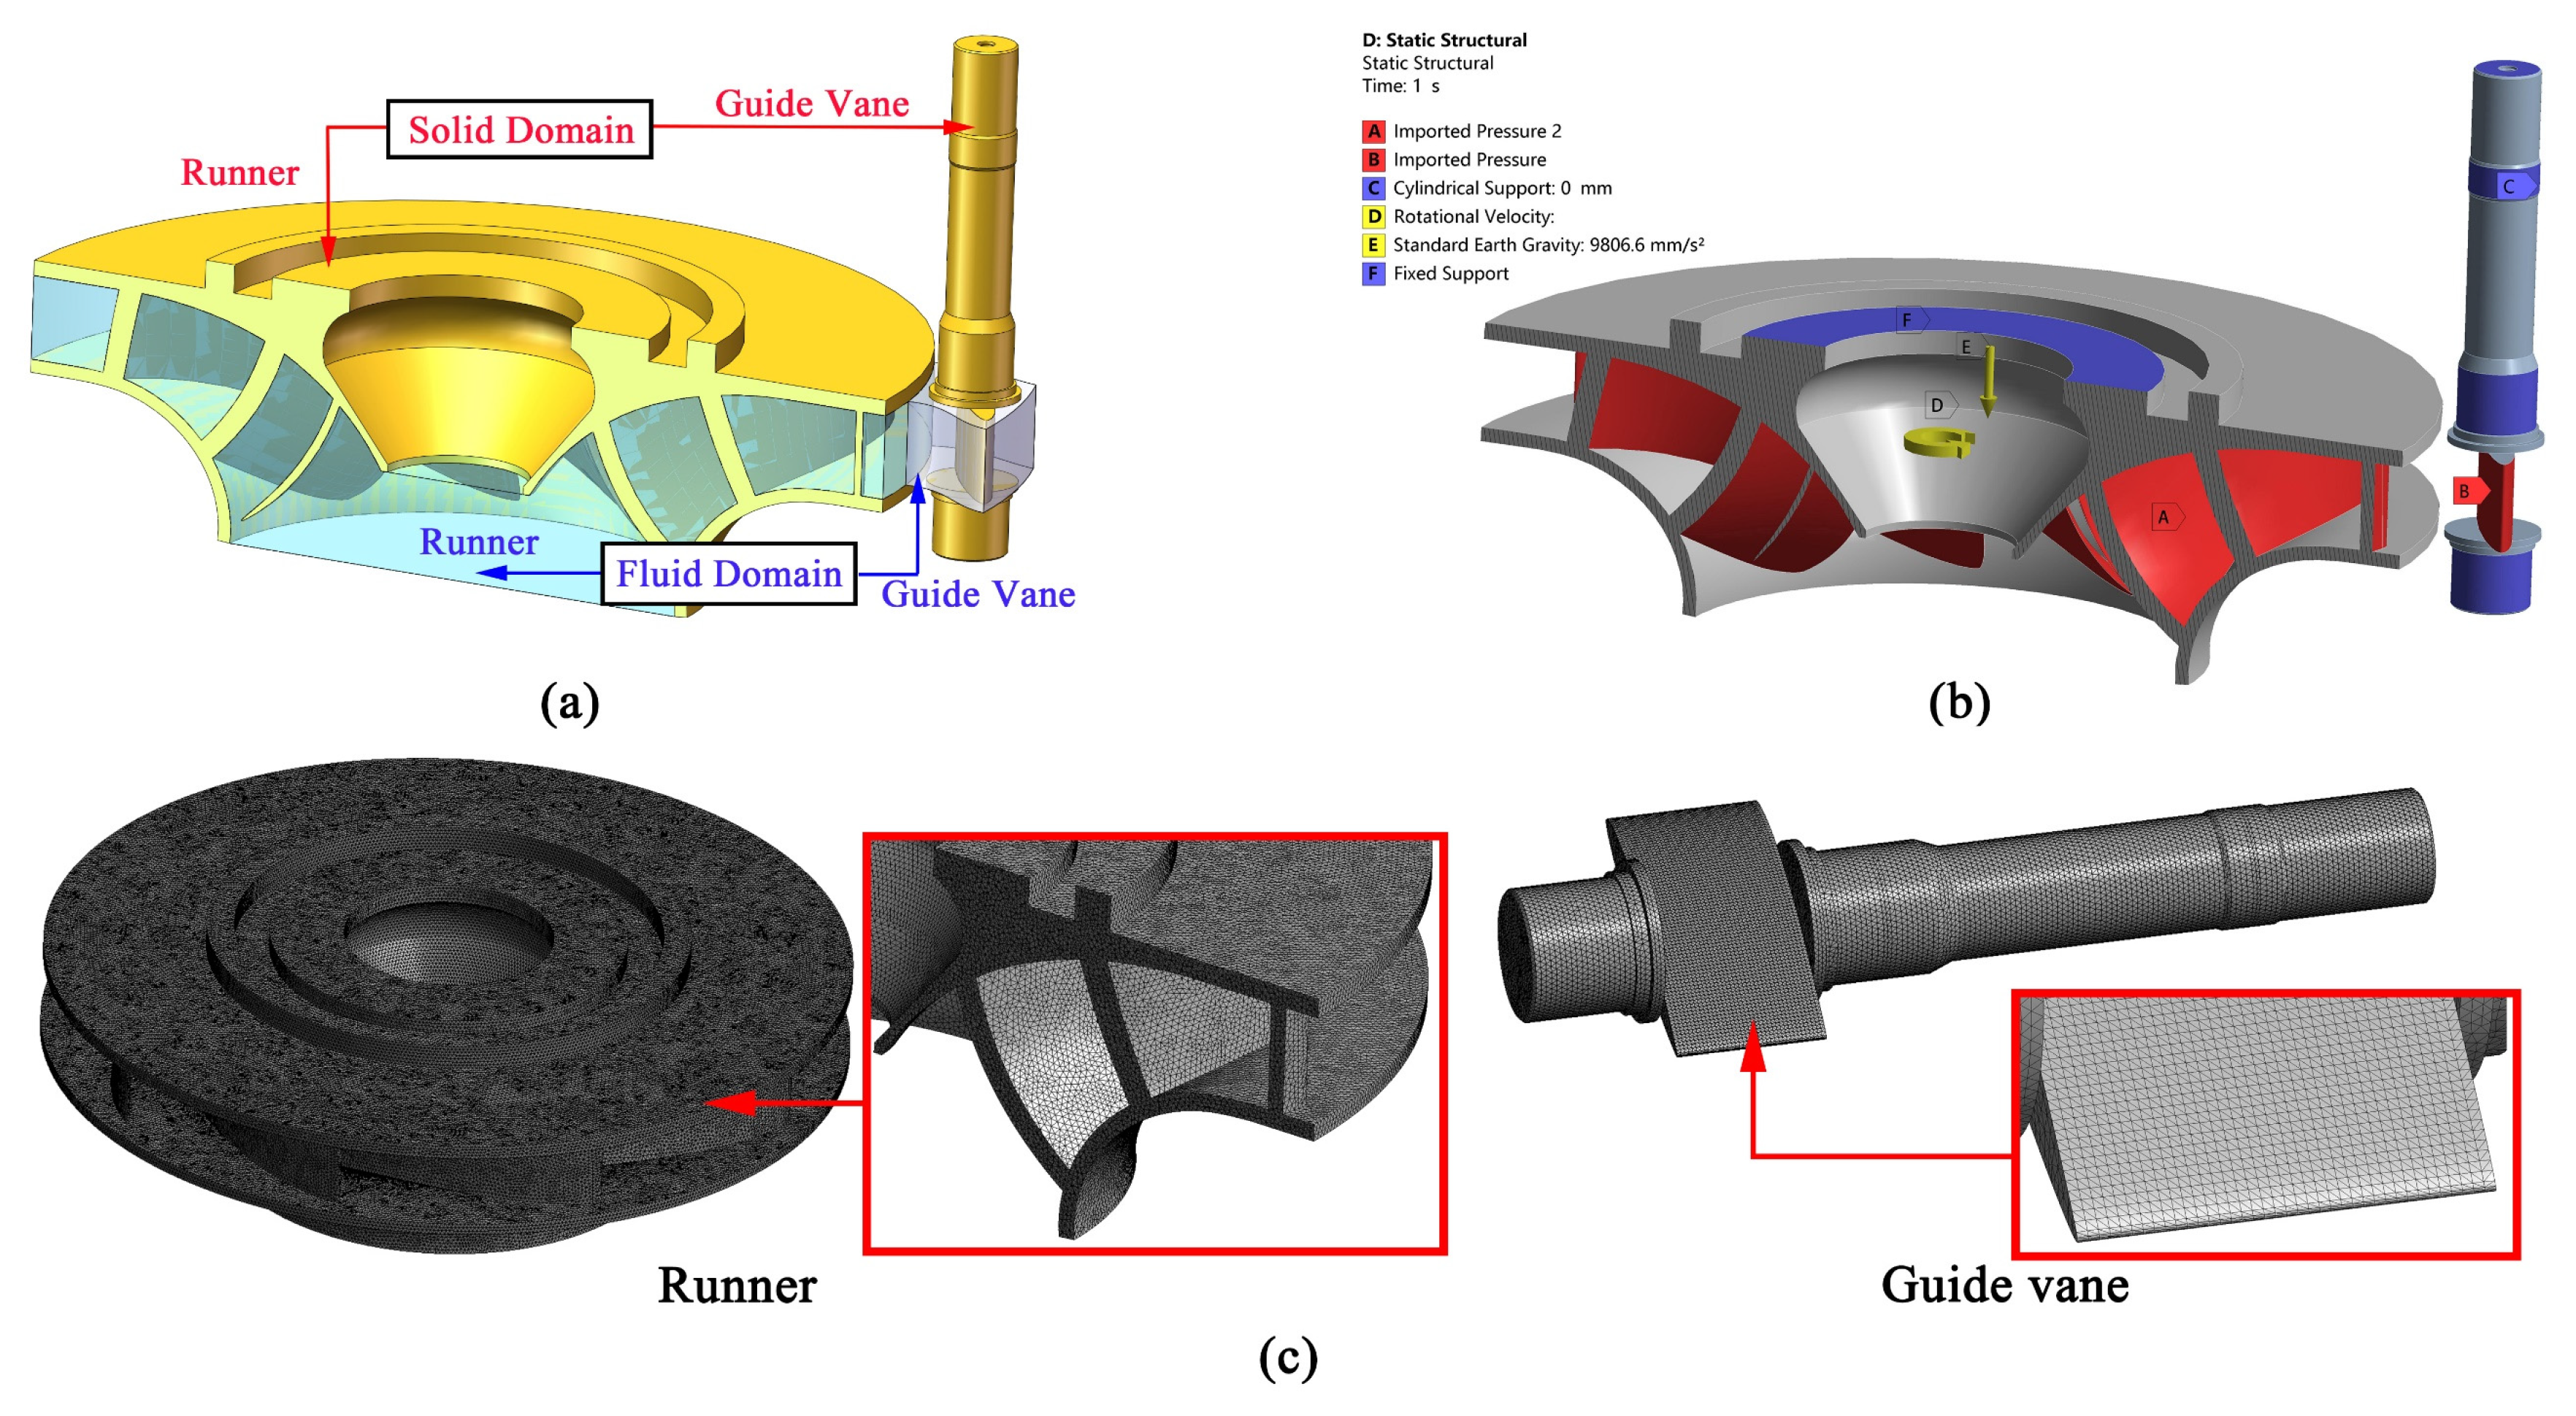
2.1. Illustration of Numerical Model

The Chinese prototype pump-turbine is constituted by a spiral casing, tandem cascade (stay vanes and guide vanes), runner, draft tube, and the extended pipes set at the inlet of the spiral casing and the outlet of the draft tube, respectively. This is shown in Figure 1, with the main parameters being shown in Table 1. After weighing the computational accuracy against computing resource consumption, all of the above hydraulic components were divided with a structured mesh [15,20,26], and the grids at the near-interface layer, profiles of vanes, and blades were refined by O-blocks and Y-blocks and converted into an unstructured mesh for the following calculation. The total number of meshes was finally determined to be 7.3 × 10⁶ by virtue of a mesh independence test (shown in Section 2.3).

2.2. Turbulence Model and Boundary Conditions

In light of the complexity of internal flow under no-load conditions, the selection of a turbulence model is considered for its influence on the calculation accuracy [8,9] so as to capture the generation and evolution of the vortex structure in the flow passage. Although the dimensionless distance y + between the first layer nodes of mesh and the wall is required to be close enough, the SST k ω model has been widely put to use for numerous numerical simulations of hydraulic machinery, like centrifugal pump [27], pump as turbine (PAT) [28], floating tidal stream turbine [29], etc. Since k ω and k ε models are deployed in the SST model near and away from the wall, respectively, the transport of shear stress in the inverse pressure gradient is adequately taken into consideration without over-predicting the turbulent viscosity. Thus, the momentum equation is closed by this model for the solution. The k (Equation (1)) and ω equations (Equation (2)) can be depicted as follows:
ρ k t + ρ k u j x j = x j ( μ + σ k μ t ) k x j + P k D k
ρ ω t + ρ ω u j x j = x j ( μ + σ ω μ t ) ω x j + P ω D ω + S ω
where ρ denotes the fluid density, k denotes the turbulent kinetic energy, (T.K.E), ω is the ratio dissipation rate of T.K.E, u j is the average turbulent velocity, μ is the coefficient of viscosity, P k and D k are the generating term and dissipative term of turbulence, respectively, S ω is the cross-diffusion term, and σ is a coefficient where the subscript k and ω represent the k equation and ω equation, respectively.
Based on the actual operation of the pumped storage unit, the boundary condition’s setup is as follows: the mass flow rate is specified at the upstream inlet of the spiral casing, and the downstream outlet of the draft tube is set with the static pressure. The flow surface of each component is assumed as a no-slip wall formulation, and the dimensionless distance y + is controlled in the range of 15 to 200. Moreover, data transmission between stationary parts is accessed by general grid interfaces (GGIs). Considering that the circumferential speed distribution in the vicinity of the runner domain will be uneven due to the action of blades, the frozen rotor model takes into account the relative positions of both sides of the rotor and stator interface, allowing the flow parameters to vary greatly in the circumferential direction. This is adopted for interfaces of a runner with guide vanes upstream and with draft tubes downstream, but it is replaced with a transient rotor–stator in unsteady computation settings. The total simulation time corresponds to the period of 10 runner rotations, and the runner revolves about 2 ° per time step. In order to obtain the law of pressure pulsation change during the simulation process, several pressure monitoring points are located in the entire flow channels (Figure 2). A total of six monitoring points from SC1 to SC6 are arranged in the spiral casing so as to capture the upstream transmission capacity of pressure pulsation from the downstream hydraulic components, like guide vanes, vaneless space, and runner. The GR monitoring points are located uniformly at the vaneless region between the guide vanes and the runner, whose number is consistent with the number of guide vanes. In contrast to the arrangement of a single point or several symmetrical points, the points GR1~GR20 can simultaneously observe the pressure pulsation changes in both adjacent and symmetrical positions. Based on the above considerations, the RN points in the runner and the DT points in the draft tube are also assigned in this manner. Due to the difference in the flow pattern of the runner inlet and outlet, there are five monitoring points set in order from the high- to low-pressure sides in each single-blade channel, which are named RNx-1 to RNx-5, respectively, where x corresponds to the blade number. In the draft tube, six cross-sections are chosen from the conical to the diverging section. Each cross-section contains a center monitoring DTM point for capturing the vortex rope frequency and 12 DT points for the rotational flow near the wall of the draft tube.

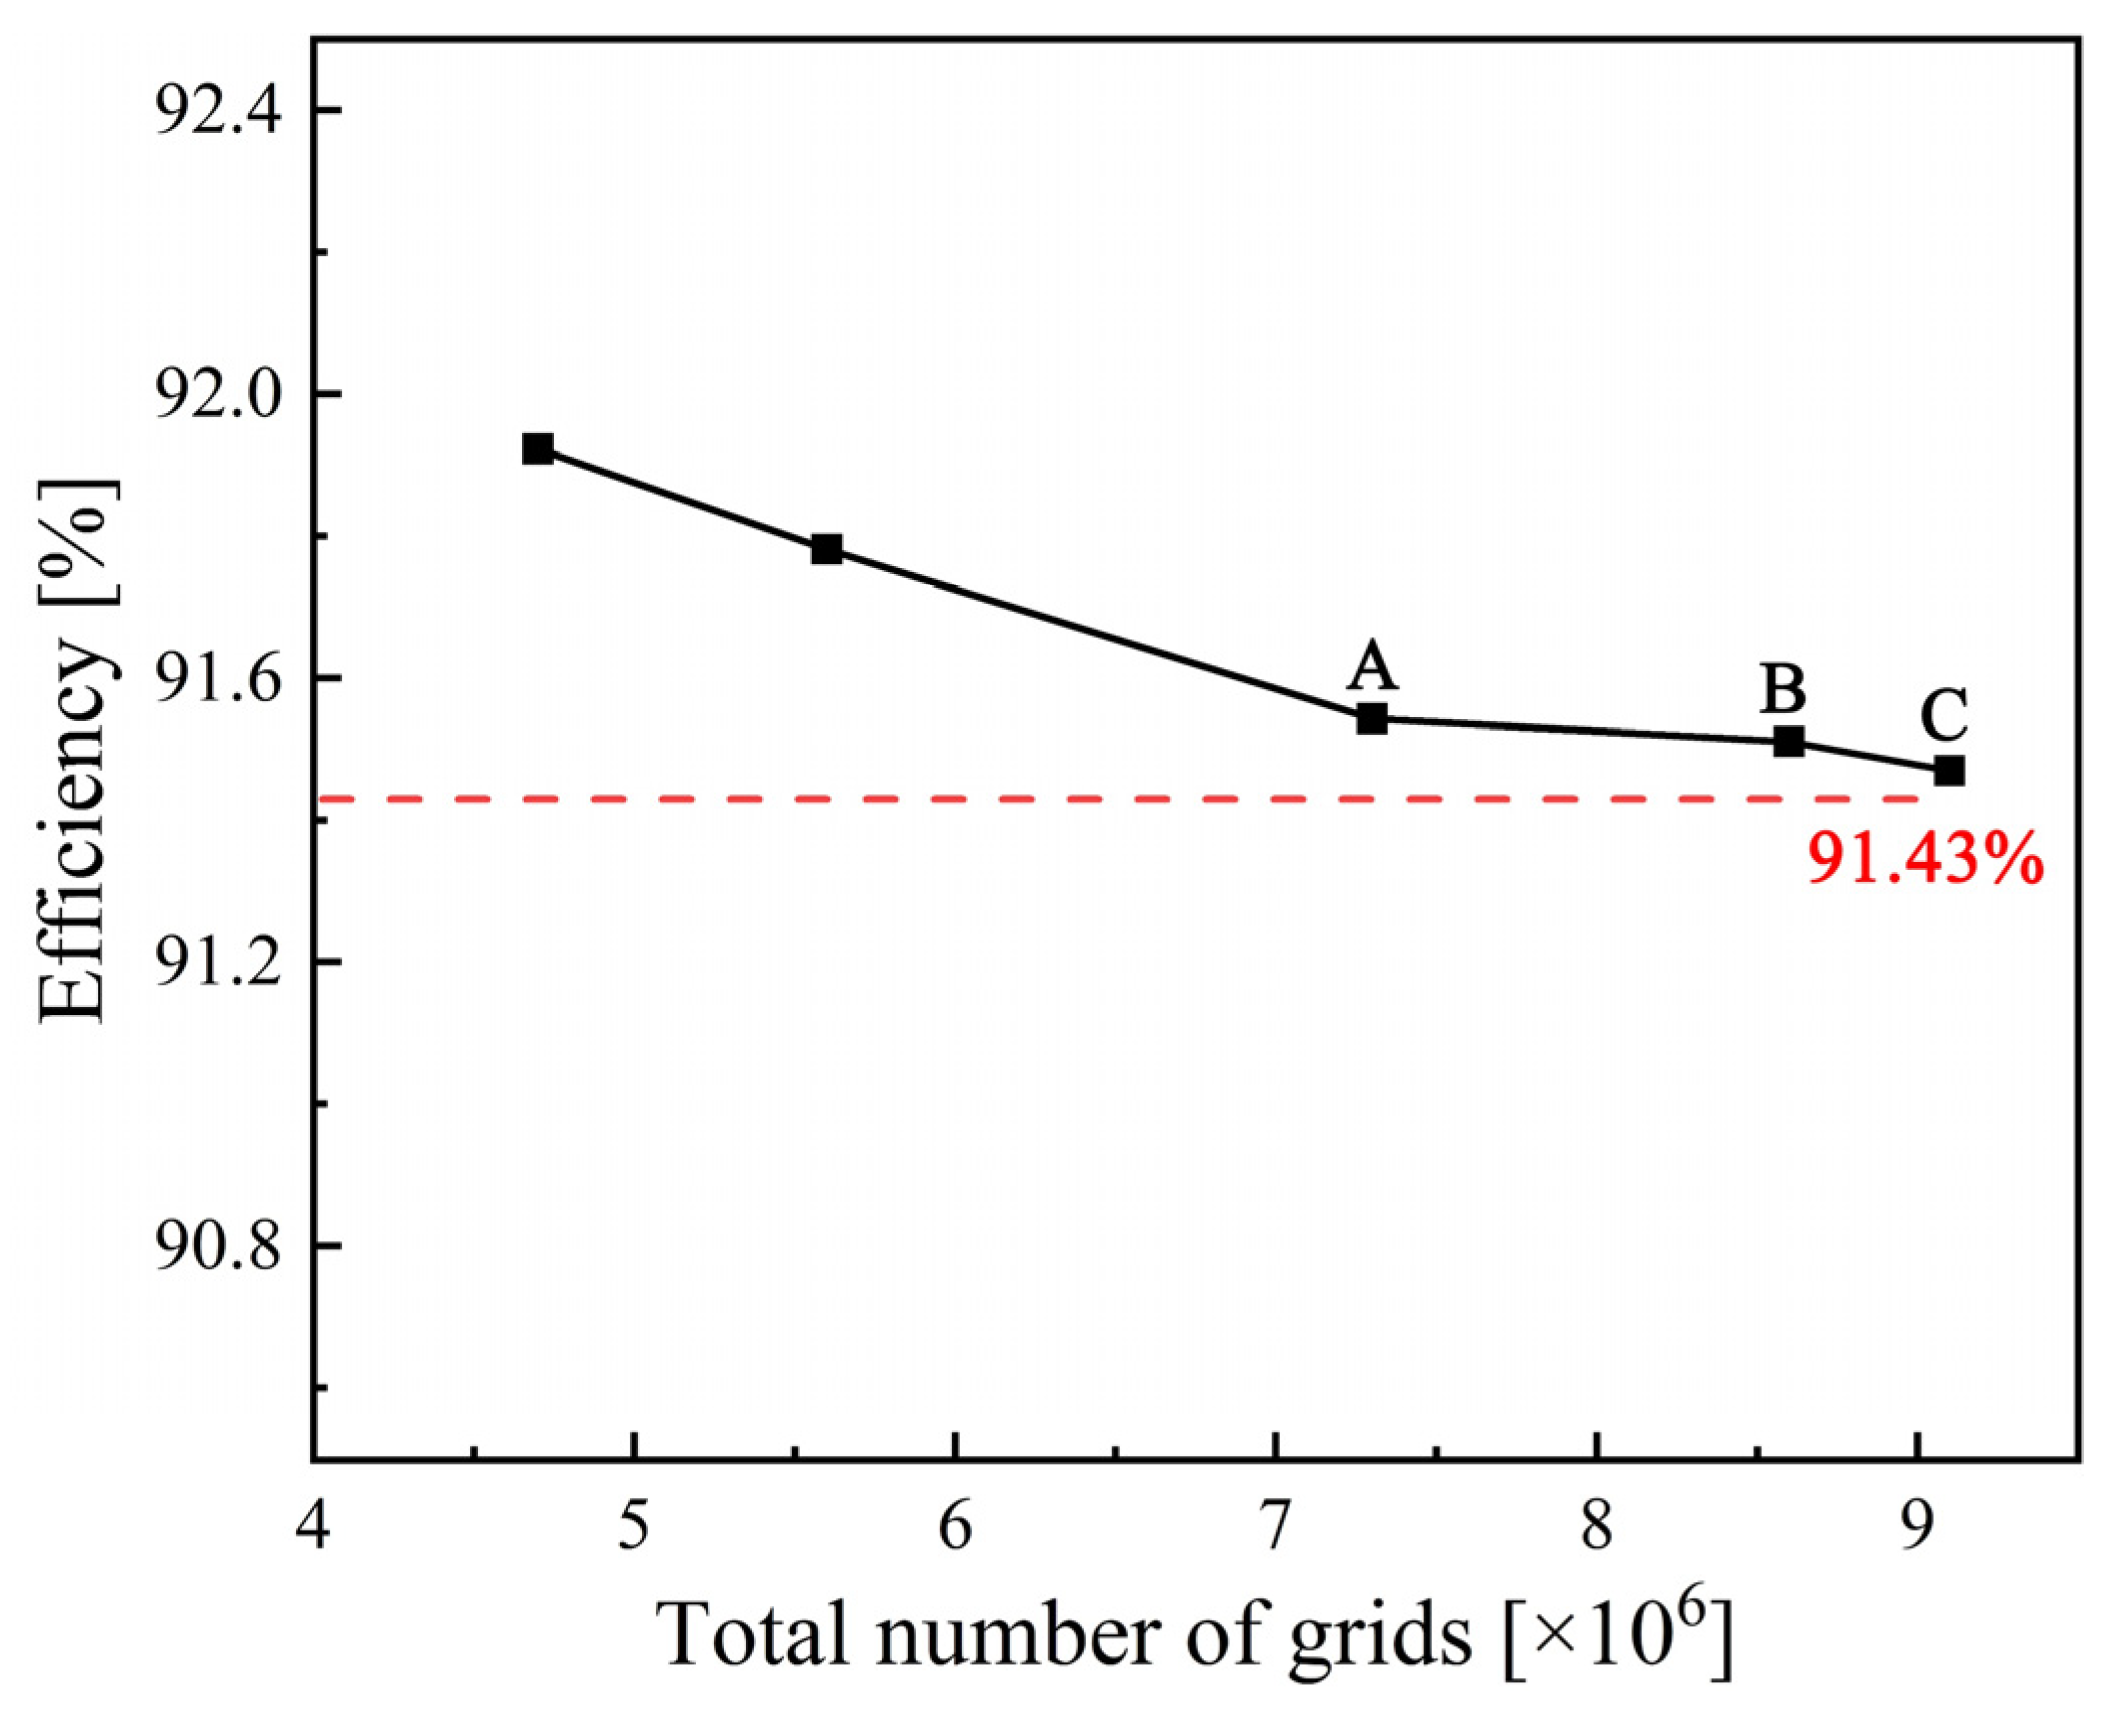
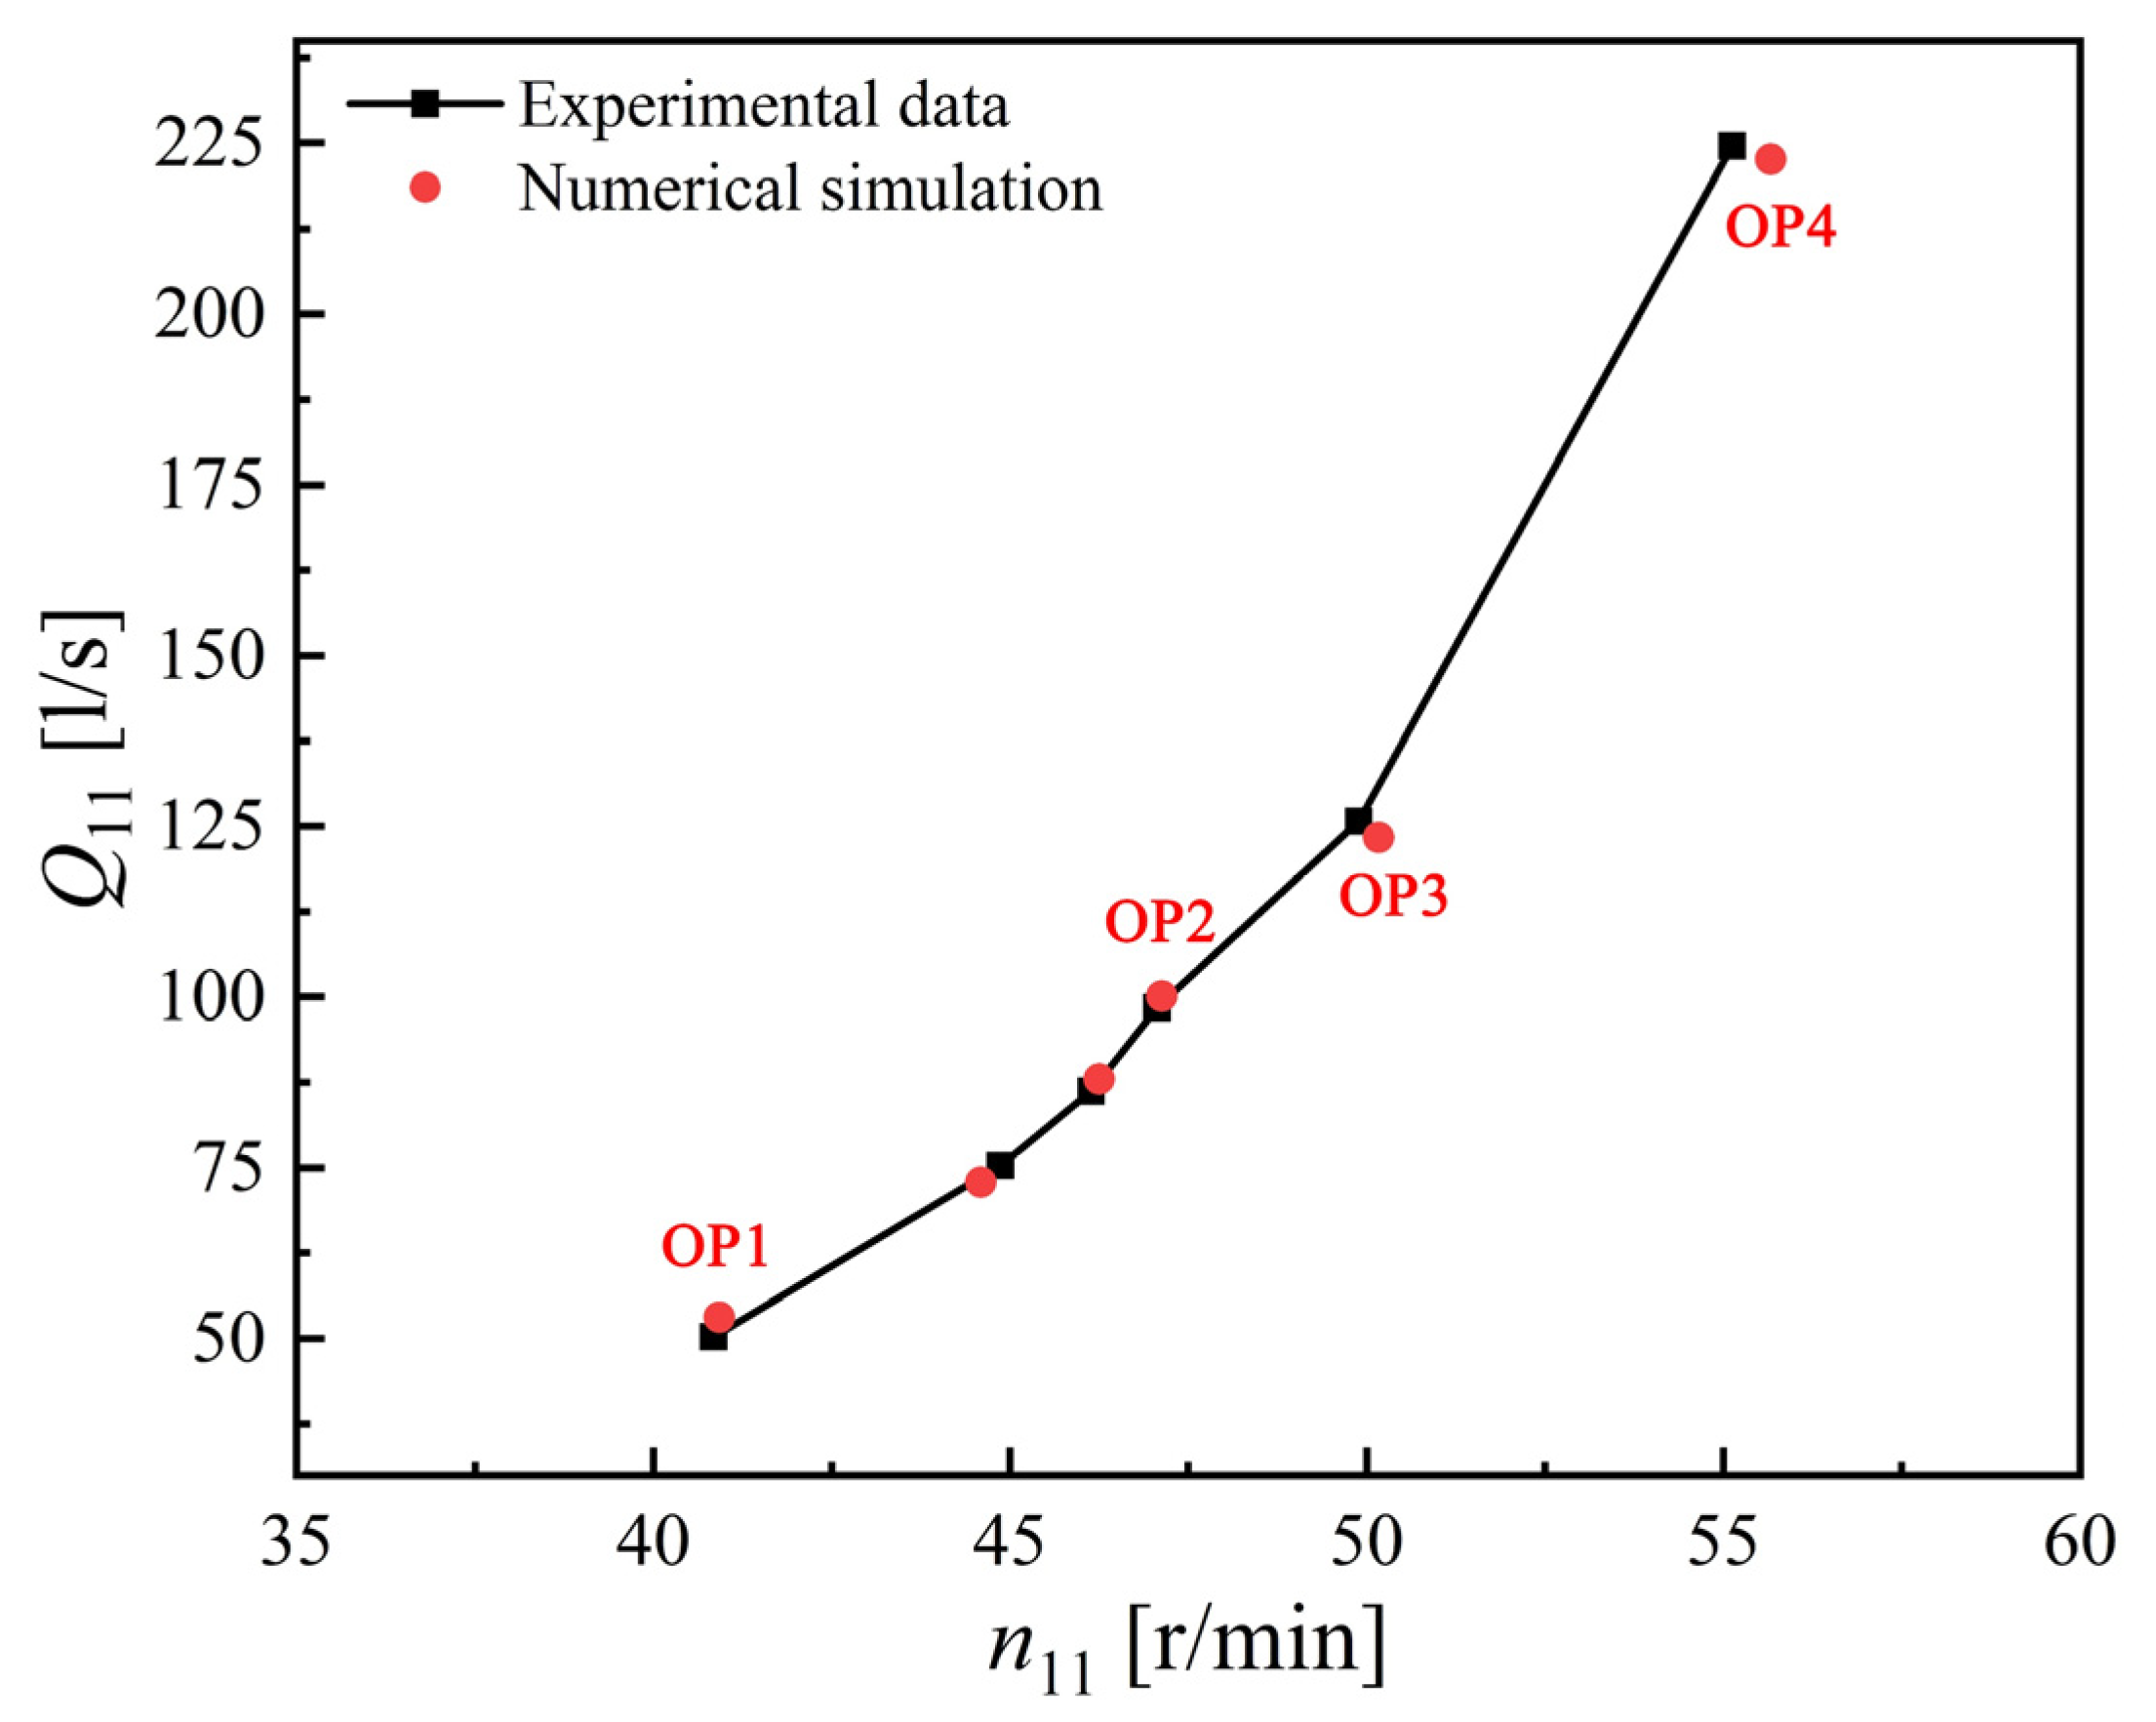
2.3. Verification of Numerical Simulation

In this section, mesh sensitivity tests and a comparison of numerical and experimental data are discussed in detail so as to ensure the reliability of computation results. Table 2 presents the selected operating points in this paper, and the BEP stands for the mesh sensitivity test, where four no-load condition points (OP1~OP4) are opted to verify and analyze the results. To facilitate the performance trend, two parameters are defined as follows:
n 11 = n D / H
Q 11 = Q / ( D 2 H 1 / 2 )
where n is the rotation speed of a pump-turbine, rpm; D is the runner outlet diameter in turbine mode, m; H is the operating head of a pump-turbine, m; Q is the volume discharge, l/s.
Figure 3 shows the efficiency of the pump-turbine at BEP using five sets of different mesh sizes; the element number of each component can be found in Table 3. It is known that the discretization of the physical model is refined better with the increase of grid density, providing more information on flow characteristics but also demanding large computing resources and time. In this study, the calculated efficiency at BEP approaches the experimental value (91.43%), and the difference is minimized with grid numbers of 9.1 × 10⁶ (Figure 3C). However, to simulate all the transient processes in the in-house computer of eight independent processing cores would require 18 days. Therefore, the eventual scheme with 7.3 × 10⁶ elements (Figure 3A) is used after weighing the pros and cons; the deviation is within 0.25%, which is small enough to meet the accuracy requirements.
In Figure 4, a slight deviation between the numerical and experimental data can clearly be found. Under the no-load condition with small GVO, the numerical simulation results are in good agreement with the corresponding experimental data, whose relative error reaches 1.68%. However, when the GVO is larger, the channel and stall vortices in the runner passage vary dramatically, which gives rise to the obvious fluctuation in the external characteristics. Despite the calculation error increasing to 3.73%, it is still enough to guarantee the reliability of numerical simulation. In summary, the relative error of all operating points in this study is kept within 4%, and the general change trend of numerical simulation is consistent with that of the experimental test.

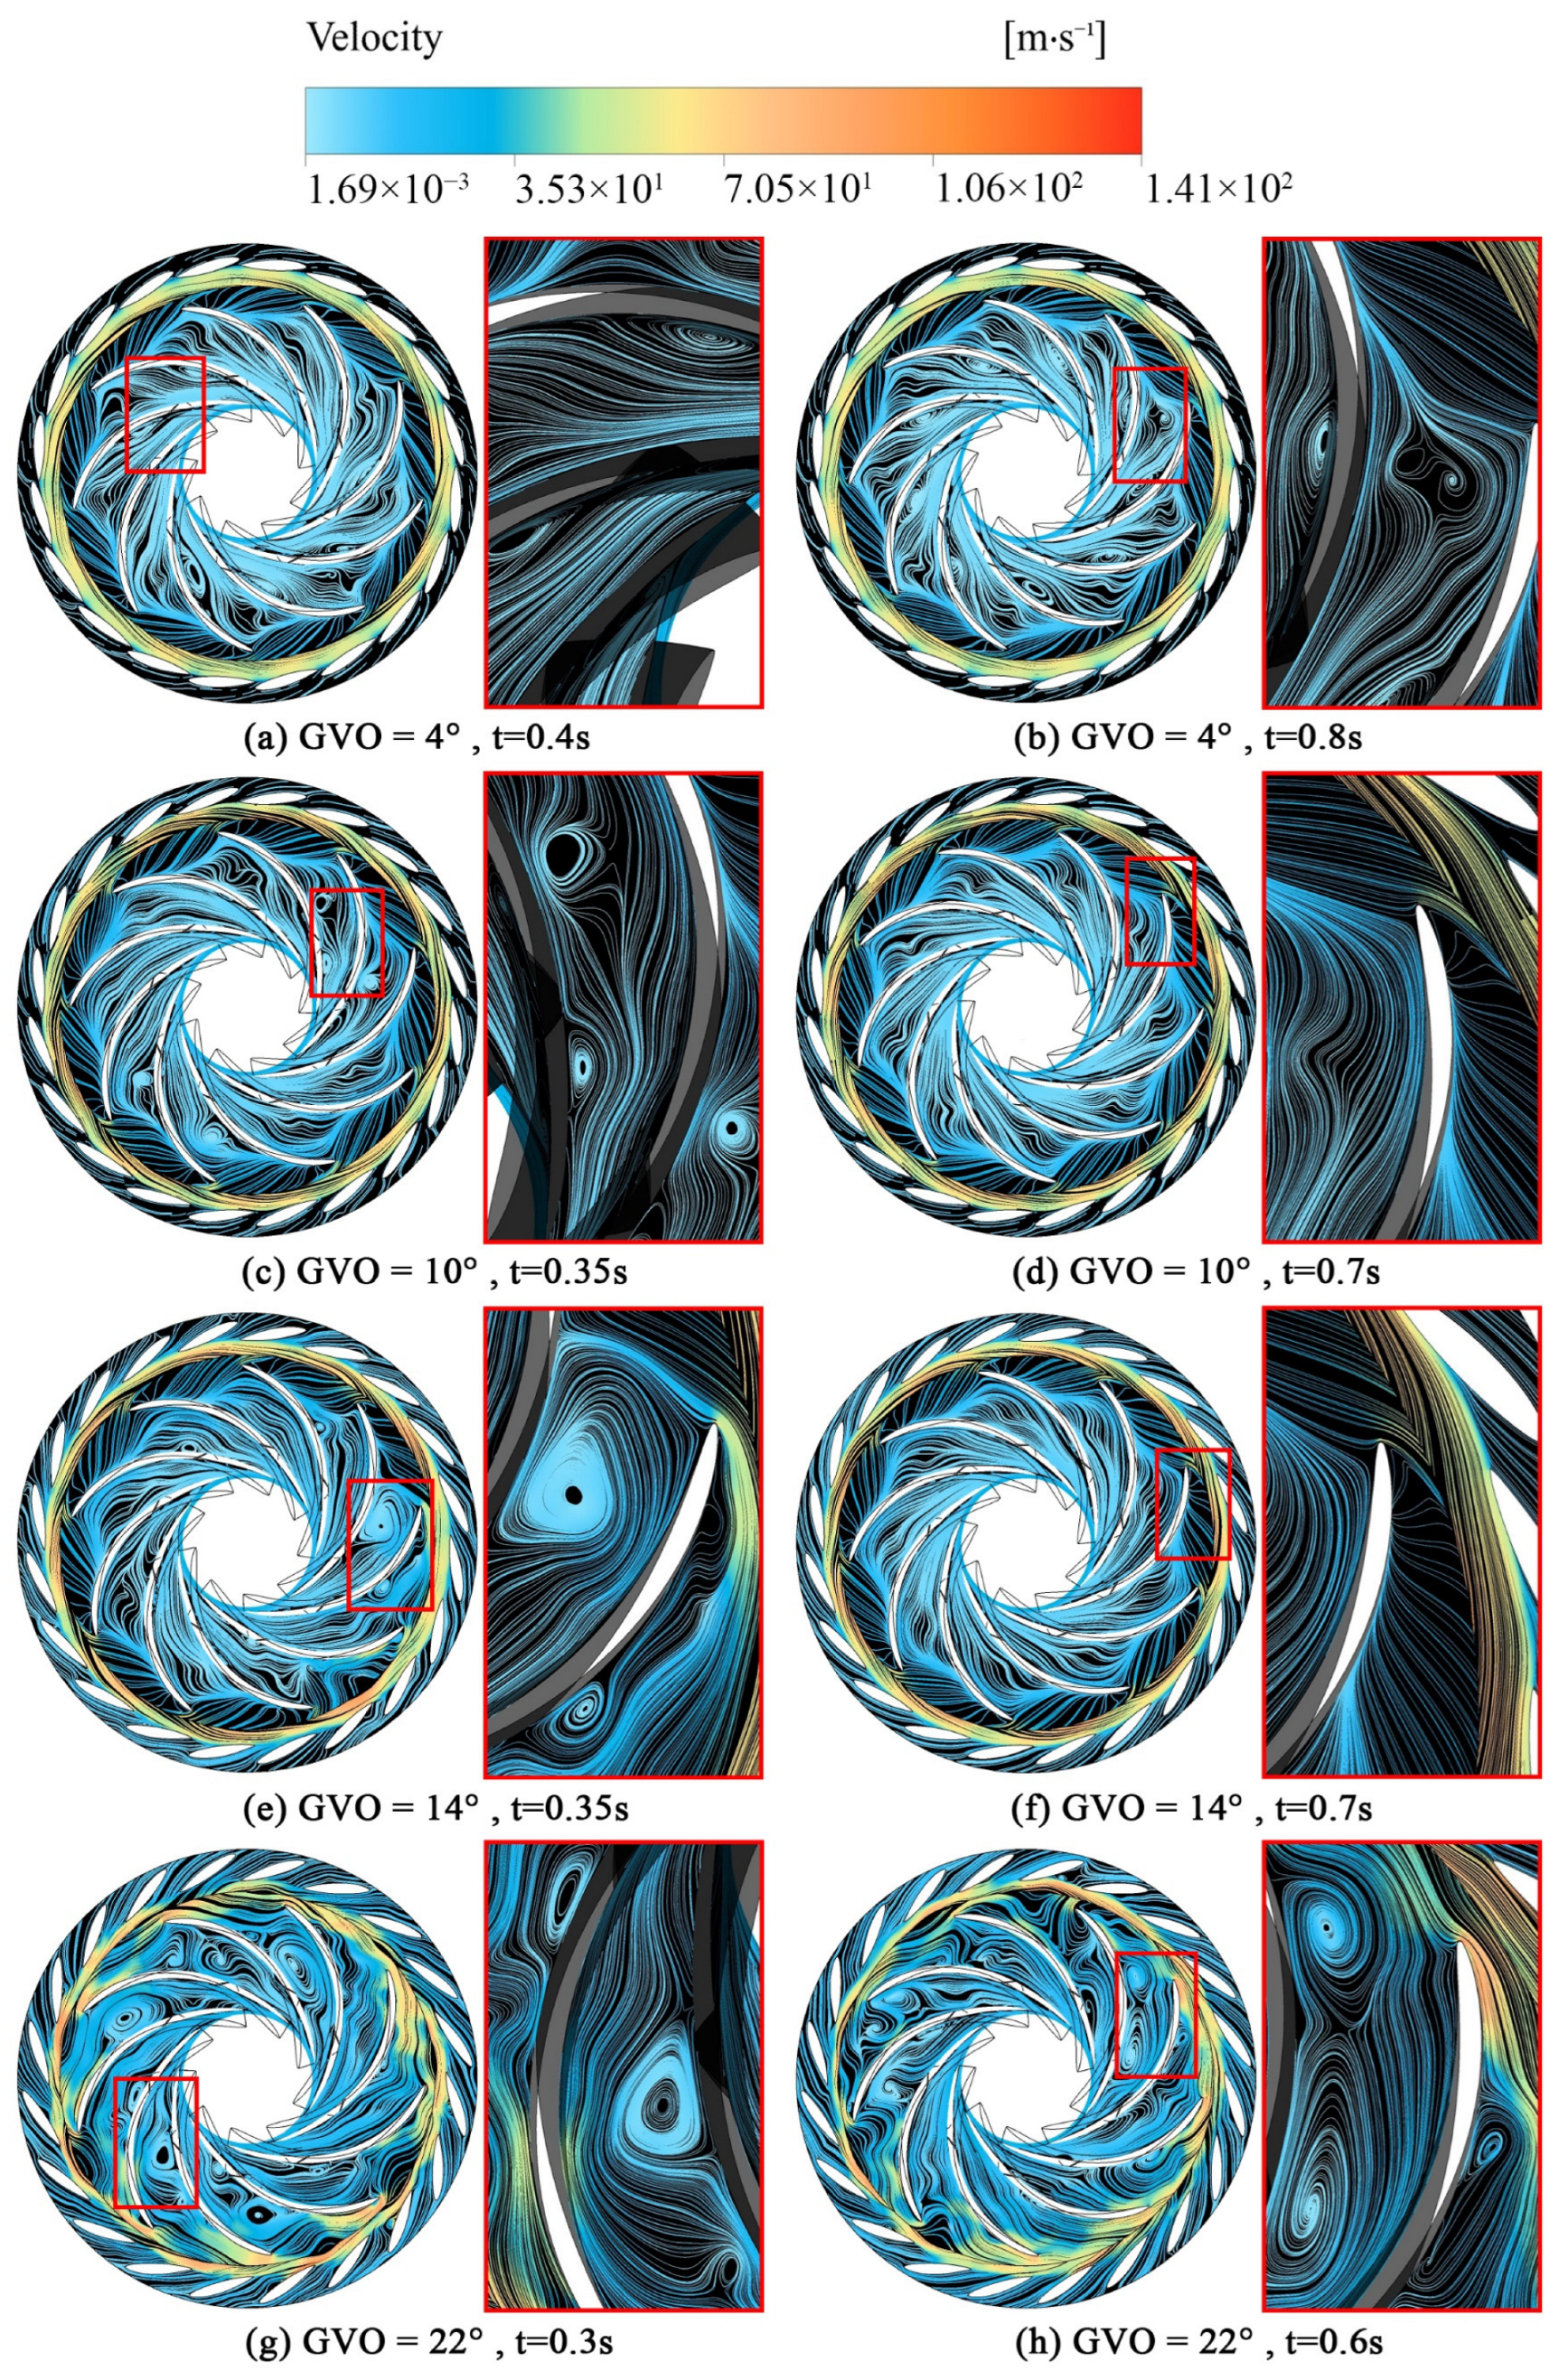
3. Analysis of Internal Flow Characteristics

The flow state of the vaneless zone between guide vanes and runner is bound up with the main sources of pressure fluctuation, such as rotor–stator interaction, rotating stall, and so on. Figure 5 demonstrates the flow pattern change of guide vanes and runner under four no-load conditions in a streamlined manner. Under the no-load conditions with lower GVO, the circumferential velocity of the water flow is larger because of the restraint and guidance of guide vanes. Hence, the water ring with a certain thickness is mainly gathered in the vaneless zone, resulting in the blockage of the flow channel. Owing to the large incidence angle of water flow at the runner inlet, the flow gradually separates and vortices are generated on the blade suction side, although the flow state of the overall channel still maintains the circular symmetry well. With the increase of the GVO, the thickness of the water ring decreases; meanwhile, vortices augment in runner channel transit from the suction side (Figure 5a,b) to the pressure side (Figure 5c,e) of the blades. Under the impression of ever-changing vortices, the contrast of the flow patterns in the single channel of each blade becomes more apparent, which destroys the symmetrical distribution of the vortex structure inside the runner. When the GVO is 22°, increasing the flow velocity (Figure 5g,h) leads to more intense vortex evolution. Hence, compared with low GVOs, the unit stability under no-load conditions with large GVOs is more serious.
For observing the distribution of the vortex structure in guide vanes and runner, the third-generation vortex identification method, Ω method [30,31], is used due to the ability to capture both strong and weak vortices and the applicability in reversible pump-turbines. Figure 6 shows this. The flow at the inlet of the runner is separated by the blades, and a series of channel vortices twist, shear, break, and spread in the downstream narrow runner passage. In contrast to the symmetrical vortex structure inside the runner under small GVO (Figure 6a), the number of vortices increases significantly after the GVO is larger, and the vortices tend to spread to the vaneless zone and guide vanes passage. In addition, the evolution of the vortex structure is no longer synchronous in the flow channels between different blades. As a result, vortices gather at the runner inlet of some flow channels, which is not conducive to the balanced operation of the runner.
In order to analyze the pressure distribution on the runner blade surface, the cross line between the blade surface and the middle turbo surface (Span = 0.5) is taken as the blade load line, as shown in Figure 7. Then, the pressure distribution on the pressure and suction side of the blade is obtained along the streamwise direction.
The pressure distribution of a blade load line under no-load conditions with different GVO is depicted in Figure 8a. In general, the pressure shows a decreasing trend along the streamwise, while the pressure difference between the pressure side and suction side of the blade is larger under the effect of the increasing GVO. At the inlet of the runner, the pressure fluctuates but to a different extent. According to the previous analysis in this paper, the formation of a high-speed water ring in a vaneless zone impedes the flow capacity of the runner, and flow separation occurs at the pressure side of the blade’s leading edge (see Figure 6). Therefore, the reverse pressure distribution forms at the runner inlet, and the reverse pressure turning point gradually moves downstream when the GVO broadens. On account of the serious disturbance in runner channels caused by eddies, the blade leading edge even displays a negative pressure distribution, and the severe pressure difference change tends to concentrate the stresses. Furthermore, Figure 8b presents the pressure distribution at different times at the OP4. It can be seen that the blade pressure at the runner inlet changes irregularly compared to the other three conditions, and the relative length of the blade affected by pressure fluctuation also extends from 0.1 to 0.22.

4. Analysis of Pressure Pulsation

The fluctuation signal of pressure change with time can be obtained by setting up pressure monitoring points in the flow passage of each component (Figure 2). For facilitating observation and analysis, the pressure pulsation coefficient C p is introduced in this paper to nondimensionalize the time domain signal; then, the amplitude-frequency characteristic of the pressure pulsation can be obtained by the Fast Fourier Transform (FFT). Equation (5) provides the dimensionless conversion formula of C p :
C p = p p ¯ ρ g H × 100 %
where p is the instantaneous pressure value, P a ; p ¯ is the time-averaged pressure value, P a ; ρ denotes the fluid density, kg/m3; g is the gravity acceleration, 9.8 m/s2; and H is the head of the operating point, m.

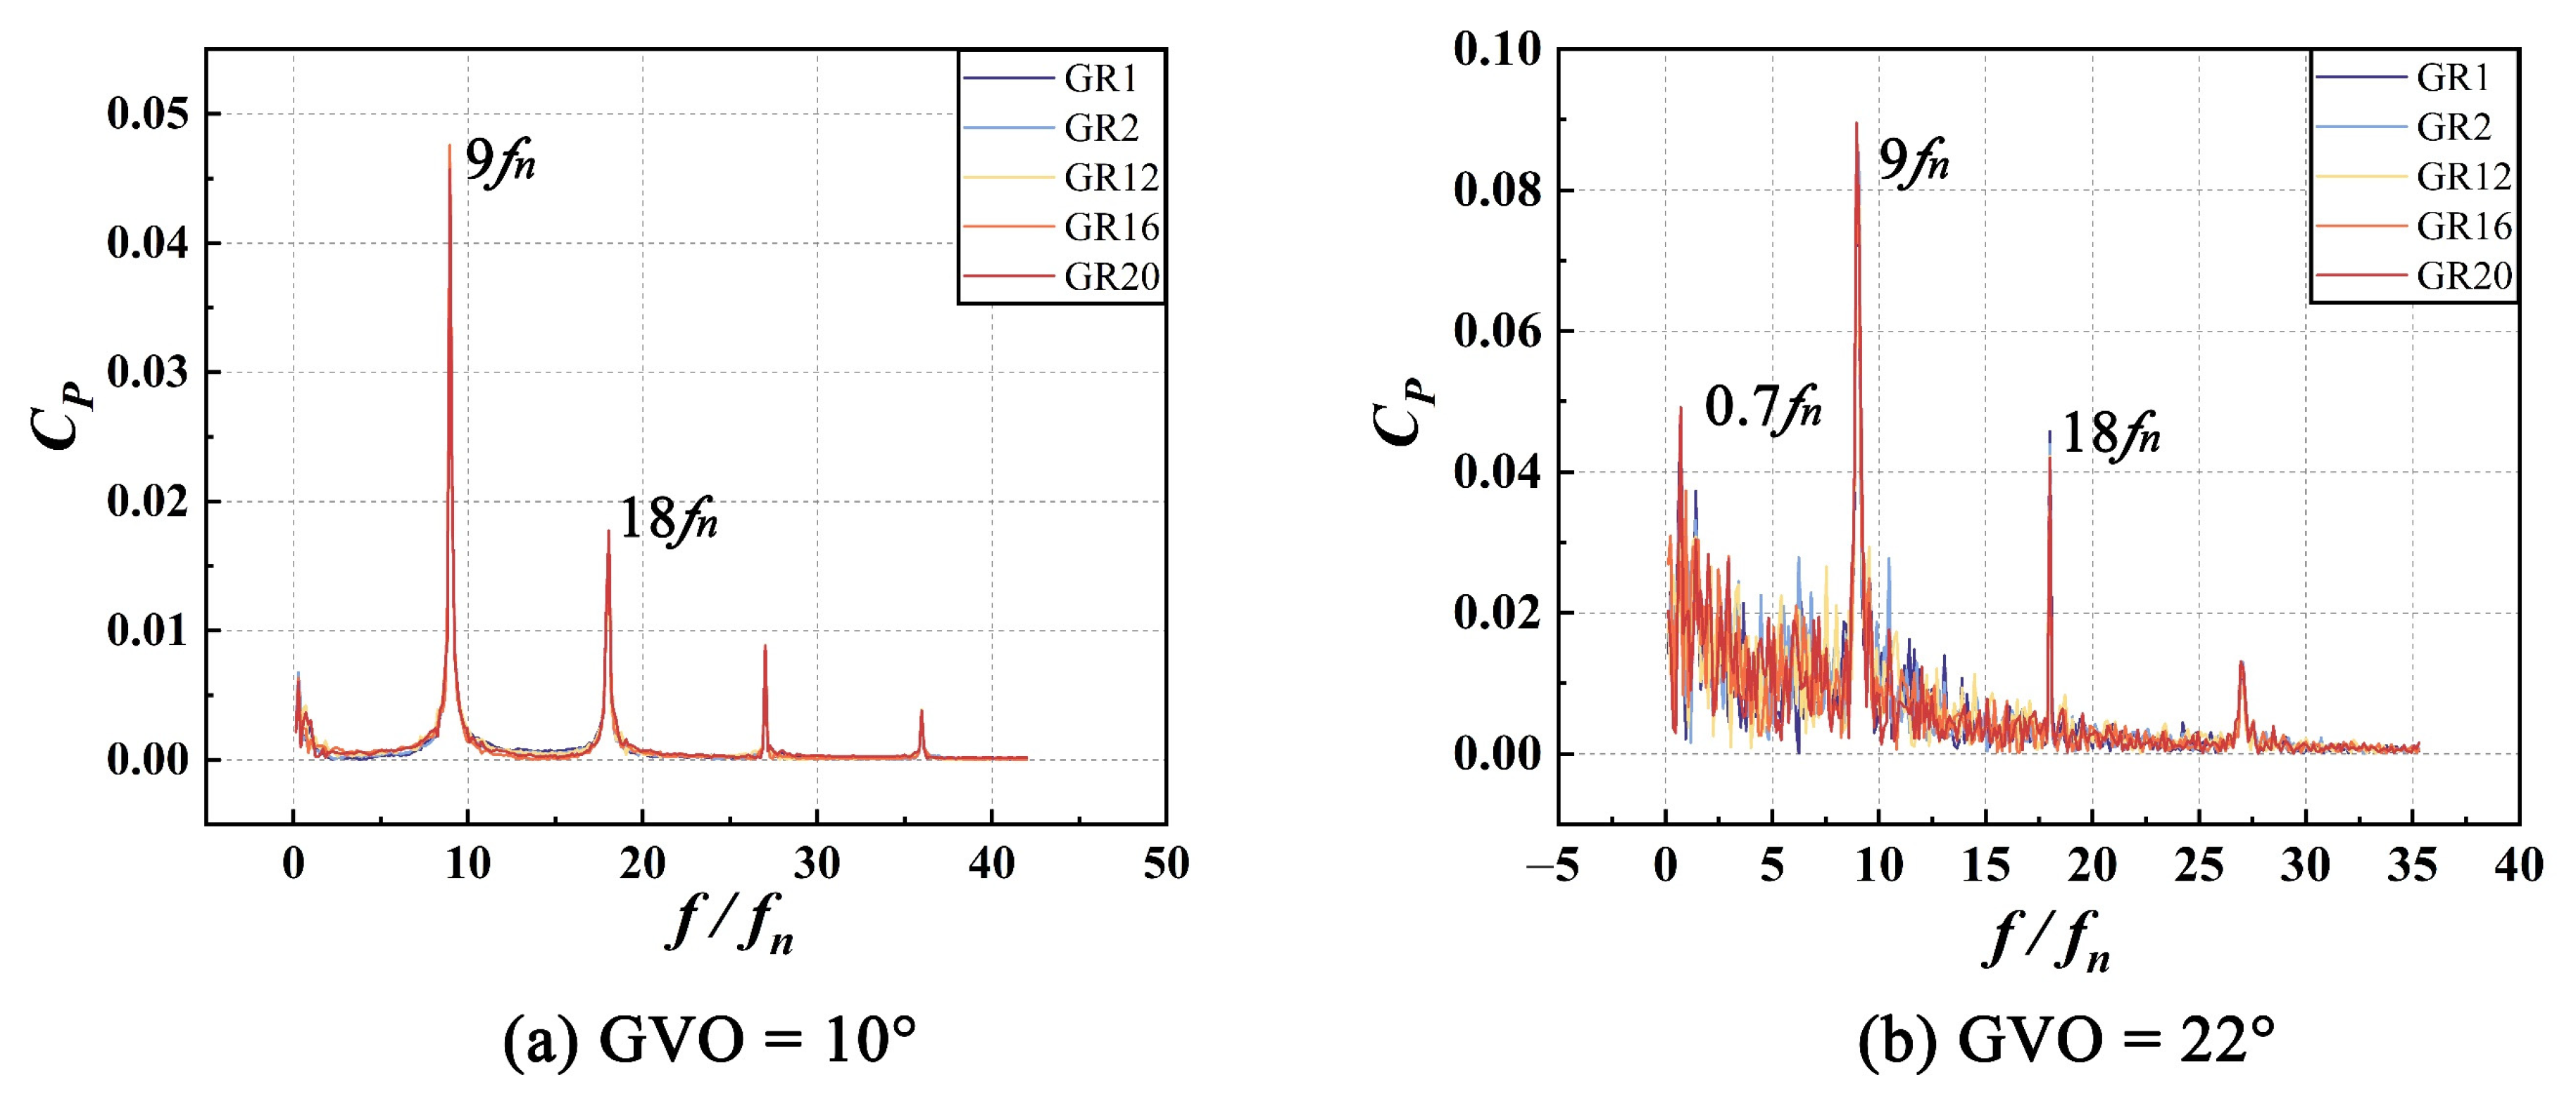
4.1. Pressure Pulsation in the Vaneless Zone

Twenty monitoring points GR1~GR20 are arranged counterclockwise along the circumference in the vaneless zone, which can be seen in Figure 2a. Figure 9 shows the time domain diagrams of the pressure pulsation in the vaneless zone at OP1~OP4. As stated, under the small GVO conditions, the pressure pulsation in the vaneless zone shows a clear periodicity and propagates clockwise at a certain speed in the circular direction. This circumferential propagation rate is preliminarily estimated using the number of monitoring points of peak or valley propagation of the pressure pulsation per unit time as the offset angular velocity θ . It is found that the increase of GVO promotes the circumferential propagation of pressure pulsation in the vaneless zone. Moreover, as shown in Figure 5g,h, the water ring is no longer distinct with different thicknesses in the circumferential direction, and the corresponding pressure pulsation components in the vaneless zone are more complex (Figure 9d) than those in other small GVO conditions.
Therefore, the frequency domain signals of adjacent distributed monitoring points GR1 and GR2 and symmetrical points GR12, GR16, and GR20 are selected for further analysis of pressure pulsation components. In agreement with OP1 and OP3, the pressure pulsation frequency of each monitoring point in the vaneless zone under OP2 (Figure 10a) is mainly composed of the blade-passing frequency and its harmonic components, i.e., 9 f n and 18 f n ; thus, the pressure pulsation is principally affected by RSI. Meanwhile, due to the poor flow pattern between the trailing edge of the guide vanes and the inlet of the runner blade under the interference of the water ring, the water impacts the blade, hence generating low-frequency components. However, when GVO is 22 ° , in addition to the typical RSI frequency, various low-frequency signals represented by 0.7 f n begin to strengthen (Figure 10b), and the rotating stall effect in the vaneless region intensifies. In other words, the appearance of the rotating stall leads to the flow separation at the leading edge of the runner. Subsequently, the channel vortices form and develop into the runner passage.

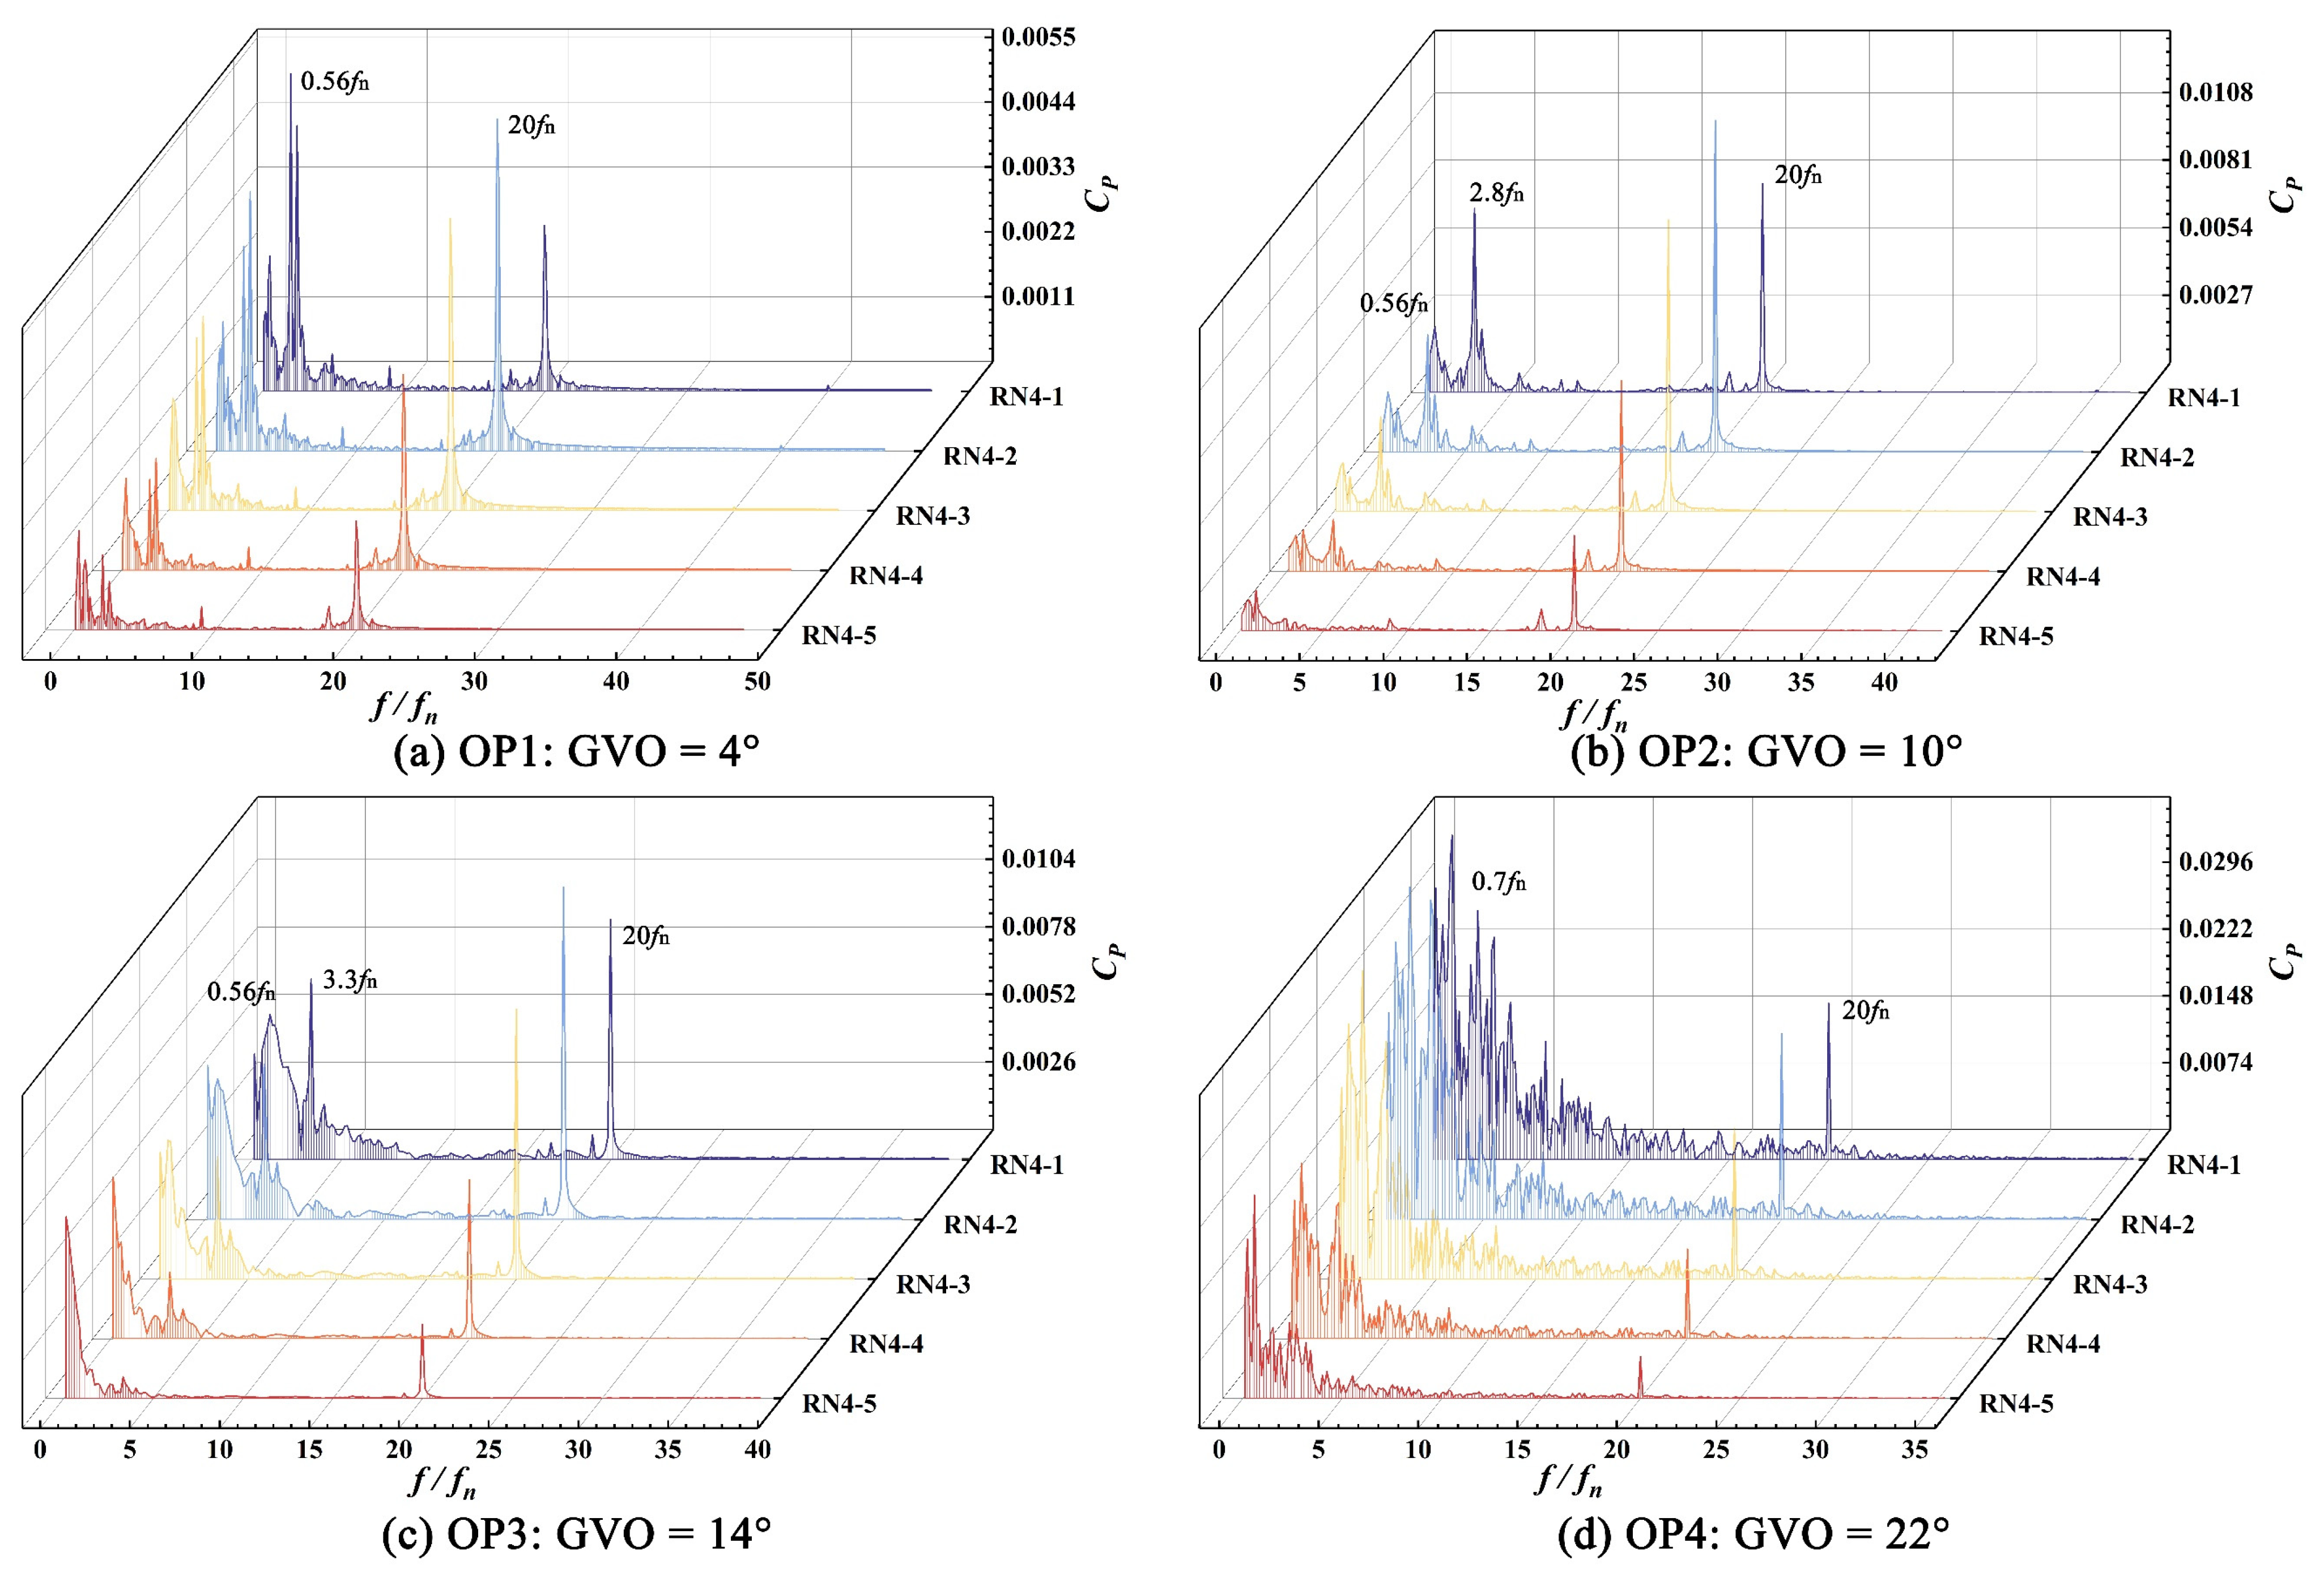
4.2. Pressure Pulsation in the Runner Channel

Figure 2b shows the layout of pressure monitoring points in the runner channel. After comparing the data of pressure pulsation in the time and frequency domain under different conditions, it was found that although there were differences in the time sequence of pressure pulsation in the single runner channel, the signals in the frequency domain were basically the same. Thus NO. 4 blade is chosen for further analysis of the pressure pulsation in the frequency domain, as shown in Figure 11. Obviously, the high-frequency signal 20 f n exists in the runner passage at OP1~OP4, which is also the characteristic frequency caused by the RSI, namely, the guide vane passing frequency. With the increase of the GVO, the amplitude of its C p increases from 0.004 in GVO = 4 ° to 0.0148 in GVO = 22 ° . Under each no-load condition, the amplitude first strengthens, then weakens, before peaking again thereafter, thus reaching the maximum at the downstream channel close to the runner inlet with the deepening of the channel, which is similar to the monitoring point RN4-2 in Figure 11. Nevertheless, the low-frequency components of the pressure pulsation become more complex and stronger with the increase of the GVO. This is due to the rotating stall frequency and its harmonic parts (i.e., 0.56 f n ~0.7 f n ) at the runner inlet, to which is added the typical frequency 0.14 f n of the vortex rope, which is the dominant frequency at the runner outlet due to its proximity to the inlet of the conical section of the draft tube. Under the combined effects of high-frequency components caused by the RSI and low-frequency components induced by the rotating stall, the structural stress of the downstream location close to the runner inlet is significant and worth considering for reliability analysis.

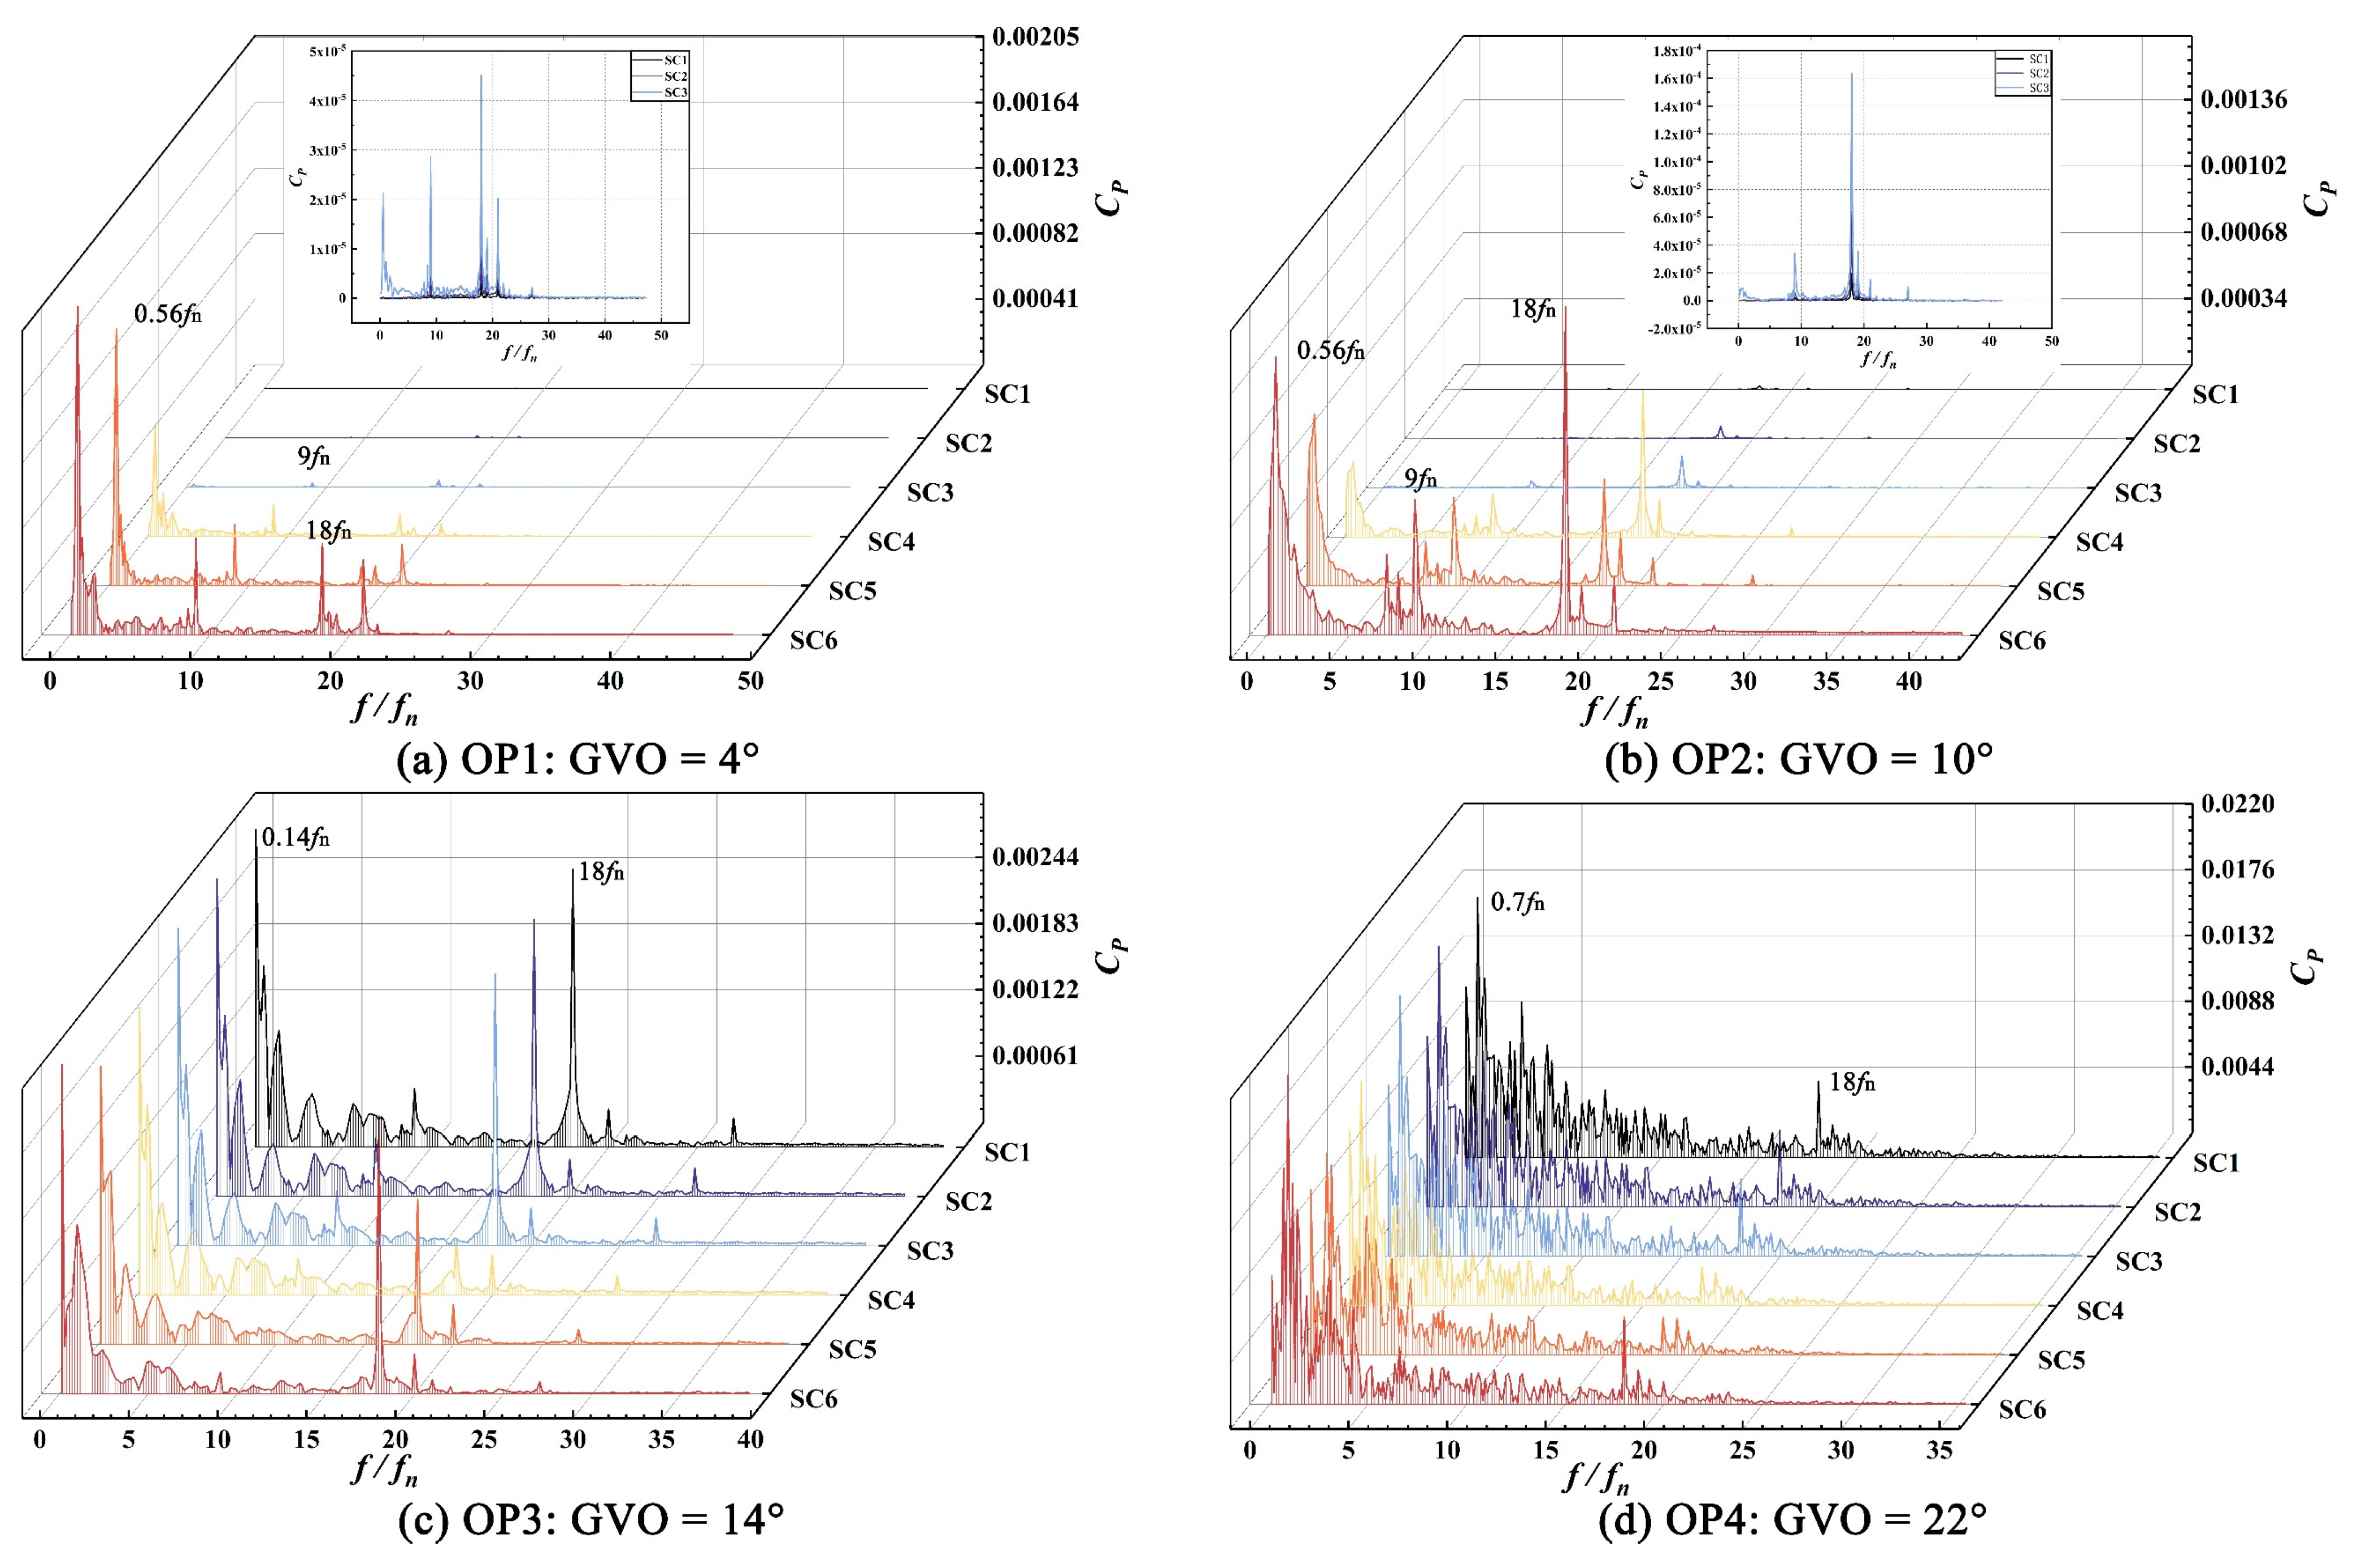
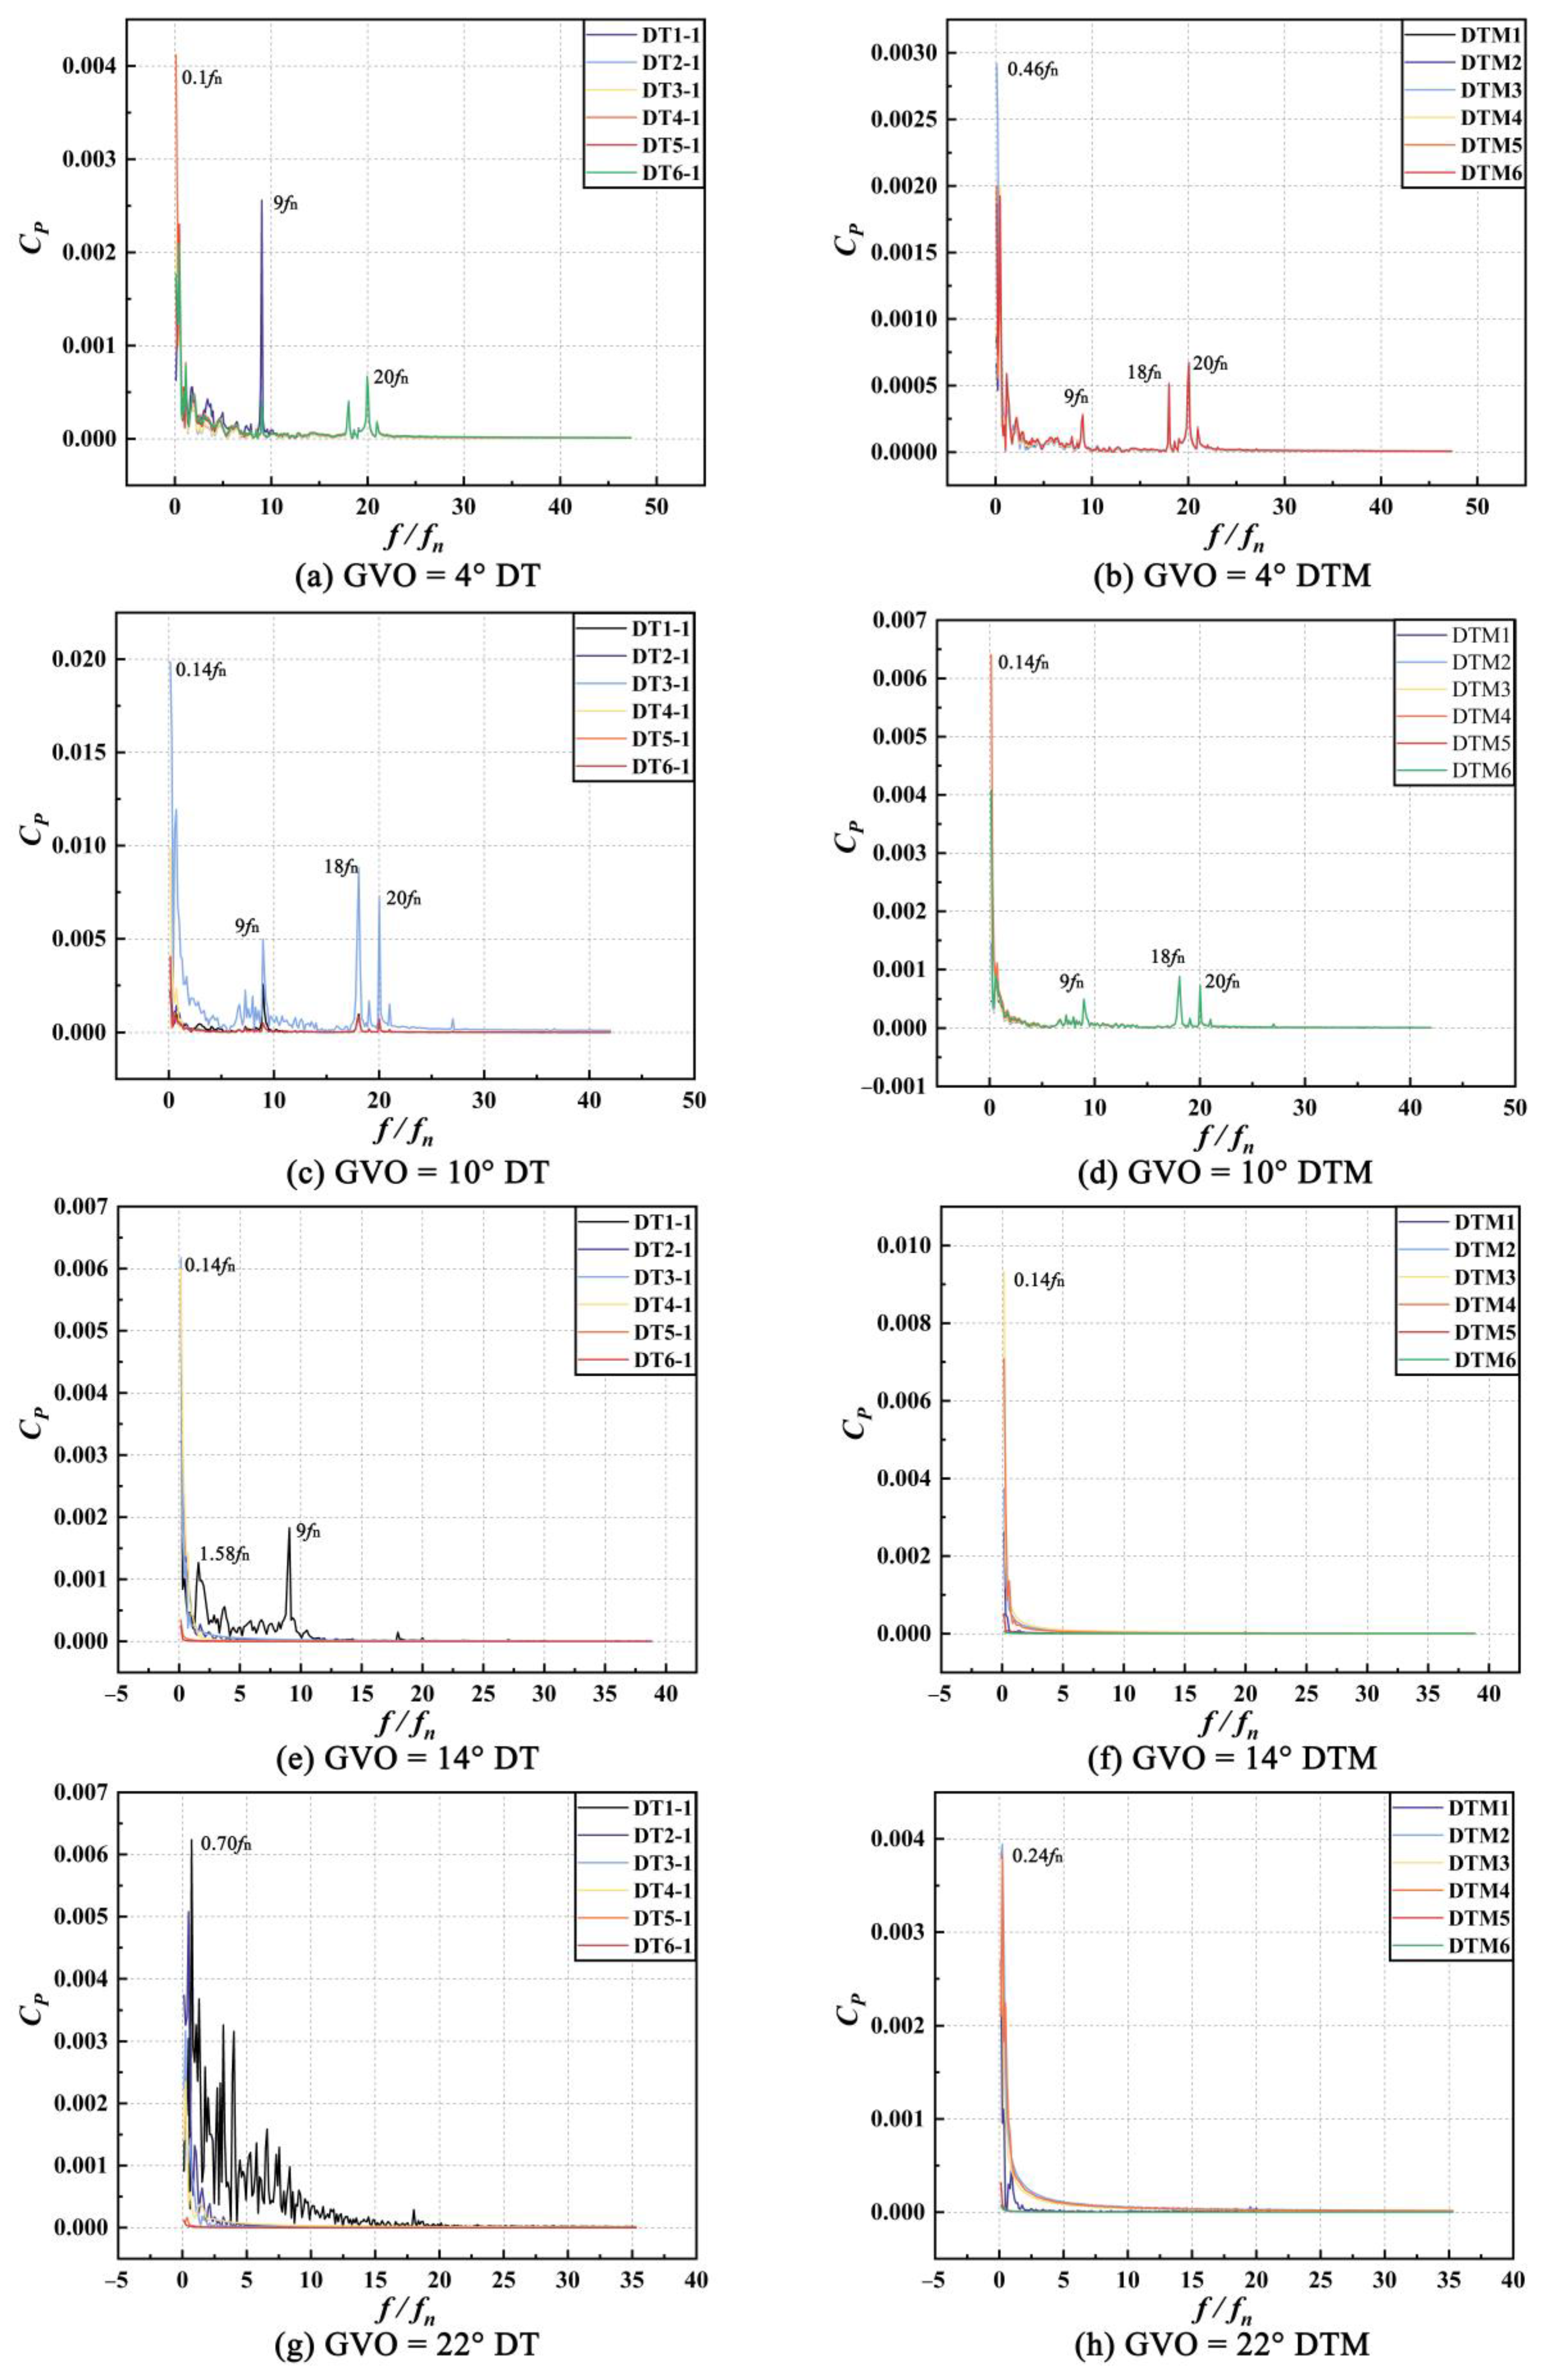
4.3. Pressure Pulsation in the Spiral Casing and Draft Tube

The capture of pressure pulsation characteristics is helpful to master its propagation law. Hence, several monitoring points are arranged along the flow path of a spiral casing and draft tube in Figure 2a,c, respectively. Figure 12 and Figure 13 show the frequency domain diagrams of pressure pulsation under no-load conditions with different GVO.
As observed, the amplitude of pressure pulsation in the spiral casing decreases gradually during upstream propagation when the GVO is small, and the low-frequency signal caused by the stall vortices attenuates significantly. In addition, the double blade-passing frequency 18 f n is still reflected, which indicates that the pressure pulsation caused by RSI is more powerful in the upstream propagation under low GVO conditions. When the GVO is larger, the dominant frequency and amplitude of pressure pulsation at each monitoring point are nearly equivalent (Figure 12c,d). Because of the complexity of the internal flow of the unit under no-load conditions with large GVO, the generated low-frequency signal gradually gains importance and surpasses the blade-passing frequency two times. The reason can be attributed to the amplitude of rotating stall frequency 0.7 f n being distinctly higher than RSI’s 1818 f n along the upstream flow path of the spiral casing (SC6 to SC1), thereby lacking attenuation in the propagation process. Compared with the low GVO conditions, the stall vortices with 0.7 f n evolve continually in the runner channel and propagate upstream through the double-row cascade, exerting the effect in the spiral casing. Furthermore, this low-frequency signal is transmitted downstream into the draft tube.
Figure 13 shows the changes in pressure pulsation signals in the frequency domain among the monitoring points in the near wall region (DT) and center of each section (DTM) of the draft tube. Under the no-load conditions, the flow in the draft tube is affected by the high-speed circulation at the outlet of the runner, resulting in the RSI frequencies (such as guide vane passing frequency 20 f n and blade-passing frequency 9 f n and its harmonic 18 f n ) shown in the near wall region (DT). In addition, the vortex rope forms easily from non-design conditions, and the pressure pulsation is dominated by low-frequency signals. As the vortex rope gradually develops downstream, due to the sudden change of movement direction after entering the elbow section, the flow state in this region is more complicated than that in the tapered pipe section. The amplitude of pressure pulsation reaches its maximum in the elbow section of the draft tube, corresponding to the monitoring points DT3-1 and DTM3 in Figure 13. However, the influence of the RSI on the pressure pulsation weakens gradually with the increase of GVO and then disappears in the draft tube. The low-frequency components represented by the rotating stall 0.7 f n are more obvious in the conical section, but they then develop and attenuate downstream. This in turn results in more complex low-frequency components, as shown in Figure 13g.

5. Analysis of Structure Stress

Through the analysis of internal flow characteristics and pressure pulsation, it can be seen that the flow state of the runner and guide vanes is complicated, and the pressure pulsation in the vaneless zone is more significant under the combined influence of RSI and the rotating stall. To gain a better understanding, the weak-coupling method [32] is applied for analyzing the structure stress of runner and guide vanes. The discretized form of the linear dynamic equilibrium equation can be manifested as follows:
[ M ] x ¨ + [ C ] x ˙ + [ K ] x = F
where M ,   C , and K denote the mass matrix, damping matrix, and stiffness matrix, respectively; x ¨ ,   x ˙ , and x represent acceleration, velocity, and displacement, respectively; and F is the external load force acting on the nodes.
As shown in Figure 14b, the structural load appears on the surface of the runner blades and guide vanes, which is the imported pressure caused by water flow [33]. Moreover, several constraints are set on the structure domain. For instance, the hub flange of runner and the shaft head of the guide vane are given with fixed support, and the upper, middle, and lower shaft necks are restrained by cylindrical support. Considering the influence of gravity on the parts and the runner rotational motion, the gravitational acceleration and the rotation speed of the runner are erected as well. The tetrahedral mesh is used for dividing the structure domain (Figure 14c), and the grid numbers of the runner and guide vane are 3.6 ×   10 6 and 1.4 ×   10 6 , respectively, which is verified by mesh independence.
Figure 15 presents the equivalent stress distribution of the runner structure. Under low GVO conditions, the uniform water ring with high rotational velocity is guided by the guide vanes, and the runner is subject to relatively weak hydraulic excitation due to the low discharge. Thus, the stress of the runner is regular in the circumferential direction and only occurs at the flange connected to the turbine shaft and the connections between the blades, as well as in the shroud and hub with higher values. The GVO increases the overall stress of the runner. Affected by the stronger unstable flow, the symmetry of the stress distribution of blades disappears gradually, leading to a more apparent stress difference on the blade surface. In addition, the main stress concentration points are still located in the “T” connection between the blade leading edge and the runner crown and the blade outlet edge and the lower ring. When the unit operates at the OP4 (GVO = 22 ° ), the stress moves away along the blade’s root, resulting in the local stress concentration of the weld between the blade and the shroud (Figure 15d), which becomes a potential factor for inducing the runner crack. This is in line with what is observed in the actual NO. 8 blade, as shown in Figure 16. The two cracks are located between the blade and lower ring, which are 30 mm and 15 mm long, respectively. In the long term, the reversible pump operation may increase the crack size, causing failure.
Figure 17 reveals that the maximum stress mainly aggregates at the joint of the guide vane profile and the middle or lower shaft neck under all selected no-load conditions. Likewise, the equivalent stress of the guide vane rises first, but then it decreases with the increase of the GVO. This reveals that the maximum value of stress increases from 45.6 MPa in GVO = 4 ° to 87.5 MPa in GVO = 10 ° and declines to 30.6 MPa in GVO = 22 ° . Meanwhile, the deformation of the guide vane starts at the trailing edge, and then it spreads to the head with GVO. After the analysis, it was found that when the GVO is small, the high-speed water ring in the vaneless zone leads to flow blockage, i.e., the water flow gathers at the tail of the guide vanes and the runner inlet (Figure 5a). The angle of discharge at the outlet of guide vanes also changes with the larger GVO, which also results in a more intense flow impact, causing the structure stress to rise as well (Figure 17b). However, when the GVO continues to increase, more discharge could flow into the runner channel after passing the guide vanes; thus, the runner blades are subject to more hydraulic pressure and stress, (Figure 15d) whereas the stress on the guide vanes is alleviated correspondingly (Figure 17d).

6. Conclusions

In this study, a prototype RPT was selected to investigate its internal flow characteristics. The propagation law of pressure pulsation under no-load conditions was simulated using the SST model, whereas the influence of hydraulic characteristics on the structural performance of the guide vane and the runner was analyzed based on the unidirectional FSI method.
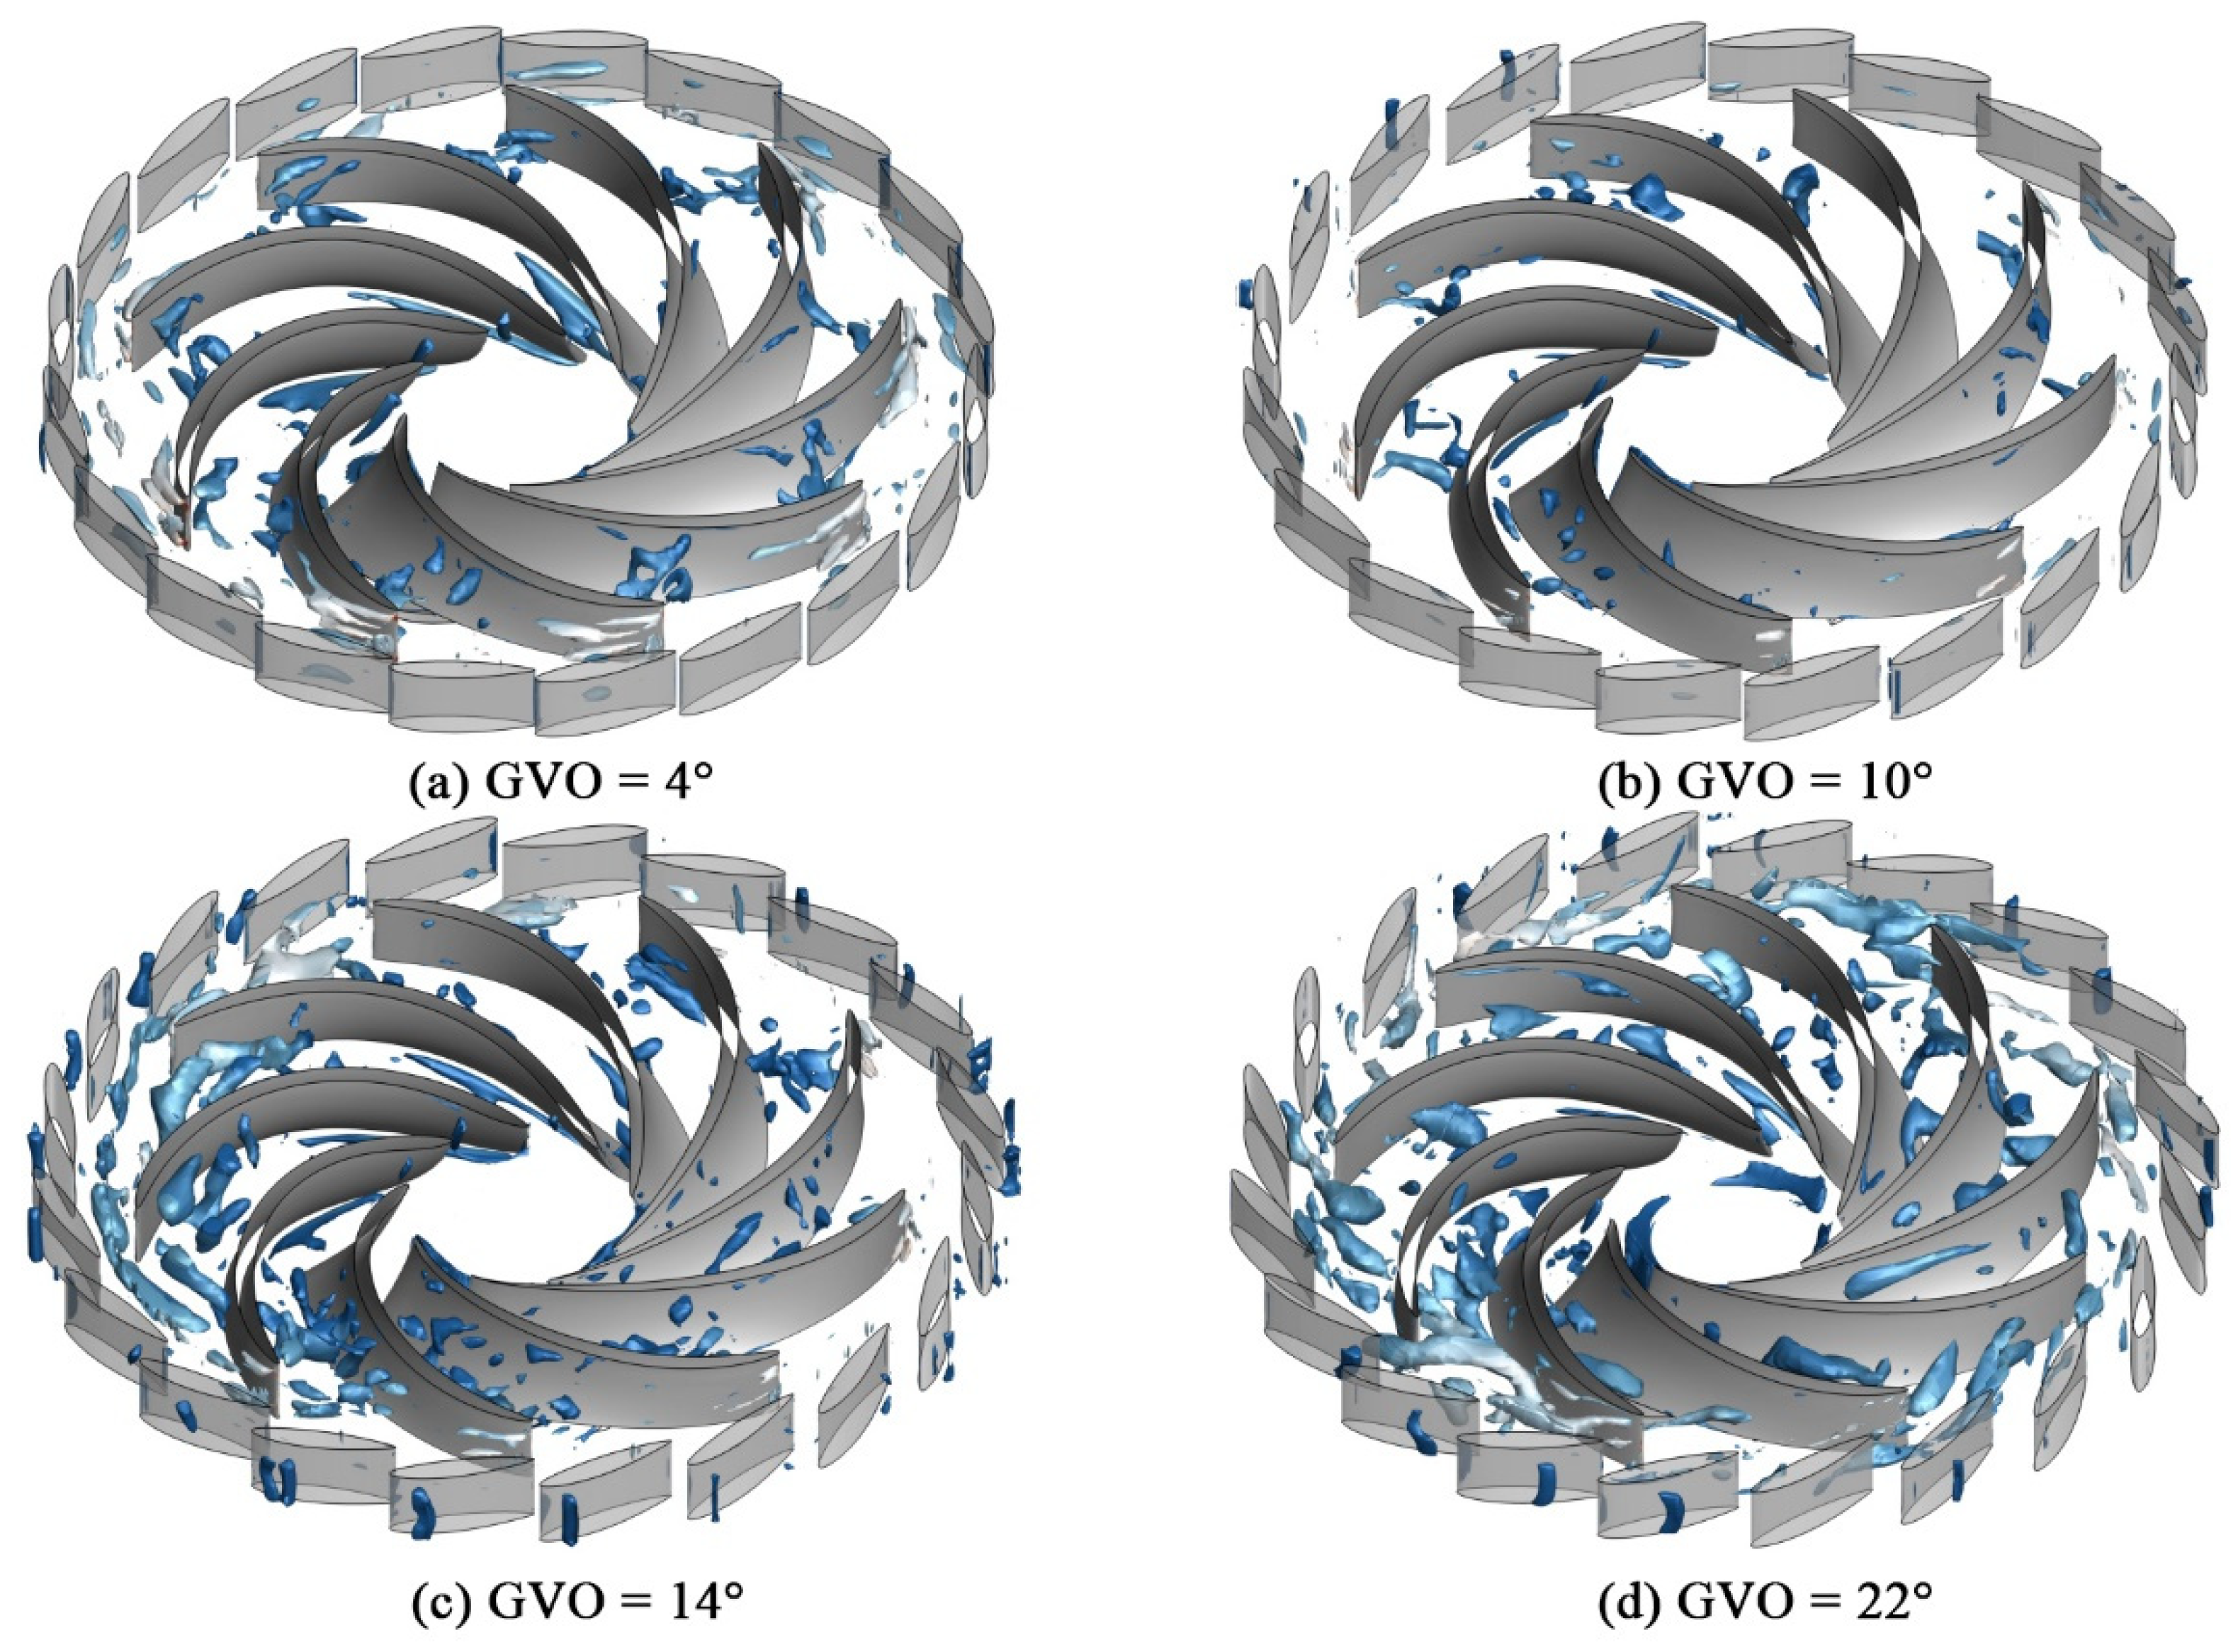
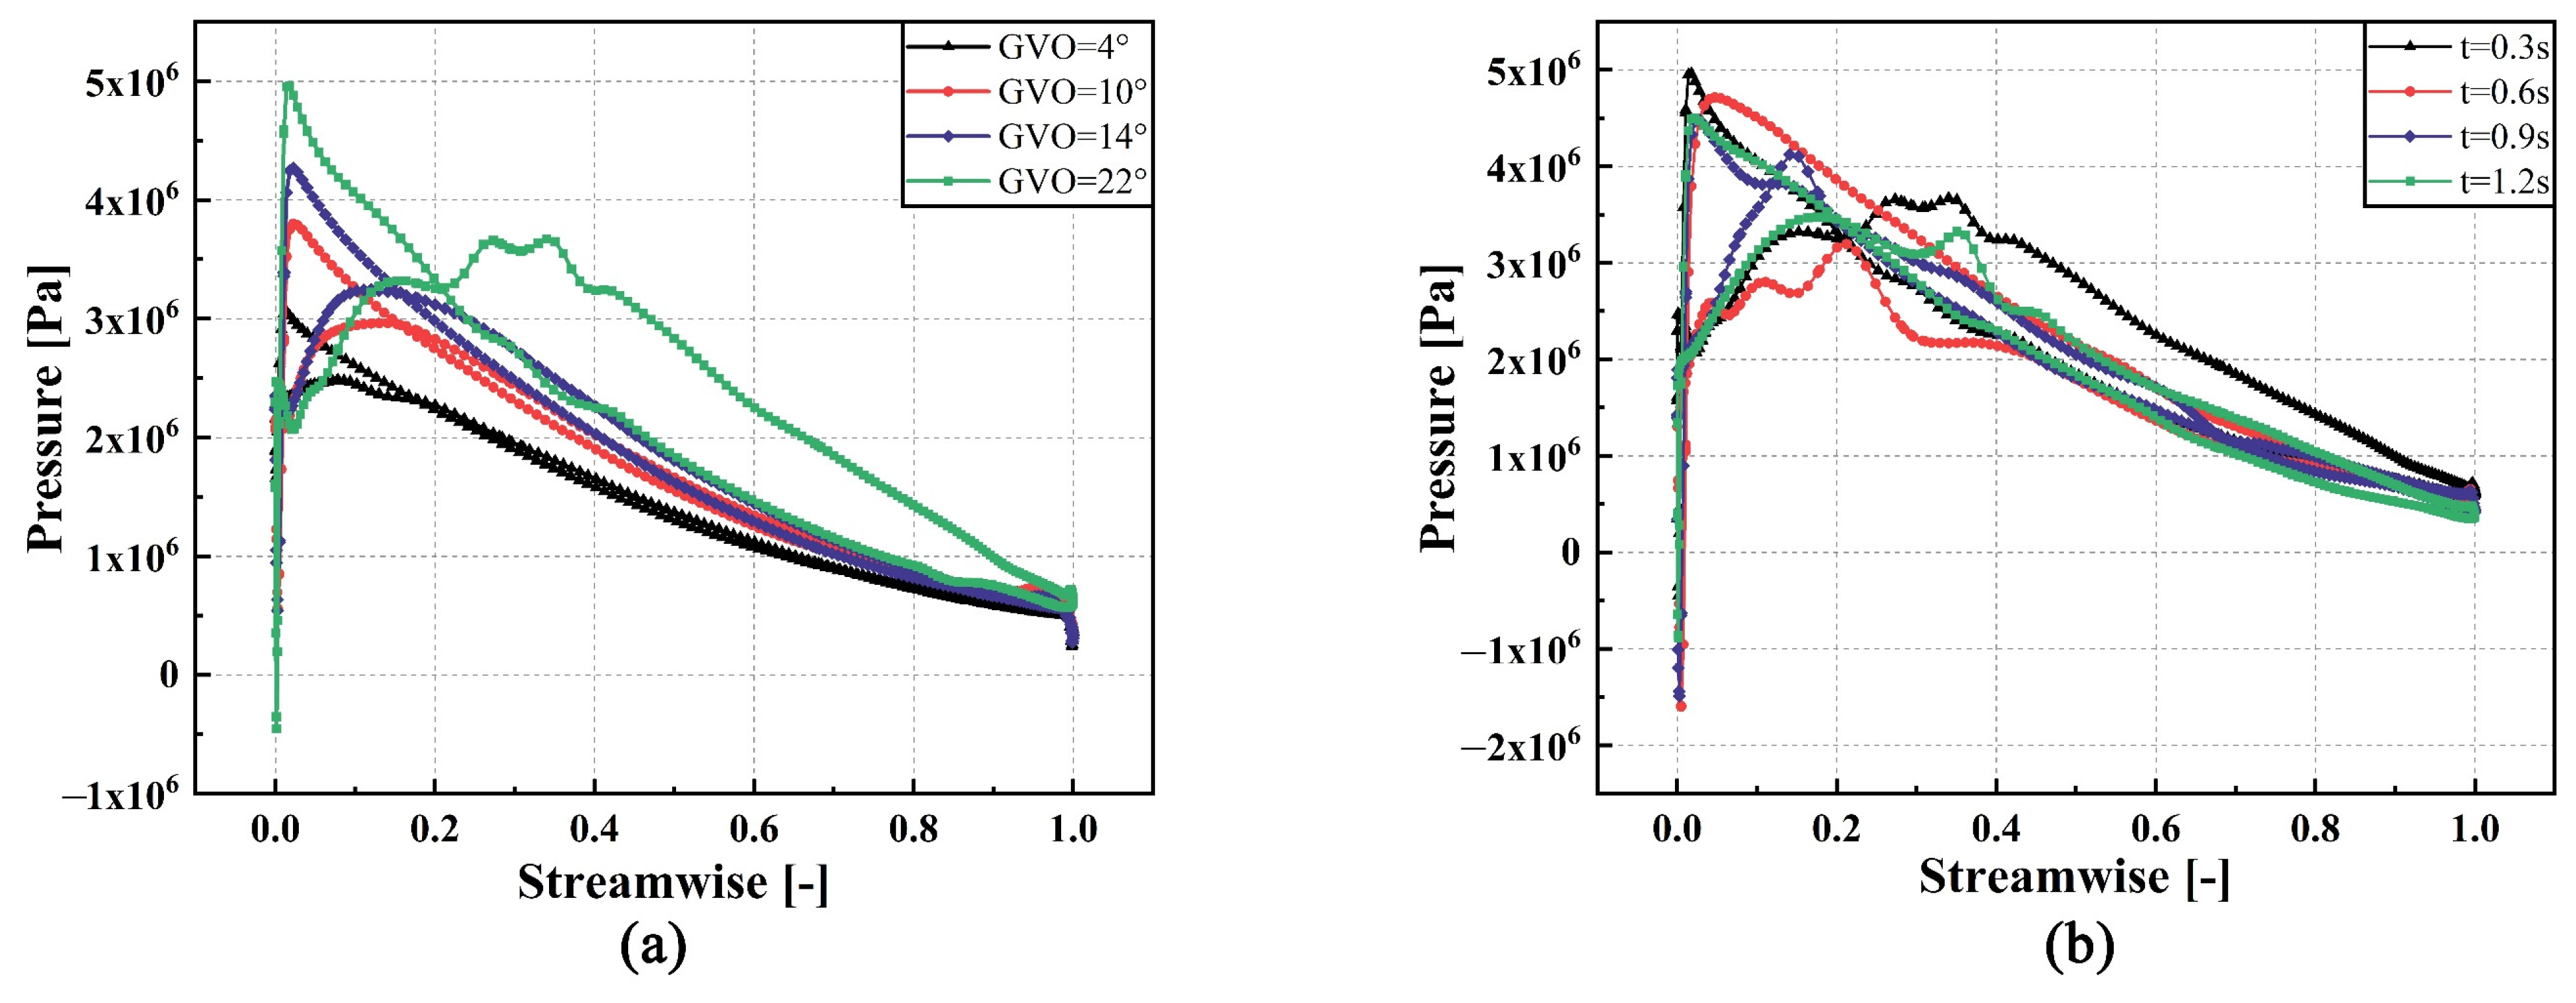
  • Under the no-load conditions, the flow stability of the pump-turbine is closely related to the vortex evolution in the runner. By increasing the GVO, the channel vortices first gather at the suction side of the blades and then spread to the pressure side. Meanwhile, the reverse pressure turning points of the blade start to move downstream, and the circumferential symmetry of the high-speed water ring in the vaneless region is broken. As a result, the rotating stall with frequency 0.7 f n is more drastic than under low GVO conditions, which also threatens the structural safety of the runner.
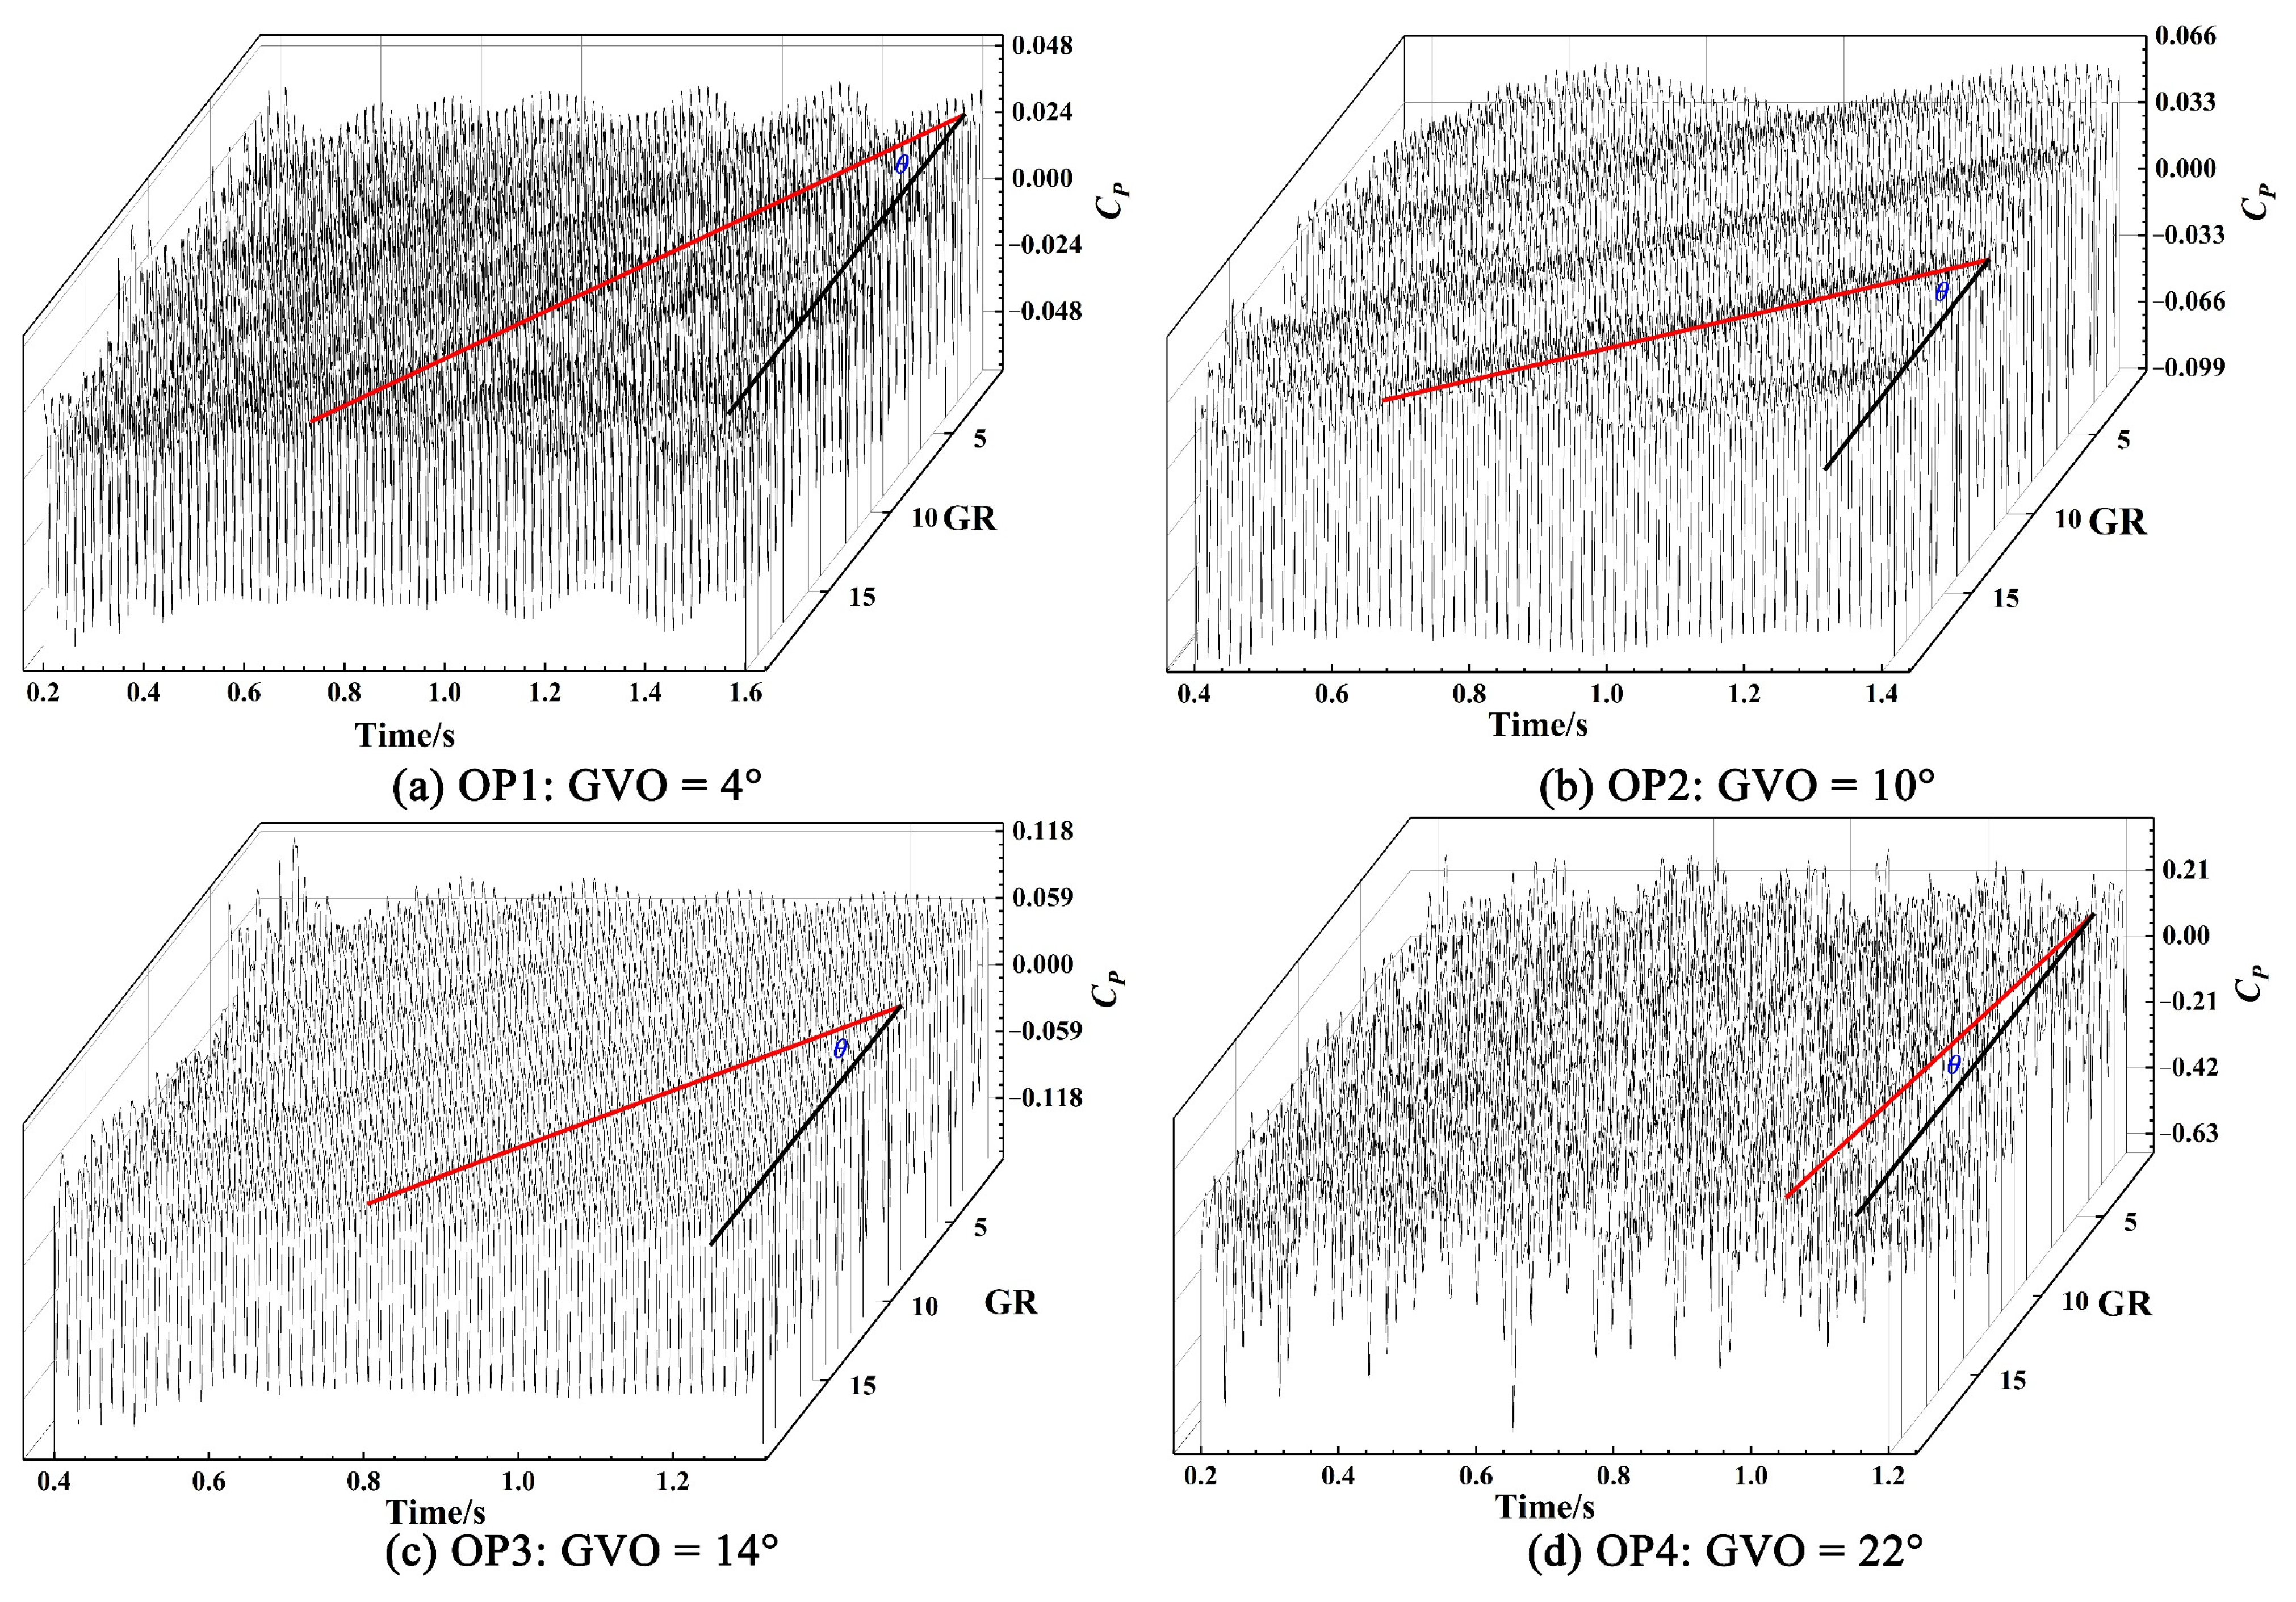
  • During low GVO conditions, the pressure pulsation in the vaneless zone is dominated by the RSI, namely, the blade-passing frequency 9 f n and its harmonic 18 f n . The propagation capacity of the RSI frequencies is more powerful than that caused by the rotating stall. With the increase of GVO, the circumferential propagation rate and appearance of low-frequency signals are represented by the rotating stall frequency 0.7 f n rise, which transmits upstream to the spiral casing and downstream to the elbow section of the draft tube. At the downstream channel, near the runner inlet, the amplitude of these low-frequency signals reaches its maximum. These phenomena align with the results of flow characteristics and have an effect on structural performance.
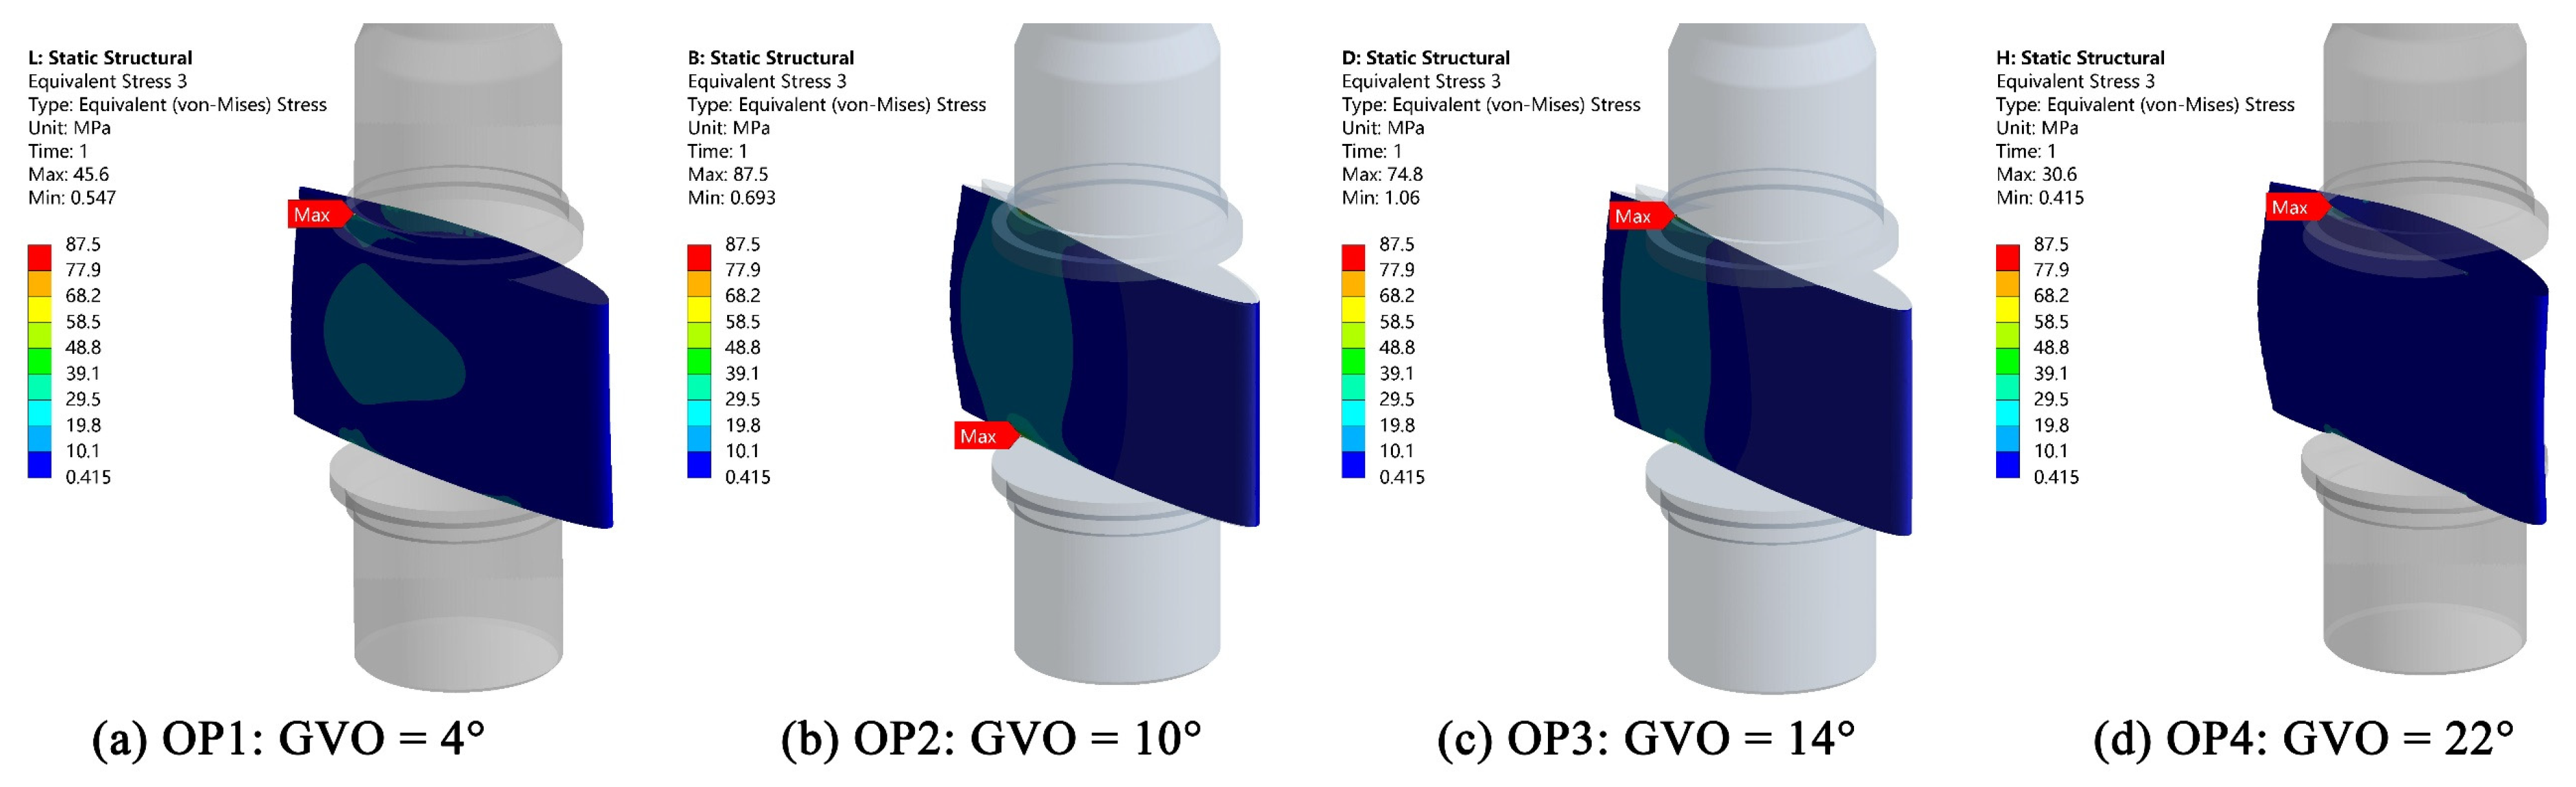
  • Under no-load conditions, the greater the GVO, the more uneven the circumferential distribution of the runner stress and the more significant the stress development of the blade root. That is, the stress concentrates at the weld between the blades and the lower ring, potentially forming and expanding blade cracks. This substantiates the cracks observed in the physical blade. Moreover, the structural stress of the guide vanes is alleviated with the increase of the GVO, whereas its deformation becomes enlarged under the combined effects of frequency and amplitude of the hydraulic excitation.
  • To improve the structural performance affected by hydraulic characteristics, the RPT should avoid operating under no-load conditions with large GVO as far as possible. In order to design or optimize the S-characteristics of the RPT, the guide vanes and runner could be considered as a whole to investigate their internal flow and structure characteristics.

Author Contributions

Conceptualization, Y.Z. (Yuquan Zhang) and E.F.-R.; methodology, C.Y. and Y.Z. (Yuquan Zhang); supervision, Y.Z. (Yuan Zheng) and Y.Z. (Yuquan Zhang); writing—original draft, S.R.; software, S.R. and B.L.; validation, S.R., Y.Z. (Yuan Zheng) and C.Y.; investigation, S.R., Y.Z. (Yuan Zheng), C.Y. and B.L.; writing—review and editing, E.F.-R. and Y.Z. (Yuquan Zhang). All authors have read and agreed to the published version of the manuscript.

Funding

This work was supported by the National Natural Science Foundation of China (52271275).

Data Availability Statement

Data are contained within the article.

Acknowledgments

Thanks to Zhang for his advice.

Conflicts of Interest

The authors declare no conflict of interest.

Nomenclature

P r Rated power of the unit, MW
n r Rated rotational speed of the runner, rpm
H r Rated head, m
D Nominal diameter of the runner, m
f n Rotational frequency of the runner, Hz
Z r The blade number of runner
Z g The number of guide vanes
Z s The number of stay vanes
n 11 Unit speed
Q 11 Unit discharge
C p The pressure pulsation coefficient

Abbreviations

BEPBest efficient point
CFDComputational fluid dynamics
FSIFluid–structure interaction
GVOGuide vanes opening
GGIGeneral grid interface
OPOperation point
RSIRotor–stator interaction
RPTReversible pump-turbine
SSTShear stress transport

References

  1. Han, X.; Wang, X.; Zheng, H.; Xu, X.; Chen, G. Review of the development of pulsating heat pipe for heat dissipation. Renew. Sustain. Energy Rev. 2016, 59, 692–709. [Google Scholar] [CrossRef]
  2. Der, O.; Alqahtani, A.A.; Marengo, M.; Bertola, V. Characterization of polypropylene pulsating heat stripes: Effects of orientation, heat transfer fluid, and loop geometry. Appl. Therm. Eng. 2021, 184, 116304. [Google Scholar] [CrossRef]
  3. Rodríguez-Pérez, Á.M.; Pulido-Calvo, I.; Cáceres-Ramos, P. A computer program to support the selection of turbines to recover unused energy at hydraulic networks. Water 2021, 13, 467. [Google Scholar] [CrossRef]
  4. Wang, R.; Yang, W.J.; Ji, L.T.; Li, X.D.; Zhang, S.S.; Jing, X.Y. Regulation intensity assessment of pumped storage units in daily scheduling for renewable energy consumption. Sustain. Energy Technol. Assess. 2023, 56, 103027. [Google Scholar] [CrossRef]
  5. Zhao, X.R.; Xiao, Y.X.; Wang, Z.W.; Luo, H.Y.; Ahn, S.H.; Yao, Y.Y.; Fan, H.G. Numerical analysis of non-axisymmetric flow characteristic for a pump-turbine impeller at pump off-design condition. Renew. Energy 2018, 115, 1075–1085. [Google Scholar]
  6. Zhang, Y.Q.; Sun, J.; Zheng, Y.; Ge, X.F.; Peng, X.Y.; Hong, Y.L.; Fernandez-Rodriguez, E. Unsteady characteristics of lubricating oil in thrust bearing tank under different rotational speeds in pumped storage power station. Renew. Energy 2022, 201, 904–915. [Google Scholar] [CrossRef]
  7. Suh, J.W.; Yang, H.M.; Joo, W.G.; Park, J.; Choi, Y.S. Unstable S-shaped characteristics of a pump-turbine unit in a lab-scale model. Renew. Energy 2021, 171, 1395–1417. [Google Scholar] [CrossRef]
  8. Casartelli, E.; Del Rio, A.; Mangani, L.; Schmid, A. Capturing the S-shape of pump-turbines by computational fluid dynamics simulations using an anisotropic turbulence model. J. Fluids Eng. 2021, 144, 021203. [Google Scholar] [CrossRef]
  9. Lenarcic, M.; Bauer Ch Giese, M.; Jung, A. Prediction of S-shaped characteristics in reversible pump-turbines using different numerical approaches. IOP Conf. Ser. Earth Environ. Sci. 2016, 49, 042009. [Google Scholar] [CrossRef]
  10. Zhao, Z.W.; Zhang, H.; Chen, D.Y.; Gao, X. No-load stability analysis of pump turbine at startup-grid integration process. J. Fluids Eng. 2019, 141, 081113. [Google Scholar] [CrossRef]
  11. Yang, H.X.; He, Q.L.; Huang, X.X.; Yang, M.Q.; Bi, H.L.; Wang, Z.W. Experimental and Numerical Investigation of Rotor–Stator Interaction in a Large Prototype Pump–Turbine in Turbine Mode. Energies 2022, 15, 5523. [Google Scholar] [CrossRef]
  12. Zhang, Y.L.; Wu, Y.L. A review of rotating stall in reversible pump turbine. J. Mech. Eng. Sci. 2017, 231, 1181–1204. [Google Scholar] [CrossRef]
  13. Tanaka, H. Vibration behavior and dynamic stress of runners of very high head reversible pump-turbines. Int. J. Fluid Mach. Syst. 2011, 4, 289–306. [Google Scholar] [CrossRef]
  14. Hu, J.H.; Yang, J.B.; He, X.H.; Zeng, W.; Zhao, Z.G.; Yang, J.D. Transition of amplitude-frequency characteristic in rotor-stator interaction of a pump-turbine with splitter blades. Renew. Energy 2023, 205, 663–677. [Google Scholar] [CrossRef]
  15. Han, F.; Chen, X.H.; Yang, Y.; Wang, C. Numerical and experimental study on the effect of rotor-stator interaction strength within mixed-flow centrifugal pumps. J. Mar. Sci. Eng. 2022, 10, 1114. [Google Scholar] [CrossRef]
  16. Deniz, S.; Von Burg, M.; Tiefenthaler, M. Investigation of the flow instabilities of a low specific speed pump turbine part 2: Flow control with fluid injection. J. Fluids Eng. 2022, 144, 071210. [Google Scholar] [CrossRef]
  17. Chen, Z.M.; Jiang, Z.Y.; Chen, S.; Zhang, W.W.; Zhu, B.S. Experimental and numerical study on flow instability of pump-turbine under runaway conditions. Renew. Energy 2023, 210, 335–345. [Google Scholar] [CrossRef]
  18. Fu, X.L.; Zuo, Z.G.; Chang, H.; Wang, H.J.; Wei, X.Z. Mechanism of low frequency high amplitude pressure fluctuation in a pump-turbine during the load rejection process. J. Hydraul. Res. 2021, 59, 280–297. [Google Scholar] [CrossRef]
  19. Hu, D.L.; Cheng, Y.G.; Zhang, P.C.; Wang, X.; Ding, J.H.; Zhang, X.X. Distribution features of flow patterns and pressure pulsations of pump-turbine in five operating modes on the four-quadrant plane. Front. Energy Res. 2022, 10, 880293. [Google Scholar] [CrossRef]
  20. Fu, X.L.; Li, D.Y.; Song, Y.C.; Wang, H.J.; Yang, J.L.; Wei, X.Z. Dynamic characteristics of a running away pump-turbine with large head variation: 1D+3D coupled simulation. Eng. Appl. Comput. Fluid Mech. 2023, 17, 15. [Google Scholar] [CrossRef]
  21. Hu, J.H.; Yang, J.D.; He, X.H.; Yang, J.B. Improved S-shaped characteristic curve of pump-turbine based on numerical simulation. J. Huazhong Univ. Sci. Technol. (Nat. Sci. Ed.) 2020, 48, 109–114. [Google Scholar]
  22. Li, D.Y.; Qin, Y.L.; Wang, J.P.; Zhu, Y.T.; Wang, H.J.; Wei, X.Z. Optimization of blade high-pressure edge to reduce pressure fluctuations in pump-turbine hump region. Renew. Energy 2022, 181, 24–38. [Google Scholar] [CrossRef]
  23. Qin, Y.L.; Li, D.Y.; Wang, H.J.; Liu, Z.S.; Wei, X.Z.; Wang, X.H.; Yang, W.B. Comprehensive hydraulic performance improvement in a pump-turbine: An experimental investigation. Energy 2023, 284, 10. [Google Scholar] [CrossRef]
  24. Rodríguez-Pérez, Á.M.; Rodríguez, C.A.; Márquez-Rodríguez, A.; Mancera, J.J.C. Feasibility analysis of installing a tidal turbine using fuzzy logic: Case study and design considerations. Axioms 2023, 12, 778. [Google Scholar] [CrossRef]
  25. Zhang, Z.; Mom, X.; Liu, M.; Liu, M. Fuzzy comprehensive evaluation of site selection for offshore wind farms based on Delphi method. Renew. Energy 2016, 86, 1152–1159. [Google Scholar]
  26. Mao, X.L.; Pavesi, G.; Chen, D.Y.; Xu, H.S.; Mao, G.J. Flow induced noise characterization of pump turbine in continuous and intermittent load rejection processes. Renew. Energy 2019, 139, 1029–1039. [Google Scholar] [CrossRef]
  27. Zhang, C.Y.; Wang, W.J.; Pei, J.; Yuan, S.Q. Numerical simulation of unsteady flow characteristics in a centrifugal pump during runaway process caused by power failure. J. Phys. Conf. Ser. 2022, 2217, 01247. [Google Scholar] [CrossRef]
  28. Pokharel, N.; Ghimire, A.; Thapa, B.; Singh Thapa, B.; Qian, Z.D.; Guo, Z.W. Numerical and experimental study of pump as turbine for sediment affected micro hydropower project in Nepal. IOP Conf. Ser. Earth Environ. Sci. 2021, 774, 012062. [Google Scholar] [CrossRef]
  29. Xu, J.H.; Zhang, Y.Q.; Peng, B.; Zheng, Y.; Li, C.Y.; Zang, W.; Fernandez-Rodriguez, E. Study on the dynamics and wake characteristics of a floating tidal stream turbine with pitch motion under free surface. Phys. Fluids 2023, 35, 085101. [Google Scholar] [CrossRef]
  30. Li, B.; Yang, W.J.; Li, J.; Jing, S.Y.; Chen, Y. Analysis of the spanwise vortex of open channel flows based on the Omega-Liutex vortex identification method. J. Hydrodyn. 2022, 34, 148–155. [Google Scholar] [CrossRef]
  31. Trieu Tran, C.; Long, X.P.; Ji, B. Vortical structures in the cavitating flow in the Francis-99 draft tube cone under off-design conditions with the new omega vortex identification method. J. Phys. Conf. Ser. 2019, 1296, 012011. [Google Scholar] [CrossRef]
  32. Li, X.Y.; Cao, J.W.; Zhuang, J.L.; Wu, T.M.; Zheng, H.Y.; Wang, Y.F.; Zheng, W.Q.; Lin, G.Q.; Wang, Z.W. Effect of operating head on dynamic behavior of a pump-turbine runner in turbine mode. Energies 2022, 15, 4004. [Google Scholar] [CrossRef]
  33. Zhang, Y.Q.; Zang, W.; Zheng, J.H.; Cappietti, L.; Zhang, J.S.; Zheng, Y.; Fernandez-Rodriguez, E. The influence of waves propagating with the current on the wake of a tidal stream turbine. Appl. Energy 2021, 290, 116729. [Google Scholar] [CrossRef]
Figure 1. The 3D model and mesh of a pump-turbine.
Processes 11 03422 g001
Figure 2. Location of pressure monitoring points in spiral casing and double-row cascade (a), runner (b), and draft tube (c).
Processes 11 03422 g002
Figure 3. Mesh sensitivity test based on efficiency: A 7.3 × 10⁶, B 8.6 × 10⁶, C 9.1 × 10⁶.
Processes 11 03422 g003
Figure 4. Comparison of experimental data and numerical simulation.
Processes 11 03422 g004
Figure 5. The distribution of streamlines in guide vanes and runner.
Processes 11 03422 g005
Figure 6. The distribution of a vortex structure in guide vanes and runner.
Processes 11 03422 g006
Figure 7. Schematic diagram of a blade load line.
Processes 11 03422 g007
Figure 8. The pressure distribution on the blade surface. (a) Under different GVO; (b) At different times of OP4.
Processes 11 03422 g008
Figure 9. The time domain diagrams of pressure in the vaneless zone (GR).
Processes 11 03422 g009
Figure 10. The frequency domain diagrams of pressure in the vaneless zone (GR).
Processes 11 03422 g010
Figure 11. The frequency domain diagram of pressure pulsation in the runner channel (RN).
Processes 11 03422 g011
Figure 12. The frequency domain diagrams of pressure pulsation in the spiral casing (SC).
Processes 11 03422 g012
Figure 13. The frequency domain diagrams of pressure pulsation in the draft tube.
Processes 11 03422 g013
Figure 14. The illustration of fluid–structure interaction (FSI): (a) schematic diagram; (b) boundary conditions; (c) mesh of the runner and the guide vane.
Processes 11 03422 g014
Figure 15. The equivalent stress distribution of the runner under different conditions. The stress concentration is marked with red rectangular boxes.
Processes 11 03422 g015
Figure 16. Blade cracks near the runner inlet.
Processes 11 03422 g016
Figure 17. The equivalent stress distribution of guide vanes under different conditions.
Processes 11 03422 g017
Table 1. Basic parameters of a pump-turbine.
P r (MW) n r (rpm) H r (m) D (m) Z r Z g Z s
306428.64302.23892020
Table 2. The parameters of selected operating points.
Operating Points GVO / ° n 11 /(r/min) Q 11 /(l/s)
OP1440.9251.18
OP21047.13100.1
OP31450.17125.43
OP42255.66222.63
BEP2844.15727.47
Table 3. The element number of each component under five schemes.
Scheme12345
Spiral casing0.70.81.01.21.3
Stay vanes0.91.01.21.41.5
Guide vanes1.01.21.51.61.7
Runner1.31.62.02.32.5
Draft tube0.60.71.01.21.2
Extended pipes0.20.30.60.90.9
Total (×106)4.75.67.38.69.1
Disclaimer/Publisher’s Note: The statements, opinions and data contained in all publications are solely those of the individual author(s) and contributor(s) and not of MDPI and/or the editor(s). MDPI and/or the editor(s) disclaim responsibility for any injury to people or property resulting from any ideas, methods, instructions or products referred to in the content.

