Article

Assessing Biodegradation Processes of Atrazine in Constructed Wetland Using Compound-Specific Stable Isotope Analysis

1
College of Architecture and Urban Planning, Tongji University, 1239, Siping Road, Shanghai 200092, China
2
College of Environmental Science and Engineering, Tongji University, 1239, Siping Road, Shanghai 200092, China
*
Authors to whom correspondence should be addressed.
Processes 2023, 11(11), 3252; https://doi.org/10.3390/pr11113252
Submission received: 18 October 2023 / Revised: 9 November 2023 / Accepted: 15 November 2023 / Published: 20 November 2023

Abstract

:
To bridge the gap between lab-scale microcosm research and field application in the compound-specific stable isotope analysis (CSIA) of atrazine, we studied the characteristics of carbon and nitrogen isotope fractionation in the atrazine degradation processes within a constructed wetland. In the wetland, we observed multiple element (C, N) isotope fractionation parameters, such as kinetic isotope effects and dual isotope slopes. These parameters are very consistent with those observed in the cultivation of AtzA- or TrzN-harboring strains, suggesting a similarity in the pathway and reaction mechanism of atrazine biodegradation between the two settings. However, we recorded variable carbon ( ε C :   −3.2 ± 0.6‰ to −4.3 ± 0.6‰) and nitrogen isotope fractionation ( ε N :   1.0 ± 0.3‰ to 2.2 ± 0.3‰) across different phases. This variance could lead to an over- or underestimation of the biodegradation extent of atrazine when employing the large or small enrichment factor of the carbon isotope. Intriguingly, the estimation accuracy improved considerably when using the enrichment factor (−4.6‰) derived from the batch cultivation of the pore water. This study advances the application of CSIA in tracking atrazine biodegradation processes in ecosystems, and it also underlines the importance of the careful selection and application of the enrichment factor in quantifying the intrinsic biodegradation of atrazine in ecosystems.

1. Introduction

The emergence of organic micropollutants, particularly pesticides, in aquatic environments is a significant concern due to the potential risks they pose to ecosystems and human health [1,2]. Among the extensively discussed pesticides, the herbicide atrazine has garnered considerable attention [3,4]. Atrazine has been found to persist in the environment [5,6] and has shown diverse toxic effects on soil microorganisms, plant growth, aquatic organisms, and human health [3,7]. Assessing the degradation processes of pesticides in the environment, however, can be challenging due to complex factors such as dilution, sorption, desorption, and biotic and abiotic biodegradation [8]. Traditional methods relying on concentration monitoring often struggle to differentiate the reduction of concentration between destructive and nondestructive processes, making it difficult to assess the in-situ pesticide degradation.
Compound-specific stable isotope analysis (CSIA) has emerged as a monitoring approach that offers distinct advantages over traditional tools by enabling the differentiation of competing environmental sinks [9]. CSIA takes advantage of the kinetic isotope effect (KIE), which results in faster bond breakage for lighter isotopes (e.g., 12C) compared to heavier isotopes (13C) during degradation. As a result, the remaining fraction of contaminants becomes relatively enriched in the heavier isotope as the degradation progresses [10]. The average compound-specific isotope value (e.g., δ13C) of the remaining contaminant can be used to quantitatively assess the in situ degradation extent according to the Rayleigh distillation equation [11] when the isotope fractionation factors of the relevant reaction processes are available [12]. CSIA also allows for the differentiation between transformation pathways (e.g., the hydrolysis vs. oxidative transformation of atrazine) [13,14] and provides insights into the underlying biochemical reaction mechanisms [15,16]. Although most CSIA studies of micropollutants have been conducted on the lab-scale cultivation of monocultures [17,18], determining isotope effects for atrazine degradation using mixed cultures and applying CSIA to pesticides in ecosystems remains limited [19,20].
Accurately measuring isotope fractionation parameters, such as the isotope enrichment factor (ε) and kinetic isotope effects (KIEs), in field conditions remains a challenge. The common approach for applying CSIA involves obtaining these parameters through batch experiments in laboratory settings. Subsequently, these parameters are used to evaluate the degradation extent of contaminants by combining the isotope signatures (e.g., δ13C) obtained from field monitoring. However, significant variability in isotope enrichment factors has been reported in the biotransformation processes of organic contaminants, even in controlled laboratory settings. For instance, trichloroethylene exhibits ε C   values ranging from −2.5‰ to −19.6‰ depending on the microbial species involved [21,22,23]. Likewise, the degradation process of dichloromethane exhibits significant variability [24], as do the carbon isotope enrichment factors for the herbicide atrazine. Systematic CSIA studies have been conducted on the lab-scale cultivation of different atrazine-degrading microorganisms, such as atzA- and trzN-harboring bacterial strains [13,14,25,26]. The carbon isotope enrichment factors vary from −0.5‰ to −5.5‰, even within the same hydrolysis pathway of atrazine [20]. The isotope fractionation was found to be sensitive to the bacterial species involved [27] as well as to the mass transfer and bioavailability limitation of atrazine [26,28,29,30]. This raises the challenge of selecting a representative isotope enrichment factor of atrazine for CSIA application in the field.
To bridge the gap between the lab-scale microcosm research and the field applications of CSIA, the current study investigates isotope fractionation characteristics in atrazine degradation processes within a two-stage vertical flow constructed wetland as a model system. This research aims to advance our understanding of the isotope effects in atrazine biodegradation processes in ecosystems and promote the application of CSIA in assessing pesticide degradation in real-world environmental scenarios.

2. Materials and Methods

2.1. Configuration of the Bench-Scale Two-Stage Vertical Flow Wetland System

The hybrid wetland system setup is detailly described in our previous study [31]. In brief, the wetland comprises two polyvinyl chloride tanks, A (L-W-H, 0.6 m-0.6 m-1.0 m) and B (0.6 m × 0.6 m × 1.0 m) (Figure S1, Supporting Information). The tanks were filled with gravel, sand, and a surface layer of soil to facilitate microbial immobilization and growth. Additionally, Phragmites australis were planted in the tanks.
Four sampling ports were installed for pore water collection: in Tank A, ports were placed at heights of 15 cm (S1) and 50 cm (S2) from the bottom, while in Tank B, ports were located at 5 cm (S4) and 40 cm (S3) from the bottom. Atrazine-containing synthetic wastewater was stored in a 70L tank and pumped into the system. The hybrid wetland received wastewater in a vertical flow mode, allowing it to flow from the bottom to the top of Tank A and subsequently cascade from the top to the bottom of Tank B.
The onset of wastewater supply to the wetland was defined as day 0. On days 51 and 57, a mixed culture of atrazine-degrading microbes was introduced into the hybrid wetland. The experiment lasted 240 days and was divided into six phases based on varying operational conditions, including the inflow of atrazine concentration, wastewater retention time, and addition of atrazine-degrading mixed cultures (Table 1). The chemical reagents and the synthetic wastewater composition are provided in the Supporting Information file (SI).

2.2. Bioaugmentation of the Wetland System Using Atrazine-Degrading Mixed Cultures

The mixed cultures of atrazine-degrading bacterial strains were introduced into the wetland system to enhance the degradation capacity of atrazine in the hybrid wetland system. These monocultures included Rhizobium sp. CX-Z, Rhizobium sp. (strains CS-1, CS-2, CS-15, CS-X, and CS-Y), Stenotrophomonas sp., Enterobacter cloacae, Hyphomicrobium sp., and Cohnella phaseoli. These bacterial strains were isolated from the atrazine-contaminated soils of a pesticide plant in Changxing county, China. The mixed cultures were further detailed in Figure S2 of the Supporting Information (SI). The Rhizobium sp. CX-Z was particularly significant, as it harbored the key degradation genes (atzA) involved in the mineralization of atrazine. The gene sequences of these atrazine-degrading bacterial monocultures were deposited in the NCBI database with the accession numbers of MH819518 and MK092988-MK092996.To prepare the bacterial inoculum, the atrazine-degrading monocultures and mixed culture were cultured in mineral salt medium (MSM), then harvested and resuspended in phosphate-buffered saline (PBS, pH 7.2–7.4). The compositions of MSM and PBS were described in the Supporting Information (SI).

2.3. Cultivation of the Pore Water Taken from the Wetland System

To calculate the isotope fractionation factors of atrazine degradation in the mixed cultures of atrazine-degrading microbes within the wetland, pore water was collected from sampling port S1 on day 110. An amount of 2.0 L of the pore water was used and it was filtered using a 0.8 µm filter to eliminate suspended particles. The filtered water was then incubated at 30 °C with 300 rpm of shaking to stimulate bacterial growth. The bacterial growth was approximated by monitoring the optical density (OD600) in the cultivation process. The concentration of atrazine and the metabolites were examined using the high-performance liquid chromatography with diode-array detection (HPLC-DAD) system. Furthermore, changes in the carbon and nitrogen isotope signatures (δ-values) were tracked throughout the cultivation process. This measurement was done using the gas chromatograph-coupled combustion isotope ratio mass spectrometry (GC-C-IRMS) system.

2.4. Quantification of Atrazine and the Transformation Metabolites in Pore Water of the Wetland

Aquatic samples were collected from the inflow, outflow, and four sampling ports of the hybrid wetland system to quantitatively analyze atrazine and its main metabolites. The analytical procedure was performed using the HPLC-DAD system (LC-20 series system, Shimadzu), with conditions adapted from previous studies [29,32]. A C18-AR column (5 µm, 250 × 4.6 mm) was used for the separation of atrazine and its degradation products. The initial elution gradient consisted of a 30% acetonitrile and 70% KH2PO4 buffer (1 mM) with a flow rate of 0.8 mL/min. The acetonitrile percentage increased linearly to 55% within 8 min. The acetonitrile gradient then increased to 90% over the next 17 min (held for 3 min). The initial conditions were restored within 4 min, and the column was left to equilibrate for another 3 min. To quantify atrazine and its metabolites, an external standard working curve was employed. Atrazine and the metabolite 2-hydroxyatrazine were measured at a wavelength of 220 nm, and while cyanuric acid, another metabolite, was measured at 213 nm.

2.5. Compound-Specific Carbon and Nitrogen Isotope Signature (δ13C, δ15N) Analysis of Atrazine

The preconcentration of the collected pore water was performed after filtering by the 0.22 µm filter. The filtered aquatic samples were then subjected to a solid-phase extraction (SPE) (CNW LC-C18 SPE tubes 500 mg) to achieve a final concentration of approximately 200 mg/L in ethyl acetate. The procedures for the SPE are detailed in the supplemental information (SI). Table S1 in the SI confirms that significant isotope effects did not occur during the SPE procedures. The analytical conditions of the carbon and nitrogen isotopes of atrazine were adapted from previous study [33], and were performed using the GC-C-IRMS system (Ultra gas chromatograph-coupled Finnigan MAT 253 isotope ratio mass spectrometer with Combustion III interface). The injection was conducted at 250 °C with a flow rate of 1.0 mL/min helium (Grade 5.0). The oven temperature program was initially at 40 °C (held for 1 min), followed by a rate of 50 °C/min, then led to 100 °C (held for 5 min), and subsequently increased to 250 °C (held for 5 min) at a ramp of 5 °C/min. Both the carbon and nitrogen isotope signatures were shown as δ-value in ‰ relative to the international reference standard Vienna Pee Dee Belemnite (VPDB) for carbon and the Air-N2 for nitrogen according to Equation (1) [34], where Rs and Rref represent isotope ratios of the samples (for carbon and nitrogen element (E)) and the international reference standards.
δ E ( ) = R s R r e f R r e f × 1000

2.6. Calculation of Stable Isotope Fractionation

The carbon and nitrogen isotope enrichment factors ( ε C , ε N ) in atrazine degradation processes were calculated through linear fitting of the Rayleigh distillation equation (Equation (2)) [11]. The Rayleigh model directly relates the initial concentration of contaminants and the isotope signatures (δ-value) (e.g., c 0 , δ C 0 13 ) at the beginning of the reaction to the values observed at reaction time t ( c t , δ C t 13 ):
ln δ t + 1000 δ 0 + 1000 = ε × l n c t c 0
Subsequently, the isotope enrichment factor in bulk can be converted to the apparent kinetic isotope effect (AKIE) according to the empirical formula (Equation (3)) [35]:
A K I E = 1 1 + z · n x · ε
where n, x, and z are the number of atoms of each concern element, the atoms involved in the active site, and competitive atoms in the reactive site, respectively. The simultaneous application of the Rayleigh model to the carbon and nitrogen isotope can be shown as:
l n δ C + 1000 t 13 δ C + 1000 0 13 = ε C · l n c t c 0
l n δ N + 1000 t 15 δ N + 1000 0 15 = ε N · l n c t c 0
We can obtain the slope of the dual isotope plot ( λ N / C ) since the remaining fractionation (f =   c t / c 0 ) of the contaminants for the carbon and nitrogen isotopes are the same:
λ N / C = ε N ε C = l n δ N + 1000 t 15 δ N + 1000 0 15 l n δ C + 1000 t 13 δ C + 1000 0 13

2.7. Quantitative Assessment of Biodegradation of Atrazine Based on CSIA

To assess the biodegradation extent of atrazine (BE) in the wetland system, the Rayleigh model does the calculation independently on the concentration evidence. The BE value was calculated using the originated carbon isotope signatures ( δ C 0 13 ) as monitored at sampling time t ( δ C t 13 ), as well as the enrichment factors ( ε C ) determined in the concern reaction pathway:
B E % = 1 δ t + 1000 δ 0 + 1000 1 ε C · 100
The BE values can subsequently be used to predict the atrazine concentrations at each sampling event ( c t ), taken with the inflow atrazine concentration of the synthetic wastewater as the initial value ( c 0 ):
c t = c 0 · 1 B E ( % ) 100

3. Results and Discussion

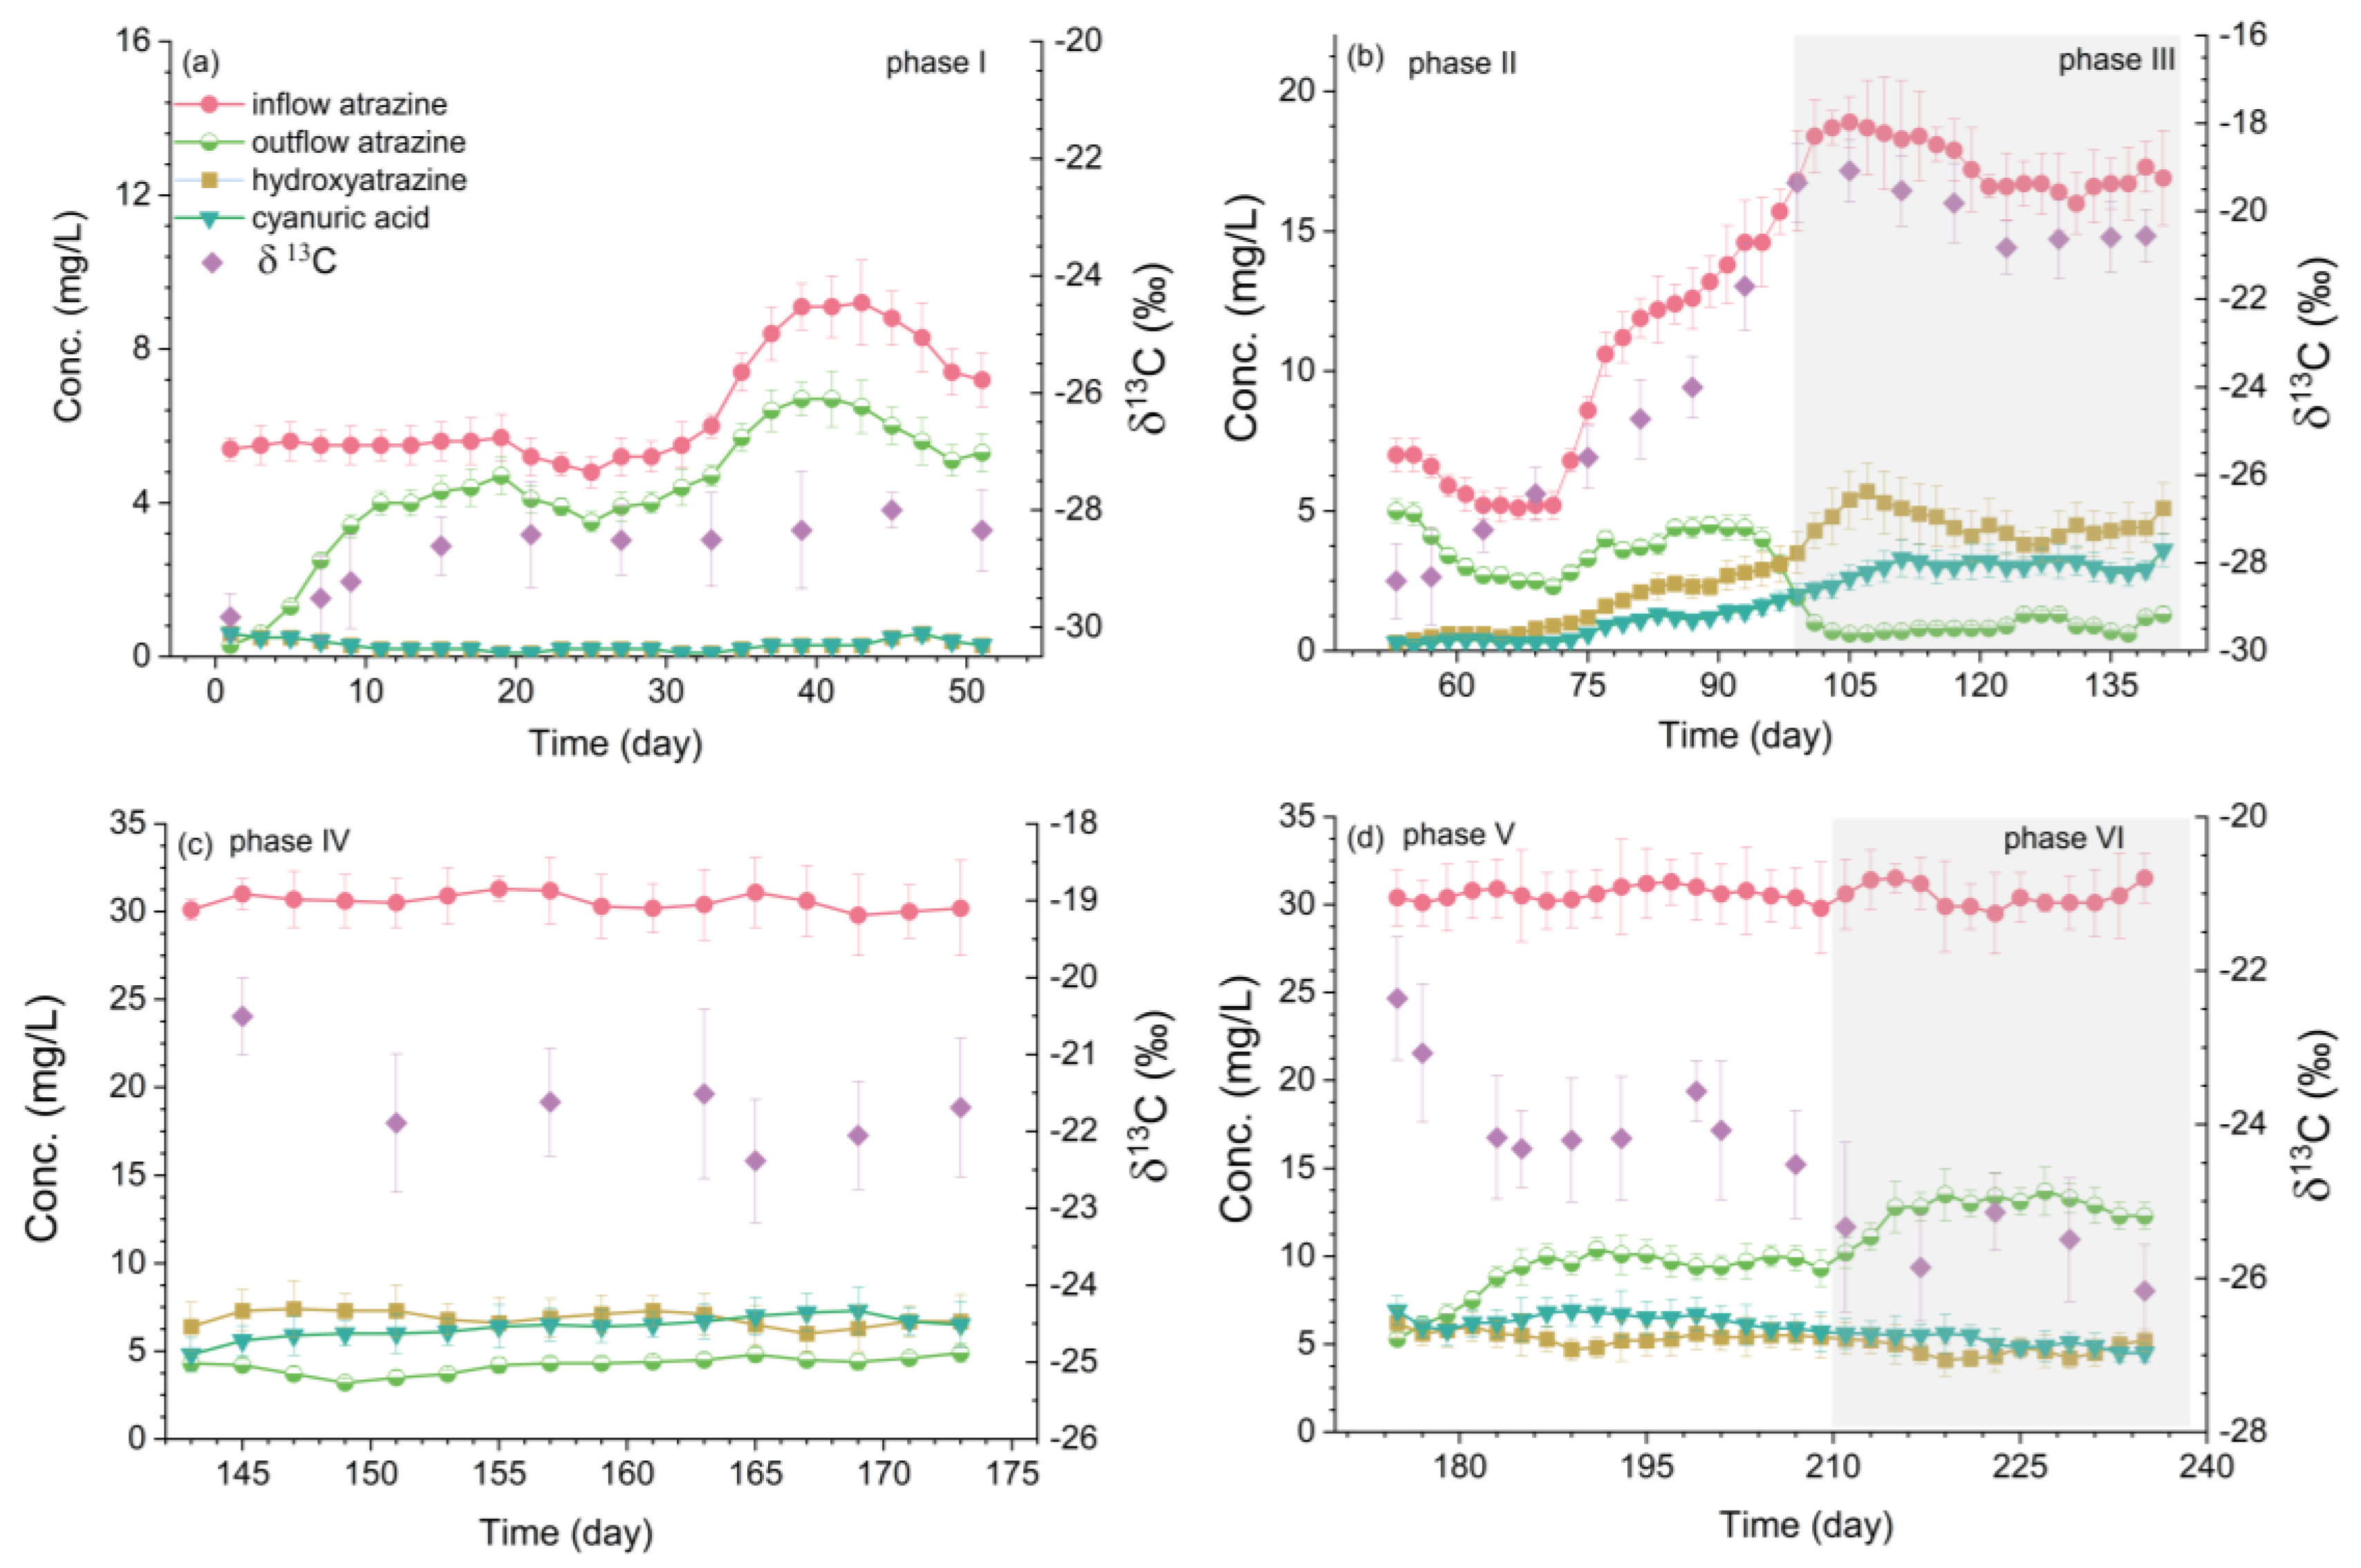
3.1. Atrazine Degradation and Carbon Isotope Signature Changes in the Wetland

The performance of the hybrid-constructed wetland systems in removing atrazine was examined by monitoring the concentrations of atrazine and its isotope signatures. Throughout the whole experiment period, the atrazine concentration in the inflow wastewater ranged from 4.1 to 32.8 mg/L. In phase I, an average of 6.3 ± 1.4 mg/L of atrazine entered the system, while the average outflow concentration was approximately 4.8 ± 1.0 mg/L during the initial 50-day experimental period (Figure 1). The data indicated a modest decrease in the atrazine concentration after the wastewater passed through the system, consistent with the low atrazine removal efficiency (RE) of 14.5% to 37.6% (excluding the initial week) in phase I. This low RE aligned with the results reported by Runes et al. [36], who observed an atrazine removal efficiency of 13% to 24% in constructed wetlands and wetland sediment, averaging around 20%. During the first week of the experiment, the atrazine concentration exhibited a substantial decrease, corresponding to a significantly higher removal efficiency of atrazine (>90%) (Figure 1). However, one week later, the RE values rapidly dropped to the 14% to 37% range. This swift decline can be primarily attributed to the adsorption effects of the wetland’s sediment compartment, as adsorption processes merely reduce atrazine concentration after achieving equilibrium. The findings suggest a limited destructive attenuation of atrazine in the first stage, with non-destructive processes playing a more significant role in its removal. This was further evidenced by the outflow concentrations of the metabolites of hydroxyatrazine and cyanuric acid. Both of these metabolites had outflow concentrations around 0.3 ± 0.2 mg/L in the first stage, subtly hinting at a slight atrazine biodegradation. Additionally, the δ13C values associated with the remaining atrazine in outflow fluctuated between −30.0‰ and −28.0‰ with a mean value of −28.8 ± 0.7‰ in first phase (Figure 1). No considerable isotope fractionation occurred during the 50-day period of experiment, based on the advised 2‰ analytical uncertainty of the stable isotope analysis intended for this in situ study [37,38]. This minor alteration in isotopic signatures aligns well with the minimal removal efficiency of atrazine, confirming atrazine was primarily eliminated by abiotic procedures, such as adsorption to the environmental matrix within the wetland. This is because isotope fractionation commonly occurs during the degradation processes and, by contrast, exhibits limited isotope fractionation during physical processes [15].
Surprisingly, a significant decrease in the atrazine concentration occurred after introducing atrazine-degrading bacterial strains into the wetland system. The mean outflow of atrazine concentration was quite low, ranging between 1.5 ± 0.4 and 4.2 ± 0.6 mg/L (Table 2), despite the average inflow concentration of atrazine increasing from 9.9 ± 3.9 to 30.4 ± 1.1 mg/L. The corresponding removal efficiency (RE) of atrazine significantly increased to a range between 60.9 ± 8.7% and 90.6 ± 4.1%. This efficiency is comparable to that reported in studies of bioaugmented wetlands using two monocultures [39], with an atrazine removal of 70% to 90%. The removal efficiency exceeded prior studies on triazine herbicide removal within various constructed wetlands [40]. The high degree of atrazine degradation can be attributed to the use of mixed cultures, further emphasized by the accumulation of metabolites. For instance, the cyanuric acid and hydroxyatrazine in the outflow rose from less than 0.3 ± 0.2 mg/L to 0.9 ± 0.5 mg/L and 1.8 ± 0.9 mg/L, respectively, in the second phase. During operation phase IV, the average concentration of cyanuric acid gradually increased to 6.8 ± 0.5 mg/L, and subsequently, 6.3 ± 0.8 mg/L. This significant increase is associated with the atrazine degradation process. The rapid accumulation of metabolic by-products indicates an active microbial degradation process is occurring within the wetland [40].
During the biodegradation process of atrazine, notable changes in the isotope signature were detected following the induction of mixed cultures. In the second phase, the δ13C values ranged from −27.6 to −20.0‰ with a mean value of −24.8 ± 2.6‰ (Figure 1b), with carbon isotope enrichment at approximately 5‰. Subsequently, the mean isotope signature escalated to −20.1 ± 1.1‰ within a range from −21.6‰ to −18.8‰ in the third phase, demonstrating a marked shift of around 10.0‰, and correspondingly, the RE values peaked in this phase. Progressively, a modest decline in the δ-value was noted, correlating with the reduction in RE throughout phases IV to VI. In phase IV, the δ-values fell within a range of between −22.7‰ and −19.5 ‰ (mean −21.5 ± 1.1‰), followed by a range between −25.0‰ and −22.0‰ in phase V (mean −23.8 ± 0.9‰), and finally in phase VI, a range between −26.3‰ and −24.8‰ was observed (mean −25.7 ± 0.7‰). The carbon isotope enrichments were about 8.5‰, 6.0‰, and 4.2‰, respectively, relative to the inflow isotope signatures. The patterns of isotope signature variations coincide well with the changing trends in RE values, thus indicating their potential accuracy for quantifying the biodegradation of atrazine accurately within the wetland.

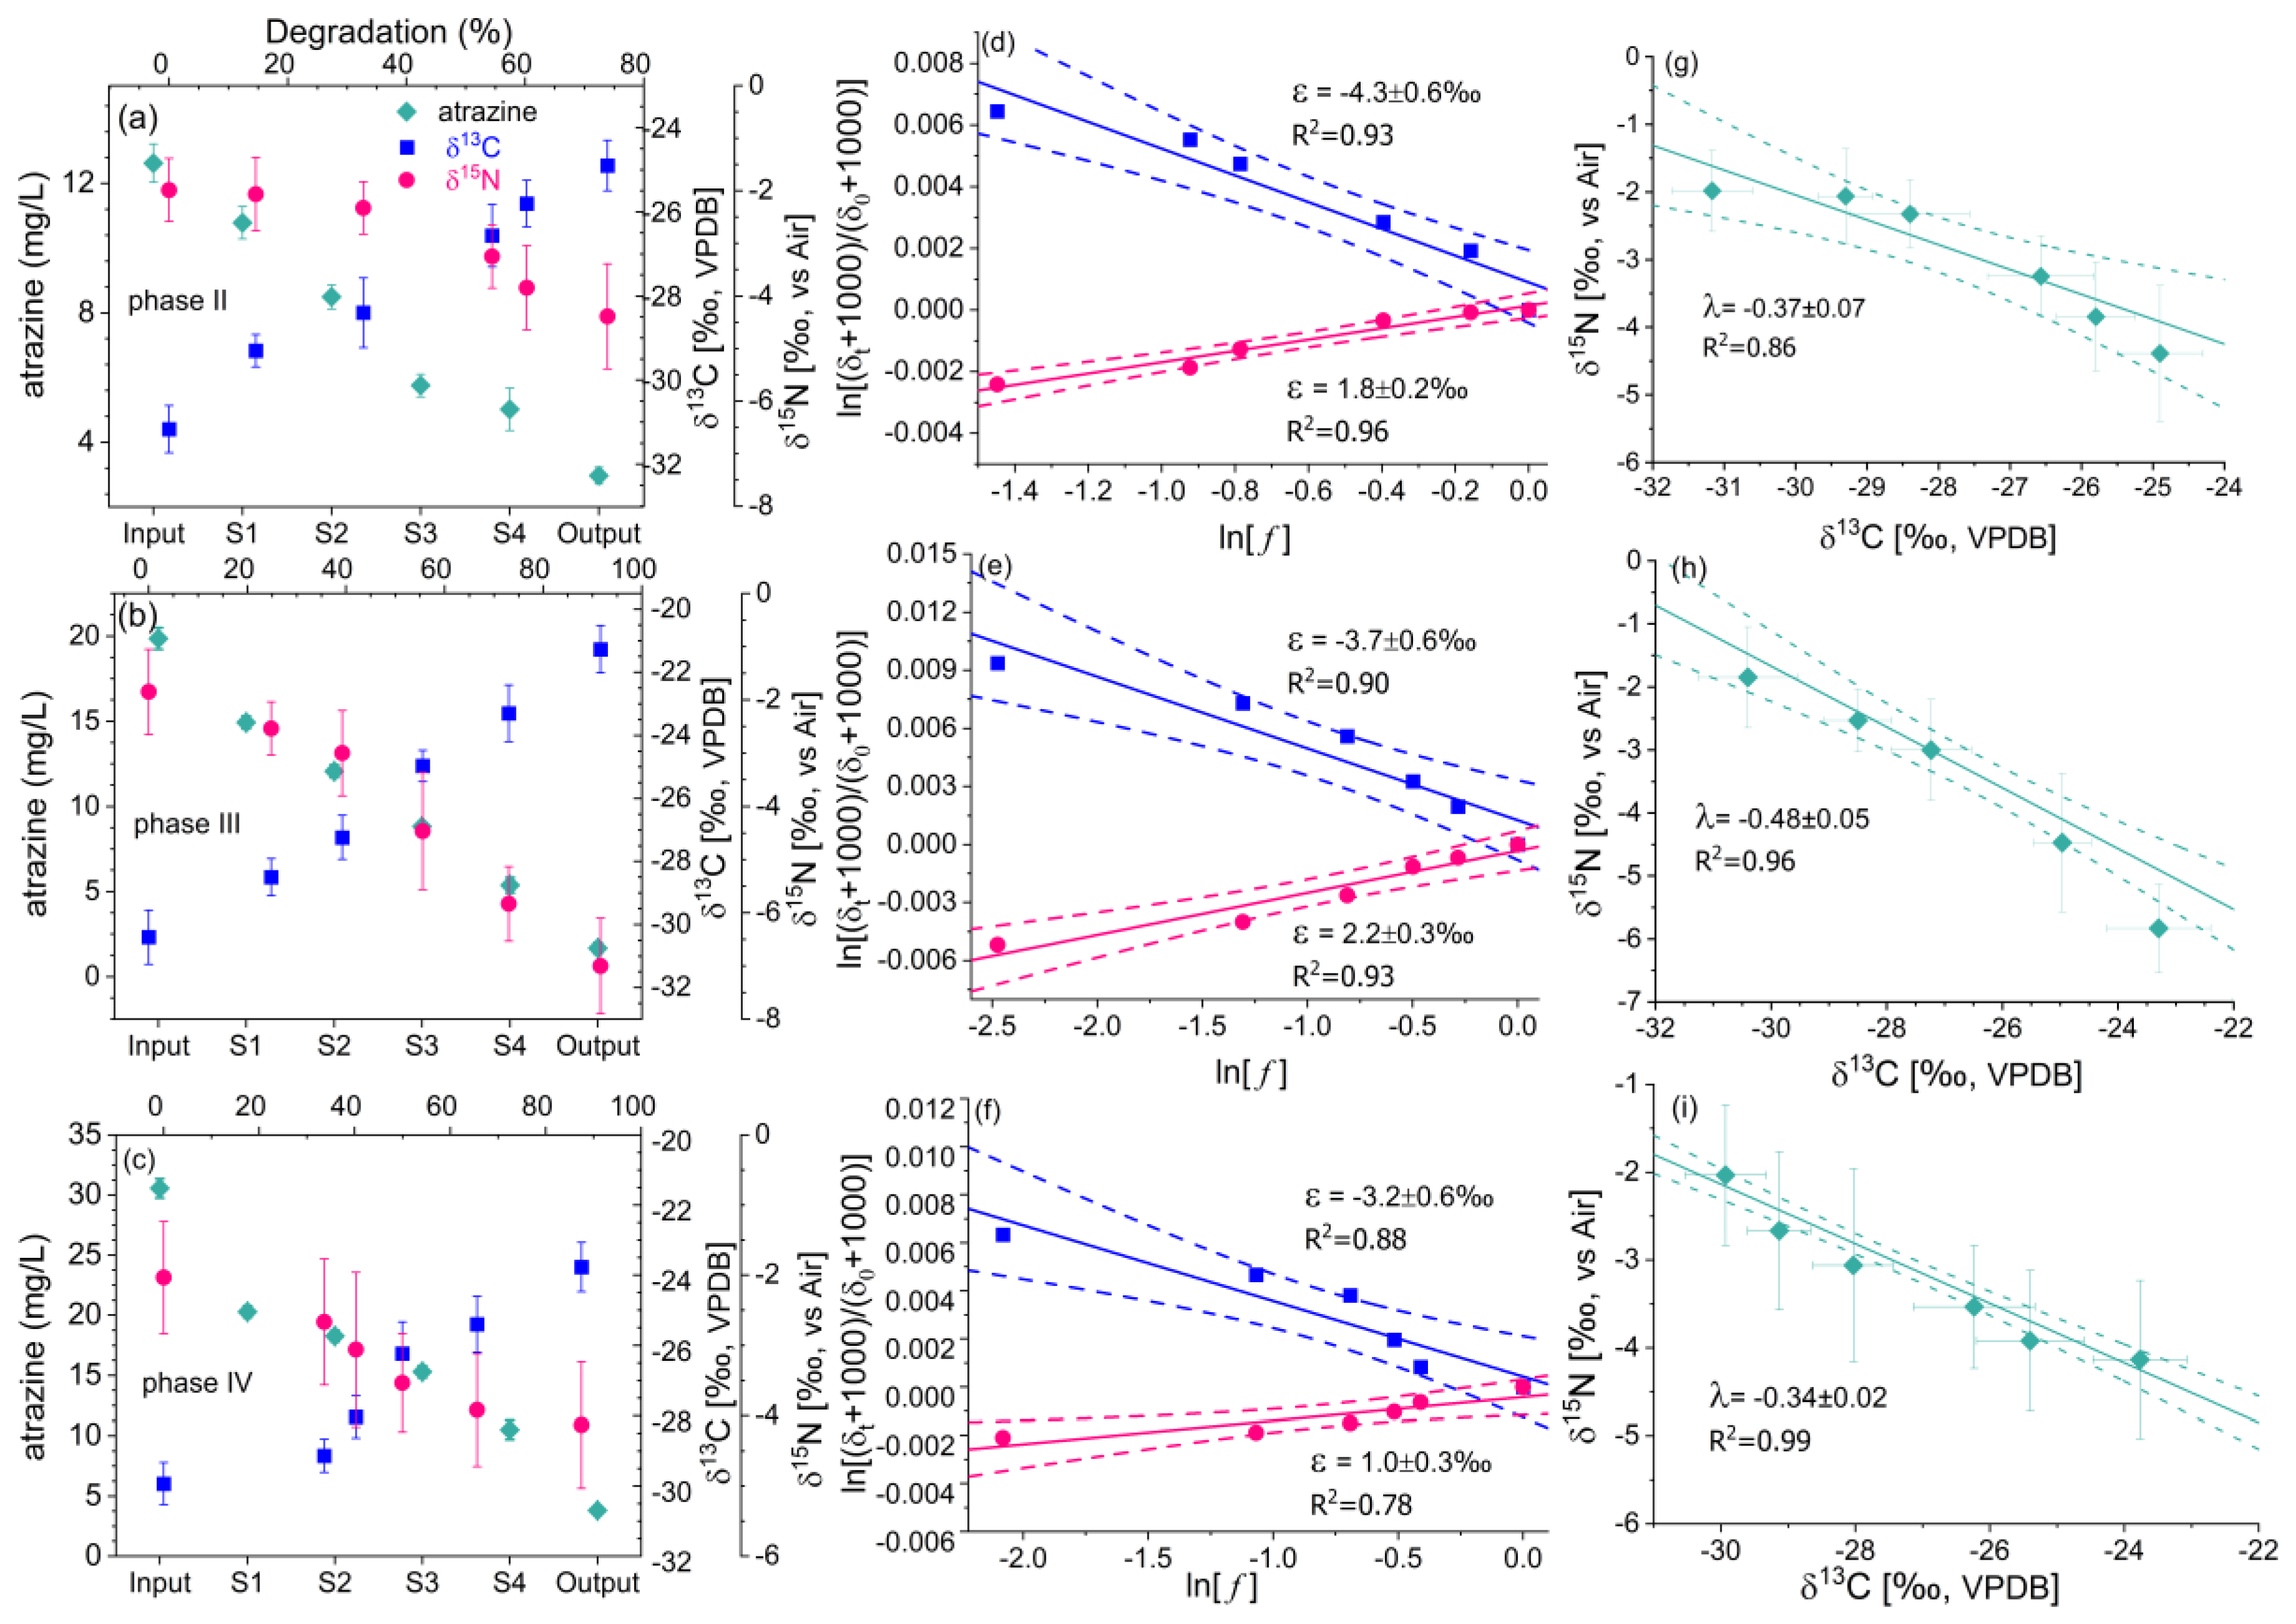
3.2. Characteristics of Carbon and Nitrogen Isotope Fractionation in Different Operational Phases

To qualitatively assess the isotope fractionation in the biotransformation processes of atrazine within the wetland system, carbon and nitrogen isotope signatures were measured in phases II, III, and IV. This measurement was conducted by tracking the changes in isotope signatures within the inflow, outflow, and four sampling ports of the wetland. As depicted in Figure 2, the degradation process of atrazine led to an enrichment of the heavy isotope 13C relative to the lighter 12C atom in the remaining atrazine at the outflow, showing a normal carbon isotope effect. Specifically, the δ13C value increased from −31.2‰ to −24.9‰ alongside the decrease of atrazine concentration from 12.6 mg/L to 3.0 mg/L during the sampling carried out in phase II (Figure 2a). Similar trends were noted in phases III and IV, the δ13C values rose from −30.4‰ to −21.3‰ in phase III and from −29.9‰ to −23.8‰ in phase IV, respectively, commensurate with the decrease in atrazine concentration along the flow path (Figure 2b,c). Interestingly, however, the heavy nitrogen isotope 15N showed depletion in the remaining atrazine in the outflow samples, suggesting an inverse nitrogen isotope effect in the atrazine degradation process. The δ15N values decreased from −2.0‰ to −4.4‰ in phase II and from −1.9‰ to −7.0‰ in phase III, and subsequently decreased from −2.0‰ to −4.1‰ in phase IV, respectively, along the flow path (Figure 2a–c). The corresponding carbon enrichment factor ( ε C ) varied from −3.2 ± 0.6‰ to −4.3 ± 0.6‰, whereas the nitrogen enrichment factors fluctuated between 1.0 ± 0.3‰ and 2.2 ± 0.3‰ throughout the three phases (Figure 2d–f).
The observed variability in isotope fractionation within the wetland ecosystem displayed divergences across different operation phases, suggesting differences in the biochemical processes. An interesting contrast was observed in the degree of the nitrogen isotope fractionation, which did not align with the fractionation of the carbon isotopes. The significant enrichment factor of the carbon isotopes predominantly emerged in phase II, while the nitrogen isotopes presented maximum enrichment during phase III. Clearly, isotope fractionation based on this in situ data, when subject to Rayleigh linear fitting, may potentially display bias. This can be attributed to the physical processes that result in concentration changes of atrazine within the wetland ecosystem without fundamentally altering the isotope composition. Moreover, the constraints on atrazine bioavailability due to the mass transfer limitations at the pore scale may reduce the observed isotope fractionation, in accordance with findings from previous studies [41]. For a more comprehensive investigation of the variation in isotope fractionation, pore water was extracted from the wetland on day 110 and subjected to laboratory cultivation. As shown in Figure 3, the atrazine experienced a rapid degradation during the cultivation processes, alongside considerable shifts in both carbon and nitrogen isotope fractionation. A consistent pattern of normal carbon and inverse nitrogen isotope fractionation was identified throughout the cultivation processes. The enrichment factor was calculated as   ε C   = −4.6 ± 0.5‰ for carbon and ε N   = 1.7 ± 0.1‰ for nitrogen in the degradation processes of atrazine, with a magnitude similar to the findings from phase II (Figure 2d). This suggests that the reduced carbon isotope fractionation observed in phases III and IV may be attributed to the mass transfer limitations of atrazine at the pore or cellular membrane scale. Nevertheless, the observed isotope fractionation of carbon within the wetland remained within the range of between −0.5‰ and −5.5‰ [20] that has been observed in laboratory cultivations. Likewise, the nitrogen isotope fractionation fell within the range of between 0.6‰ and 3.3‰ [26]. Such variations in single elemental isotope fractionation ( ε C , or ε N ) may introduce uncertainties in accurately quantifying the microbial degradation processes within the wetland.
Additionally, the stable carbon and nitrogen isotope fractionation patterns were consistent with that shown in the cultivation processes of atrazine by monocultures in laboratory settings [13,25,26], wherein normal carbon and inverse nitrogen isotope effects occurred during the biotic hydrolysis of the s-triazine Cl atom [42]. Normal carbon isotope effects typically indicate that the transition state is less constrained compared to the reactant. This phenomenon was observed in the alkaline hydrolysis of atrazine, where both normal carbon and nitrogen isotope effects supported the presence of a tightly bound nucleophilic aromatic substitution transition state. In this case, the attacking nucleophile and the leaving group are simultaneously bonded to the aromatic ring [43]. However, in contrast to these observations, an inverse nitrogen isotope effect suggests a more rigid and restricted bonding environment in the transition state compared to the reactant [44,45]. This indicates that the reaction follows a stepwise mechanism in the hydrolysis pathway, with bond formation and bond breaking occurring sequentially. The tighter transition state can be attributed to the additional bonding to the aromatic N atom. For instance, the protonation of the aromatic N atom in the transition state can lead to a tighter transition state: the lone pair of electrons on the heterocyclic ring N atom can act as a hydrogen bond acceptor and be protonated by hydrogen bond donors, such as the hydrogen ion in an acidic solution, or the hydrogen on the amino acid residue of the reactive site in an enzyme [42,46]. Therefore, the normal carbon and nitrogen isotope fractionation patterns suggest that the microbial degradation of atrazine in wetlands follows the pathway reported in the cultivation of monocultures in laboratory settings. In this pathway, the protonation of the N atoms embedded in the π−π system activates the heterocyclic ring, facilitating the nucleophilic substitution of the Cl atom [42].

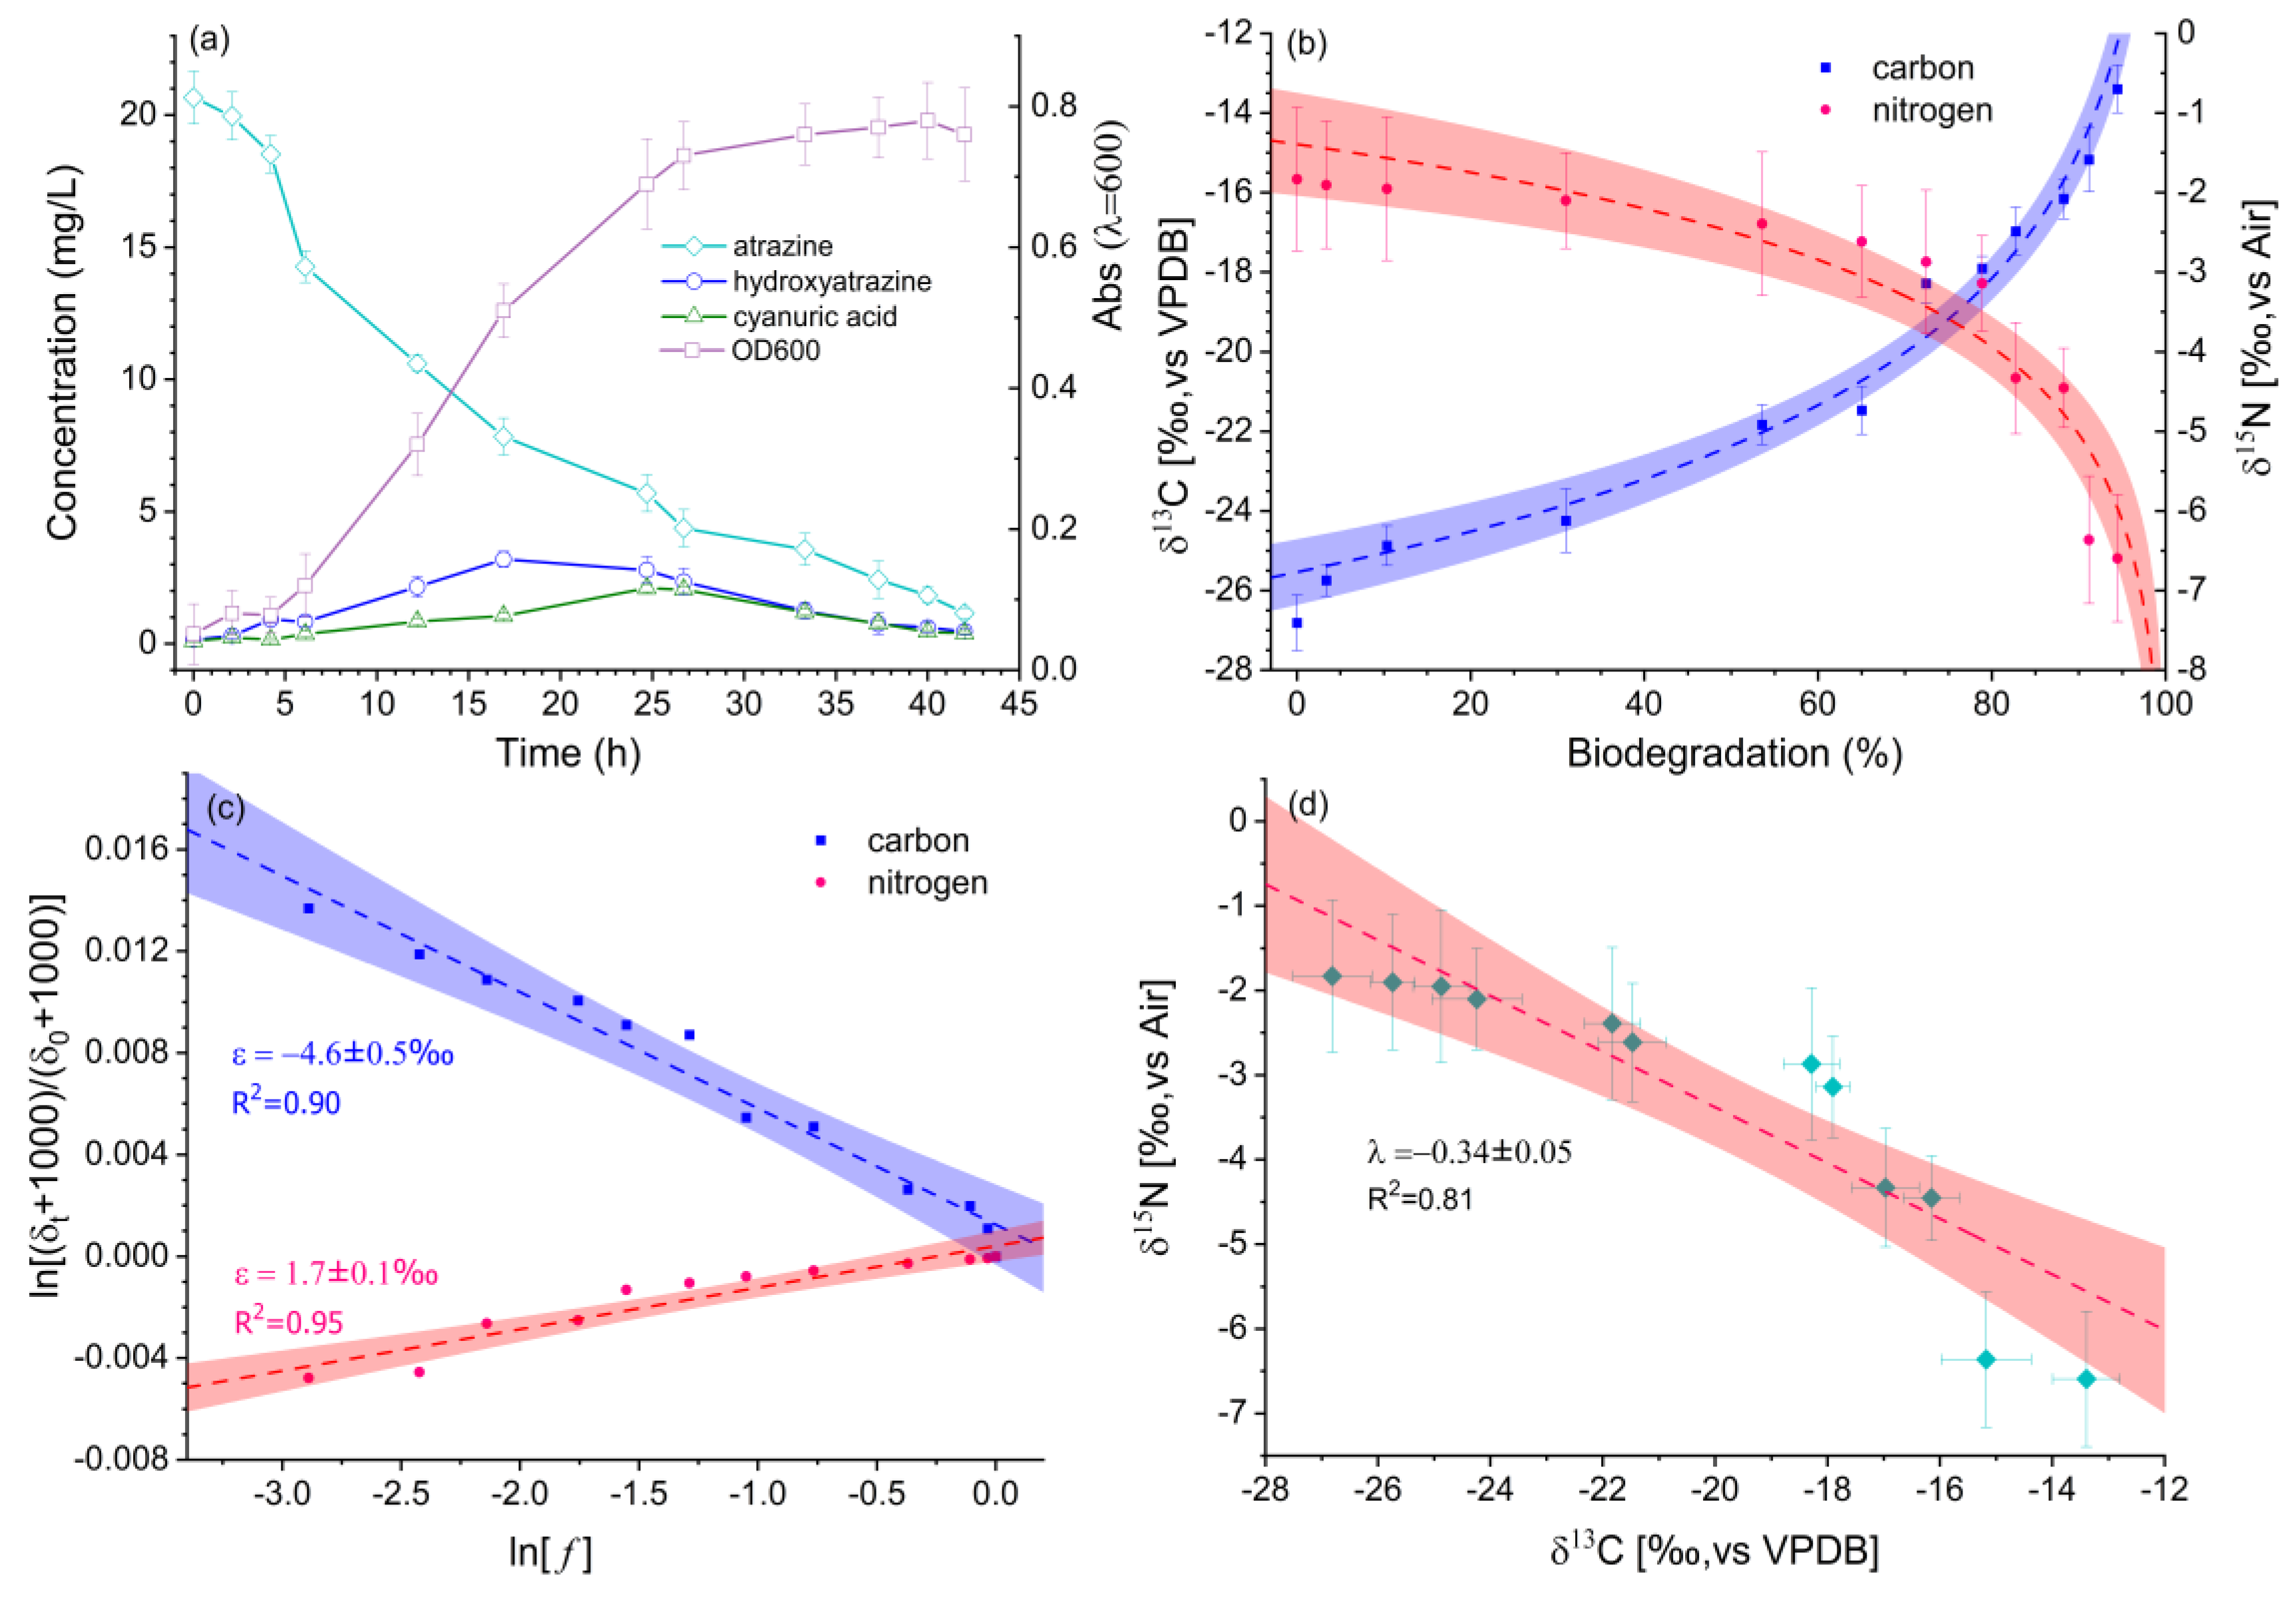
3.3. Reaction Pathway and Activation Mechanism of Atrazine Insight from Dual-Isotope Plots and Kinetic Isotope Effects

A comprehensive two-dimensional isotope fractionation examination was facilitated to astutely determine the microbial degradation process of atrazine. This investigation focused on both the carbon and the nitrogen isotope, achieved through the simultaneous measurement of carbon (δ13C) and nitrogen (δ15N) during different operational phases, as graphically depicted in Figure 2. The effects of the non-fractionating processes and the masking effects can be minimized in the dual-isotope plot, under the assumption that both carbon and nitrogen will be affected similarly, thus, maintaining a constant ratio between carbon and nitrogen isotope fractionation [9]. A dual-isotope plot was constructed to show the relationship between the δ13C and δ15N values of atrazine at varying concentrations. Through intensive analysis and the application of linear regression to the plot, the slope of the regression line (λ) proffers notable insights into the preliminary activation mechanism implicated in atrazine degradation. This method has been validated conclusively through previous lab microcosm experiments and applications in real-world settings, such as with aromatic hydrocarbons, chloroalkane, and gasoline additives [47,48,49,50].
Regarding studies focusing on the herbicide atrazine, δ13C and δ15N measurements were performed on various pure cultures known to possess atrazine degradation capabilities [51]. These measurements uncovered distinct λ values, which were contingent upon the specific bacterial strains involved and the degradation pathways followed. For instance, in oxidative dealkylation processes facilitated by the bacterial strain Rhodococcus sp. NI86/21 or the cytochrome P450, a small positive λ value (0.36 ± 0.06) was observed during the reaction processes [14]. Remarkably, this λ value is akin to those (ranging from 0.06 to 0.88) reported for abiotic oxidative dealkylation processes using permanganate [52]. Conversely, negative dual-isotope slopes were commonly observed in biotic hydrolysis processes mediated by bacterial strains containing enzyme AtzA or TrzN, as well as in acidic-assisted abiotic hydrolysis processes, shown to have a wide range from −0.32 to −1.17 [51]. In this study, based on the dual-isotope signatures detected in three sampling campaigns (phase II, III, and IV), the slopes (λ) for the different phases were −0.37 ± 0.07, −0.48 ± 0.05, and −0.34 ± 0.02, respectively (Figure 2g–i). These values fall within the reported range (−0.32 to −1.17) for the biotic hydrolysis of atrazine, and suggests the initial reaction pathway for atrazine in the wetland is similar to the biotic hydrolysis of the Cl-C bond as reported in monocultures of bacterial strains containing enzyme AtzA and TrzN [13]. Additionally, the observed dual-isotope slopes fall within a narrow range between −0.34 and −0.48 and align with those observed in Rhizobium sp. CX-Z and Pseudomonas sp. ADP, indicating that these bacterial strains may play a key role in atrazine degradation in this wetland. This finding is further supported by the increased abundance of Rhizobium sp. and Pseudomonas sp. following the addition of mixed cultures (Figures S3 and S4).
To gain insight into the activation mechanism of atrazine, apparent kinetic isotope effects (AKIEs) were calculated based on the empirical formula outlined in Equation (3). Table 3 shows the derived AKIEC for various phases ranging from 1.026 to 1.038, with an average value of approximately 1.032. This closely aligned with an established kinetic isotope effect (KIE) value of around 1.028, typically observed during a dehalogenation process involving an aromatic carbon [53]. These findings are consistent with the reported KIE values ranging from 1.03 to 1.07, usually observed during a bimolecular nucleophilic substitution (SN2 type) reaction involving a C-Cl bond [35]. A normal carbon KIEC effectively indicates a weaker Cl-C bond within the transition states, representing the energy difference between the initial reactants and the transition states, coherently corresponding to the fundamental definition of the KIE [54]. Despite minor variations between the apparent kinetic isotope effects across different phases, the AKIEC values support the theory that the initial transformation of atrazine involves an SN2-type aromatic C-Cl bond break. Further supportive evidence for the reaction mechanics is provided by the kinetic isotope effects associated with nitrogen. A secondary inverse nitrogen isotope effect was observed during different operational phases, with values ranging from 0.989 to 0.995 (average 0.992). Such an inverse isotope effect implies that the bonding environment of the nitrogen atom faces more constraints during transition states compared to the pre-reaction phase during enzymatic reactions [55]. The AKIEN values observed in this study fall within the range of 0.984 to 0.997, as previously observed in the atrazine biodegradation by pure cultures [27]. Presumably, the inverse AKIEN likely results from the protonation of one aromatic N atom of atrazine [42]. Therefore, these observed AKIEs of carbon and nitrogen suggest the initial activation mechanism in the biodegradation process for atrazine involves the protonation of an aromatic N atom in the molecule, then facilitates the SN2 type C-Cl bond cleavage of atrazine.

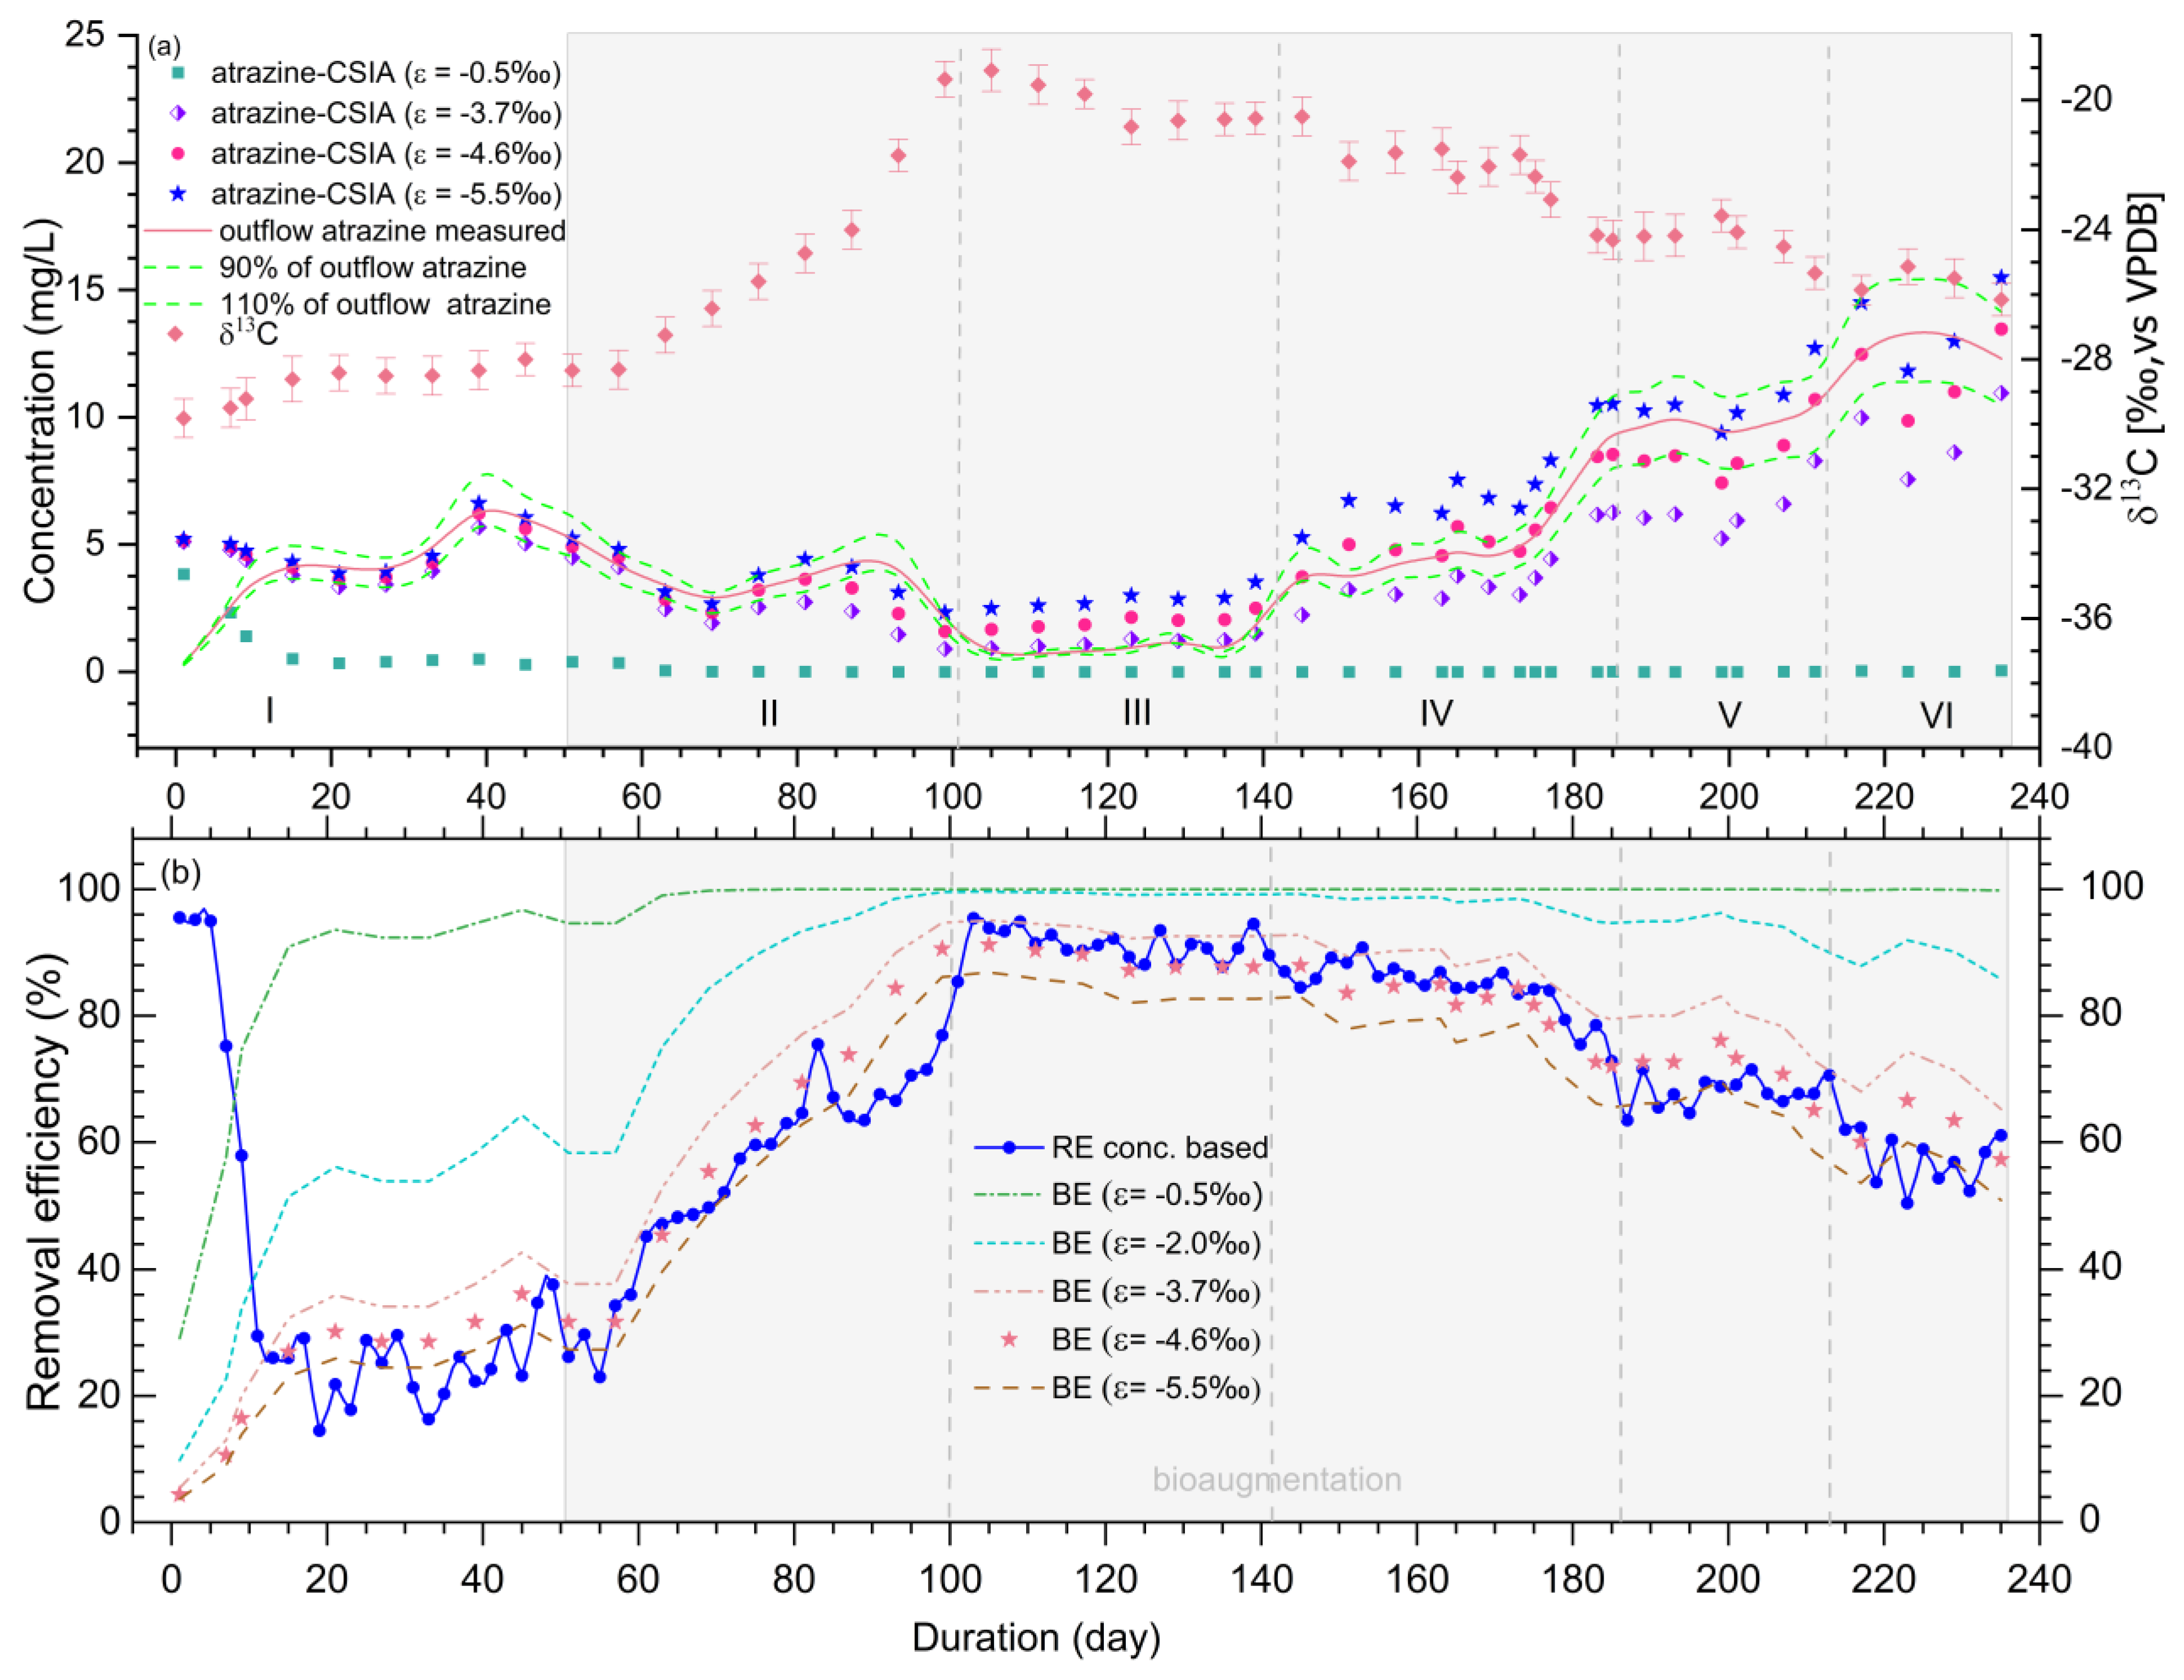
3.4. Quantification of Atrazine Biodegradation in the Wetland using Carbon Isotope Signatures

The extent of the inherent biodegradation of atrazine [BE] within the hybrid wetland was meticulously evaluated using stable carbon isotope signatures obtained from each sampling event. This assessment followed the foundation laid out by the Rayleigh model (Equation (7)). Integrating various carbon enrichment factors from recognized transformation pathways coupled with current study data allowed us to make an informed evaluation of the biodegradation extent. (Figure 4). We estimated the biotic hydrolysis of atrazine using a range of values, with −0.5‰ being the lower limit and −5.5‰ being the upper limit. Additionally, the intermediate values of −3.7‰ (from Phase III) and −4.6‰ (from batch cultivation) were factored into the analysis. The predicted BE values based on these calculations then served as a significant indicator to forecast the outflow atrazine concentration, with the inflow atrazine concentration as the initial reference point (Equation (8)).
As shown in Figure 4b, the biodegradation extent (BE) at each sampling event was calculated using the selected carbon enrichment factor and the difference in δ13C values between inflow and outflow samples. Utilizing smaller enrichment factors such as −0.5‰ and 2.0‰ resulted in BE values significantly exceeding the RE value for the entire experimental period. This implies a likely overestimation of the atrazine biodegradation within the wetland when using small enrichment factors. Meanwhile, applying the median enrichment factor of −3.7‰ produced a notable gap between the predicted BE and the concentration-based RE for the whole experiment. This suggests that even medium enrichment factors could overstate the inherent biodegradation potential of atrazine within the wetland. Interestingly, using the enrichment factor of −4.6‰ obtained from the batch cultivation of the pore water showed considerable improvements in the estimation. The yields of BE values corresponded well with the RE values from phases III and IV but differed from those observed in phases I, II, V, and VI. The most compelling agreement between the CSIA-based BE and the concentration-based RE was shown in phases III and IV, with BE scatter almost mirroring the RE line. Contrarily, in phases II, V, and VI, the BE scatter exceeded the RE line, while the differential between the average values of BE and RE was less than 10% for the majority of samples (Table 2). This suggests that assessing the inherent biodegradation extent of atrazine with a high accuracy is achievable when degradation exceeds 80%, using the enrichment factor derived from batch cultivation. Nevertheless, this method would overestimate the degradation extent of atrazine when degradation fell below 80%. Considering the largest enrichment factor, −5.5‰, the BE values aligned well with the RE calculated from phases I and VI, while they were considerably smaller than the RE values in phases II to V. This indicates an underestimation of the inherent degradation of atrazine when a high percentage of atrazine is removed from the wetland. This further suggests the inapplicability of the largest enrichment factors for assessing atrazine degradation in wetland systems.
The concentrations of the outflow atrazine were then calculated from carbon isotope signatures as depicted in Figure 4a. With the use of lower and medium enrichment factors (−0.5‰, −3.7‰), the scatter points significantly differed from the measured atrazine concentration, with the majority of scatter points falling outside the 90–110% range of the measured concentration, barring the points in phase I and III. In contrast, using the larger enrichment factor (−5.5‰) led to the majority of scatter points falling within the 90–110% range of the observed atrazine, specifically for phases I, II, V, and VI. Yet, in phases III and IV, where the removal efficiency plateaued, most of the scatter points fell outside the 90–110% range of the measured atrazine. This suggests that using the highest enrichment factor underestimates the atrazine degradation when substantial atrazine removal is taking place, but is accurate in estimating when there is lower-level atrazine degradation within the wetland. Regarding the enrichment factor (−4.6‰) obtained from batch cultivation, the scatter points predominantly fell within a 90–110% range around the outflow atrazine, with phase III being an exception. It is crucial to note that the maximal enrichment factor is commonly utilized when quantifying the extent of biodegradation [56]. Nonetheless, solely depending on this method to evaluate the degradation of specific compounds, such as atrazine, in constructed wetlands could result in an underestimation. These findings illustrate that the enrichment factor determined from the batch cultivation of pore water offers a more representative model when estimating the in situ degradation of atrazine in an ecosystem.

4. Conclusions

This study investigated the characteristics of the carbon and nitrogen isotope fractionation of atrazine degradation within a constructed wetland. The dual-isotope (C, N) fractionation pattern was consistent with those reported in the cultivation of atrazine-degrading pure strains, confirming the validity of multiple element isotope analysis in identifying the transformation pathway and activation mechanism of atrazine within the wetland system. However, the variation in single element isotope fractionation underscores the necessity for careful selection and application of isotope enrichment factors when quantitatively assessing atrazine degradation in ecosystems. This research bridges the gap between microcosm study and the field application of the compound-specific stable isotope analysis of atrazine, and enhances our understanding of stable isotope fractionation in the biodegradation processes of atrazine within the ecosystem. Future studies could explore the additional factors influencing single element isotope fractionation in ecosystems and further refine the quantification strategy based on stable isotope fractionation analysis.

Supplementary Materials

The supporting information can be downloaded at: https://www.mdpi.com/article/10.3390/pr11113252/s1.

Author Contributions

S.C.: conceptualization, methodology, data curation, writing—original draft preparation. L.M.: writing—review and editing, supervision, funding acquisition. Y.W.: writing—review and editing, supervision. All authors have read and agreed to the published version of the manuscript.

Funding

This research was funded by the National Key R&D Program of China, grant number: 2018YFC180310.

Data Availability Statement

All data generated during this study are included in this article.

Conflicts of Interest

The authors declare no conflict of interest.

References

  1. de Souza, R.M.; Seibert, D.; Quesada, H.B.; Bassetti, F.d.J.; Fagundes-Klen, M.R.; Bergamasco, R. Occurrence, impacts and general aspects of pesticides in surface water: A review. Process Saf. Environ. Prot. 2020, 135, 22–37. [Google Scholar] [CrossRef]
  2. Tang, F.H.M.; Lenzen, M.; McBratney, A.; Maggi, F. Risk of pesticide pollution at the global scale. Nat. Geosci. 2021, 14, 206–210. [Google Scholar] [CrossRef]
  3. Hu, Y.; Jiang, Z.; Hou, A.; Wang, X.; Zhou, Z.; Qin, B.; Cao, B.; Zhang, Y. Impact of atrazine on soil microbial properties: A meta-analysis. Environ. Pollut. 2023, 323, 121337. [Google Scholar] [CrossRef] [PubMed]
  4. Hennig, T.B.; Bandeira, F.O.; Puerari, R.C.; Fraceto, L.F.; Matias, W.G. A systematic review of the toxic effects of a nanopesticide on non-target organisms: Estimation of protective concentrations using a species sensitivity distribution (SSD) approach—The case of atrazine. Sci. Total Environ. 2023, 871, 162094. [Google Scholar] [CrossRef] [PubMed]
  5. Triassi, M.; Montuori, P.; Provvisiero, D.P.; De Rosa, E.; Di Duca, F.; Sarnacchiaro, P.; Díez, S. Occurrence and spatial-temporal distribution of atrazine and its metabolites in the aquatic environment of the Volturno River estuary, southern Italy. Sci. Total Environ. 2022, 803, 149972. [Google Scholar] [CrossRef]
  6. Vonberg, D.; Vanderborght, J.; Cremer, N.; Puetz, T.; Herbst, M.; Vereecken, H. 20 years of long-term atrazine monitoring in a shallow aquifer in western Germany. Water Res. 2014, 50, 294–306. [Google Scholar] [CrossRef]
  7. Urseler, N.; Bachetti, R.; Biole, F.; Morgante, V.; Morgante, C. Atrazine pollution in groundwater and raw bovine milk: Water quality, bioaccumulation and human risk assessment. Sci. Total Environ. 2022, 852, 158498. [Google Scholar] [CrossRef]
  8. Shukla, A.; Parde, D.; Gupta, V.; Vijay, R.; Kumar, R. A review on effective design processes of constructed wetlands. Int. J. Environ. Sci. Technol. 2022, 19, 12749–12774. [Google Scholar] [CrossRef]
  9. Palau, J.; Trueba-Santiso, A.; Yu, R.; Mortan, S.H.; Shouakar-Stash, O.; Freedman, D.L.; Wasmund, K.; Hunkeler, D.; Marco-Urrea, E.; Rosell, M. Dual C-Br Isotope Fractionation Indicates Distinct Reductive Dehalogenation Mechanisms of 1,2-Dibromoethane in Dehalococcoides- and Dehalogenimonas-Containing Cultures. Environ. Sci. Technol. 2023, 57, 1949–1958. [Google Scholar] [CrossRef]
  10. Ojeda, A.S.; Phillips, E.; Lollar, B.S. Multi-element (C, H, Cl, Br) stable isotope fractionation as a tool to investigate transformation processes for halogenated hydrocarbons. Environ. Ence Process. Impacts 2020, 22, 567–582. [Google Scholar] [CrossRef]
  11. Scott, K.M.; Lu, X.; Cavanaugh, C.M.; Liu, J.S. Optimal methods for estimating kinetic isotope effects from different forms of the Rayleigh distillation equation. Geochim. Et Cosmochim. Acta 2004, 68, 433–442. [Google Scholar] [CrossRef]
  12. Breukelen, B.M.V.; Prommer, H. Beyond the Rayleigh Equation: Reactive Transport Modeling of Isotope Fractionation Effects to Improve Quantification of Biodegradation. Environ. Sci. Technol. 2008, 42, 2457–2463. [Google Scholar] [CrossRef] [PubMed]
  13. Meyer, A.H.; Penning, H.; Elsner, M. C and N Isotope Fractionation Suggests Similar Mechanisms of Microbial Atrazine Transformation Despite Involvement of Different Enzymes (AtzA and TrzN). Environ. Sci. Technol. 2009, 43, 8079–8085. [Google Scholar] [CrossRef] [PubMed]
  14. Meyer, A.H.; Elsner, M. C-13/C-12 and N-15/N-14 Isotope Analysis To Characterize Degradation of Atrazine: Evidence from Parent and Daughter Compound Values. Environ. Sci. Technol. 2013, 47, 6884–6891. [Google Scholar] [CrossRef] [PubMed]
  15. Li, J.; Liang, E.; Huang, T.; Zhao, X.; Wang, T. Insights into atrazine degradation by thermally activated persulfate: Evidence from dual C-H isotope analysis and DFT simulations. Chem. Eng. J. 2023, 454, 140207. [Google Scholar] [CrossRef]
  16. Liang, E.; Huang, T.; Li, J.; Wang, T. Degradation pathways of atrazine by electrochemical oxidation at different current densities: Identifications from compound-specific isotope analysis and DFT calculation. Environ. Pollut. 2023, 332, 121987. [Google Scholar] [CrossRef]
  17. Elsner, M.; Imfeld, G. Compound-specific isotope analysis (CSIA) of micropollutants in the environment—Current developments and future challenges. Curr. Opin. Biotechnol. 2016, 41, 60–72. [Google Scholar] [CrossRef]
  18. Ouyang, W.-Y.; Kümmel, S.; Adrian, L.; Zhu, Y.-G.; Richnow, H.H. Carbon and hydrogen stable isotope fractionation of sulfamethoxazole during anaerobic transformation catalyzed by Desulfovibrio vulgaris Hildenborough. Chemosphere 2023, 311, 136923. [Google Scholar] [CrossRef]
  19. Alvarez-Zaldívar, P.; Payraudeau, S.; Meite, F.; Masbou, J.; Imfeld, G. Pesticide degradation and export losses at the catchment scale: Insights from compound-specific isotope analysis (CSIA). Water Res. 2018, 139, 198–207. [Google Scholar] [CrossRef]
  20. Arar, M.; Bakkour, R.; Elsner, M.; Bernstein, A. Microbial hydrolysis of atrazine in contaminated groundwater. Chemosphere 2023, 322, 138226. [Google Scholar] [CrossRef]
  21. Nijenhuis, I.; Andert, J.; Beck, K.; Kästner, M.; Diekert, G.; Richnow, H.H. Stable isotope fractionation of tetrachloroethene during reductive dechlorination by Sulfurospirillum multivorans and Desulfitobacterium sp. strain PCE-S and abiotic reactions with cyanocobalamin. Appl. Environ. Microbiol. 2005, 71, 3413–3419. [Google Scholar] [CrossRef]
  22. Lee, P.K.H.; Conrad, M.E.; Alvarez-Cohen, L. Stable carbon isotope fractionation of chloroethenes by dehalorespiring isolates. Environ. Sci. Technol. 2007, 41, 4277–4285. [Google Scholar] [CrossRef]
  23. Harding, K.C.; Lee, P.K.H.; Bill, M.; Buscheck, T.E.; Conrad, M.E.; Alvarez-Cohen, L. Effects of Varying Growth Conditions on Stable Carbon Isotope Fractionation of Trichloroethene (TCE) by tceA-containing Dehalococcoides mccartyi strains. Environ. Sci. Technol. 2013, 47, 12342–12350. [Google Scholar] [CrossRef] [PubMed]
  24. Hermon, L.; Denonfoux, J.; Hellal, J.; Joulian, C.; Ferreira, S.; Vuilleumier, S.; Imfeld, G. Dichloromethane biodegradation in multi-contaminated groundwater: Insights from biomolecular and compound-specific isotope analyses. Water Res. 2018, 142, 217–226. [Google Scholar] [CrossRef] [PubMed]
  25. Lihl, C.; Heckel, B.; Grzybkowska, A.; Dybala-Defratyka, A.; Ponsin, V.; Torrentó, C.; Hunkeler, D.; Elsner, M. Compound-specific chlorine isotope fractionation in biodegradation of atrazine. Environ. Ence Process. Impacts 2020, 2, 792–801. [Google Scholar] [CrossRef] [PubMed]
  26. Ehrl, B.N.; Gharasoo, M.; Elsner, M. Isotope Fractionation Pinpoints Membrane Permeability as a Barrier to Atrazine Biodegradation in Gram-negative Polaromonas sp. Nea-C. Environ. Sci. Technol. 2018, 52, 4137–4144. [Google Scholar] [CrossRef]
  27. Chen, S.; Yang, P.; Rohit kumar, J.; Liu, Y.; Ma, L. Inconsistent carbon and nitrogen isotope fractionation in the biotransformation of atrazine by Ensifer sp. CX-T and Sinorihizobium sp. K. Int. Biodeterior. Biodegrad. 2017, 125, 170–176. [Google Scholar] [CrossRef]
  28. Chen, S.; Zhang, K.; Jha, R.K.; Ma, L. Impact of atrazine concentration on bioavailability and apparent isotope fractionation in Gram-negative Rhizobium sp. CX-Z. Environ. Pollut. 2020, 257, 113614. [Google Scholar] [CrossRef]
  29. Chen, S.; Zhang, K.; Jha, R.K.; Chen, C.; Yu, H.; Liu, Y.; Ma, L. Isotope fractionation in atrazine degradation reveals rate-limiting, energy-dependent transport across the cell membrane of gram-negative rhizobium sp. CX-Z. Environ. Pollut. 2019, 248, 857–864. [Google Scholar] [CrossRef]
  30. Kundu, K.; Marozava, S.; Ehrl, B.; Merl-Pham, J.; Griebler, C.; Elsner, M. Defining lower limits of biodegradation: Atrazine degradation regulated by mass transfer and maintenance demand in Arthrobacter aurescens TC1. ISME J. 2019, 13, 2236–2251. [Google Scholar] [CrossRef]
  31. Chen, S.; Ma, L.; Yao, G.; Wang, Y. Efficient atrazine removal in bioaugmentation constructed wetland: Insight from stable isotope fractionation analysis. Int. Biodeterior. Biodegrad. 2023, 185, 105691. [Google Scholar] [CrossRef]
  32. Cantu, R.; Evans, O.; Kawahara, F.K.; Shoemaker, J.A.; Dufour, A.P. An HPLC method with UV detection, pH control, and reductive ascorbic acid for cyanuric acid analysis in water. Anal. Chem. 2000, 72, 5820–5828. [Google Scholar] [CrossRef] [PubMed]
  33. Meyer, A.H.; Penning, H.; Lowag, H.; Elsner, M. Precise and Accurate Compound Specific Carbon and Nitrogen Isotope Analysis of Atrazine: Critical Role of Combustion Oven Conditions. Environ. Sci. Technol. 2008, 42, 7757–7763. [Google Scholar] [CrossRef] [PubMed]
  34. Coplen, T.B. Guidelines and recommended terms for expression of stable-isotope-ratio and gas-ratio measurement results. Rapid Commun. Mass Spectrom. 2011, 25, 2538–2560. [Google Scholar] [CrossRef] [PubMed]
  35. Elsner, M.; Zwank, L.; Hunkeler, D.; Schwarzenbach, R.P. A new concept linking observable stable isotope fractionation to transformation pathways of organic pollutants. Environ. Sci. Technol. 2005, 39, 6896–6916. [Google Scholar] [CrossRef]
  36. Runes, H.B.; Jenkins, J.J.; Moore, J.A.; Bottomley, P.J.; Wilson, B.D. Treatment of atrazine in nursery irrigation runoff by a constructed wetland. Water Res. 2003, 37, 539–550. [Google Scholar] [CrossRef]
  37. Hunkeler, D.; Meckenstock, R.U.; Lollar, B.S.; Schmidt, T.C.; Wilson, J.T. A Guide for Assessing Biodegradation and Source Identification of Organic Ground Water Contaminants Using Compound Specific Isotope Analysis (CSIA); U.S. Environmental Protection Agency: Washington, DC, USA, 2009; EPA/600/R-08/148.
  38. Braeckevelt, M.; Fischer, A.; KäStner, M. Field applicability of Compound-Specific Isotope Analysis (CSIA) for characterization and quantification of in situ contaminant degradation in aquifers. Appl. Microbiol. Biotechnol. 2012, 94, 1401–1421. [Google Scholar] [CrossRef]
  39. Zhao, X.; Bai, S.; Li, C.; Yang, J.; Ma, F. Bioaugmentation of atrazine removal in constructed wetland: Performance, microbial dynamics, and environmental impacts. Bioresour. Technol. 2019, 289, 121618. [Google Scholar] [CrossRef]
  40. Vymazal, J.; Bfezinova, T. The use of constructed wetlands for removal of pesticides from agricultural runoff and drainage: A review. Environ. Int. 2015, 75, 11–20. [Google Scholar] [CrossRef]
  41. Thullner, M.; Fischer, A.; Richnow, H.-H.; Wick, L.Y. Influence of mass transfer on stable isotope fractionation. Appl. Microbiol. Biotechnol. 2013, 97, 441–452. [Google Scholar] [CrossRef]
  42. Schuerner, H.K.V.; Seffernick, J.L.; Grzybkowska, A.; Dybala-Defratyka, A.; Wackett, L.P.; Elsner, M. Characteristic Isotope Fractionation Patterns in s-Triazine Degradation Have Their Origin in Multiple Protonation Options in the s-Triazine Hydrolase TrzN. Environ. Sci. Technol. 2015, 49, 3490–3498. [Google Scholar] [CrossRef] [PubMed]
  43. Grzybkowska, A.; Kaminski, R.; Dybala-Defratyka, A. Theoretical predictions of isotope effects versus their experimental values for an example of uncatalyzed hydrolysis of atrazine. Phys. Chem. Chem. Phys. 2014, 16, 15164–15172. [Google Scholar] [CrossRef] [PubMed]
  44. Kobayashi, K.; Makabe, A.; Yano, M.; Oshiki, M.; Kindaichi, T.; Casciotti, K.L.; Okabe, S. Dual nitrogen and oxygen isotope fractionation during anaerobic ammonium oxidation by anammox bacteria. Isme J. 2019, 13, 2426–2436. [Google Scholar] [CrossRef] [PubMed]
  45. Casciotti, K.L. Inverse kinetic isotope fractionation during bacterial nitrite oxidation. Geochim. Et Cosmochim. Acta 2009, 73, 2061–2076. [Google Scholar] [CrossRef]
  46. Peat, T.S.; Newman, J.; Balotra, S.; Lucent, D.; Warden, A.C.; Scott, C. The structure of the hexameric atrazine chlorohydrolase AtzA. Acta Crystallogr. Sect. D-Struct. Biol. 2015, 71, 710–720. [Google Scholar] [CrossRef]
  47. Melsbach, A.; Torrento, C.; Ponsin, V.; Bolotin, J.; Lachat, L.; Prasuhn, V.; Hofstetter, T.B.; Hunkeler, D.; Elsner, M. Dual-Element Isotope Analysis of Desphenylchloridazon to Investigate Its Environmental Fate in a Systematic Field Study: A Long-Term Lysimeter Experiment. Environ. Sci. Technol. 2020, 54, 3929–3939. [Google Scholar] [CrossRef]
  48. Palau, J.; Yu, R.; Hatijah Mortan, S.; Shouakar-Stash, O.; Rosell, M.; Freedman, D.L.; Sbarbati, C.; Fiorenza, S.; Aravena, R.; Marco-Urrea, E.; et al. Distinct Dual C-Cl Isotope Fractionation Patterns during Anaerobic Biodegradation of 1,2-Dichloroethane: Potential To Characterize Microbial Degradation in the Field. Env. Sci Technol 2017, 51, 2685–2694. [Google Scholar] [CrossRef]
  49. Fischer, A.; Gehre, M.; Breitfeld, J.; Richnow, H.H.; Vogt, C. Carbon and hydrogen isotope fractionation of benzene during biodegradation under sulfate-reducing conditions: A laboratory to field site approach. Rapid Commun. Mass Spectrom. 2009, 23, 2439–2447. [Google Scholar] [CrossRef]
  50. Haderlein, S.B.; Schmidt, T.C.; Elsner, M.; Zwank, L.; Berg, M.; Schwarzenbach, R.P. New Evaluation Scheme for Two-Dimensional Isotope Analysis to Decipher Biodegradation Processes: Application to Groundwater Contamination by MTBE. Environ. Ence Technol. 2005, 39, 8543–8544. [Google Scholar] [CrossRef]
  51. Chen, S.; Ma, L.; Wang, Y. Kinetic isotope effects of C and N indicate different transformation mechanisms between atzA- and trzN-harboring strains in dechlorination of atrazine. Biodegradation 2022, 33, 207–221. [Google Scholar] [CrossRef]
  52. Meyer, A.H.; Dybala-Defratyka, A.; Alaimo, P.J.; Geronimo, I.; Sanchez, A.D.; Cramer, C.J.; Elsner, M. Cytochrome P450-catalyzed dealkylation of atrazine by Rhodococcus sp. strain N186/21 involves hydrogen atom transfer rather than single electron transfer. Dalton Trans. 2014, 43, 12175–12186. [Google Scholar] [CrossRef] [PubMed]
  53. Dybala-Defratyka, A.; Szatkowski, L.; Kaminski, R.; Wujec, M.; Siwek, A.; Paneth, P. Kinetic Isotope Effects on Dehalogenations at an Aromatic Carbon. Environ. Sci. Technol. 2008, 42, 7744–7750. [Google Scholar] [CrossRef] [PubMed]
  54. Manna, R.N.; Grzybkowska, A.; Gelman, F.; Dybala-Defratyka, A. Carbon-bromine bond cleavage—A perspective from bromine and carbon kinetic isotope effects on model debromination reactions. Chemosphere 2018, 193, 17–23. [Google Scholar] [CrossRef] [PubMed]
  55. He, Y.; Li, L. Density functional theory calculations of nitrogen and oxygen equilibrium isotope fractionations in NO 3 NO 2 –H2O aqueous system reveal inverse kinetic isotope effects during nitrite oxidation. Appl. Geochem. 2022, 139, 105265. [Google Scholar] [CrossRef]
  56. Hofstetter, T.B.; Berg, M. Assessing transformation processes of organic contaminants by compound-specific stable isotope analysis. Trac-Trends Anal. Chem. 2011, 30, 618–627. [Google Scholar] [CrossRef]
Figure 1. Changes of atrazine and its metabolites of hydroxyatrazine and cyanuric acid, as well as the compound-specific isotope signatures in different operational phases.
Processes 11 03252 g001
Figure 2. Stable carbon and nitrogen isotope fractionation in different operational phases. The left panel illustrates carbon and nitrogen isotope changes accompanying the atrazine decay, and the middle panel and right panel show the corresponding enrichment factors and dual-isotope plots.
Processes 11 03252 g002
Figure 3. Stable carbon and nitrogen isotope fractionation in cultivation of pore water. (a) Concentration changes of atrazine the metabolites. (b) Carbon and nitrogen isotope signatures change along with atrazine decay. (c) Linear fitting of carbon and nitrogen isotope fractionation according to Rayleigh equation. (d) Linear fitting of C-N dual-isotope plot. Error bars represent the standard deviation of triple measurements for one sampling event, filling areas shown at the 95% confidence interval.
Processes 11 03252 g003
Figure 4. Carbon isotope signature change in the 240-days-long experimental period and the CSIA predicted outflow atrazine concentration (a), as well as the CSIA-based biodegradation extent (BE) changes throughout the whole experiment (b).
Processes 11 03252 g004
Table 1. The operation conditions of the hybrid wetland system at different phases. * Indicates the start of microbial inoculation. The inflow concentration of atrazine was summed according to the monitoring results of each sampling event.
PhasesDatesDuration (d)HRT (d)Inflow (L/d)Inflow Atrazine Range (mg/L)Inflow Atrazine Average (mg/L)
1st March to 20th April516644.1 to 9.36.3 ± 1.4
Ⅱ *21st April to 7th June466644.9 to 15.69.9 ± 3.9
8th June to 19th July4266415.6 to 19.317.4 ± 1.2
20th July to 20th August3266428.4 to 31.930.4 ± 1.1
21st August to 29th September4049629.1 to 32.030.6 ± 0.8
30th September to 21st October29219228.8 to 32.830.5 ± 1.2
Table 2. The atrazine concentration changes of outflow (Atz-outflow) and stable carbon isotope signatures changes (δ13C) in different operational phases and the corresponding concentration-based removal efficiency (RE) and CSIA-based biodegradation extent of atrazine (BE).
PhaseAtz-Outflow
Aver.
(mg/L)
Atz-Outflow Range
(mg/L)
RE
Aver.
(%)
RE
Range
(%)
δ13C-Aver.
(‰)
δ13C-Range
(‰)
BE-CSIA
Aver. (%)
(ε = −4.6‰)
BE-CSIA
Range
(%)
4.8 ± 1.12.9–7.026.9 ± 6.914.5–37.6−28.8 ± 0.7 −30.0–−28.032.1 ± 10.511.6–43.8
3.5 ± 0.92.0–4.660.9 ± 8.745.2–75.5−24.8 ± 2.6−27.6–−20.068.7 ± 15.144.5–90.6
1.5 ± 0.40.9–2.690.6 ± 4.176.9–95.4−20.1 ± 1.1−21.6–−18.890.1 ± 2.686.5–92.8
4.2 ± 0.62.8–4.986.7 ± 2.084.4–90.8−21.5 ± 1.1−22.7–−19.586.5 ± 2.982.8–91.5
8.8 ± 1.94.9–11.372.0 ± 6.663.5–84.2−23.8 ± 0.9−25.0–−22.077.5 ± 4.771.4–85.3
13.0 ± 0.912.0–14.358.4 ± 5.550.4–70.6−25.7 ± 0.7−26.3–−24.866.2 ± 5.061.7–72.2
Table 3. Enrichment factors (ε) and apparent kinetic isotope effects (AKIEs) of carbon and nitrogen isotopes, as well as the slopes of C-N dual-isotope plot monitored in different operational phases and batch incubation of pore water from the constructed wetland. Batch represents the data observed in the cultivation of pore water taken from the wetland.
Phases ε (C)-‰ε (N)-‰AKIE-CAKIE-Nλ = δ15N vs. δ13C
−4.3 ± 0.61.8 ± 0.21.036 ± 0.0050.991 ± 0.001−0.37 ± 0.07
−3.7 ± 0.62.2 ± 0.31.031 ± 0.0050.989 ± 0.001−0.48 ± 0.05
−3.2 ± 0.61.0 ± 0.31.026 ± 0.0050.995 ± 0.001 −0.34 ± 0.02
Batch−4.6 ± 0.51.7 ± 0.11.038 ± 0.0040.992 ± 0.000−0.34 ± 0.05
Disclaimer/Publisher’s Note: The statements, opinions and data contained in all publications are solely those of the individual author(s) and contributor(s) and not of MDPI and/or the editor(s). MDPI and/or the editor(s) disclaim responsibility for any injury to people or property resulting from any ideas, methods, instructions or products referred to in the content.

