Article

Developing a Quality Control System in a Continuous Hot Air Heating Process in Surimi Seafood Processing Using Image Analysis and Artificial Intelligence

1
Department of Food Science and Biotechnology, College of Agriculture and Life Sciences, Kangwon National University, 1 Kangwondaehak-gil, Chuncheon 24341, Republic of Korea
2
Elder-Friendly Research Center, Agriculture and Life Science Research Institute, Kangwon National University, 1 Kangwondaehak-gil, Chuncheon 24341, Republic of Korea
3
Swiss School of Management—Seoul, #202 Wellbeing Center, Worldcup-ro 37, Mapo-gu, Seoul 04056, Republic of Korea
*
Author to whom correspondence should be addressed.
Processes 2023, 11(11), 3187; https://doi.org/10.3390/pr11113187
Submission received: 9 October 2023 / Revised: 6 November 2023 / Accepted: 6 November 2023 / Published: 8 November 2023

Abstract

:
In this study, the feasibility of classifying surimi gels during a continuous heating process using an artificial intelligence (AI) algorithm on labeled images was investigated. Surimi paste with varying corn starch concentrations (0%, 5%, and 10%) and moisture content levels (78% and 80%) from Alaska pollock were analyzed for the subtle physical changes. Rheological characterization and K-means clustering analysis performed on entire images captured from different batches of heated surimi gel indicated a four-stage transformation from its initial state to gel formation with the temperature ranges spanning 25 to <40 °C, 40 to <50 °C, 50 to <55 °C, and 55 to 80 °C. Subsequently, a Convolutional Neural Network (CNN) model based on the temperature classification was designed to interpret and classify these images. A total of 1000 to 1200 images were used for the training, testing, and validation purposes in the ratio 7:1:2. The CNN architecture incorporated essential elements including an input layer, convolutional layers, rectified linear unit (ReLU) activation functions, normalization layers, and max-pooling layers. The CNN model achieved validation accuracy >92.67% for individual mixture composition, 94.53% for classifying surimi samples based on moisture content, and gelation level, and 89.73% for complex classifications involving moisture content, starch concentration, and gelation stages. Additionally, it exhibited high average precision, recall, and F1 scores (>0.92), indicating precision and sensitivity in identifying relevant instances. The success of CNN in non-destructively classifying surimi gels with different moisture and starch contents is demonstrated in this work.

1. Introduction

Surimi-based seafood products including kamaboko, eomuk, imitation crab meat, and fish balls have witnessed substantial growth during the 20th century, largely due to the development and commercial application of cryoprotectants in the production of frozen surimi [1,2]. Traditionally, surimi seafood was predominantly available in local restaurants near coastal areas, with most products being manually crafted. However, as the 20th century progressed, the production of surimi seafood experienced a significant shift towards mass industrial manufacturing [3,4]. Despite the variety of products available in the market, the core processes underlying surimi seafood production remain consistent. These processes involve (1) extracting salt-soluble myofibrillar proteins (i.e., proteins which play a crucial role in determining the texture, gel characteristics, and overall quality of surimi sea food products) through a mixture of salt and water, (2) shaping or molding surimi paste, (3) heating the surimi paste to create surimi gels endowed with unique textural properties, and (4) packaging and employing post-heat treatments to regulate product shelf life [5,6,7].
For the purpose of mass production, the majority of surimi seafood products are manufactured using continuous processes [3,8]. Among these, the heating process that transforms surimi in paste form into gel form plays a vital part in giving surimi seafood products their distinctive quality characteristic of elasticity [1,5,6]. The continuous heating process is carried out through various methods, typically involving the use of hot air or steam on paste-state surimi extruded onto a conveyor belt or drum moving at a consistent speed [9,10]. Sustaining steady-state heat transfer conditions is imperative in this continuous heating process, ensuring precise attainment of the desired temperature during the residence time in the heating process. Careful monitoring of surimi gelation based on the temperature of the heating medium and the flow rate of moving paste-state surimi are necessary to sustain this steady-state condition. Maintaining a steady flow rate of surimi paste supplied by pumps and the conveyor belt’s speed is especially important. If this stability is lost, it becomes more difficult to verify that the product has reached the desired temperature via heat transfer, which might result in product shape changes. Furthermore, variations in blend ratios or contaminants during input might make verification after the heating process difficult in continuous operations where gelation occurs in open areas, which could lead to the classification of all products as defective.
In continuous processes, various temperature sensors and Near-Infrared (NIR) sensors are utilized for quality management during production. NIR sensors evaluate the interaction between near-infrared light and the food item to determine physical qualities like temperature and humidity [11,12]. For instance, the work by He et al. [13] described a method for creating a smart microwave oven for monitoring the process of defrosting and reheating food using an infrared array sensor and humidity sensor paired together. Alongside techniques that non-destructively measure these physical and chemical attributes, imaging during continuous processes is harnessed to detect impurities and shape changes, contributing to quality control [14,15]. Imaging provides a non-contact and non-destructive means of acquiring data, making it suitable for integration into quality management alongside other physical measurement devices. Particularly, image-based quality management holds an advantage in continuous processes, allowing real-time detection and response to errors in blend ratios that are challenging to identify through sensors, defects due to shape alterations, and defects arising from foreign particle inclusion.
The process control and quality management of food processing using various sensors are employed in the production of numerous processed foods [16,17,18]. To enhance the probability of detecting quality disparities in packaged food items, Matindoust et al. [19] employed an array of radio-frequency identification technologies, encompassing barcode systems, smart cards, image analysis, and gas sensors. Notably, image analysis has been extensively utilized across various fields to pinpoint product imperfections, supported by documented instances of successful applications and fruitful research outcomes [20,21,22]. In a study conducted by Mendoza et al. [21], a computer vision system was deployed to assess the quality defects in fruits and vegetables. This was achieved by comparing the color spectrum captured in the images with a predefined color threshold for the respective produce. Similar to this, pork meat quality was evaluated using image processing by analyzing the lightness of the meat product [23]. Recent improvements in artificial intelligence algorithms, in particular, have greatly improved the ability to discriminate through image analysis, producing impressively high accuracy. Numerous artificial intelligence algorithms have been used in studies to identify defects in a range of foods and natural materials [24,25]. Moses et al. [25] applied various deep-learning methods based on convolutional neural network (CNN) algorithms which include EfficientNet-B0, ResNet-50, InceptionV3, MobileNetV2, and MobileNetV3 to evaluate the surface quality of pre-processed rice grain. In their study, a significantly high accuracy of 98.32% was reported for detection of defective rice grains.
In the instance of surimi seafood products, there have been studies and reports on applying statistical quality management by measuring attributes such as texture and color of the final product for quality control [26,27]. However, systematic research for quality management within continuous production processes has not been reported. Particularly, research on discerning defects due to deviations in blend ratios of input materials used in continuous processes remains unexplored not only in surimi seafood products but also across other processed food industries.
Thus, this study aims to construct an image analysis and artificial intelligence system to identify errors in blend ratios that may occur during continuous heating processes of mass-produced surimi seafood. To achieve this, a laboratory-scale model process of the continuous heating process for surimi seafood is established, integrating image analysis and temperature sensors. In a continuously running process, the placement of imaging equipment should be strategic, allowing for effective detection of changes in quality attributes. During continuous heating processes, changes in quality attributes encompass complex variations in shape, temperature, and color.
Therefore, the specific objectives of this study include the following: (1) develop a system to measure temperature changes and capture images during the continuous heating process of surimi paste, (2) discerning regions where significant changes can be observed through images during the continuous process, and (3) developing and validating artificial intelligence algorithms capable of identifying temperature and blend ratio changes through image analysis.

2. Materials and Methods

2.1. Surimi Paste Preparation

Frozen Alaska Pollock (Gadus chalcogrammus) surimi (FA grade, Premier Pacific Seafood, Inc., Seattle, WA, USA) with a moisture content of 75.23 ± 0.17% and a pH of 6.81 ± 0.01 was used. An amount of 500 g of the frozen surimi block were sliced into smaller pieces after being partially thawed in a refrigerator at 4 °C for 12 h to make the surimi paste. A universal food processor (Model UMC5, Stephan Machinery Corp., Hameln, Germany) was then used to chop these pieces at 1800 rpm for 1 min. A cooling medium (ice water) was pumped within the double-walled chopping bowl to keep the sample’s temperature below 4 °C while it was being chopped to prevent the protein degradation. At a speed of 2100 rpm for one minute, 2 wt% of sodium chloride was added and blended with the surimi paste [28]. Different quantities of corn starch (Ottogi Corporation Ltd., Anyang-si, Gyeonggi-do, Republic of Korea) and ice, as described in Table 1, were added to the resultant surimi paste solution to control the total sample moisture and starch content. The target surimi paste’s moisture content was set to 78 and 80%, and corn starch was added at quantities of 0, 5, and 10% based on preliminary tests that demonstrated adequate shape of surimi paste after molding through the pumping and the extrusion system. Maintaining the moisture between 78% and 80% is crucial because if moisture content is <78%, the paste is challenging to pump and extrude, and if it is >80%, it becomes too viscous and spreads on the conveyor belt, making it difficult to create well-formed extruded samples. To remove air pockets created during the chopping process, the mixture underwent further mixing at a speed of 2100 rpm for 5 min under 0.5 bar of pressure. This step ensures that the extruded paste is without voids or gaps that can influence the overall quality of the gel. Finally, the surimi paste was put into a container to which a pump hose was attached.

2.2. Surimi Paste Extrusion System

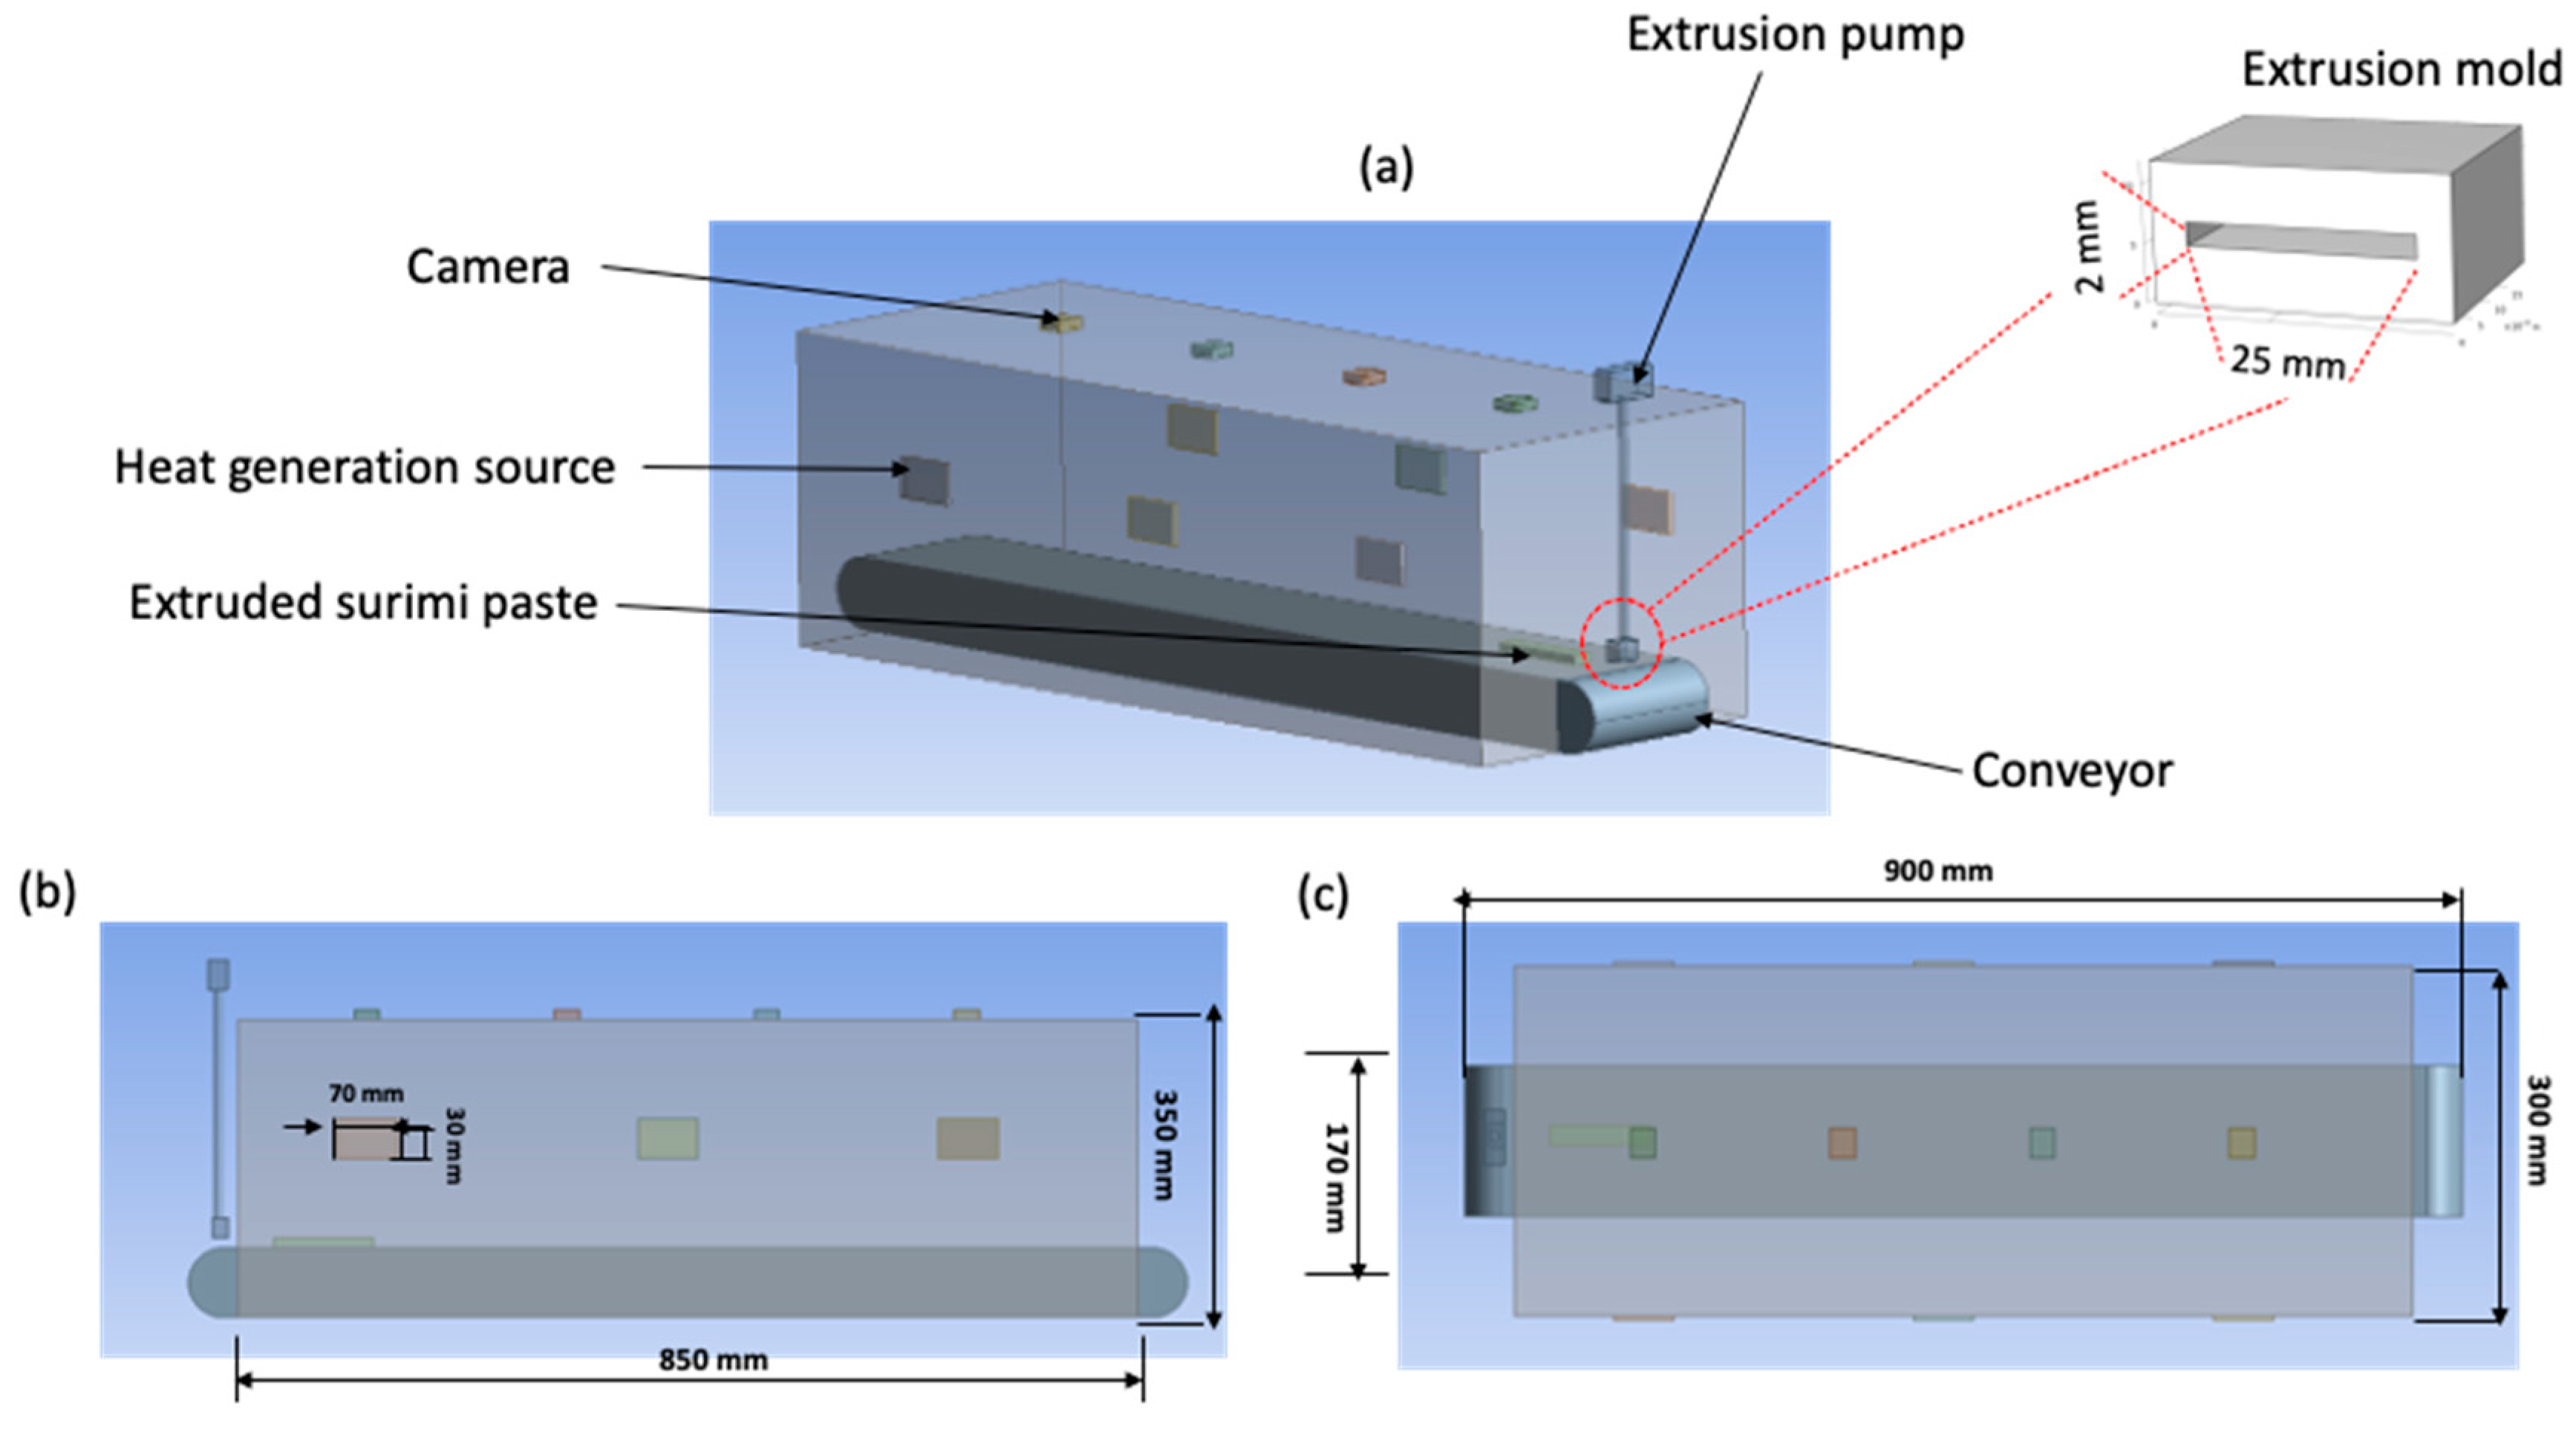
A Peristaltic Tubing Pump (LabV6-III, Innofluid Co., Ltd., Shanghai, China) was used as the primary method for the extrusion of surimi paste. This innovative pump employs a unique mechanism wherein a roller is strategically mounted on the pump header, allowing it to delicately squeeze the fluid contained within the tube. This method of operation ensures precise control over the paste extrusion process. To optimize the extrusion process, the system operates at a pump flow rate of approximately 10.55 mm/s. This flow rate is carefully selected to ensure efficient paste extrusion while maintaining the integrity of the surimi paste. However, the system’s versatility shines through when it is equipped with a specially designed 2 mm diameter paste extrusion mold, which is fabricated using a cutting-edge 3D printing technology (Creatable D2, Creatable Labs, Seoul, Republic of Korea) (Figure 1). When this mold is employed, it results in a noteworthy increase in surimi paste output, achieving a flow rate of approximately 13.25 mm/s. This enhancement in output showcases the adaptability and precision of the surimi paste extrusion system, allowing for adjustments based on specific production requirements.
To further streamline the process, the conveyor belt (Bastian Solutions Ltd., Carmel, IN, USA) integrated into the system operates at a speed of approximately 14 mm/s. This synchronized movement of the conveyor belt and paste extrusion serves a dual purpose. Firstly, it ensures that the paste is efficiently transported to its intended destination. Secondly, it complements the paste extrusion process itself, allowing for seamless integration of surimi paste output with the overall production line.

2.3. Continous Heating System for Surimi Paste

A specialized heating system was designed to cater to the precise temperature requirements of the surimi gelation (Figure 1). This system comprises an acrylic chamber measuring 850 mm in length, 350 mm in height, and 300 mm in width, with six heaters placed in key locations. The heaters were positioned at precise intervals along the chamber’s length—142.5 mm, 425 mm, and 700 mm from one end, all at a constant height of 150 mm in order to produce consistent heat dispersion throughout the chamber. The heaters (SureHeat Jet Air Heater, Joowon H&C Co., Ltd., Gangseo-gu, Seoul, Republic of Korea) were placed on both sides of the chamber.
Three essential components were included in the system for accurate temperature monitoring and control: a thermocouple Type-K with Glass Braid Insulation (Conex Technologies, New York, NY, USA); a liquid crystal display (LCD) (Shenzhen Jinweishi Photo-electric Technology Co., Ltd., Guangdong, China); and a high-temperature insulation pad (NT FIBERGLASS 3300, Texfire Textils Tecnics, S.L., Barberà del Vallès, Barcelona, Spain) that was wrapped around the heating chamber to prevent heat loss from inside to the surrounding area. Encasing the heating chamber minimizes fluctuation in temperature and maximizes the heating system’s energy efficiency by creating an efficient thermal barrier. Selecting a high-temperature insulating pad also guarantees that the heat produced by the heaters placed strategically stays inside the chamber, maintaining a steady and regulated atmosphere that is ideal for the surimi gelation process.
The LCD and thermocouple were seamlessly connected to an Arduino board UNO (Arduino.cc, Somerville, MA, USA), forming the central components of temperature control and measurement system. The Arduino board, linked to both the LCD and thermocouple, operates in coordination with a Raspberry Pi 3 unit (Model B+, Raspberry Pi, Cambridge, UK). The Arduino system was used to control the thermocouple device which measures the temperature of the sample and the chamber and to display the real-time value on the LCD, while the Raspberry Pi plays a vital role in collecting real-time temperature data from the thermocouple, and then transmits the data to the Raspberry Pi server. This synchronized operation ensures that the real-time temperature data correspond accurately to the live imagery of the surimi paste throughout the entire process.
In the innovative heating system, a conveyor belt serves as a pivotal component, facilitating the continuous movement and heating of the surimi paste in real time. This conveyor belt (Bastian Solutions Ltd., Carmel, IN, USA), measuring 900 × 170 × 50 mm, features a belt with width of 10 mm, making it ideally suited for this application. Precise control over the heating process is achieved through the careful regulation of the conveyor belt’s speed, which has been set to approximately 14 mm/s. This control is attained by fine-tuning the pulse width modulation (PWM) value of the gear motor integrated into the conveyor belt system. Furthermore, the operating direction of the conveyor belt has been aligned with the direction of surimi paste output, ensuring seamless and efficient processing of the paste as it progresses through the heating system.

2.4. Image Capture Protocol for Surimi Paste

The core of the camera control system is the Raspberry Pi Camera (model V2, RPI 8 MP Camera board, Cambridge, United Kingdom) which was installed at the top of the heating chamber, and a real-time image of surimi paste as it moves across the conveyor belt is captured. This camera is renowned for its robust performance characteristics [29]. The Raspberry Pi Camera device is equipped with 1 GB of RAM, a 64-bit quad-core, and a 1.4 GHz ARM Cortex-A53 MP4 CPU, ensuring rapid data processing capabilities. Notably, it features 40 GPIO pins, facilitating versatile interfacing, and supports 100 base Ethernet, alongside dual-band wireless LANs with 2.4 GHz and 5 GHz frequencies. It establishes a Wi-Fi connection for seamless data transmission and uploads acquired image data to the Firebase cloud for secure storage.
The setup for the Raspberry camera is shown in Figure 1. A specialized 15-pin Camera Serial Interface (CSI) (made specifically for camera modules) is used to connect the camera. The CSI bus can handle very high data speeds. Furthermore, the camera is compact, measuring 25 mm × 20 mm × 9 mm and weighing only 3 g, making it easy to affix to the top of the heating chamber. Notably, four cameras were strategically positioned at specific points along the chamber’s length: 100 mm, 300 mm, 500 mm, and 700 mm from one end. This arrangement ensures that images of the surimi paste are consistently captured throughout the heating chamber. To facilitate smooth image analysis, the cameras were set to enlarge the images, excluding the background surrounding the conveyor belt and focusing solely on the surimi on the conveyor belt. Additionally, all cameras were configured to automatically capture one image per second, with images devoid of surimi paste content being discarded during processing. Following this meticulous process, an image dataset of 1000 to 1200 images for each treatment condition were obtained. Subsequently, in a 7:1:2 ratio, the images were split up into training, testing, and validation sets. As a result, a minimum of 200 sample images were used as input images for the trained model’s validation.

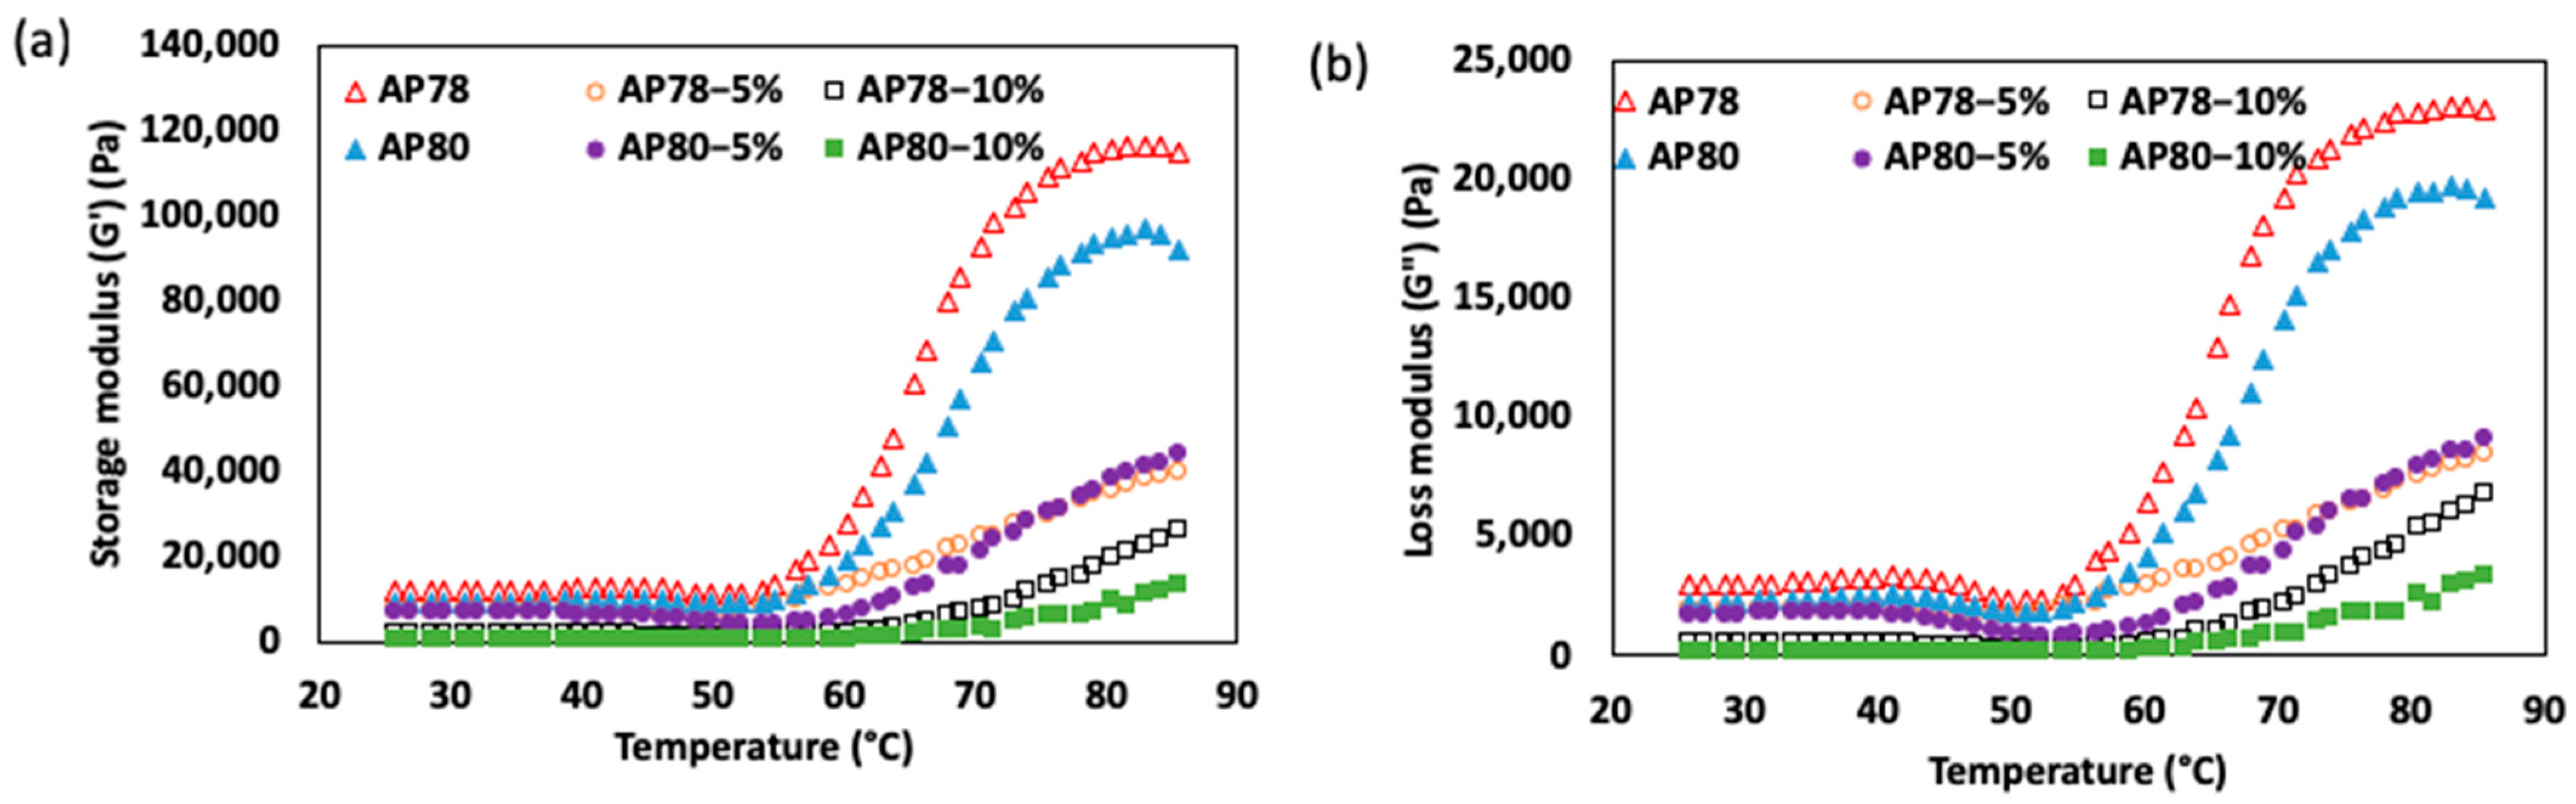
2.5. Rheological Measurement for Surimi Paste

A Discovery Hybrid Rheometer HR-3 (TA Instruments, New Castle, DE, USA) with a cone and plate geometry (cone-diameter 40 mm, cone angle 2°) at a 2.0 mm gap was used to study the rheological characteristics of surimi paste. To avoid dehydration, paraffin oil was placed around the sample between the cone and the plate geometry. According to Oyinloye and Yoon [28], temperature sweep analysis was carried out at a constant frequency of 0.1 Hz and an amplitude strain of 1%, which is within the linear viscoelastic region, to measure the changes in dynamic rheological parameters, including storage moduli (G′) and loss moduli (G″), during heating. A Peltier cooling system (ThermoCube 200–500, Solid State cooling systems, Wappingers Falls, NY, USA) was used to regulate the sample temperature. The samples were first allowed to acclimate for 5 min at 25 °C, after which the ramp heating at 2 °C/min was carried out until an endpoint of 85 °C.

2.6. AI Algorithm and Validation

2.6.1. K-Means Clustering

One of the most popular unsupervised techniques in the machine learning field is K-means clustering [30,31]. This method is based on vector quantization that takes the input data parameters (x1, x2, x3, …, xn) and partitions a set of n objects (S1, S2, S3, …, Sn) into non-overlapping k clusters where k is less than n [32]. Each observation is assigned to the closest mean value, also known as the cluster centroid or cluster center. Typically, Euclidean distance, or other similar distance metrics, are used to establish these clusters of similarity [30]. Each item is grouped based on its proximity to the nearest mean, and the coordinates of the mean are adjusted as the averages of the items within that cluster up to that point. During the heating of surimi paste, the paste undergoes gelation, resulting in continually changing physical properties [33]. Consequently, it is imperative that the images captured during the continuous heating process are assessed based on a uniform measure of similarity.
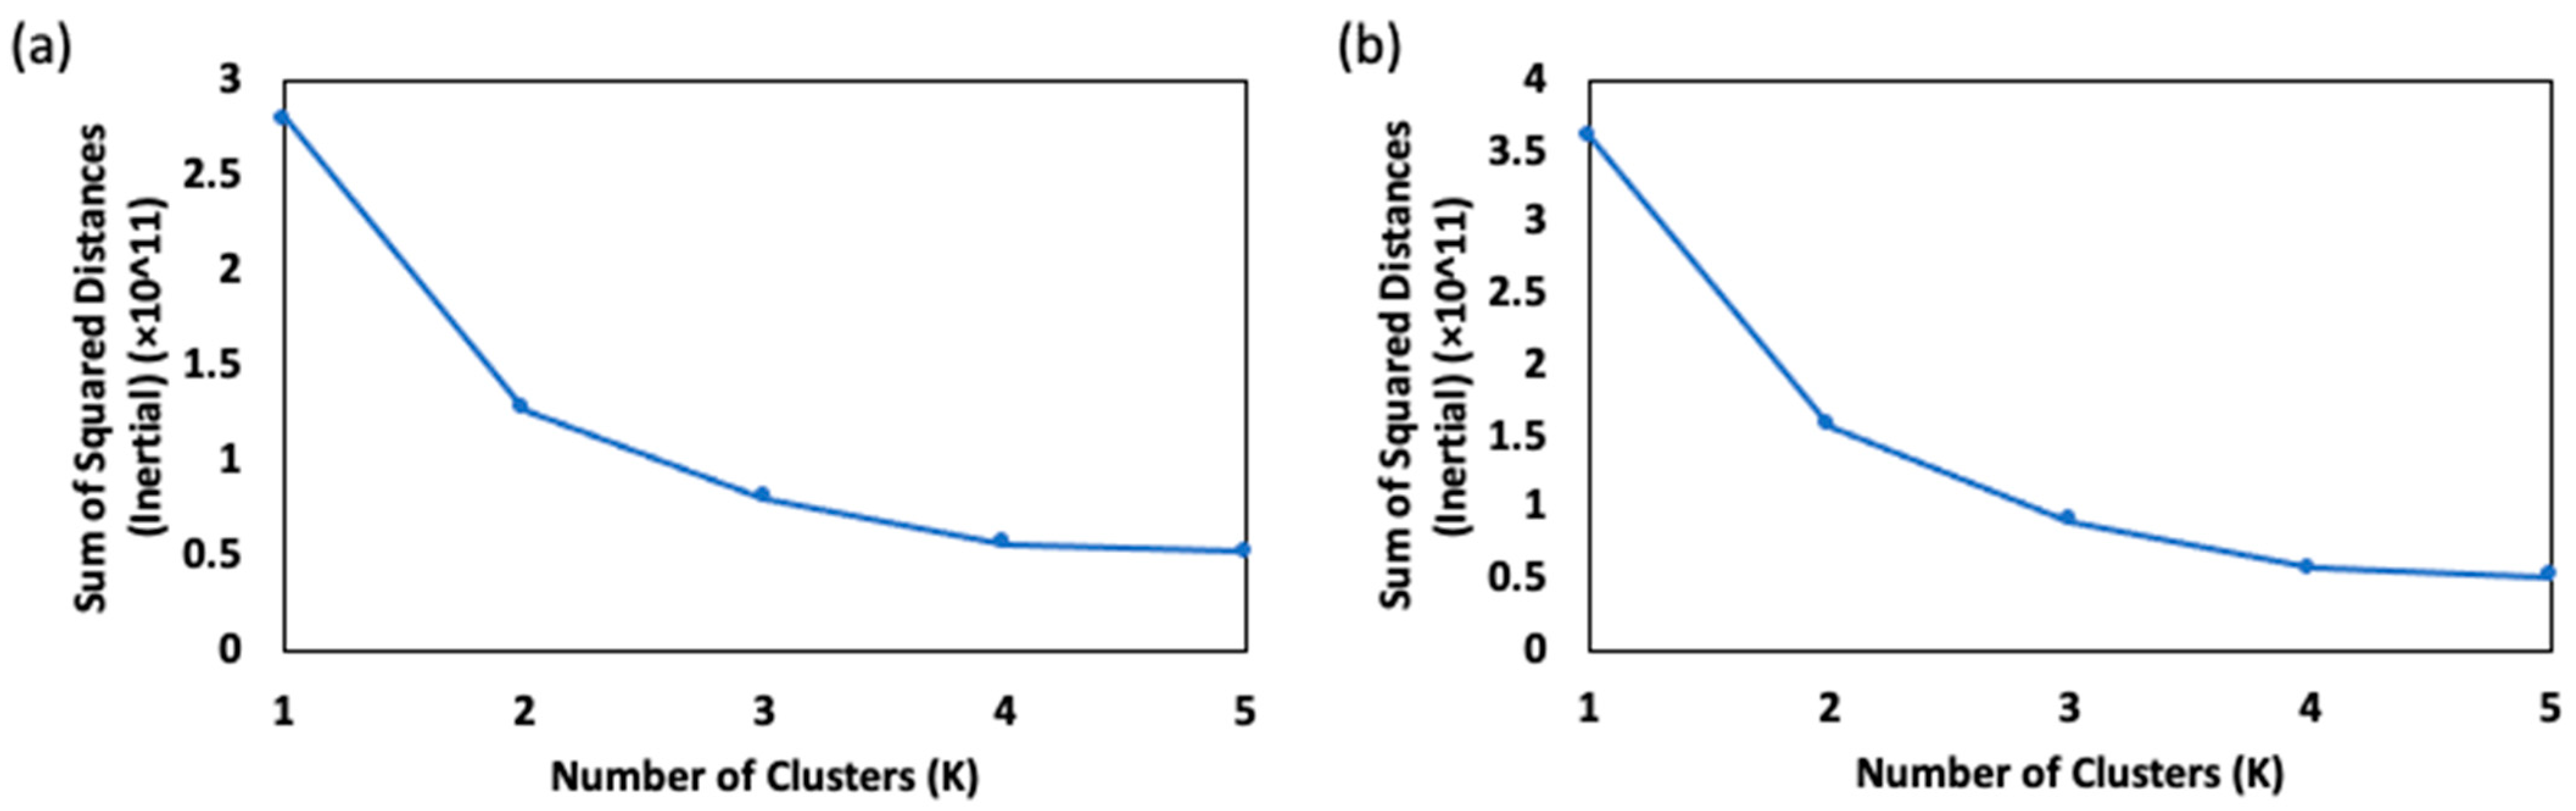
An essential step in any clustering approach is determining the optimal number of clusters to use for data grouping. A well-known approach for determining this ideal value of k (i.e., the number of clusters) is the elbow method [34,35]. In this approach, the mean of the squared distances between the cluster centers of the relevant clusters is referred to as “distortion”. Simultaneously, the sum of squared distances from individual samples to their nearest cluster center is termed “inertia”. A variety of k values (from 1 to n) are evaluated in order to determine the optimum number of clusters, and the distortions are computed for each k value in order to measure inertia and distortion. The optimal number of clusters is determined by selecting the k value at the “elbow” point, which is where inertia and distortion begin to exhibit a linear decrease [34].
The estimation of the optimal k value for surimi images was conducted using all images captured from a process batch. These images underwent preprocessing, and their corresponding sample temperatures at the time of capture were known. The elbow method, in conjunction with K-means clustering, was implemented using Matlab (MathWorks® Inc., Natick, MA, USA) on a desktop system equipped with a central processing unit (CPU) and graphics processing units (GPUs). The CPU used was the Intel Core i9-13900K (Intel Co., Santa Clara, CA, USA) with a clock speed of 3.0 GHz. It is equipped with 8 cores and 16 threads. Additionally, the system incorporated graphics processing units (GPUs)—NVIDIA GeForce RTX 3070 (NVIDIA Co., Santa Clara, CA, USA) with 24 GB of GDDR6X VRAM and 10496 CUDA cores. These GPUs provided essential parallel computing capabilities, accelerating image categorization, reducing computing time, and enhancing overall efficiency.
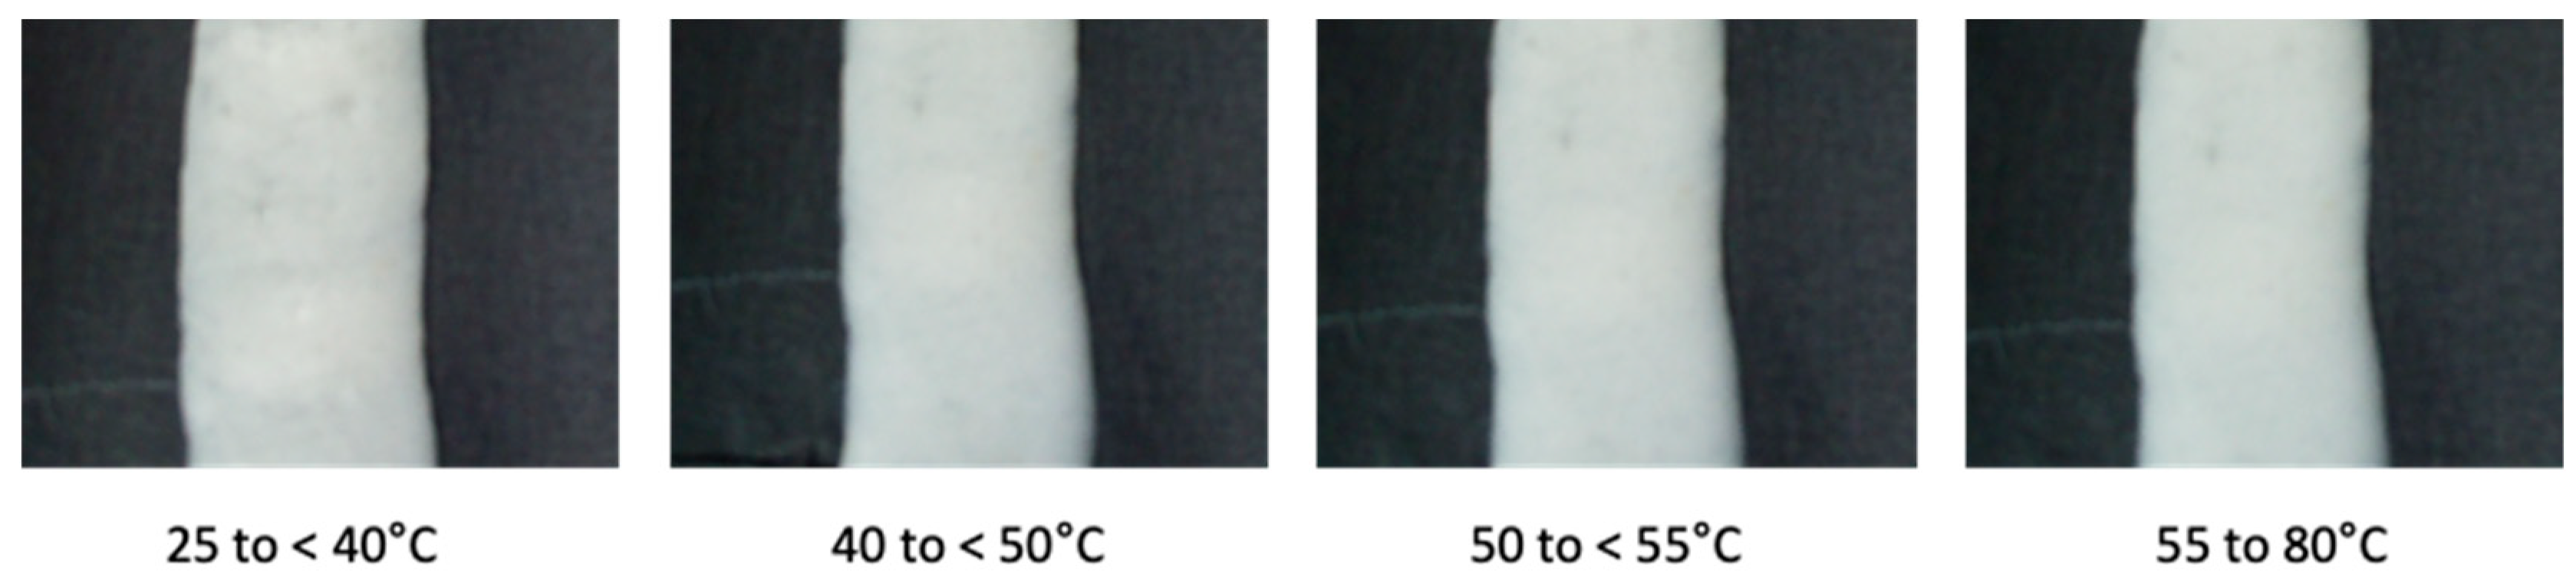
The optimal clustering number (k = 4) was chosen based on variations in the physical attributes of the surimi paste during the heating process and the number of clusters generated at a specific point (the elbow point). Further elaboration on this topic will be provided in subsequent sections of this study. As a result, for each batch of steamed surimi paste, four distinct groups were formed based on the sample temperature ranges (25 to <40 °C, 40 to <50 °C, 50 to <55 °C, and 55 to 80 °C) (Figure 2).

2.6.2. Convolutional Neural Network

The Convolutional Neural Network (CNN) stands at the forefront of cutting-edge techniques for general image recognition [36,
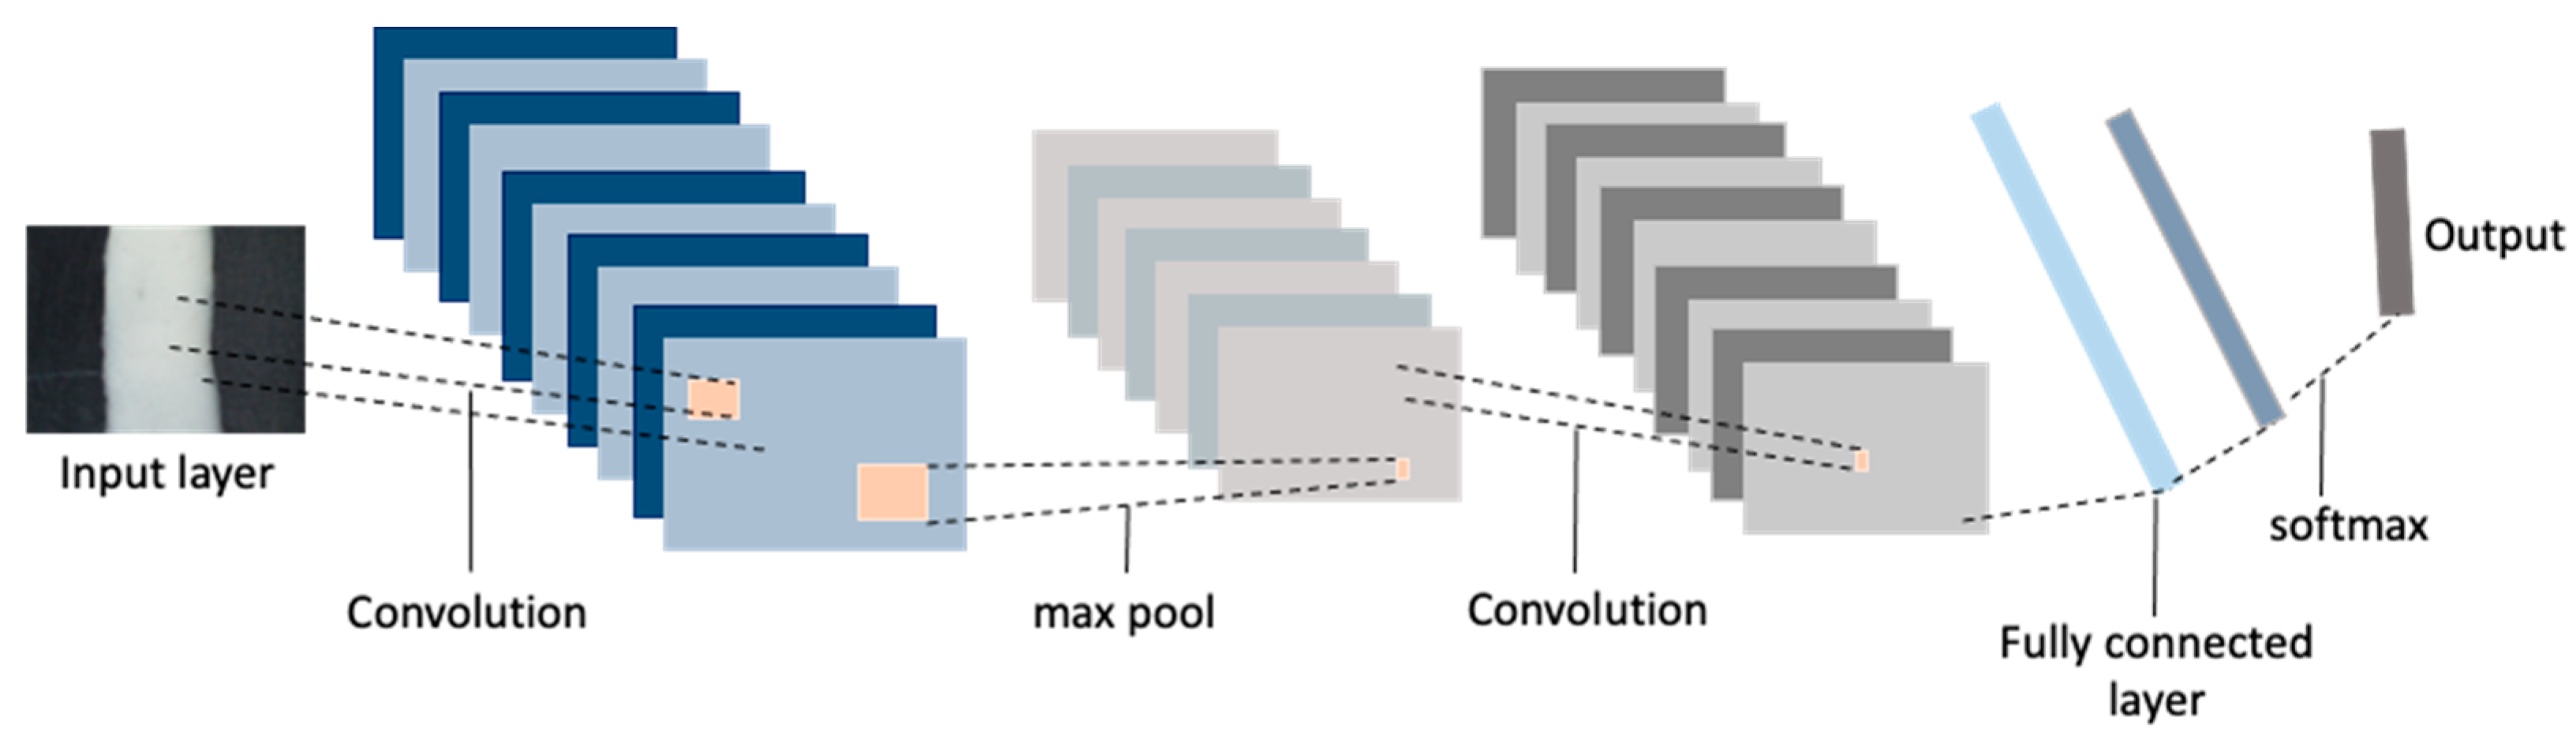
37]. It functions as a multilayer neural network, with neurons processing small patches from the output of the previous layer. CNNs excel at handling small shifts and rotations effectively. The architecture, as depicted in Figure 3, primarily comprises convolution and pooling layers. It is meticulously designed as a sequential arrangement of layers optimized for the processing and classification of surimi images that were captured on the moving conveyor. The input layer of the architecture was designed to handle RGB images with a 28 × 28 pixel resolution. The rectified linear unit (ReLU) activation, convolutional, normalization, and max-pooling layers are the next three sets of layers after the input layer. The first convolutional layer uses 16 kernels of size 3 × 3, maintaining spatial dimensions through ‘same’ padding. Then, batch normalization and ReLU activation are used to introduce non-linearity and facilitate effective training, respectively. A max-pooling layer with a 2 × 2 window and a stride of 2 follows, thus reducing the spatial dimensions in half. As the architecture becomes more complicated, this process keeps on. It then moves on to two further convolutional layers, each with two increasing kernel counts (32 and 64) and a constant 3 × 3 kernel size. ReLU activation and batch normalization remain constant. After each of these convolutional layers, spatial dimensions are cut in half using max-pooling layers. Three further convolutional layers are incorporated into the architecture, keeping the trend of rising kernel counts (128, 256), a 3 × 3 kernel size, and preserving spatial dimensions by ‘same’ padding. The architecture’s ability to extract hierarchical features from the input images is still improved by batch normalization and ReLU activation. A completely connected layer of neurons that corresponds to the number of classes in the classification challenge makes up the architecture’s apex. Class probabilities are accurately represented in the output thanks to a softmax activation layer.
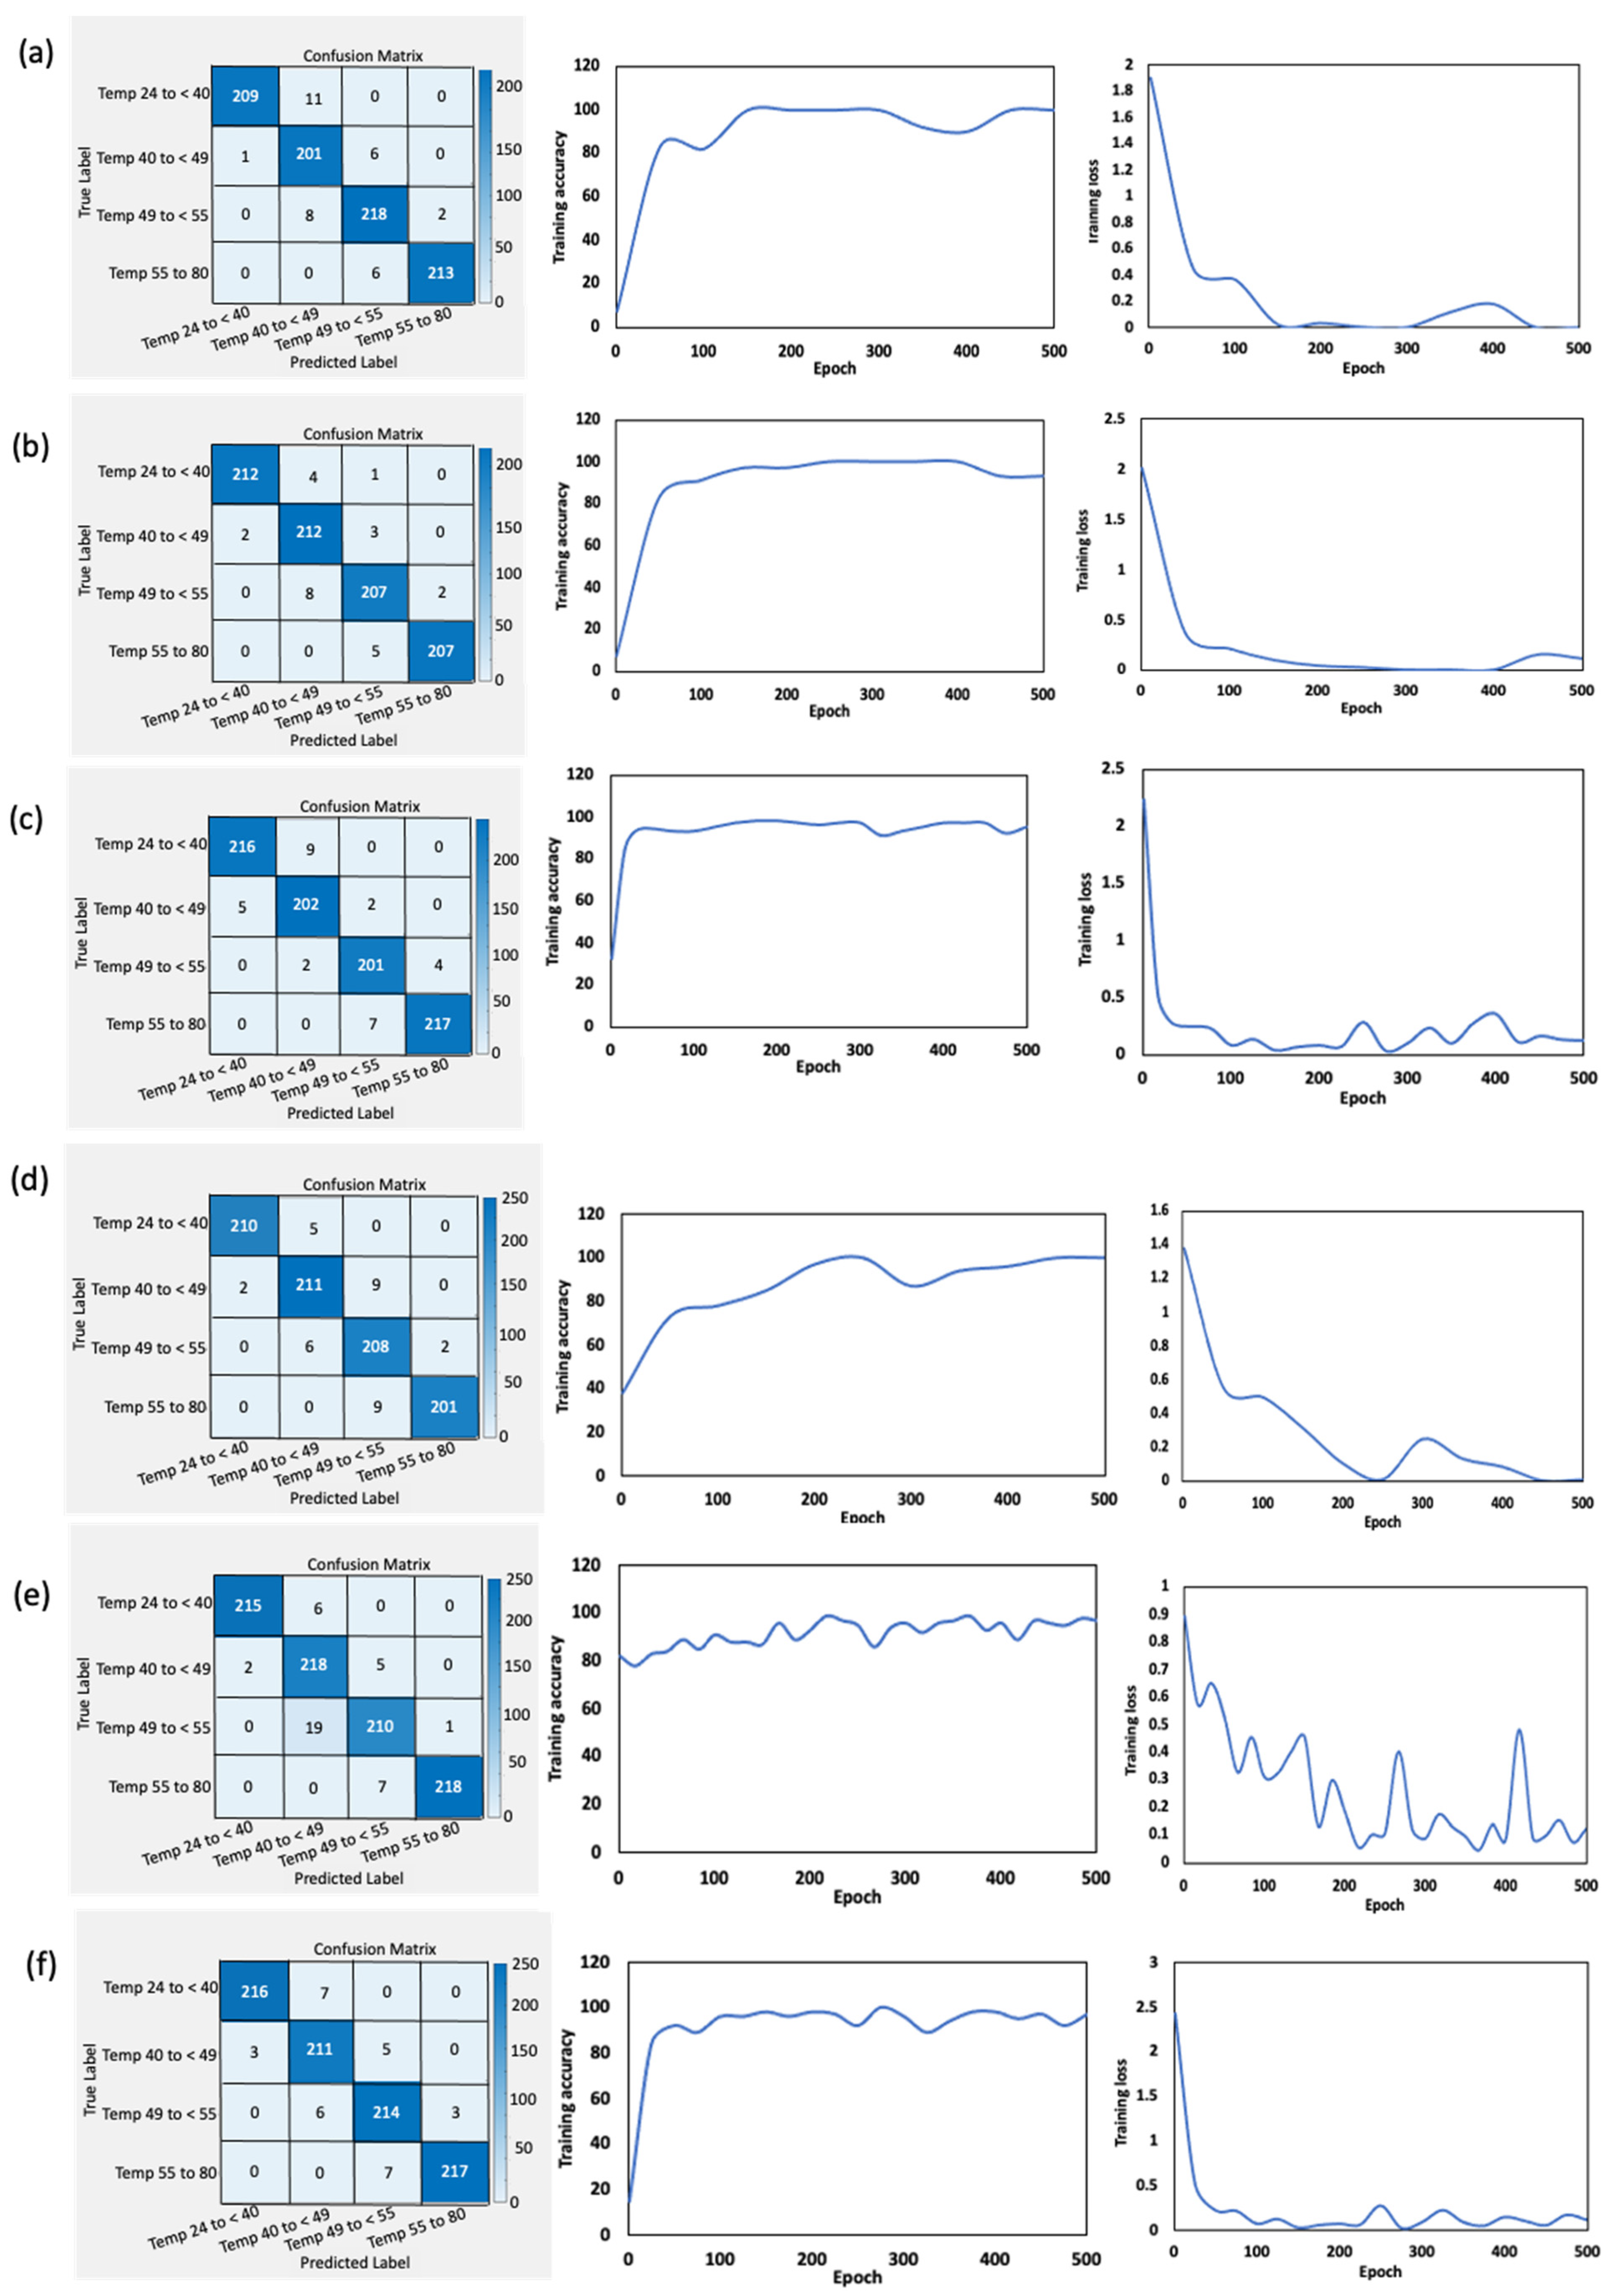
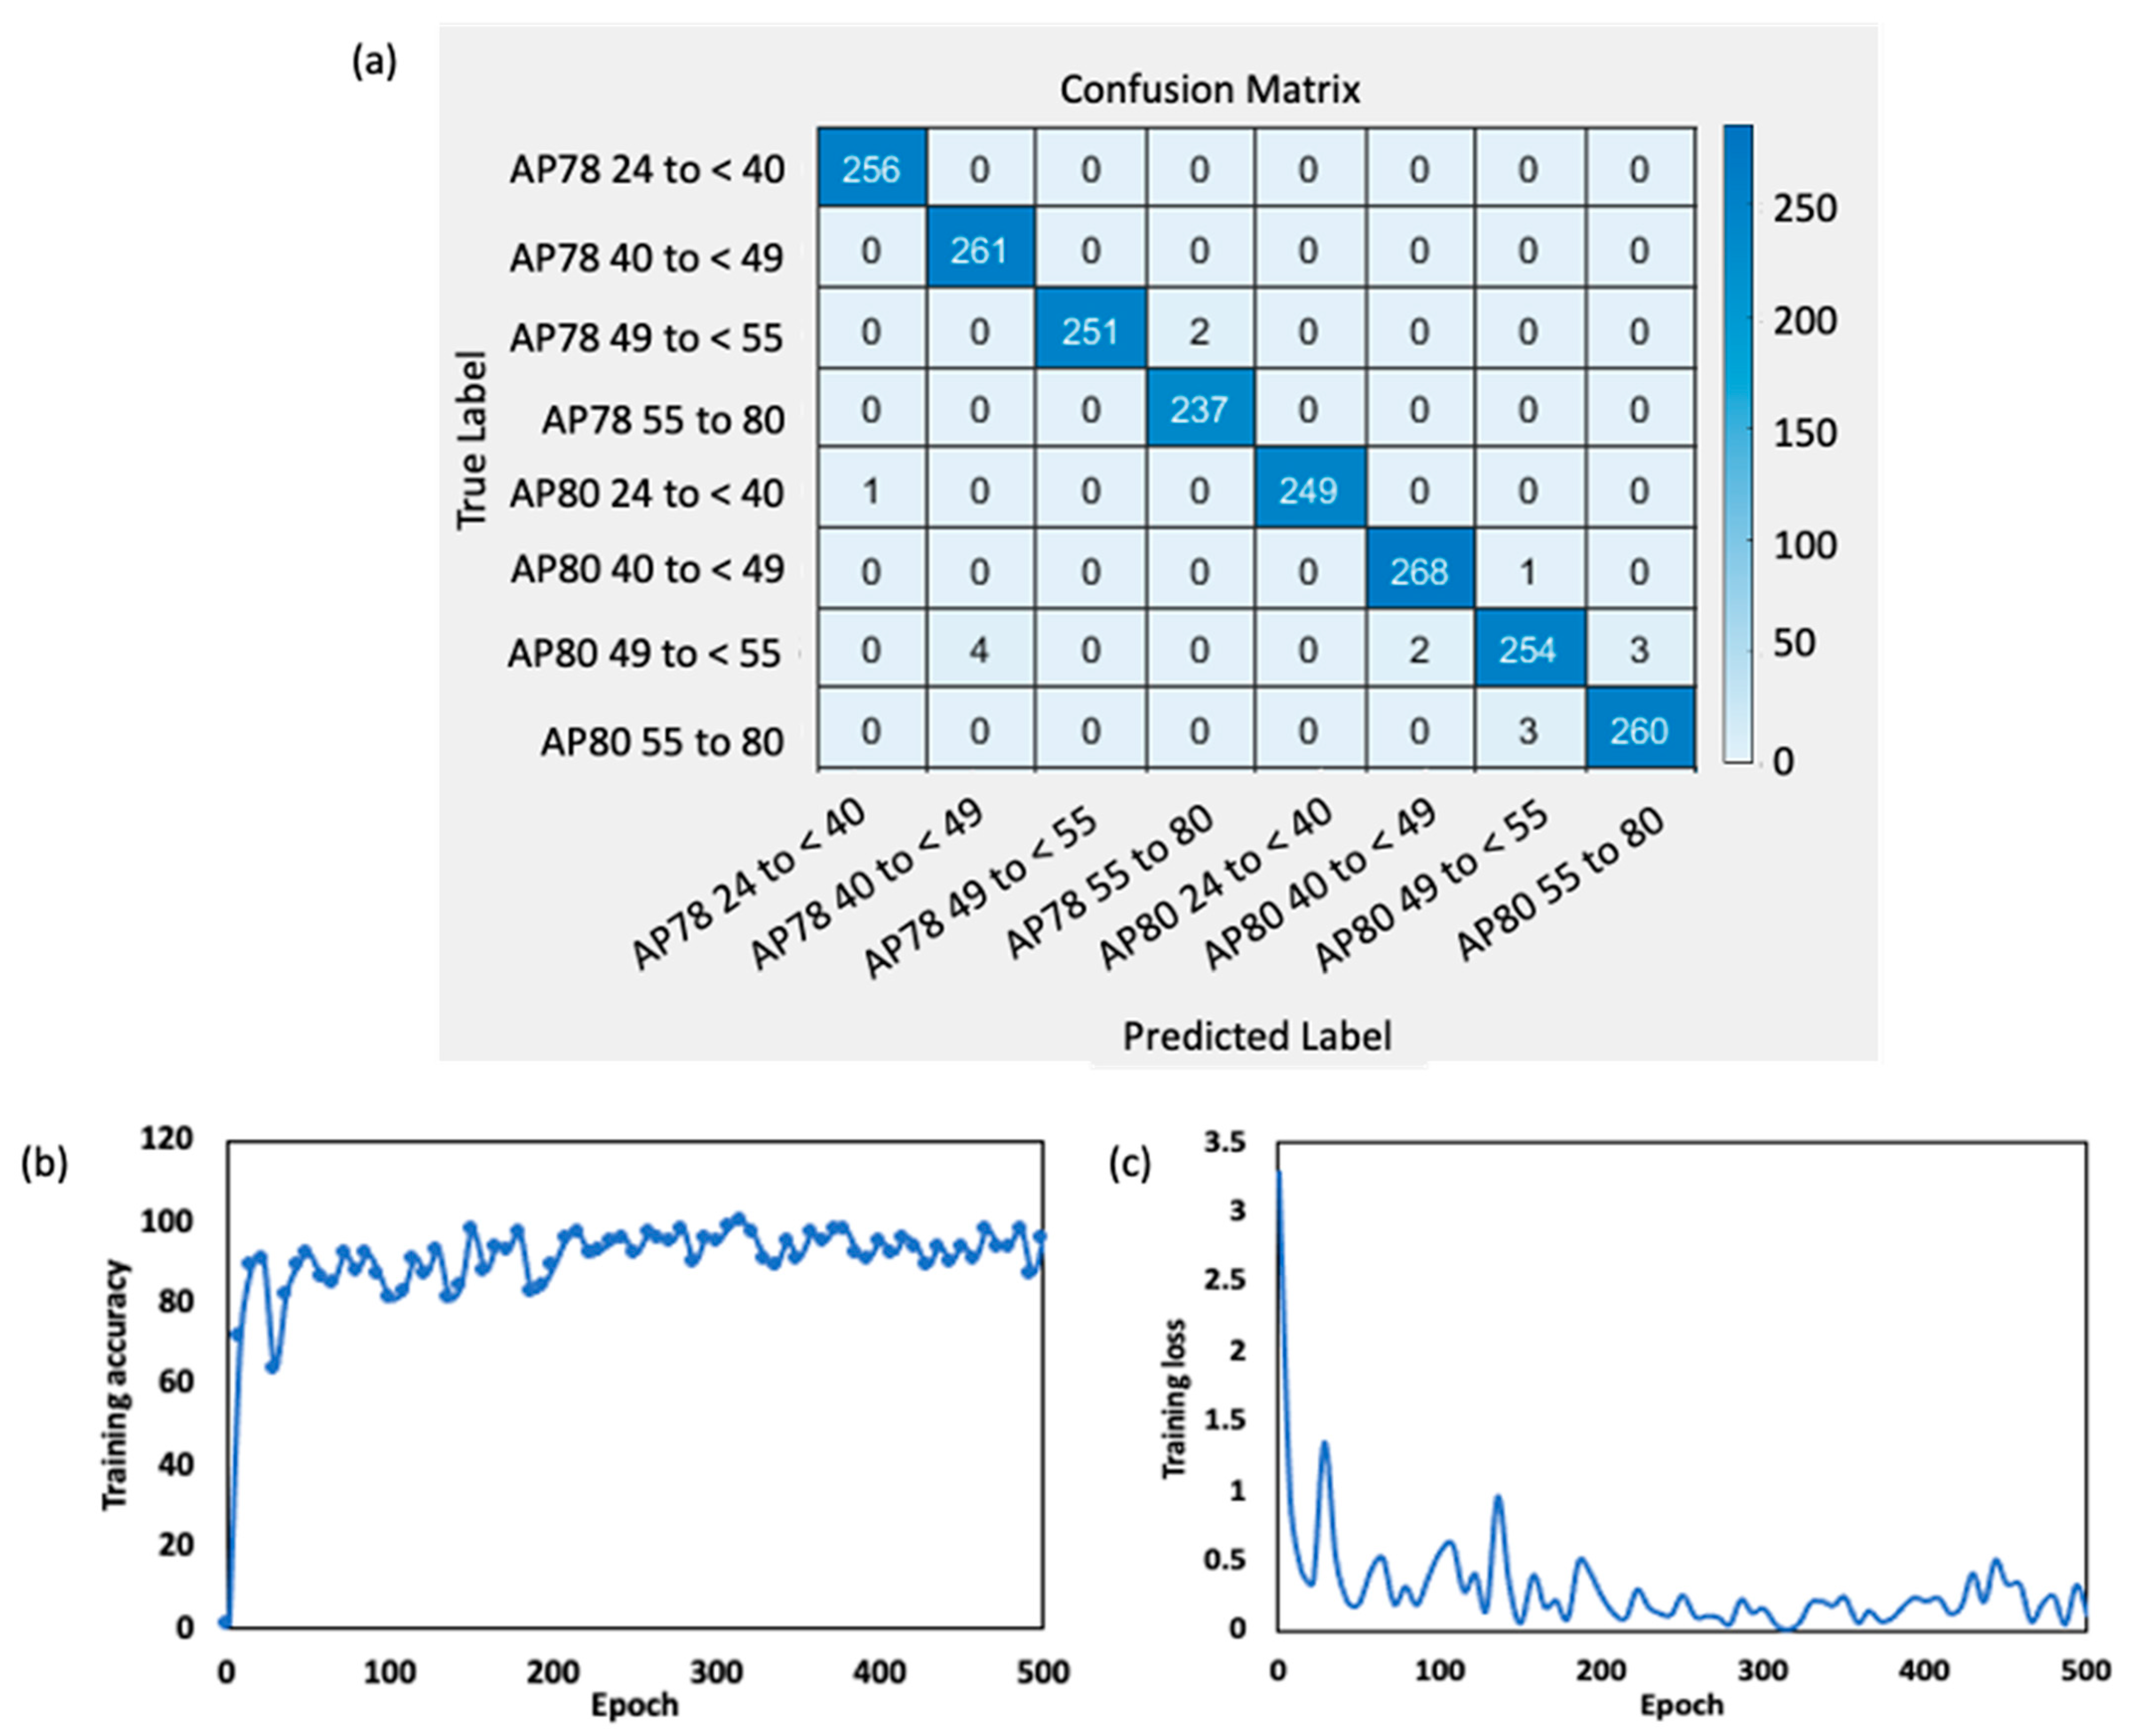
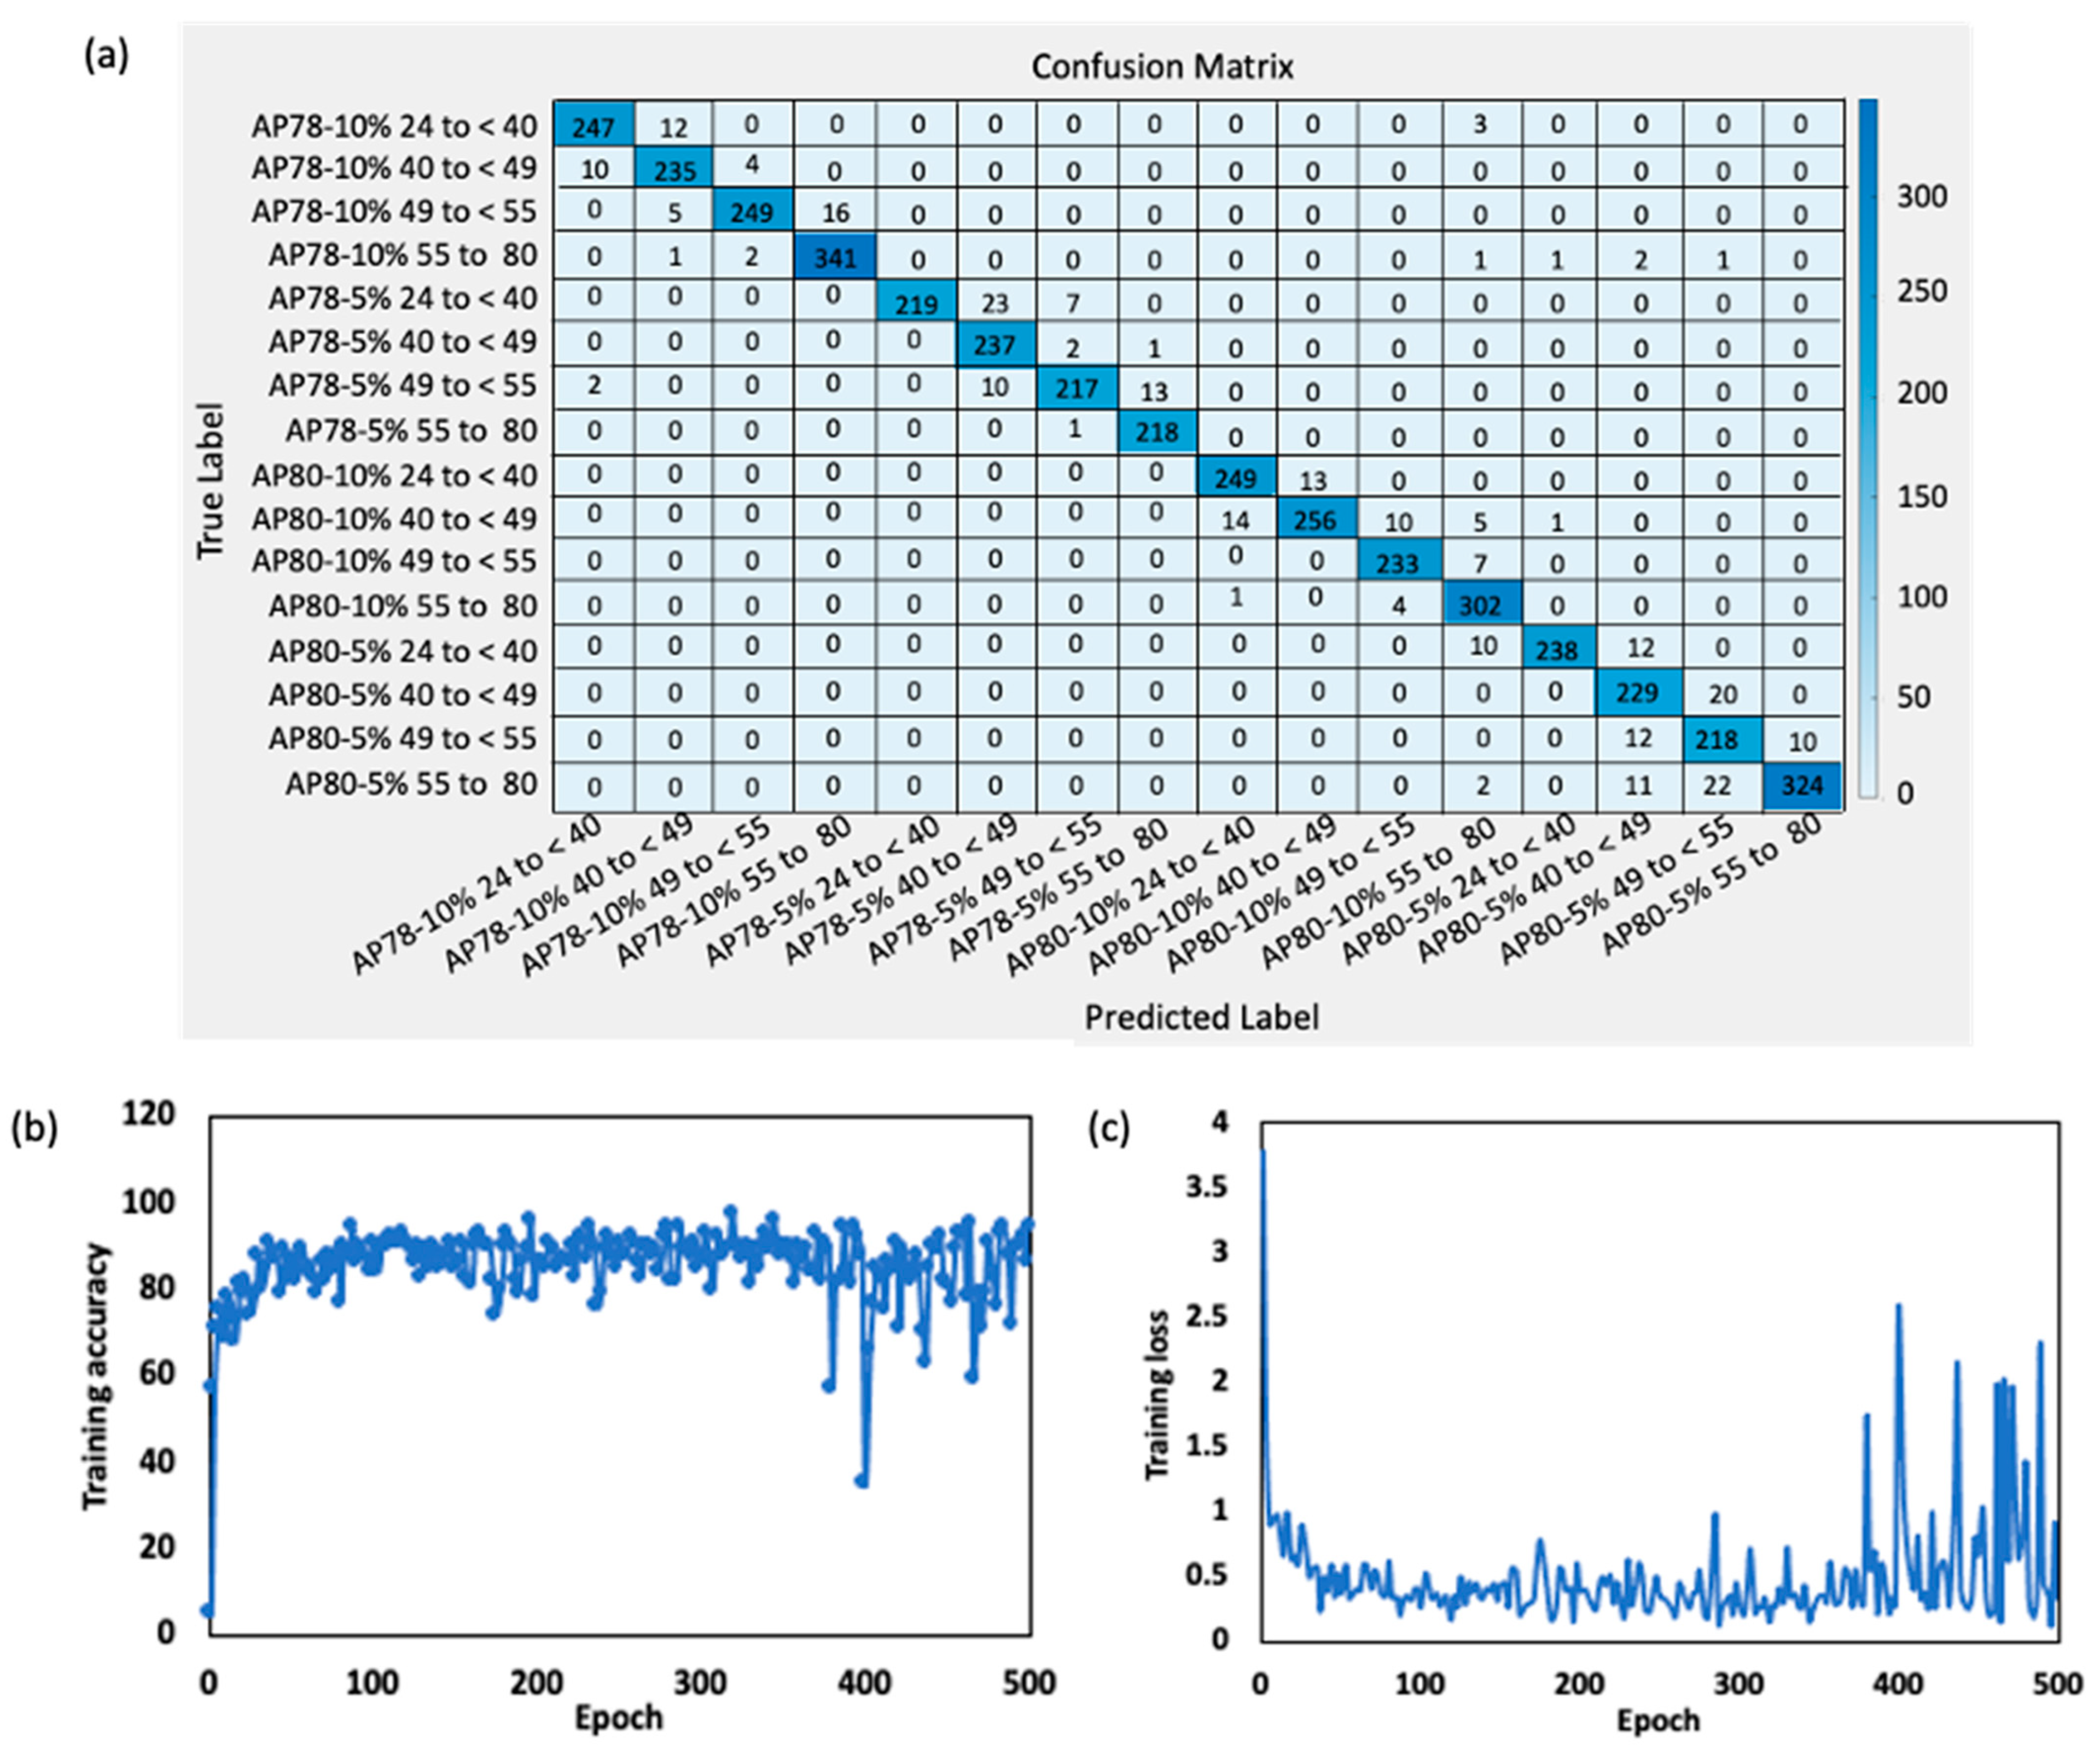
Using hyperparameters produced from sets of preliminary training and testing of the learned model, the architecture is optimized during the training process (result not shown). The Adam optimizer with a maximum of 500 epochs and a learning rate of 0.02 was used. Every epoch, the training data are shuffled and divided into mini-batches of size 100. A different validation dataset is used to conduct validation. The ‘multi-gpu’ execution environment is used to benefit from GPU acceleration. Using comparisons between predicted labels and ground truth labels, the architecture shows off its talents on the test dataset after being trained. The confusion matrix is an effective tool for assessing the effectiveness of classification across several classes. By using consistent preprocessing methods and layers that are fine-tuned for the surimi gel classification job, the architecture generalizes new images effectively.

2.6.3. Model Performance Metrics

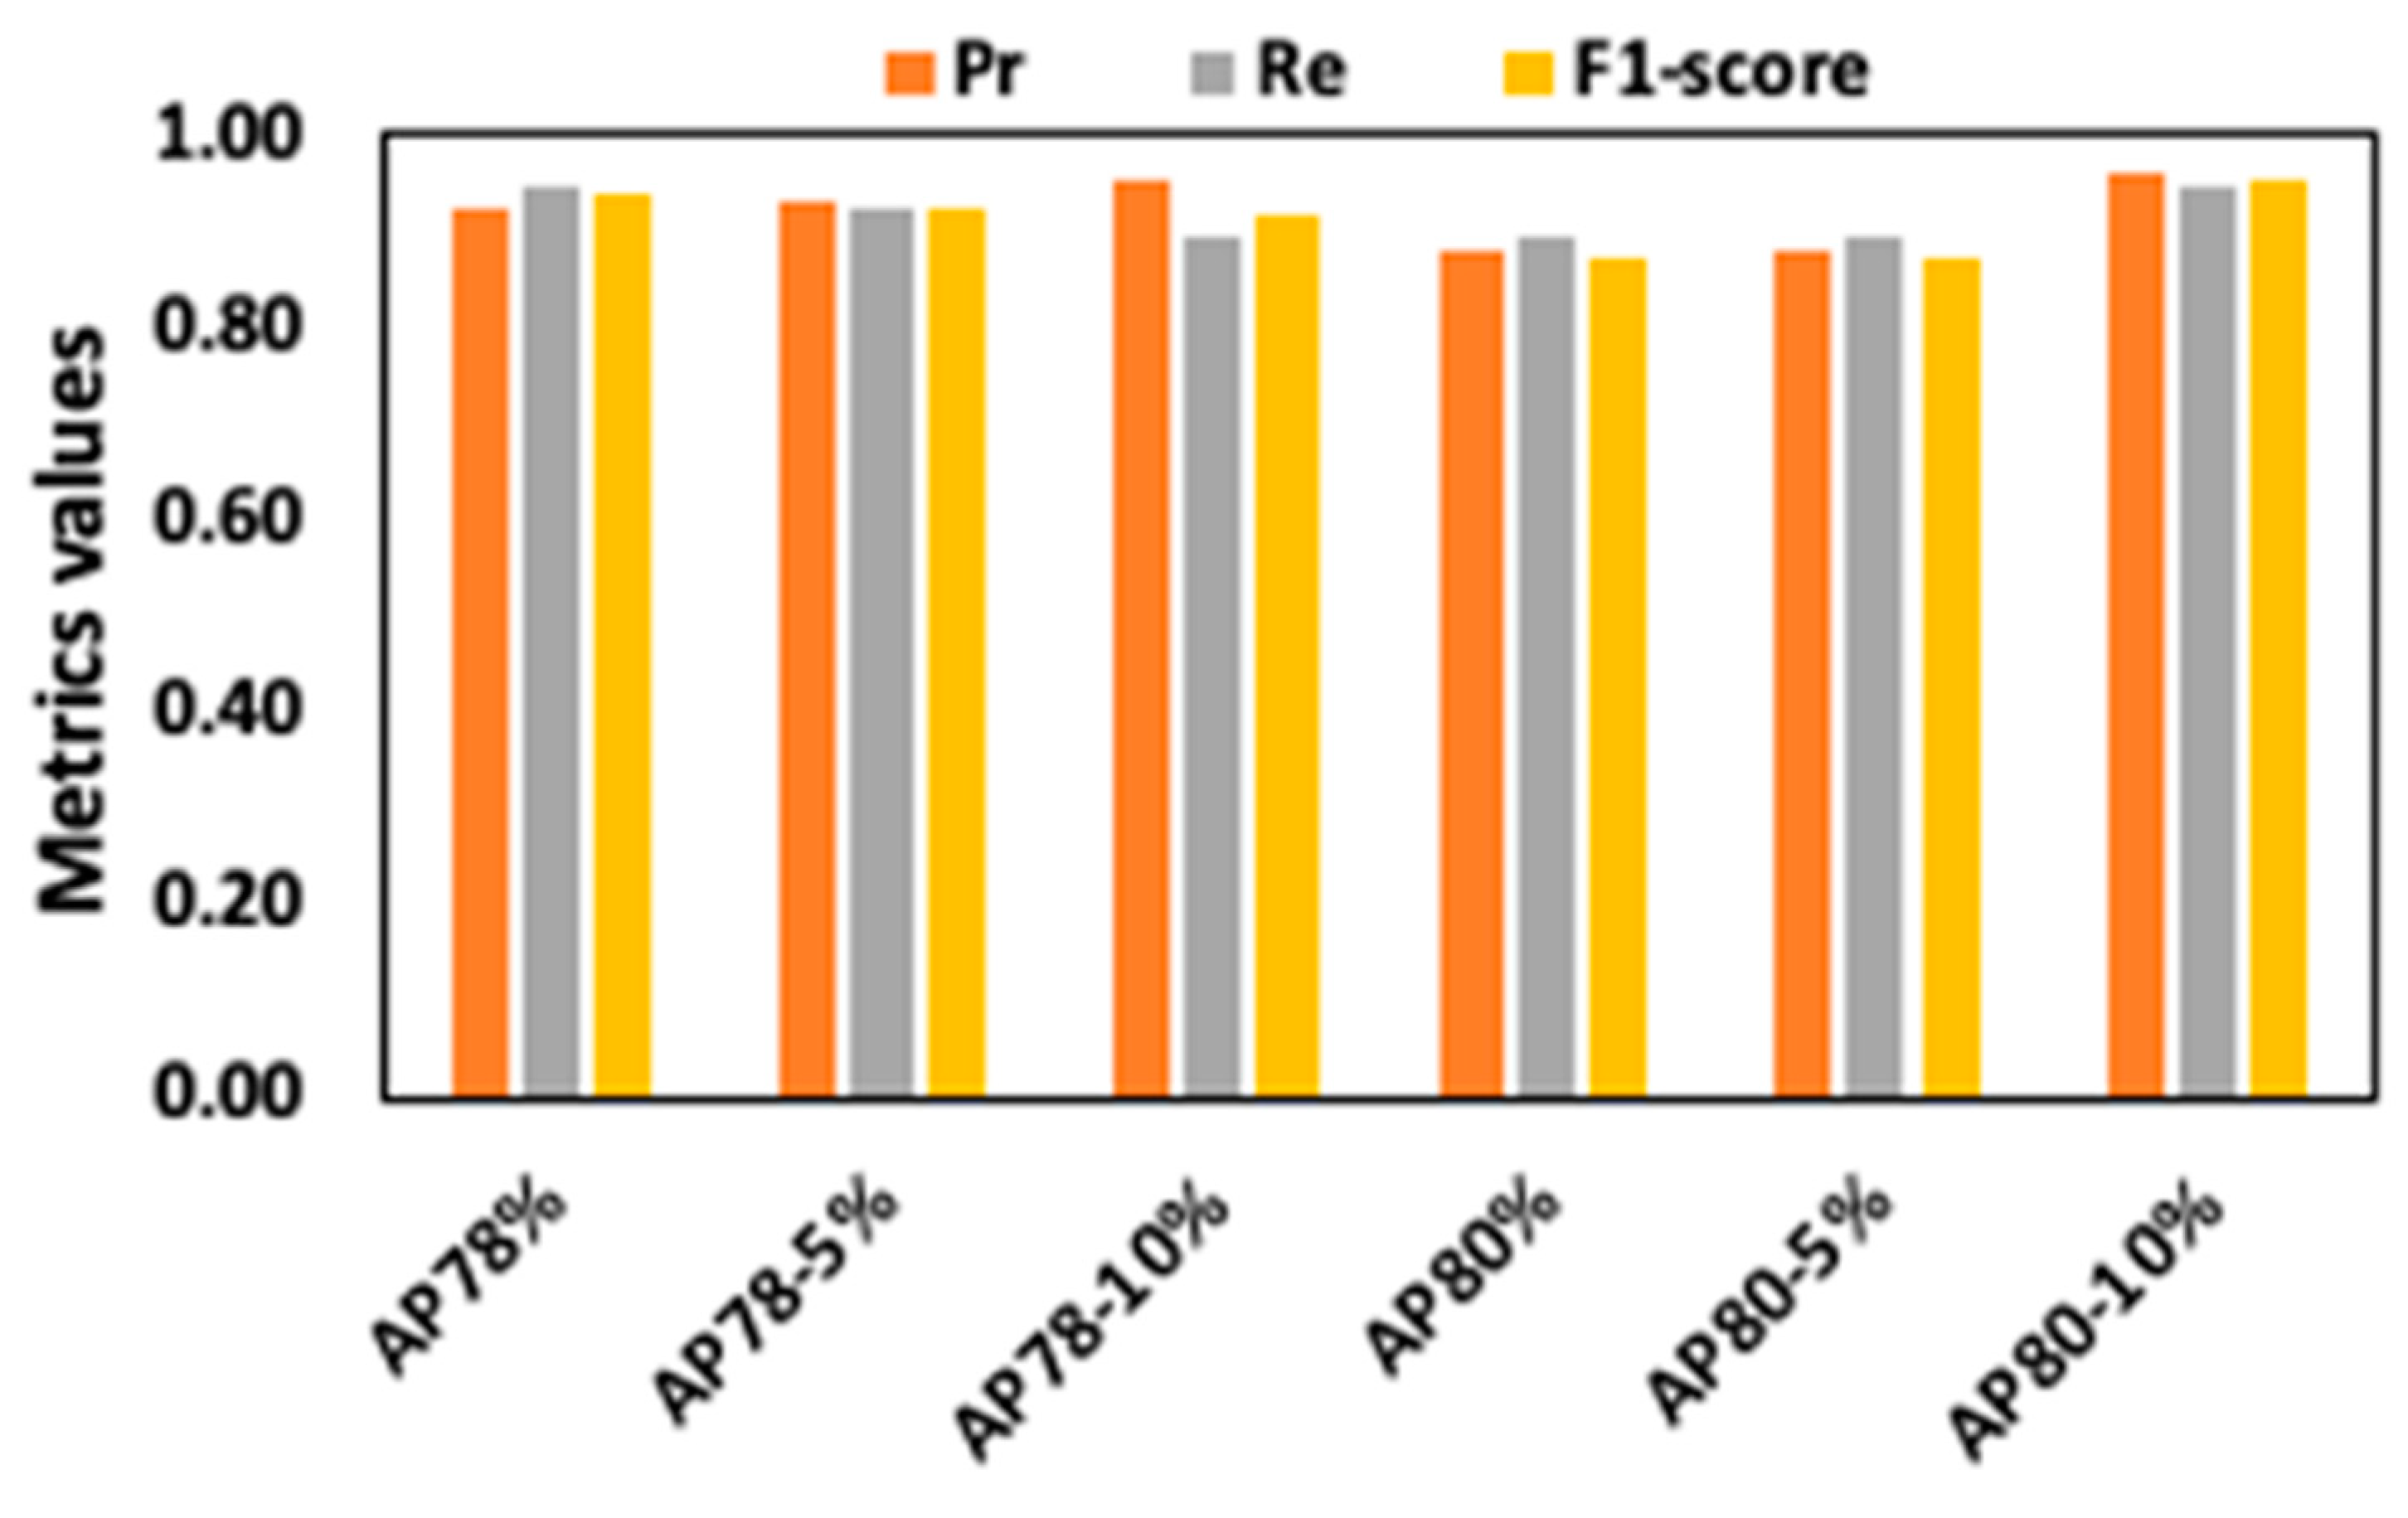
One of the primary missions of this study is to identify regions in which significant changes can be detected in images during the continuous processing of surimi paste across various formulations. To evaluate the model’s performance in this aspect, a range of evaluation metrics, encompassing cross-entropy (serving as the loss function), overall accuracy, macro-averaged recall (Re), macro-averaged precision (Pr), and macro-averaged F1-score (F1) were used. Due to the multi-class nature of the surimi image classification task, accuracy is defined as the proportion of accurately classified images to the total number of images within the validation group. Recall, Precision, and F1-score for each class were computed based on True Positive (TP), False Positive (FP), and False Negative (FN) values, as outlined in Equations (1)–(6). In this context, TP(n) denotes the correctly classified images for class n, FN(n) represents the misclassified images for class n, and FP(n) indicates the misclassified images predicted as class n. The macro-averages for these metrics were determined by calculating the averages across all classes. For a more in-depth comprehension of these metrics, readers are encouraged to consult prior literature [25,38]. Furthermore, the validation results include a confusion matrix that provides precision and recall values for each class.
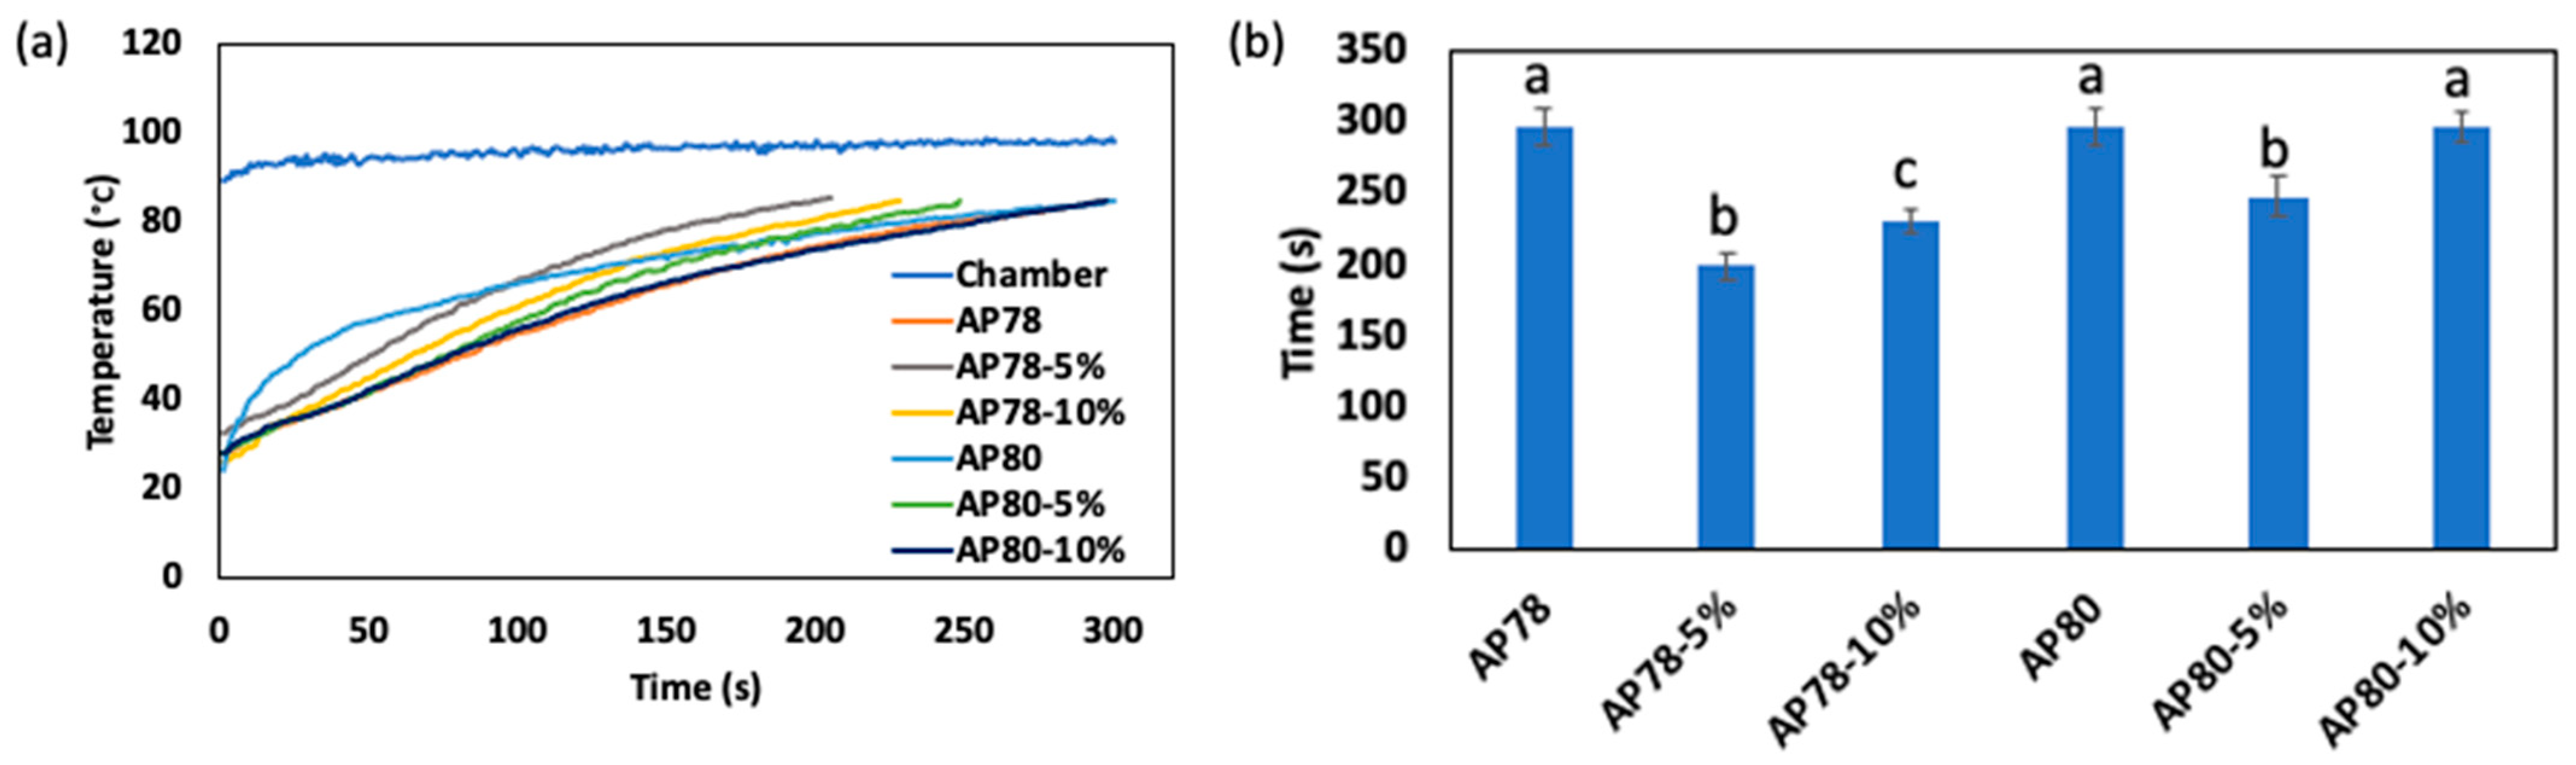
P r n = T P ( n ) T P n + F P ( n )
R e n = T P ( n ) T P n + F N ( n )
F 1 s c o r e n = 2 Pr n · R e ( n ) P r n + R e ( n )
M a c r o A v e r a g e P r = 1 N n = 1 N P r ( n )
M a c r o A v e r a g e R e = 1 N n = 1 N R e ( n )
M a c r o A v e r a g e F 1 = 1 N n = 1 N F 1 ( n )

3. Results and Discussion

3.1. Rheological Properties of Surimi Paste

Changes in the storage modulus (G′) and loss modulus (G″) of surimi paste at different moisture content (78% and 80%) and starch concentrations (0%, 5%, and 10%) during temperature sweeps carried out at a heating rate of 2 °C/min are shown in Figure 4. The rise in storage modulus (G′), denoting the energy regained per cycle of sinusoidal shear deformation, signifies an increase in sample rigidity linked to the development of an elastic gel structure [39]. The heat-induced gelation process for surimi paste during gradual heating at 2 °C/min can be categorized into four distinct stages: (1) the initial elevation of G′ within the temperature range of 25 to 39.2 °C, (2) a slight decline in G′, referred to as “gel weakening”, reaching its minimum value at about 49 °C, (3) the subsequent gradual increase in G′, termed “gel strengthening”, commencing at about 49 °C and peaking at approximately 55 °C, and (4) the rapid surge in G′ until it attains a peak value at a temperature exceeding 80 °C, which subsequently declines during the final stages of heating (Figure 4a,b).
The first G′ peak in the surimi paste occurs at an onset temperature around 30 °C and reaches its greatest value (first peak temperature) between 35.3 and 38.9 °C. These temperatures at the commencement and peak are consistent with those found by Yoon et al. [40] and Yin and Park [41]. It has been suggested that the unfolding and cross-linking of light meromyosin chains (LMM) are related to the peak’s creation [42]. Overall, both moisture content and starch concentration exert influence on the peak values observed for each mixture concentration. An increase in moisture content resulted in a decrease in G′ values, indicating a reduction in elastic properties. This reduction may be attributed to the formation of a loose and discontinuous three-dimensional structure due to myofibrillar protein hydrolysis [40].
Additionally, a decrease in the G′ values was seen with an increase in the starch concentration, which might be explained by a decrease in the surimi paste content in these combination concentrations (AP78−5%, AP78−10%). This conclusion is consistent with Zhang et al.’s study [43], which found that surimi-beef gel’s G′ decreased when starch content increased to 3%, 6%, and 9%. Gel elasticity, or G′, is a sign of the rigidity of the protein network formation. Consequently, the decrease in G′ would suggest a weaker gel structure, and the addition of starch might have a negative impact on the dynamic rheological characteristics. The drop in G′ may also be caused by a reduction in the concentration of proteins in the gels.
The myosin helix-to-coil change, which may cause the semi-gel-like protein network to be disrupted and lead to greater fluidity, may be the cause of the modest G′ drop before 45 °C [43]. After 45 °C, G′ starts to climb continuously and reaches its maximum value between 55 and 80 °C. This occurrence is related to an increase in protein aggregation cross-links as well as the deposit of more denatured proteins inside the already-existing protein networks, which strengthens the gel matrix [40,41,42]. A higher G′ value at the moment of complete gelation often indicates a stronger gel. The greatest G′ is seen in the surimi gel samples (AP78 and AP80) without starch. After heating over 80 °C, G′ starts to decrease, presumably because the gel between the cone and plate is slippery [44].

3.2. Monitoring of Temperature Changes during Continuous Heating Process

The chamber temperature and surimi sample temperature in the innovative heating system are shown in Figure 5a. Following the arrangement of the heater, the average temperature in the chamber was maintained at a constant value of 96.41 ± 1.83 °C. As time progresses, the temperature of all samples gradually increases. This is indicative of heat transfer occurring from the warmer air within the chamber to the samples, resulting in temperature equilibrium over time. Notably, the temperature trends exhibited variations in the rate of increase among the samples. Particularly, those containing starch (i.e., AP78-5%, AP78−10%, AP80−5%, and AP80−10%) displayed a rapid temperature elevation within a short duration. Consequently, these starch-containing samples reached the target temperature of 80 °C more rapidly than their other samples without starch (i.e., AP78 and AP80), as illustrated in Figure 5b. This observation underscores the significant influence of starch on the heat absorption and gelatinization properties of surimi paste, as previously documented during rheological measurements.

3.3. K-Means Clustering

The results obtained from a comprehensive K-means analysis performed on a dataset of images captured during two distinct batches of the surimi heating process, i.e., a batch containing starch and another batch without starch, are shown in Figure 6a,b. The primary objective of this analysis was to determine the number of distinct classes or clusters present within the images, providing valuable insights into the underlying patterns and variations during the continuous heating process. The dataset under investigation consisted of images that were captured at various temperature points during the surimi heating process. Notably, each image was renamed to reflect the specific temperature at which it was captured, creating a temperature-labeled dataset. The K-means algorithm revealed a compelling insight into the dataset. The algorithm converged to a specific number of clusters (k = 4) for both samples, i.e., with starch and without starch, indicating the presence of distinct classes within the surimi heating process images. This observation is similar to the earlier report for the rheological properties of the surimi paste in this study, which showed four distinct phases in the G′ characteristics of the surimi paste.
In this case, the algorithm consistently determined that the dataset exhibited characteristics of four distinct classes or clusters. The identification of four classes within the dataset carries significant implications for understanding the surimi heating process. Each class likely corresponds to a particular phase, state, or condition within the process, marked by unique visual characteristics captured in the images. The classes identified for the samples are within temperature range (1) 25 to <40 °C, (2) 40 to <50 °C, (3) 50 to <55 °C, and (4) 55 to 80 °C. Based on this classification, the training and analysis of the CNN model for image classification system was carried out.

3.4. Classification of Surimi Gel Using k = 4

The CNN model exhibited robust adaptability during training on extensive datasets. However, accurately detecting surimi gel within images under varying processing conditions demands a feature extraction layer within the network model structure with a high capacity to discern subtle structural and physical attribute variations. This is highly important because during food production, simple errors in the production line or a contamination may render the entire production batch as a faulty or defective batch. Therefore, varying validation metrics as listed in Section 2.6.3 were used to evaluate the quality control process obtained by the proposed algorithm. Although the visual disparities within similar temperature ranges and mixture conditions may not be highly pronounced in surimi gel appearance, this study’s results affirm that the CNN model’s feature extraction layer is adept at identifying subtle changes within the dataset. Remarkably, with a model iteration count of 1000 and 500 epochs, the accuracies of validation data within each group of mixture conditions were 94.63%, 92.67%, 89.97%, 89.77%, 93.09%, and 94.97% for AP78, AP78−5%, AP78−10%, AP80, AP80−5%, and AP80−10%, respectively.
The gelation-based classification during heating process as analyzed by the CNN model is presented using a confusion matrix and shown in Figure 7a–f. These matrices reveal varying numbers of misclassifications across different temperature range classes. The few numbers of images misclassified may have resulted from samples whose temperature values are close to the boundary values of each classed. These incorrectly predicted images tend to aggregate within close temperature ranges corresponding to their respective classes. Despite these isolated misclassifications, this study demonstrated notably high average precision (>0.89), average recall (>0.90), and average F1 scores (>0.88) (Figure 8). When compared to similar research employing CNN models for food quality analysis and defect classification, the CNN model’s performance in this study in terms of accuracy, precision, recall, and F1 scores falls within the reported range. For instance, in the work of Al-Sarayreh et al. [45], where CNN was utilized for classifying red meats into categories like fresh unpacked, fresh packed, frozen unpacked, frozen packed, and frozen-thawed unpacked, an accuracy of 94.4% was reported. Similarly, Fan et al. [46] applied a CNN model to distinguish between normal and defective apples, achieving an accuracy of 96.5%. This suggests that the model in this study holds a competitive advantage in the realm of surimi gel detection, especially under varying processing conditions. The robustness and effectiveness demonstrated in this study further underscore its potential for elevating quality control and enhancing production efficiency within the surimi food industry. This approach offers manufacturers and researchers numerous benefits, including improved quality control by identifying deviations in gelation in real time, ensuring product consistency and uniformity, enhancing production efficiency, reducing the need for manual inspection, early detection of process issues, potential cost savings, and a competitive advantage in surimi food production. The high precision, recall, and F1 scores of the CNN model enable it to detect subtle deviations and offer insights into the gelation process, leading to potential process optimization and improved product quality while maintaining efficiency and competitiveness within the surimi industry.

3.5. Classification of Surimi Gel Produced from Varying Moisture Content and Starch Concentration

The classification of surimi gels based on different moisture content and starch concentration is a critical aspect of this study, as it provides valuable insights into the quality and composition of surimi products. The result of CNN model’s classification performance during the heating process, which involved a diverse range of surimi samples, is shown in Figure 9 and Figure 10. The CNN model, once effectively trained, demonstrated an exceptional predictive capacity. Specifically, when analyzing surimi samples with differing moisture content and without the addition of starch (Figure 9), the model achieved an outstanding accuracy of 94.53%. This high accuracy indicates the model’s ability to correctly classify surimi gels’ moisture content into their respective categories. Additionally, the average precision and average recall both reached an impressive 0.95, highlighting the model’s precision in identifying true positives and its sensitivity in capturing all relevant instances within the dataset. The average F1-score, which combines precision and recall, also reflected a remarkable value of 0.95, underlining the model’s balanced performance. Similarly, when the CNN model analyzed surimi samples with different starch concentrations, it still exhibited a noteworthy accuracy of 89.73% (Figure 10). This accuracy indicates that the model retained its capability to effectively classify surimi gels, even when faced with the additional complexity of differing starch concentrations during varying stages of the production process. The average precision, which was 0.87, and average recall, at 0.91, maintained high values, signifying the model’s reliability in both precision and recall aspects. The average F1-score, measuring the overall model performance, remained impressive at 0.88. It is worth noting that the slight reduction in accuracy when dealing with surimi samples containing varying moisture and starch concentrations, as compared to the samples without starch, can be attributed to the increased diversity of classes involved in the classification. The introduction of starch concentration as an additional variable introduces more complexity into the classification task, making it slightly more challenging for the model to maintain the same level of accuracy. Nevertheless, the model’s performance remained robust, emphasizing its suitability for the task of categorizing surimi gels with different attributes.
In summary, the CNN model exhibited exceptional predictive performance in classifying surimi gels based on moisture content, starch concentration, and varying stage of the production process. These results underscore the model’s effectiveness in quality control and product characterization within the surimi industry, providing valuable insights for manufacturers and researchers alike. In order to monitor additional quality parameters such as texture and color changes during gelation, future research could explore the integration of advanced non-destructive techniques beyond temperature-based CNN models, such as imaging and spectroscopy. Additionally, investigating the impact of various additives or ingredients on surimi gelation and texture under different processing conditions could provide insights into optimizing formulations for specific product applications. Furthermore, exploring the potential for real-time automated adjustments in the surimi production process based on non-destructive data could enhance process efficiency and product consistency. Finally, research into the adaptation of non-destructive techniques for surimi quality control to other processed food industries could broaden their applicability and benefits beyond the surimi sector.

4. Conclusions

This study features the utilization of a non-destructive method to examine the effects of starch modifications (0%, 5%, and 10%) and moisture content variations (78% and 80%) on the rheological and physical characteristics of surimi gels generated from Alaska pollock. A lab-scale size heating chamber which comprises a moving conveyor, sample pumping system, image capturing system, and a temperature control system was used to prepare the surimi gel. The chamber maintained a constant air circulation temperature of 96.41 ± 1.83 °C allowing a steady increase in the surimi paste temperature as it was extruded onto the conveyor until the target temperature value of 80 °C. The heat-induced gelation process of surimi paste indicated four distinct stages between the paste state to the gel formation state. These findings were further validated using a K-means clustering algorithm, which effectively categorized the images acquired from diverse surimi paste batches into temperature ranges spanning 25 to <40 °C, 40 to <50 °C, 50 to <55 °C, and 55 to 80 °C. Subsequently, based on this temperature-based classification, a Convolutional Neural Network (CNN) model was designed to interpret and classify these images. The CNN architecture incorporated essential elements including an input layer, convolutional layers, normalization layers, rectified linear unit (ReLU) activation functions, and max-pooling layers. The performance of the CNN model exceeded expectations, displaying remarkable adaptability and precision in predicting the changes in surimi’s physical attributes throughout the gelation process. Specifically, the model achieved a validation accuracy >92.67% for individual mixture composition groups, a remarkable accuracy of 94.53% when classifying surimi samples based on moisture content and gelation level, and an impressive accuracy of 89.73% when dealing with the complex classification task involving moisture content, starch concentration, and gelation stages. Furthermore, the model consistently delivered exceptional results, with average precision, recall, and F1 scores exceeding 0.88 for all classification instances. These metrics underscored the model’s precision in identifying true positives and its sensitivity in capturing all relevant instances within the dataset. The CNN model demonstrated exceptional predictive performance in classifying surimi gels based on moisture content, starch concentration, and varying stage of the production process. These findings emphasize the model’s pivotal role in facilitating quality control and product characterization within the surimi industry, offering invaluable insights for both manufacturers and research purposes. The non-destructive approach and rigorous analysis employed in this study provide a solid foundation for advancing the understanding of surimi production processes and their optimization in the pursuit of high-quality surimi products.

Author Contributions

W.B.Y.: Conceptualization, methodology, resources, funding acquisition, supervision, writing—review and editing. S.A.: Conceptualization, methodology, writing—original draft. T.M.O.: Conceptualization, methodology, writing—original draft. J.K.: Conceptualization, methodology, review. All authors have read and agreed to the published version of the manuscript.

Funding

This study was supported by the research grant of Kangwon National University in 2023. This research was supported by Basic Science Research Program through the National Research Foundation of Korea (NRF) funded by the Ministry of Education (2018R1D1A3B06042501) and (grant number NRF-2020-D-G035-010104). Following are results of a study on the “Leaders in INdustry-university Cooperation 3.0” Project, supported by the Ministry of Education and National Research Foundation of Korea.

Data Availability Statement

The data presented in this study are available on request from the corresponding author.

Acknowledgments

All the authors extend their gratitude to Jae W. Park for his valuable intellectual assistance throughout the process of preparing and composing this report. This study is partially supported by Jae Park’s Surimi School.

Conflicts of Interest

The authors declare no conflict of interest.

References

  1. Park, J.W.; Lin, T.J. Surimi: Manufacturing and evaluation. In Surimi and Surimi Seafood; CRC Press: Boca Raton, FL, USA, 2005; pp. 33–106. [Google Scholar]
  2. Jaziri, A.A.; Shapawi, R.; Mohd Mokhtar, R.A.; Md. Noordin, W.N.; Huda, N. Tropical marine fish surimi by-products: Utilisation and potential as functional food application. Food Rev. Int. 2023, 39, 3455–3480. [Google Scholar] [CrossRef]
  3. Martín-Sánchez, A.M.; Navarro, C.; Pérez-Álvarez, J.A.; Kuri, V. Alternatives for efficient and sustainable production of surimi: A review. Compr. Rev. Food Sci. Food Saf. 2009, 8, 359–374. [Google Scholar] [CrossRef]
  4. Jia, R.; Eguchi, M.; Ding, W.; Nakazawa, N.; Osako, K.; Okazaki, E. Quality changes of commercial surimi-based products after frozen storage. Trans. Jpn. Soc. Refrig. Air Cond. Eng. 2018, 35, 205. [Google Scholar]
  5. Lanier, T.C.; Carvajal, P.; Yongsawatdigul, J. Surimi gelation chemistry. In Surimi and Surimi Seafood; CRC Press: Boca Raton, FL, USA, 2005; Volume 2, pp. 436–489. [Google Scholar]
  6. Walayat, N.; Xiong, H.; Xiong, Z.; Moreno, H.M.; Nawaz, A.; Niaz, N.; Randhawa, M.A. Role of cryoprotectants in surimi and factors affecting surimi gel properties: A review. Food Rev. Int. 2022, 38, 1103–1122. [Google Scholar] [CrossRef]
  7. Surendhiran, D.; Roy, V.C.; Park, J.S.; Chun, B.S. Fabrication of chitosan-based food packaging film impregnated with turmeric essential oil (TEO)-loaded magnetic-silica nanocomposites for surimi preservation. Int. J. Biol. Macromol. 2022, 203, 650–660. [Google Scholar] [CrossRef]
  8. Yang, H.; Yan, B.; Meng, L.; Jiao, X.; Huang, J.; Gao, W.; Zhao, J.; Zhang, H.; Chen, W.; Fan, D. Mathematical modeling of continuous microwave heating of surimi paste. J. Food Eng. 2022, 315, 110797. [Google Scholar] [CrossRef]
  9. Park, J.W.; Morrissey, M.T. Manufacturing of surimi from light muscle fish. In Food Science and Technology; Marcel Dekker: New York, NY, USA, 2000; pp. 23–58. [Google Scholar]
  10. Luo, X.; Xiao, S.; Ruan, Q.; Gao, Q.; An, Y.; Hu, Y.; Xiong, S. Differences in flavor characteristics of frozen surimi products reheated by microwave, water boiling, steaming, and frying. Food Chem. 2022, 372, 131260. [Google Scholar] [CrossRef]
  11. Luan, D.; Tang, J.; Pedrow, P.D.; Liu, F.; Tang, Z. Using mobile metallic temperature sensors in continuous microwave assisted sterilization (MATS) systems. J. Food Eng. 2013, 119, 552–560. [Google Scholar] [CrossRef]
  12. Bedane, T.F.; Chen, L.; Marra, F.; Wang, S. Experimental study of radio frequency (RF) thawing of foods with movement on conveyor belt. J. Food Eng. 2017, 201, 17–25. [Google Scholar] [CrossRef]
  13. He, C.; Zhong, G.; Wu, H.; Cheng, L.; Huang, Q. A smart reheating and defrosting microwave oven based on infrared temperature sensor and humidity sensor. Innov. Food Sci. Emerg. Technol. 2022, 77, 102976. [Google Scholar] [CrossRef]
  14. Paquet-Durand, O.; Solle, D.; Schirmer, M.; Becker, T.; Hitzmann, B. Monitoring baking processes of bread rolls by digital image analysis. J. Food Eng. 2012, 111, 425–431. [Google Scholar] [CrossRef]
  15. Divya, S.; Thyagarajan, D.; Sujatha, G. Magnetic resonance imaging technology for process control and quality maintenance in food quality operation. Int. J. Eng. Technol. 2013, 4, 441. [Google Scholar]
  16. Shih, C.W.; Wang, C.H. Integrating wireless sensor networks with statistical quality control to develop a cold chain system in food industries. Comput. Stand. Interfaces 2016, 45, 62–78. [Google Scholar] [CrossRef]
  17. Patel, P.; Doddamani, A. Role of sensor in the food processing industries. Int. Arch. Appl. Sci. Technol. 2019, 10, 10–18. [Google Scholar] [CrossRef]
  18. Mutumba, R.; Kigozi, J.; Tumutegyereize, P.; Ssenyimba, S.; Muyonga, J. Arduino Based Control of the Food and Water Conveyance Systems of a Refractance Window Dryer. 2021. Available online: https://nru.uncst.go.ug/handle/123456789/8495 (accessed on 5 November 2023).
  19. Matindoust, S.; Baghaei-Nejad, M.; Abadi, M.H.S.; Zou, Z.; Zheng, L.R. Food quality and safety monitoring using gas sensor array in intelligent packaging. Sens. Rev. 2016, 36, 169–183. [Google Scholar] [CrossRef]
  20. Zhou, T.; Harrison, A.D.; McKellar, R.; Young, J.C.; Odumeru, J.; Piyasena, P.; Lu, X.; Mercer, D.; Karr, S. Determination of acceptability and shelf life of ready-to-use lettuce by digital image analysis. Food Res. Int. 2004, 37, 875–881. [Google Scholar] [CrossRef]
  21. Mendoza, F.; Dejmek, P.; Aguilera, J.M. Calibrated color measurements of agricultural foods using image analysis. Postharvest Biol. Technol. 2006, 41, 285–295. [Google Scholar] [CrossRef]
  22. Sun, D.W. (Ed.) Computer Vision Technology for Food Quality Evaluation; Academic Press: Cambridge, MA, USA, 2016. [Google Scholar]
  23. Chmiel, M.; Słowiński, M.; Dasiewicz, K. Lightness of the color measured by computer image analysis as a factor for assessing the quality of pork meat. Meat Sci. 2011, 88, 566–570. [Google Scholar] [CrossRef]
  24. Kumar, I.; Rawat, J.; Mohd, N.; Husain, S. Opportunities of artificial intelligence and machine learning in the food industry. J. Food Qual. 2021, 2021, 4535567. [Google Scholar] [CrossRef]
  25. Moses, K.; Miglani, A.; Kankar, P.K. Deep CNN-based damage classification of milled rice grains using a high-magnification image dataset. Comput. Electron. Agric. 2022, 195, 106811. [Google Scholar] [CrossRef]
  26. Liang, F.; Lin, L.; Zhu, Y.; Jiang, S.; Lu, J. Comparative study between surimi gel and surimi/crabmeat mixed gel on nutritional properties, flavor characteristics, color, and texture. J. Aquat. Food Prod. Technol. 2020, 29, 681–692. [Google Scholar] [CrossRef]
  27. Lu, W.; Qin, Y.; Ruan, Z. Effects of high hydrostatic pressure on color, texture, microstructure, and proteins of the tilapia (Orechromis niloticus) surimi gels. J. Texture Stud. 2021, 52, 177–186. [Google Scholar] [CrossRef] [PubMed]
  28. Oyinloye, T.M.; Yoon, W.B. Investigation of flow field, die swelling, and residual stress in 3D printing of surimi paste using the finite element method. Innov. Food Sci. Emerg. Technol. 2022, 78, 103008. [Google Scholar] [CrossRef]
  29. Gauswami, M.H.; Trivedi, K.R. Implementation of machine learning for gender detection using CNN on raspberry Pi platform. In Proceedings of the 2018 2nd International Conference on Inventive Systems and Control (ICISC), Coimbatore, India, 19–20 January 2018; IEEE: New York, NY, USA, 2018; pp. 608–613. [Google Scholar] [CrossRef]
  30. Dhanachandra, N.; Manglem, K.; Chanu, Y.J. Image segmentation using K-means clustering algorithm and subtractive clustering algorithm. Procedia Comput. Sci. 2015, 54, 764–771. [Google Scholar] [CrossRef]
  31. Al-Azzeh, A.S.J.; Rasras, R.; Alqadi, Z.; Ayyoub, B.; Sharadqh, A. Adaptation of matlab K-means clustering function to create Color Image Features. Int. J. Res. Adv. Eng. Technol. 2019, 5, 10–18. [Google Scholar]
  32. Patel, B.C.; Sinha, G.R. An adaptive K-means clustering algorithm for breast image segmentation. Int. J. Comput. Appl. 2010, 10, 35–38. [Google Scholar] [CrossRef]
  33. Ding, H.C.; Li, X.P.; Li, R.Z.; Yi, S.M.; Xu, Y.X.; Mi, H.B.; Li, J.R. Changes of water state and gel characteristics of Hairtail (Trichiurus lepturus) surimi during thermal processing. J. Texture Stud. 2019, 50, 332–340. [Google Scholar] [CrossRef]
  34. Du, W.L.; Zhou, Y.; Zhao, J.; Tian, X. K-means clustering guided generative adversarial networks for SAR-optical image matching. IEEE Access 2020, 8, 217554–217572. [Google Scholar] [CrossRef]
  35. Sammouda, R.; El-Zaart, A. An optimized approach for prostate image segmentation using K-means clustering algorithm with elbow method. Comput. Intell. Neurosci. 2021, 2021, 4553832. [Google Scholar] [CrossRef]
  36. Ramdani, A.; Virgono, A.; Setianingsih, C. Food detection with image processing using convolutional neural network (CNN) method. In Proceedings of the 2020 IEEE International Conference on Industry 4.0, Artificial Intelligence, and Communications Technology (IAICT), Bali, Indonesia, 7–8 July 2020; IEEE: New York, NY, USA, 2020; pp. 91–96. [Google Scholar] [CrossRef]
  37. Li, M.; Gao, Y.; Xu, K.; Zhang, Y.; Gong, S.; Yang, Y.; Xu, X.; Wang, Z.; Wang, S. Quantitatively analysis and detection of CN− in three food samples by a novel nopinone-based fluorescent probe. Food Chem. 2022, 379, 132153. [Google Scholar] [CrossRef]
  38. Sokolova, M.; Lapalme, G. A systematic analysis of performance measures for classification tasks. Inf. Process. Manag. 2009, 45, 427–437. [Google Scholar] [CrossRef]
  39. Park, J.W.; Yoon, W.B.; Kim, B.Y. Surimi Paste Preparation, 17 Gel Analysis, and Rheology. In Surimi and Surimi Seafood; CRC Press: Boca Raton, FL, USA, 2013; p. 411. [Google Scholar]
  40. Yoon, W.B.; Gunasekaran, S.; Park, J.W. Characterization of thermorheological behavior of Alaska pollock and Pacific whiting surimi. J. Food Sci. 2004, 69, 338–343. [Google Scholar] [CrossRef]
  41. Yin, T.; Park, J.W. Textural and rheological properties of Pacific whiting surimi as affected by nano-scaled fish bone and heating rates. Food Chem. 2015, 180, 42–47. [Google Scholar] [CrossRef] [PubMed]
  42. Reed, Z.H.; Park, J.W. Thermophysical characterization of tilapia myosin and its subfragments. J. Food Sci. 2011, 76, C1050–C1055. [Google Scholar] [CrossRef] [PubMed]
  43. Zhang, F.; Fang, L.; Wang, C.; Shi, L.; Chang, T.; Yang, H.; Cui, M. Effects of starches on the textural, rheological, and color properties of surimi–beef gels with microbial tranglutaminase. Meat Sci. 2013, 93, 533–537. [Google Scholar] [CrossRef]
  44. Poowakanjana, S.; Mayer, S.G.; Park, J.W. Optimum chopping conditions for Alaska pollock, Pacific whiting, and threadfin bream surimi paste and gel based on rheological and Raman spectroscopic analysis. J. Food Sci. 2012, 77, E88–E97. [Google Scholar] [CrossRef]
  45. Al-Sarayreh, M.; Reis, M.M.; Yan, W.Q.; Klette, R. Potential of deep learning and snapshot hyperspectral imaging for classification of species in meat. Food Control 2020, 117, 107332. [Google Scholar] [CrossRef]
  46. Fan, S.; Li, J.; Zhang, Y.; Tian, X.; Wang, Q.; He, X.; Zhang, C.; Huang, W. On line detection of defective apples using computer vision system combined with deep learning methods. J. Food Eng. 2020, 286, 110102. [Google Scholar] [CrossRef]
Figure 1. Schematic representation of the surimi pastes heating system (a) 3D view, (b) side view displaying positions of heat generators, and (c) top view displaying position of four Raspberry cameras.
Processes 11 03187 g001
Figure 2. Images of surimi paste captured on moving conveyor belt and classified by K-means algorithm.
Processes 11 03187 g002
Figure 3. Schematic representation of the Convolutional Neural Network architecture constructed in this study.
Processes 11 03187 g003
Figure 4. Changes in storage modulus (G′) and loss modulus (G″) for surimi paste from different moisture content of 78% and 80%, and starch concentrations of 0%, 5%, and 10%; (a) G′ of surimi paste, and (b) G″ of surimi paste.
Processes 11 03187 g004
Figure 5. Changes in temperature of surimi paste with different moisture content of 78% and 80%, and starch concentrations of 0%, 5%, and 10% (a), and time required for sample to attain 80 °C on the conveyor (b). Bars with different alphabet (a, b, and c) represent classes with significant difference.
Processes 11 03187 g005
Figure 6. Optimal numbers of clusters in K-means algorithm for surimi paste samples: (a) surimi sample with starch, and (b) surimi sample without starch.
Processes 11 03187 g006
Figure 7. Confusion matrix, training accuracy, and training loss generated from validation data of surimi with different moisture content (78% and 80%) and starch concentration (0%, 5%, and 10%): (a) AP78, (b) AP78−5%, (c) AP78−10%, (d) AP80, (e) AP80−5%, and (f) AP80−10%.
Processes 11 03187 g007
Figure 8. Metrics obtained from the validation analysis of surimi images. Pr represents average precision, Re represents the average recall value, and F1-score is the average F1-score for each validation analysis.
Processes 11 03187 g008
Figure 9. Confusion matrix generated from validation data for surimi image with different moisture content levels (a), training accuracy for the developed CNN model (b), and training loss (c).
Processes 11 03187 g009
Figure 10. Confusion matrix generated from validation data for surimi image with different starch and moisture content levels (a), training accuracy for the developed CNN model (b), and training loss (c).
Processes 11 03187 g010
Table 1. Surimi paste formulations.
Surimi Content (%)Salt (%)Ice (%)Corn Starch (%)Total Weight (g)Moisture Content (%)Sample Code
79.88218.12010078AP78%
62.35230.65510078AP78−5%
39.65248.351010078AP78−10%
71.77226.23010080AP80%
54.22238.78510080AP80−5%
31.99256.011010080AP80−10%
Disclaimer/Publisher’s Note: The statements, opinions and data contained in all publications are solely those of the individual author(s) and contributor(s) and not of MDPI and/or the editor(s). MDPI and/or the editor(s) disclaim responsibility for any injury to people or property resulting from any ideas, methods, instructions or products referred to in the content.

