Article

Diffusion Behavior of Carbon and Silicon in the Process of Preparing Silicon Steel Using Solid-State Decarburization

1
Metallurgy and Energy College, North China University of Science and Technology, Tangshan 063210, China
2
HBIS Materials Technology Research Institute, Shijiazhuang 052165, China
*
Authors to whom correspondence should be addressed.
Processes 2023, 11(11), 3176; https://doi.org/10.3390/pr11113176
Submission received: 30 September 2023 / Revised: 28 October 2023 / Accepted: 3 November 2023 / Published: 7 November 2023
(This article belongs to the Special Issue Renewable Energy and Green Metallurgy Technology)

Abstract

:
In this study, we investigated the relationship between the decarburization effect of the solid-state decarburization method for preparing silicon steel and the atomic diffusion behavior in the matrix, focusing on 1 mm thick Fe-0.18 wt% C-Si (1.5, 3.5 wt%) alloy strips as the research object. Solid-state decarburization experiments were carried out in an Ar-H2O-H2 atmosphere, and the self-diffusion behavior of C and Si in Fe-C-Si alloy system was simulated by molecular dynamics. The results show that the molecular dynamics simulation results are consistent with the decarburization experimental results. When the temperature is lower than 800 °C, the atoms maintain a compact bcc structure, so the migration rate of carbon is low. When the temperature rises, the atoms move violently, resulting in the destruction of the crystal structure. Because the atomic arrangement tends towards a disordered structure, the migration rate of C is high and the diffusion coefficient increases. The experimental results showed that the decarburization rate was accelerated. At the same temperature, the diffusion activation energy Q = 48.7 kJ·mol−1 of carbon in an Fe-3.5 wt% Si-C alloy matrix can be calculated. The diffusion activation energy of carbon Q = 47.3 kJ·mol−1 was calculated using a molecular dynamics simulation. When the content of Si is 3.5 wt% and 1.5 wt%, the diffusion series of Si can be expressed as D3.5Si, Si = 8.54 × 10⁻¹⁰ exp(−33,089.7/RT) m2/s and D1.5Si, Si = 2.06 × 10⁻⁹ exp(−46,641.5/RT) m2/s, respectively. When the Si content is 3.5 wt%, the diffusion coefficient of Si is larger. After diffusion to the near surface, it combines with the remaining O to form a continuous strip of SiO2. When the Si content is 1.5 wt%, the diffusion coefficient of Si is small. The remaining O diffuses in the matrix and will oxidize when encountering Si; it cannot aggregate in a highly-dispersed distribution. The lattice transition from face centered cubic lattice austenite to body centered cubic lattice ferrite occurred in the matrix of the thin strip. The diffusion coefficient of C in ferrite is much larger than that in austenite. Therefore, the decarburization rate suddenly increases before decarburization stagnation. With the increase in Si content, the diffusion activation energy of C decreases, which promotes the decarburization effect.

1. Introduction

Electrical steel, also known as silicon steel, is a type of iron–silicon binary alloy soft magnetic material widely used in various electronic and electrical power applications. Its products are widely used in various motor rotors, transformer cores, and other electrical components. With the continuous innovation of smelting technology, the production process of silicon steel is also constantly developing, and the performance of the products is gradually improving [1,2,3]. Traditional silicon steel production adopts converter long process, including blast furnace-converter-continuous casting and rolling-finishing rolling-cold rolling-heat treatment and other main process nodes; this process is complex, the carbon emission is high, and the environmental pollution is large. Hong et al. [4] and others proposed a new process, namely “solid-state steelmaking”, in which hot blast furnace molten iron is directly solidified by the twin roll continuous casting and then decarburized after gas–solid reaction at a high temperature to produce the steel strip. This process does not need converter steelmaking and refining processes, thus greatly reducing industrial gas emissions and energy consumption. Without oxygen decarburization in converter, the oxygen potential in steel is low, effectively avoiding the generation of inclusions and bubbles, and greatly improving the cleanliness of steel.
In recent years, there has been extensive exploration and research on the new process of solid-state decarburization steelmaking [5,6,7,8,9,10,11,12]. Among them, numerous decarburization studies [13,14,15,16,17,18,19,20,21] have shown that the surface decarburization reaction of Fe-C alloy is the rate-limiting step in the early stage of decarburization, while the diffusion of carbon atoms from the interior to the interface is the limiting step in the middle stage of decarburization. Both decarburization rate and carbon diffusion rate are linearly related to temperature. Agren [22] summarized the relationship between the carbon diffusion coefficients and temperature in ferrite and austenite. To explore whether the solid-state decarburization effect is the same after adding silicon alloy based on the solid-state decarburization of Fe-C alloy, predecessors also have a large number of studies [23,24]. Taking 1 mm thick Fe-4.0% C-0.84% Si thin strip as the research object, the activation energy of decarburization reaction was calculated to be 111.475 kJ/mol. This is lower than the diffusion activation energy of carbon in austenite. Silicon can promote the decarburization reaction to a certain extent, mainly because silicon can increase the diffusion coefficient of carbon atoms.
However, there is no research and exploration at the micro atomic scale based on molecular dynamics. The diffusion behavior of carbon and silicon in silicon steel and the diffusion activation energy have not been reported. Scholars have calculated the atomic self-diffusion coefficients in different systems [25,26,27]. Ye et al. [28] used molecular dynamics to study the diffusion behavior of amorphous Si-C and Si-B-C systems at different temperatures. Sun [29] studied the diffusion behavior of oxygen isotopes in melts and calculated the changes in silicon and oxygen self-diffusion coefficients with pressure at different temperatures. Shi et al. [30] used molecular dynamics to study the diffusion behavior of oxygen in molten SiO2 at different temperatures and analyzed the influence of temperature on gas diffusion. Wang et al. [31] applied molecular dynamics simulations to study interfacial atomic diffusion and calculated the mean-square displacement (MSD) of C and Ti atoms. The results showed that in the atomic diffusion at the interface between diamond and Ti, the diffusion ability and speed of C atoms were greater than those of Ti atoms.
The feasibility of preparing silicon steel by gas–solid reaction decarburization method was experimentally studied by the research group. When the initial carbon content is 0.18 wt%, the carbon content can be reduced to 0.016 wt%. Next, we need to study the diffusion behavior of carbon and silicon in the process of decarburization and its factors. The influence of atmosphere and temperature on the growth of oxide film, etc. This study focuses on Fe-0.18 wt% C—(1.5 wt%, 3.5 wt%) Si alloys, combined with experimental results, to conduct molecular dynamics simulations, FactSage thermodynamic calculations, and decarburization kinetics research. It lays a foundation for improving the decarburization conditions of silicon steel prepared by carbon fixation and decarburization method.

2. Experimental Program

2.1. Modelling

Molecular dynamics (MD) were used to simulate the diffusion behavior of carbon and silicon atoms in the Fe-C-Si alloy system. The simulations were carried out using LAMMPS software (Lammps-patch_27Oct2021) to create an FCC-structured 13a0 × 13 × 13 pure Fe supercell with 8788 atoms and a0 = 0.3591 nm as the lattice parameter. To eliminate interfacial effects, three-dimensional periodic boundary conditions were adopted for the model. The Fe-C-Si alloy model, obtained by randomly replacing an equal number of Fe atoms with Si atoms and randomly inserting 0.18 wt% C atoms, is shown in Figure 1. Tobias A et al. [32] mentioned that increasing the box size has little effect on the diffusion coefficient, and changing the box size will inevitably change the insertion position of atoms. Therefore, in this simulation, the influence of random insertion position and box size on diffusion behavior is not considered. The potential function used is the MEAM potential function [33], which can well describe the interactions between various types of atoms in the Fe-C-Si alloy system. In the isothermal and isobaric (NPT) system, the initial temperature is set to be 300 K, and the temperature is increased at a rate of 1 × 10¹¹ K/s. To obtain an equilibrium structure, the Fe-C-Si alloy system was relaxed by the NPT system for 10,000 steps with a time step of 0.001 ps after reaching the preset temperature, and the mean-square displacements (MSD) of the C and Si atoms were calculated by running the NVT system for 200,000 steps to characterize the diffusion behavior of the atoms. Radial distribution function (RDF) [34] and common neighbor analysis (CNA) [35] in the visualization software OVITO (Open Visualization Tool, version 2.9.0) were used to characterize the phase transition process.
The mean-square displacement (MSD) of the atom is obtained by molecular dynamics calculation, and the expressions of the mean-square displacement and diffusion coefficient are defined as (1) and (2), respectively:
MSD ( t ) = 1 N ( t = 1 N [ r i ( t ) r i ( 0 ) ] 2 )
D self = lim t 1 6 N · t ( t = 1 N [ r i ( t ) r i ( 0 ) ] 2 )
where Dself is the self-diffusion coefficient of particles, N is the total number of particles, t is time, ri(t) and ri(0) are the positions of particles at t and t0, respectively.
Combining Equations (1) and (2), the self-diffusion coefficient and mean azimuthal shift relationship can be obtained as (3). According to Equation (3), the mean-square displacement is linearly correlated with the diffusion coefficient, and the self-diffusion coefficient can be obtained according to its slope [36].
D self = lim t 1 6 t MSD

2.2. Experimental Materials and Methods

The solid-state decarburization experiments were carried out on thin strips with dimensions of 55 mm × 65 mm × 1 mm, with the compositions shown in Table 1.
To determine the phase composition of the sample, the Fe-C-Si thin strip sample before decarburization experiment was detected by XRD. The diffraction results are shown in Figure 2. The composition of the sample was detected under the electron microscope and the microstructure of the initial sample was observed, as shown in Figure 3.
Before decarburization, the sample is composed of ferrite phase and Fe3C phase. The C in the matrix mainly exists in the form of solid solution carbon and cementite (Fe3C), while the Si in the matrix exists in the form of solid solution. The composition of the sample is Fe, Si, C. The microstructure of the sample is mainly ferrite and pearlite (a layered composite of thin layers of ferrite and cementite alternately laminated).
The solid-state decarburization experiment was carried out in Ar-H2O-H2 atmosphere. The solid-state decarburization experiment was completed in a controllable atmosphere decarburization furnace. The furnace structure is shown in Figure 4. Before the decarburization experiment, the furnace needs to be washed by repeatedly vacuuming and charging Ar. During the heating process of the decarburization furnace, the flow rate of Ar gas into the furnace is 180 mL·min−1. When the temperature rises to the predetermined decarburization temperature, adjust the gas flow in the furnace to the flow required for the experiment (20% H2 + H2O + Ar mixed gas, with the total flow set at 1500 mL·min−1). By adjusting the PH2O/PH2 of the gas mixture, the water vapor in the atmosphere is used to react with the carbon on the surface of the Fe-C-Si alloy in a redox reaction to decarburize it.

3. Results and Analysis

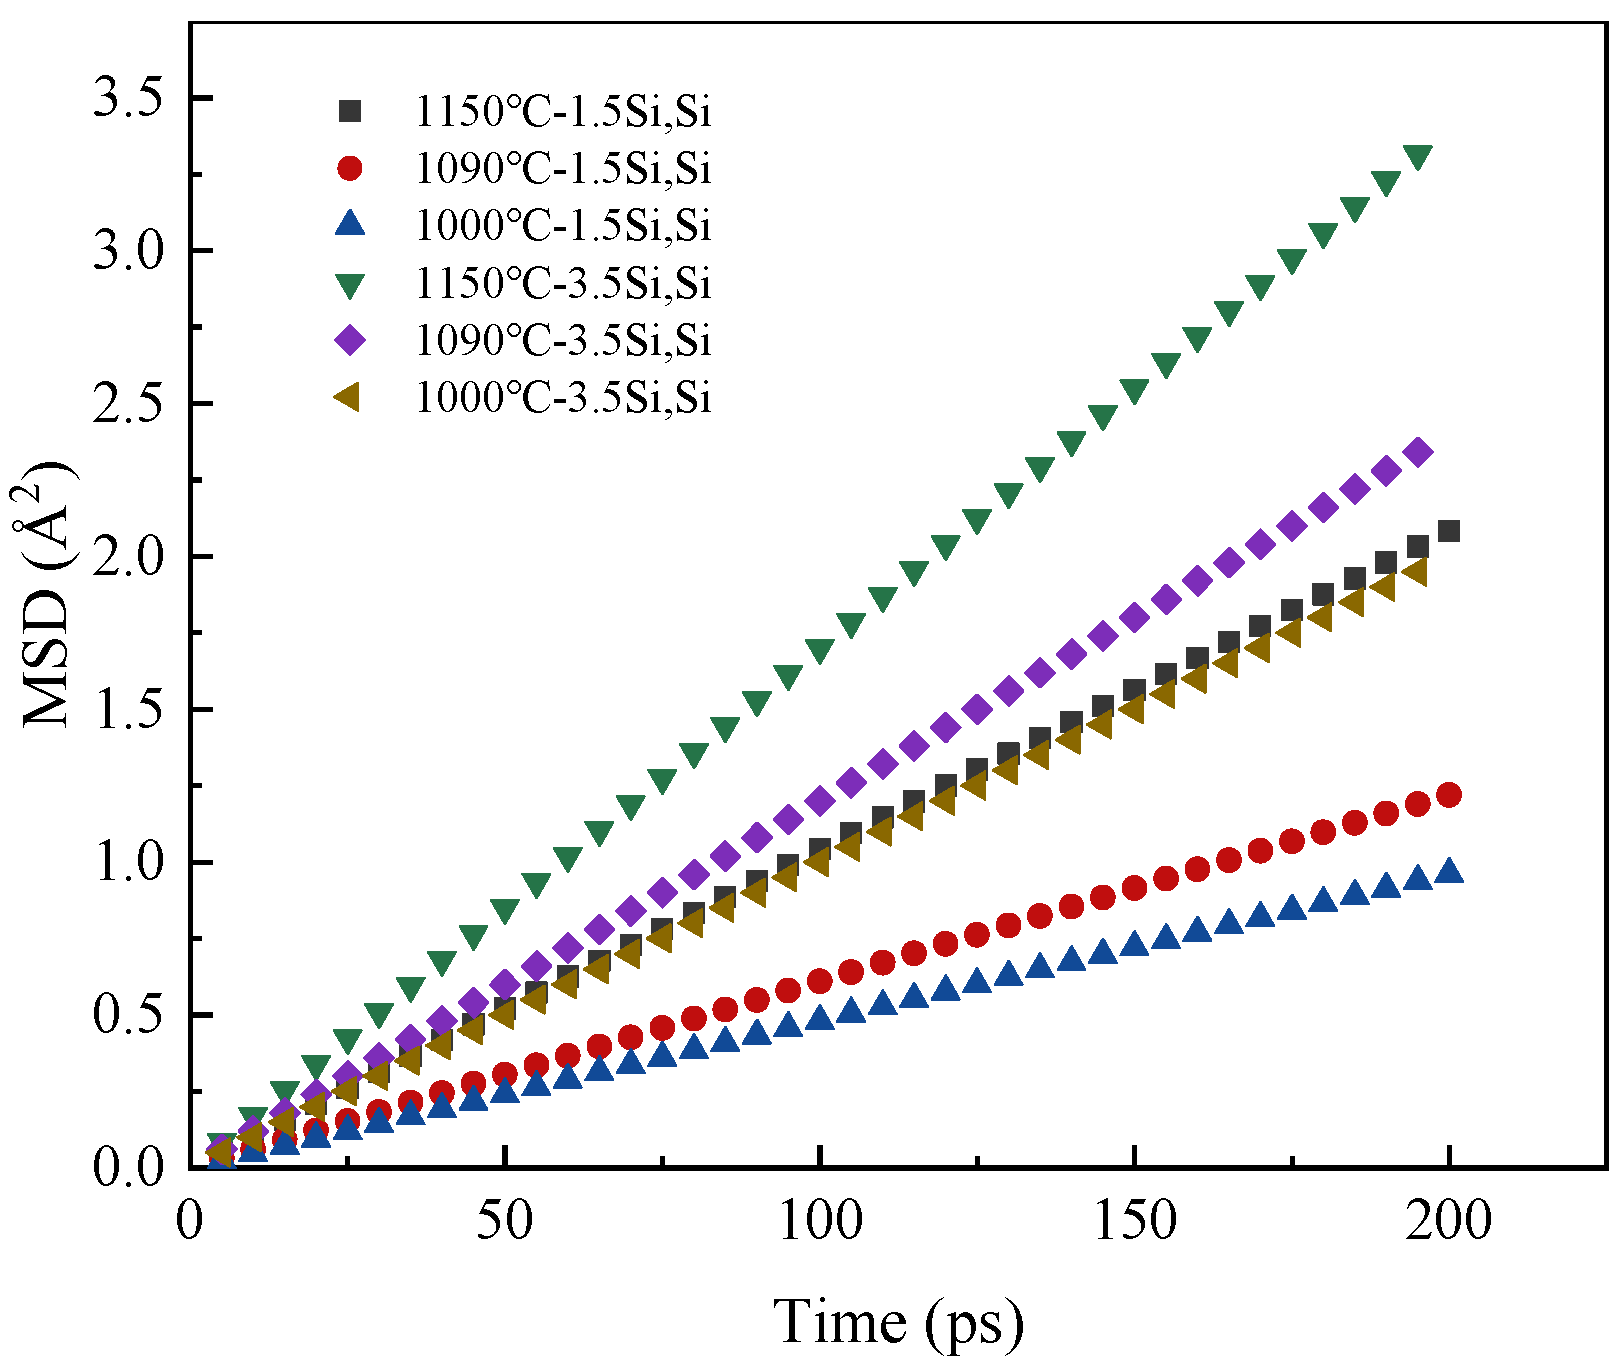
3.1. Effect of Temperature on Diffusion Behavior

According to the expression of diffusion coefficient, the diffusion coefficient has an exponential relationship with temperature. The diffusion coefficient increases with the increase in temperature, which accelerates the diffusion of carbon from the substrate to the surface. On the other hand, increasing the temperature is also beneficial to improve the reaction rate of surface decarburization. To explore the effect of temperature on decarburization of Fe-C-Si thin strips, intermittent experiments were carried out at 1000 °C, 1090 °C, 1150 °C and 1300 °C, respectively. Taking 1 mm thick Fe-0.18% C-3.5%Si thin alloy strip as the object of study, the atmosphere condition PH2O/PH2 = 0.31, the content of mixed gas H2 is 20%, the flow rate of mixed gas is 1500 mL·min−1, and the decarburization time is 5–70 min. The experimental results of the decarburization were obtained as shown in Figure 5.
It can be seen from Figure 5 that the surface oxidation is relatively serious at 1300 °C to form a dense oxide layer and peel off at room temperature after decarburization, so the experimental results under this condition will not be discussed. At 1150 °C, decarburization stagnated after 40 min of decarburization, and the carbon content did not change. At 1090 °C, the decarburization process tended to be gentle until 50 min, while it tended to be gentle at 1000 °C for 60 min. In the range of 1000 to 1150 °C, the carbon content at the decarburization stagnation is basically the same. It shows that under the same decarburization time, the higher the temperature, the faster the decarburization rate and the better the decarburization effect.
To verify the experimental results, molecular dynamics was used to simulate the diffusion behavior of C at different temperatures. Figure 6 shows the variation in the crystal structure with temperature and Figure 7 shows the radial distribution function of the Fe-0.18% C-3.5% Si system at different temperatures during the heating process. The radial distribution function is the variation in the particle density with distance and can be used to describe the atomic structure as ordered or disordered [37]. When the crystal structure of the system changes, its radial distribution function curve will change. Figure 8 shows the mean-square displacement of C at different temperatures. The diffusion coefficients of C at 1150 °C, 1090 °C, and 1000 °C were calculated from Equation (3) to be 6.87 × 10⁻¹¹ m2/s, 3.92 × 10⁻¹¹ m2/s, and 3.15 × 10⁻¹¹ m2/s, respectively. From Figure 6, Figure 7 and Figure 8, it can be seen that below 800 °C, the matrix is mostly a tightly arranged BCC structure, and the migration rate of C is low. When the temperature is higher than 800 °C, with the increase in temperature, the atomic movement intensifies, and the crystal structure changes from ferrite to austenite + ferrite. The violent motion of the atoms causes them to leave their original positions and most of the crystal structure is destroyed, forming a disordered atomic structure, which promotes the diffusion of C, i.e., the diffusion coefficient increases.

3.2. Verification of Simulation Results Combined with Decarburization Kinetics

In the decarburization process, surface decarburization, internal diffusion of carbon in the matrix, and oxide layer growth are the three key aspects of the decarburization process in thin strips of Fe-C-Si alloys; any of them may become the main limiting aspect. In their study of the mechanism of decarburization of Fe-C alloys, Hou et al. [38] derived mathematical expressions for the internal diffusion-controlled rate of carbon and expressions for the diffusion-controlled rate mechanism under certain conditions of surface carbon content, respectively. When the carbon content on the surface of the strip is lower than the concentration within the matrix, it is assumed that the intra-matrix diffusion of carbon within the strip is the only rate limiting aspect of the entire decarburization process. Fick’s first law and mass balance can be used to simplify the analysis and obtain the following expression:
[ % C ] t = [ % C ] 0 k t 1 / 2 + k t
where:
  • [%C]0—initial carbon content, wt%;
  • k, k′ are the coefficients and their expressions are, respectively:
k = 2 ( a + b ) a b k 1 k 2 = 2 ( a + b ) a b 2 D ρ ( C 2 C 3 ) [ C 1 1 2 ( C 2 + C 3 ) ]
k = 4 k 1 2 k 2 a b k 1 k 2 = 8 D a b ρ ( C 2 C 3 )
When the diffusion of carbon within the thin strip is the rate-controlled part of the whole decarburization process, the variation in carbon content can be described approximately by Equation (4). After decarburization for 30 min, the limiting link is mainly the growth of oxide layer, which is not suitable for fitting the carbon diffusion mechanism. Therefore, only the decarburization results at different temperatures 30 min before decarburization in Figure 3 are fitted according to Formula (4), and the fitting results are shown in Figure 9. The fitting expressions are shown in Table 2.
According to Formulas (5) and (6), k is proportional to D1/2 and k′ is proportional to D. It is known that the longer the decarburization time k′ is the more decisive, then k′ can be used to represent D.
From the expression for the diffusion coefficient of solute atoms, it can be seen that the diffusion coefficient D is exponentially related to temperature, and the diffusion coefficient increases rapidly as the temperature increases:
D = D 0 exp ( Q RT )
Taking logarithms on both sides of the equal sign of Equation (7) simultaneously yields the following linear equation:
ln D = ln D 0 Q R 1 T
As shown in Figure 10, lnD is linearly related to the inverse of temperature 1/T in semi-logarithmic coordinates, and the fitting parameters are obtained as follows:
D 3.5 Si ,   C = 7.84 × 10 9 exp ( 48686.7 RT ) m 2 · s 1 ,   Q = 48.7   kJ / mol , D 3.5 Si ,   C ,   MD = 8.69 × 10 9 exp ( 47306.7 RT ) m 2 · s 1 ,   Q = 47.3   kJ / mol .
D is calculated from decarburization experiments and DMD is calculated from molecular dynamics simulations. It can be seen that the simulation results are in agreement with the experimental results, the diffusion activation energy Q is basically the same, and the molecular dynamics simulation results are credible.

3.3. Effect of Carbon and Silicon Diffusion on Oxide Growth

As can be seen from Figure 5, the carbon content no longer decreases after 40 min of decarburization at 1150 °C. It was experimentally deduced that Fe-C-Si alloys are related to the growth of oxide layer during the solid-state decarburization [39]. The higher Si content in the matrix can improve the activity of C, and the diffusion coefficient of C in the matrix is much higher than that of Si. Therefore, there is a competitive oxidation relationship between C and Si elements during the decarburization process. The oxide layer is too thick in the late stage of decarburization, which hinders the diffusion of C to the surface of the thin strip, thus leading to the stagnation of decarburization.
To verify the experimental inference, molecular dynamics simulations were used to calculate the diffusion coefficients of Si at different temperatures, with Si contents of 1.5 wt% and 3.5 wt%, respectively. The mean-square shifts of Si at different temperatures with Si content of 1.5 wt% and 3.5 wt% are shown in Figure 11. The diffusion coefficients of Si at 1150 °C, 1090 °C, and 1000 °C for Si content of 3.5 wt% were calculated from Equation (3) to be 2.83 × 10⁻¹¹ m2/s, 2 × 10⁻⁷ cm2/s, 1.67 × 10⁻¹¹ m2/s, and the diffusion coefficients of Si for Si content of 1.5 wt% were 1.73 × 10⁻¹¹ m2/s, 1.02 × 10⁻¹¹ m2/s, and 8.02 × 10⁻¹² m2/s, respectively. From Equation (8), the relationship between lnD and 1/T is shown in Figure 12. After fitting, the expression of Si diffusion coefficient can be obtained when the Si content is 1.5 wt% and 3.5 wt%, respectively.
D 3.5 Si ,   Si = 8.54 × 10 10 exp ( 33089.7 RT ) m 2 · s 1 ,   Q = 33.1   kJ / mol , D 1.5 Si ,   Si = 2.06 × 10 9 exp ( 46641.5 RT ) m 2 · s 1 ,   Q = 46.6   kJ / mol .
It can be seen that the diffusion coefficient of C is greater than the diffusion coefficient of Si at different temperatures. C diffuses to the surface before Si, and C consumes a large amount of O. A small amount of O combines with the Si that later diffuses to the surface to form SiO2, which hinders the diffusion of C and leads to stagnation in the later stages of decarburization. In the previous study on the effect of Si content on the growth of the oxide layer, it was found that, other conditions being equal, different Si contents resulted in large differences in the morphology of the oxide layer.
When the silicon content is 1.5 wt%, the SEM backscatter micrographs and EDS maps of oxide layer evolution under different decarburization times are shown in Figure 13. The SEM micrographs show that the structure and morphology of the oxide layer are the same under different decarburization times. Taking the EDS maps of oxide layer after decarburization for 40 min as an example, the structure and element distribution of oxide layer were explored (The same below). The oxide layer of the sample section is composed of small granular circular SiO2 and is highly dispersed. With the increase in decarburization time, the oxide layer thickens obviously. When the Si content is 1.5 wt%, the diffusion coefficient of Si is very small, the migration rate is too slow, and the remaining o will oxidize when encountering Si in the matrix; it cannot aggregate to form banded SiO2, which can only be highly dispersed.
When the silicon content is 3.5 wt%, the SEM backscatter micrographs and EDS maps of oxide layer evolution under different decarburization time is shown in Figure 14. After decarburization, an obvious continuous strip of SiO2 was formed at the junction of the substrate and the oxide layer, and spherical oxides were distributed in the middle of the oxide layer, with large scale and small quantity. It can be seen that when the content of Si is 3.5 wt%, the diffusion coefficient of Si is large, and the migration speed to the surface is faster. After diffusion to the near surface, it combines with the remaining o to form SiO2. With the increase in decarburization time, SiO2 gradually aggregates to form an obvious continuous strip of SiO2.

3.4. Effect of the Phase Transition on Diffusion Behavior

In the middle and late decarburization period (30–40 min) before decarburization reached the stagnation state, there was a process of rate increase at different temperatures (Figure 5). To analyze the reasons for the increase in the rate, FactSage software (FactSage 8.1.0) was used to draw the Fe-C-Si ternary phase diagram, and the decarburization process was analyzed, as shown in Figure 15.
At 30 min of decarburization, the carbon content was 0.0416 wt% at 1150 °C. At this time, the organization in the strip at high temperature was mainly ferrite and austenite. When decarburized for 40 min, the carbon content was 0.0164 wt%. At this time the organization is ferrite at high temperatures. The process of ferrite + austenite biphasic transformation to pure ferrite phase exists between 30 and 40 min, as shown in Figure 16. Similarly, the phase transformation exists between 30 and 50 min at 1090 °C, as shown in Figure 17. At 1000 °C, the phase transformation process is completed at 60 min of decarburization. Therefore, it can be deduced that at the middle stage of decarburization (corresponding to the 30th or 40th min at different temperatures), the thin strip matrix undergoes a crystallographic transition from the face-centered cubic lattice austenite to body-centered cubic lattice ferrite. The diffusion coefficient of C in ferrite is much larger than that in austenite, which leads to an increase in the diffusion rate by the phase change and thus a window of high decarburization rate before decarburization stagnation.
To verify this inference, molecular dynamics simulations were used to calculate the diffusion coefficients of C in the ferrite and austenite lattices, respectively. The mean-square displacement of C in ferrite and austenite lattices is shown in Figure 18. After calculating the diffusion coefficients from Equation (3), it can be seen that the diffusion coefficients of C in ferrite lattice are 9.8 × 10⁻¹¹ m2/s and in austenite lattice are 1.7 × 10⁻¹¹ m2/s. The diffusion coefficient of C in ferrite is greater than in austenite at the same temperature. It can be explained that the phase transformation of the thin strip matrix from the face centered cubic lattice austenite to body centered cubic lattice ferrite occurred in the experiment, and the diffusion rate increased due to the phase transformation, and then the decarburization rate increased before decarburization stagnation.

3.5. Effect of Silicon Content on Diffusion Behavior

To study the effect of silicon content on decarburization of the thin alloy strip, experiments were carried out on 1 mm thick Fe-0.18C-Si thin strip specimens with silicon content of 1.5 wt% and 3.5 wt%, respectively. The atmosphere condition was PH2O/PH2 = 0.31, the gas flow rate was set at 1500 mL·min−1, and the decarburization temperature was 1150 °C. The experimental results after decarburization are shown in Figure 19.
For the same decarburization time, the amount of decarburization was greater in the first 40 min for Si = 3.5 wt% compared to Si = 1.5 wt%. The mechanism behind this lies in the fact that silicon elements can enhance the activity of dissolved carbon in the alloy. As the silicon content increases, the diffusion activation energy for carbon decreases, leading to an increase in the rate of carbon diffusion, thereby accelerating the decarburization process.
To validate this hypothesis, molecular dynamics simulations were employed to calculate the diffusion coefficient of carbon at various temperatures with a silicon content of 1.5 wt%. The mean-square displacement of carbon within the matrix at different temperatures with a silicon content of 1.5 wt% is depicted in Figure 20. Using Equation (3), the calculated diffusion coefficients for C with a silicon content of 1.5 wt% at temperatures of 1150 °C, 1090 °C, and 1000 °C are 2.64 × 10⁻¹¹ m2/s, 1.79 × 10⁻¹¹ m2/s, and 1.25 × 10⁻¹¹ m2/s, respectively. The relationship between lnD and 1/T is shown in Figure 21, and fitting the data yielded the expression for the diffusion coefficient of C at a silicon content of 1.5 wt% as follows:
D 1.5 Si ,   C = 8.69 × 10 10 exp ( 55204.9 RT ) m 2 · s 1 ,   Q = 55.2   kJ / mol .
Luo et al. [40] and Yang et al. [41], in their investigations of decarburization in silicon steel, solely considered the diffusion coefficient of C in the iron matrix, without exploring the impact of varying amounts of Si on the C diffusion. It is known that the diffusion activation energy of C in γ-Fe is 140 kJ·mol−1. Combined with the above molecular dynamics simulation of the diffusion coefficient of C when the Si content is 3.5 wt%, it can be seen that the diffusion activation energy of C decreases with the increase in matrix silicon content. The diffusion coefficient of C increases, which is beneficial for the promotion of decarburization.

4. Conclusions

The diffusion behavior of carbon in the decarburization process of 1 mm thick 0.18 wt%C—(3.5 wt%, 1.5 wt%) Si thin strip was studied by decarburization experiment, FactSage thermodynamic calculation, and molecular dynamics simulation. The research conclusions are as follows:
(1)
The experimental results show that with the same decarburization time, the higher the temperature (1000–1300 °C), the faster the decarburization rate; Results from molecular dynamics simulations indicate that at temperatures below 800 °C, atoms maintain a tightly packed bcc structure, resulting in a low migration rate of carbon. When the temperature is higher than 800 °C, the atoms move violently and the crystal structure is destroyed. Some atoms tend to be disordered, the migration rate of C is high, and the diffusion coefficient increases. The thin strip substrate undergoes a lattice transformation from face-centered cubic lattice austenite to body-centered cubic lattice ferrite. Notably, the diffusion coefficient of C in ferrite significantly exceeds that in austenite, giving rise to an observed enhancement in decarburization rate just before decarburization stagnation (30 min to 50 min);
(2)
Based on a decarburization model that considers carbon diffusion within the matrix as the rate-limiting step in the early stages of decarburization, the diffusion coefficient for carbon was determined. Subsequently, the diffusion activation energy for C in the Fe-3.5% Si-C alloy matrix was calculated as Q = 48.7 kJ·mol−1. Molecular dynamics simulations yielded a diffusion activation energy of 47.3 kJ·mol−1 for C in the Fe-3.5% Si-C alloy matrix, which closely aligns with experimental findings;
(3)
The diffusion coefficients of carbon were found to be D3.5Si, C = 7.84 × 10⁻⁹ exp(−48,686.7/RT) m2/s and D1.5Si, C = 8.69 × 10⁻¹⁰ exp(−55,204.9/RT) m2/s when the silicon content was 3.5 wt% and 1.5 wt%, respectively. In comparison to Si = 1.5 wt%, at the same decarburization time, Si = 3.5 wt% exhibited a higher decarburization rate during the initial 40 min. At a decarburization temperature of 1150 °C, the diffusion coefficients of C were determined to be 2.64 × 10⁻¹¹ m2/s and 6.87 × 10⁻¹¹ m2/s for Si contents of 1.5 wt% and 3.5 wt%, respectively. This suggests that an increase in silicon content leads to a reduction of the activation energy for the C diffusion and an increase in the carbon diffusion coefficient, thereby promoting the decarburization process;
(4)
Molecular dynamics simulations reveal that the diffusion coefficients of silicon were determined to be D3.5Si, Si = 8.54 × 10⁻¹⁰ exp(−33,089.7/RT) m2/s and D1.5Si, Si = 2.06 × 10⁻⁹ exp(−46,641.5/RT) m2/s when the Si content was 3.5 wt% and 1.5 wt%, respectively. At different temperatures, the diffusion coefficient of carbon was consistently higher than that of Si. Carbon diffuses to the surface before Si, consuming a significant amount of oxygen. When the Si content is 3.5 wt%, the diffusion coefficient of Si is relatively high, allowing it to diffuse to the near-surface region, where it combines with the remaining O to form a continuous banded SiO2 structure. In contrast, when the Si content is 1.5 wt%, the Si diffusion coefficient is significantly lower, causing the remaining O to diffuse within the matrix and oxidize upon encountering Si. In this case, SiO2 does not aggregate into banded structures but instead exhibits a highly-dispersed distribution.

Author Contributions

Methodology, L.A.; software, L.W. and G.Z.; validation, L.W., L.A. and L.H.; formal analysis, Y.Z. and C.S.; data curation, Y.Z. and G.Z.; writing—original draft preparation, L.W.; and writing—review and editing, L.A. and L.H. All authors have read and agreed to the published version of the manuscript.

Funding

This study was supported by the Natural Science Foundation of Hebei Province (E2021209101; E2022209112); Central Government Guided Local Science and Technology Development Fund Project (236Z1006G); Science and Technology Research Projects of Higher Education Institutions in Hebei Province (ZD2022125); Tangshan Talent Funding Project (A20220212).

Data Availability Statement

Data are contained within the article.

Conflicts of Interest

The authors declare no conflict of interest.

References

  1. Wu, K.M. Production process and development of non-oriented electrical steel. China Metall. 2012, 22, 2430–2435. [Google Scholar]
  2. Zhang, Y.; Zhu, G.H.; Wu, Q. Development prospect of CSP production process for non-oriented electrical steel. Mod. Metall. 2013, 41, 1–4. [Google Scholar]
  3. Xiang, L.; Chen, S.L.; Pei, Y.H. Present situation and research progress of electrical steel produced by thin slab continuous casting and rolling in China. In Proceedings of the 11th China Iron and Steel Annual Conference, Beijing, China, 27 May 2017. [Google Scholar]
  4. Hong, L.K.; Ai, L.Q.; Cheng, R. Experimental study on Decarburization of Fe-C alloy strip by gas-solid reaction. Steel 2016, 51, 27–31. [Google Scholar]
  5. Mcdonald, C. Solid state steelmaking: Process technical and economic viability. Ironmak. Steelmak. 2012, 39, 487–489. [Google Scholar] [CrossRef]
  6. Park, J.O.; Long, T.V.; Sasaki, Y. Feasibility of solid-state steelmaking from cast iron-decarburization of rapidly solidified cast iron. Tetsu Hagane 2012, 98, 151–160. [Google Scholar] [CrossRef]
  7. Lee, W.H.; Park, J.O.; Lee, J.S. Solid state steelmaking by decarburization of rapidly solidified high carbon iron sheet. Ironmak. Steelmak. 2012, 39, 530–534. [Google Scholar] [CrossRef]
  8. Liang, M.; Cheng, J.; Lin, W.M. Thermodynamic Study on Solid Phase Decarburization of High Carbon Ferromanganese Powder. Ferroalloy 2009, 40, 14–17. [Google Scholar]
  9. He, H.Q.; Wei, X.J.; Kang, G.Z. Study on solid state decarburization of high carbon ferromanganese in carbon dioxide atmosphere. Ferroalloy 2010, 41, 5–8. [Google Scholar]
  10. Li, Q. Gas Solid Decarburization of Fe—3.2% C Alloy Strip; North China University of Technology: Beijing, China, 2017. [Google Scholar]
  11. Li, Y.Q. Effect of Atmosphere Conditions on Gas Solid Reaction Decarburization of Iron Carbon Alloy Strip; North China University of Technology: Beijing, China, 2018. [Google Scholar]
  12. Cheng, R. Kinetic Analysis of Decarburization of Fe-C Alloy Strip by Gas-Solid Reaction; North China University of Technology: Beijing, China, 2018. [Google Scholar]
  13. Ai, L.Q.; Hou, Y.B.; Hong, L.K. Kinetics of gas-solid decarburization of Fe-C alloy strip in H2/H2O atmosphere. J. Eng. Sci. 2021, 43, 816–824. [Google Scholar]
  14. Zhou, M.J. Decarburization Kinetics of Fe-C Alloy Strip by Gas-Solid Reaction in Ar-CO-CO2 Atmosphere; North China University of Technology: Beijing, China, 2022. [Google Scholar]
  15. Guo, Y.; Dai, F.Q.; Gao, Y. Study on decarburization process model of grain-oriented silicon steel. In Proceedings of the 2016 Seminar on Production Technology and Application of Domestic High Performance Electrical Steel, Dalian, China, 25 August 2016. [Google Scholar]
  16. Yang, S.Z.; Dai, F.Q.; Guo, Y. Numerical simulation analysis on decarburization process of grain-oriented silicon steel. J. Wuhan Univ. Sci. Technol. 2016, 39, 253–258. [Google Scholar]
  17. Hao, J.J.; Chen, J.; Han, P.D. Solid Phase Decarburization Kinetics of High-Carbon Ferrochrome Powders in the Microwave Field. Steel Res. Int. 2014, 85, 461–465. [Google Scholar] [CrossRef]
  18. Larssen, T.A.; Senk, D.; Tangstad, M. Reaction Rate Analysis of Manganese Ore Prereduction in CO-CO2 Atmosphere. Metall. Mater. Trans. B 2021, 52, 2087–2100. [Google Scholar] [CrossRef]
  19. Li, H.; Liang, J.L.; Li, Y.G. Study on the diffusion behavior of Si during annealing. Ind. Heat. 2014, 43, 30–32+41. [Google Scholar]
  20. Zhu, Y.B. Mathematical model of decarburization of steel during heating. Spec. Steel 1989, 3, 1–4. [Google Scholar]
  21. Zhang, C.; Xiang, L.; Dong, Y.L. Experimental study on decarburization annealing of grain-oriented silicon steel. J. Iron Steel Res. 2009, 21, 55–58. [Google Scholar]
  22. Agren, J. Computer simulations of the austenite/ferrite diffusional transformations in low alloyed steels. Acta Metall. 1982, 30, 841–851. [Google Scholar] [CrossRef]
  23. Zhou, Y.Q.; Ai, L.Q.; Hong, L.K. Experimental study on Decarburization of Fe-C-Si alloy in solid state. J. Mater. Metall. 2023, 22, 45–51+66. [Google Scholar]
  24. Liu, Y.B.; Zhang, W.; Tong, Q. Effects of Si and Cr on complete decarburization behavior of high carbon steels in atmosphere of 2 vol.% O2. J. Iron Steel Res. 2016, 23, 1316–1322. [Google Scholar] [CrossRef]
  25. Li, N. Molecular Dynamics Simulation of Tensile Behavior of Ti2Cu Inter Metallics; Changchun University of Technology: Changchun, China, 2022. [Google Scholar]
  26. Wang, W.T.; Wang, H.; Lu, X.G. Molecular dynamics simulation of tracer diffusion coefficient of liquid Ni Al Binary Alloy. Shanghai Met. 2021, 43, 108–111. [Google Scholar]
  27. Tapasa, K.; Barashev, A.V.; Bacon, D.J. Computer simulation of carbon diffusion and vacancy–carbon interaction in α-iron. Acta Mater. 2007, 55, 1–11. [Google Scholar] [CrossRef]
  28. Ye, Y.J.; Zhang, L.T.; Cheng, L.F.; Xu, Y.D. Molecular dynamics simulation of diffusion behavior of amorphous Si-B-C system. J. Inorg. Mater. 2006, 21, 843–847. [Google Scholar]
  29. Sun, Y.C. Molecular Dynamics Simulation of Oxygen Isotope Diffusion in Molten SiO2; Nanjing University: Nanjing, China, 2012. [Google Scholar]
  30. Shi, X.T.; Gao, X.G.; Zhong, Y. Molecular dynamics simulation of oxygen diffusion in molten SiO2. J. Nanjing Univ. Aeronaut. Astronaut. 2021, 53, 821–826. [Google Scholar]
  31. Wang, G.L.; Yu, A.B.; Yuan, J.D. Molecular dynamics simulation of diamond/Ti hot press diffusion process. Surf. Technol. 2022, 51, 435–442. [Google Scholar]
  32. Timmerscheidt, A.T.; Appen, V.J.; Dronskowski, R. A molecular-dynamics study on carbon diffusion in face-centered cubic iron. Comput. Mater. Sci. 2014, 91, 235–239. [Google Scholar] [CrossRef]
  33. Aslam, I.; Baskes, M.I.; Dickel, D.E. Thermodynamic and kinetic behavior of low-alloy steels: An atomic level study using an Fe-Mn-Si-C modified embedded atom method (MEAM) potential. Materialia 2019, 8, 100473. [Google Scholar] [CrossRef]
  34. Allen, M.P.; Tildsley, D.J. Computer Simulation of Liquid; Oxford University Press: New York, NY, USA, 1987; Volume 28. [Google Scholar]
  35. Honeycutt, D.J.; Andersen, H.C. Molecular dynamics study of melting and freezing of small Lennard–Jones clusters. J. Chem. Phys. 1987, 91, 4950–4963. [Google Scholar] [CrossRef]
  36. Wang, S.G.; Liu, C.X.; Jian, Z.Y. Molecular dynamics simulation of diffusion coefficient of Al Cu alloy. J. Xi’an Technol. Univ. 2018, 38, 559–564. [Google Scholar]
  37. Ye, Q.; Zhao, S.J. Molecular dynamics simulation of continuous cooling transformation in Fe based alloys. Shanghai Met. 2012, 34, 9–12. [Google Scholar]
  38. Hou, Y.B. Decarburization of Fe-C Alloy by Staged Heating in CO-CO2 Atmosphere; North China University of Technology: Beijing, China, 2021. [Google Scholar]
  39. Zhou, Y.Q.; Ai, L.Q.; Hong, L.K. Evolution of oxide layer in solid decarburization process of Fe-C-Si alloy[J/OL]. Steel 2023. [Google Scholar]
  40. Luo, H.W.; Xiang, R.; Chen, L.F. Modeling decarburization kinetics of grain-oriented silicon steel. Chin. Sci. Bull. 2014, 59, 1778–1783. [Google Scholar] [CrossRef]
  41. Yang, S.Z. Study on Decarburization of Grain-Oriented Silicon Steel; Wuhan University of Science and Technology: Wuhan, China, 2016. [Google Scholar]
Figure 1. Fe-C Si alloy model.
Processes 11 03176 g001
Figure 2. XRD phase analysis of initial sample.
Processes 11 03176 g002
Figure 3. SEM backscatter micrograph and EDS map of the initial sample.
Processes 11 03176 g003
Figure 4. Solid-state decarburization furnace.
Processes 11 03176 g004
Figure 5. Decarburization process at different temperatures of PH2O/PH2 = 0.31.
Processes 11 03176 g005
Figure 6. Changes in crystal structure with temperature: (a) 500 °C; (b) 800 °C; (c) 1150 °C; (d) 1300 °C.
Processes 11 03176 g006
Figure 7. Radial distribution functions for different temperatures.
Processes 11 03176 g007
Figure 8. The variation in the average azimuth shift of C with temperature.
Processes 11 03176 g008
Figure 9. Fitting decarburization data at different temperatures.
Processes 11 03176 g009
Figure 10. Comparison of diffusion coefficient MD value of C with experimental value.
Processes 11 03176 g010
Figure 11. The change in average azimuth shift of Si with temperature.
Processes 11 03176 g011
Figure 12. The relationship between lnD and the reciprocal of temperature (1/T).
Processes 11 03176 g012
Figure 13. SEM micrographs and EDS maps of oxidation layer evolution under different decarburization time when silicon content is 1.5 wt%: a stands for EDS area; b stands for EDS point scan.
Processes 11 03176 g013
Figure 14. SEM micrographs and EDS maps of oxidation layer evolution under different decarburization time when silicon content is 3.5 wt%: a stands for EDS point scan.
Processes 11 03176 g014
Figure 15. Phase diagram of Fe-C-3.5Si alloy.
Processes 11 03176 g015
Figure 16. SEM micrographs of microstructure evolution with time at 1150 °C.
Processes 11 03176 g016
Figure 17. SEM micrographs of microstructure evolution with time at 1090 °C.
Processes 11 03176 g017
Figure 18. Mean-square displacement of different phase regions C.
Processes 11 03176 g018
Figure 19. Decarburization effect of different silicon contents.
Processes 11 03176 g019
Figure 20. Mean-square displacement of C at a Si content of 1.5 wt%.
Processes 11 03176 g020
Figure 21. The relationship between lnD and 1/T at a Si content of 1.5 wt%.
Processes 11 03176 g021
Table 1. Silicon steel composition (wt%).
SiCFeSPO
3.50.1896.32<0.02<0.027<0.066
1.50.1898.32<0.02<0.027<0.066
Table 2. Fitting Expressions.
Temperature (°C)ExpressionAdj. R-Square
1000[%C]t = 0.18 − 0.03499t1/2 + 000232t0.99989
1090[%C]t = 0.18 − 0.0414t1/2 + 000333t0.99929
1150[%C]t = 0.18 − 0.05279t1/2 + 00051t0.99705
Disclaimer/Publisher’s Note: The statements, opinions and data contained in all publications are solely those of the individual author(s) and contributor(s) and not of MDPI and/or the editor(s). MDPI and/or the editor(s) disclaim responsibility for any injury to people or property resulting from any ideas, methods, instructions or products referred to in the content.

