Article

Research on Contact Anchoring Theory and Contact Optimization of Underwater Pipeline Recovery Tools

1
College of Mechanical and Electrical Engineering, Harbin Engineering University, No. 145 Nantong Street, Nangang District, Harbin 150001, China
2
College of Mechanical Engineering, Inner Mongol University of Technology, No. 49 Aimin Street, Xincheng District, Huhhot 010051, China
*
Author to whom correspondence should be addressed.
Processes 2023, 11(11), 3166; https://doi.org/10.3390/pr11113166
Submission received: 17 September 2023 / Revised: 2 November 2023 / Accepted: 3 November 2023 / Published: 6 November 2023

Abstract

:
Technology for recycling abandoned undersea pipelines is crucial for lowering the cost of installing new submarine pipelines, polluting the ocean less, and improving recycling efficiency. A popular area of study is how to lessen the harm that underwater pipeline recycling instruments do to the inner wall of the pipeline during recycling. In order to recover pipelines, this study examines the anchoring theory and damage process of submerged pipeline recovery equipment. The effect of the contact body’s diameter and radius of the rounded corner on the depth of the pressed-in pipeline and the slip distance is examined using the contact body structure optimization design approach of the underwater pipeline recovery tool, which is based on a multi-objective genetic algorithm. Dynamic simulations of the insertion mechanism as a whole are performed using the Adams simulation program to make sure that the optimized contact body can exert enough contact force on the pipeline’s inner wall. According to the optimization results, the ideal design parameters are D = 57 mm and R = 11.5 mm. While still satisfying the criteria, the improved contact body has higher stability.

1. Introduction

One of the most popular means of shipping oil and gas by sea is through submarine pipelines, which have clear benefits in terms of reliability, economics, and efficiency [1]. The development of maintenance and operation technologies for underwater pipelines for the transfer of oil and gas has drawn interest from all around the world as maritime resources have grown [2]. Bad weather frequently occurs when laying undersea pipes, necessitating the suspension of operations and lowering the pipeline to the seafloor. When the weather improves, the pipeline must be recovered from the bottom. One key sign of the effectiveness of underwater pipeline installation is the ability of the equipment to retrieve submarine pipelines efficiently. The submarine pipeline recovery tool is typically inserted and locked into the submarine pipeline using a mechanical system. The better the non-destructive performance of the submarine pipeline recovery tool, the less damage the tool causes to the submarine pipeline during the lowering and lifting process. Reducing the undersea pipeline recovery tool’s damage to the pipeline’s inner wall is crucial for maximizing its performance, since this type of tool has gained significant attention in research due to its ability to perform work procedures with high efficiency and minimal damage.
Multiple optimization objectives that are connected to or even contradictory to one another frequently occur in real-world engineering issues, and it is typically hard to find a solution that makes every objective parameter optimal. Unlike single-objective problems, many practical situations include many objective functions that need to be optimized. Based on the resulting Pareto optimum set, designers may therefore choose the best design to solve a variety of multi-objective structural challenges [3]. The following are a few works on structural multi-objective optimization problems. Under the influence of hydrodynamic landslides, Guo X.S. et al. [4] improved the design and drag reduction of an undersea pipeline with honeycomb holes under the effect of hydrodynamic landslides by creating a functional link between the non-simulated parameters and two metrics. Gong H.X. et al. [5] established a design model using ANSYS software to optimize the hydraulic skirt pile gripper body and selected the optimal design using the fuzzy material element method. After optimization, the maximum equivalent force of the body was reduced by 14.75% and the volume of the body was reduced by 4.8%. Hou S.P. et al. [6] established a kriging-based RSM model by simulating a Latin hypercube sampling design using the screening and MOGA methods. Then, the optimal body shape of the vehicle was determined based on the relationship between each design variable of the vehicle and the output parameters of the vehicle. Liu F. et al. [7] developed a parametric finite element model based on the Patran command language code for optimizing the hull structure. The optimization process was executed on the Isight platform. On this basis, a linear dimensionless method was introduced to establish a weighted multi-objective function. Minimization of hull structure support weight and maximization of safety is achieved. To optimize the buoyancy module of a deepwater power umbilical, Yang et al. [8] employed a non-dominated sorting genetic algorithm to obtain a Pareto solution set through an evolutionary optimization process. Intuitionistic fuzzy set theory is applied to select the optimal compromise solution from the Pareto solution set.
ANSYS Workbench simulation software and Isight optimization software were used in this work to perform a multi-objective optimization of the contact body of the undersea pipeline recovery tool based on the Elliptic Basis Function approximation model. The De-sign of Experiments methodology’s Optimal Latin Hypercube was utilized for repeated sampling. Following a non-linear dynamics analysis of these sample points, an approximative model was constructed using the sampling data. The approximation model’s correctness was confirmed. The Pareto solution set was then obtained by optimizing the model with the Non-dominated Sorting Genetic Algorithm (NSGA-II). Ultimately, the multi-attribute decision-making process was used to choose the best compromise option among the Pareto solution set. Using Adams simulation software, the dynamics simulation of the entire insertion mechanism was performed to make sure that the optimized contact body could apply enough contact force to the inner wall of the pipe, ensuring the stability and dependability of the recovery process.

2. The Structure of the Subsea Pipeline Recovery Tool

This study examines the underwater pipeline recovery tool, which includes the primary insertion mechanism, hydraulic system, balancing mechanism, lifting mechanism, and other components. As seen in Figure 1a, the undersea pipeline is raised by the friction between its contact body and the inner wall of the pipeline, which is formed by the outward expansion of the mechanism’s primary insertion. An oblique force-gaining mechanism is used as the primary insertion mechanism to enlarge the pipeline. In order for the piston rod in the main insertion mechanism to force the propeller to move, the pipeline recovery tool initiates the oil source through the ROV. The propeller and contact body create an oblique force-gaining mechanism that causes the contact body to expand outward, making contact with the pipeline’s inner wall and completing the expansion process. The study portion was modeled as indicated in Figure 1b, and the paper’s major focus is the contact between the inner wall of the pipe and the contact body in the main insertion mechanism.

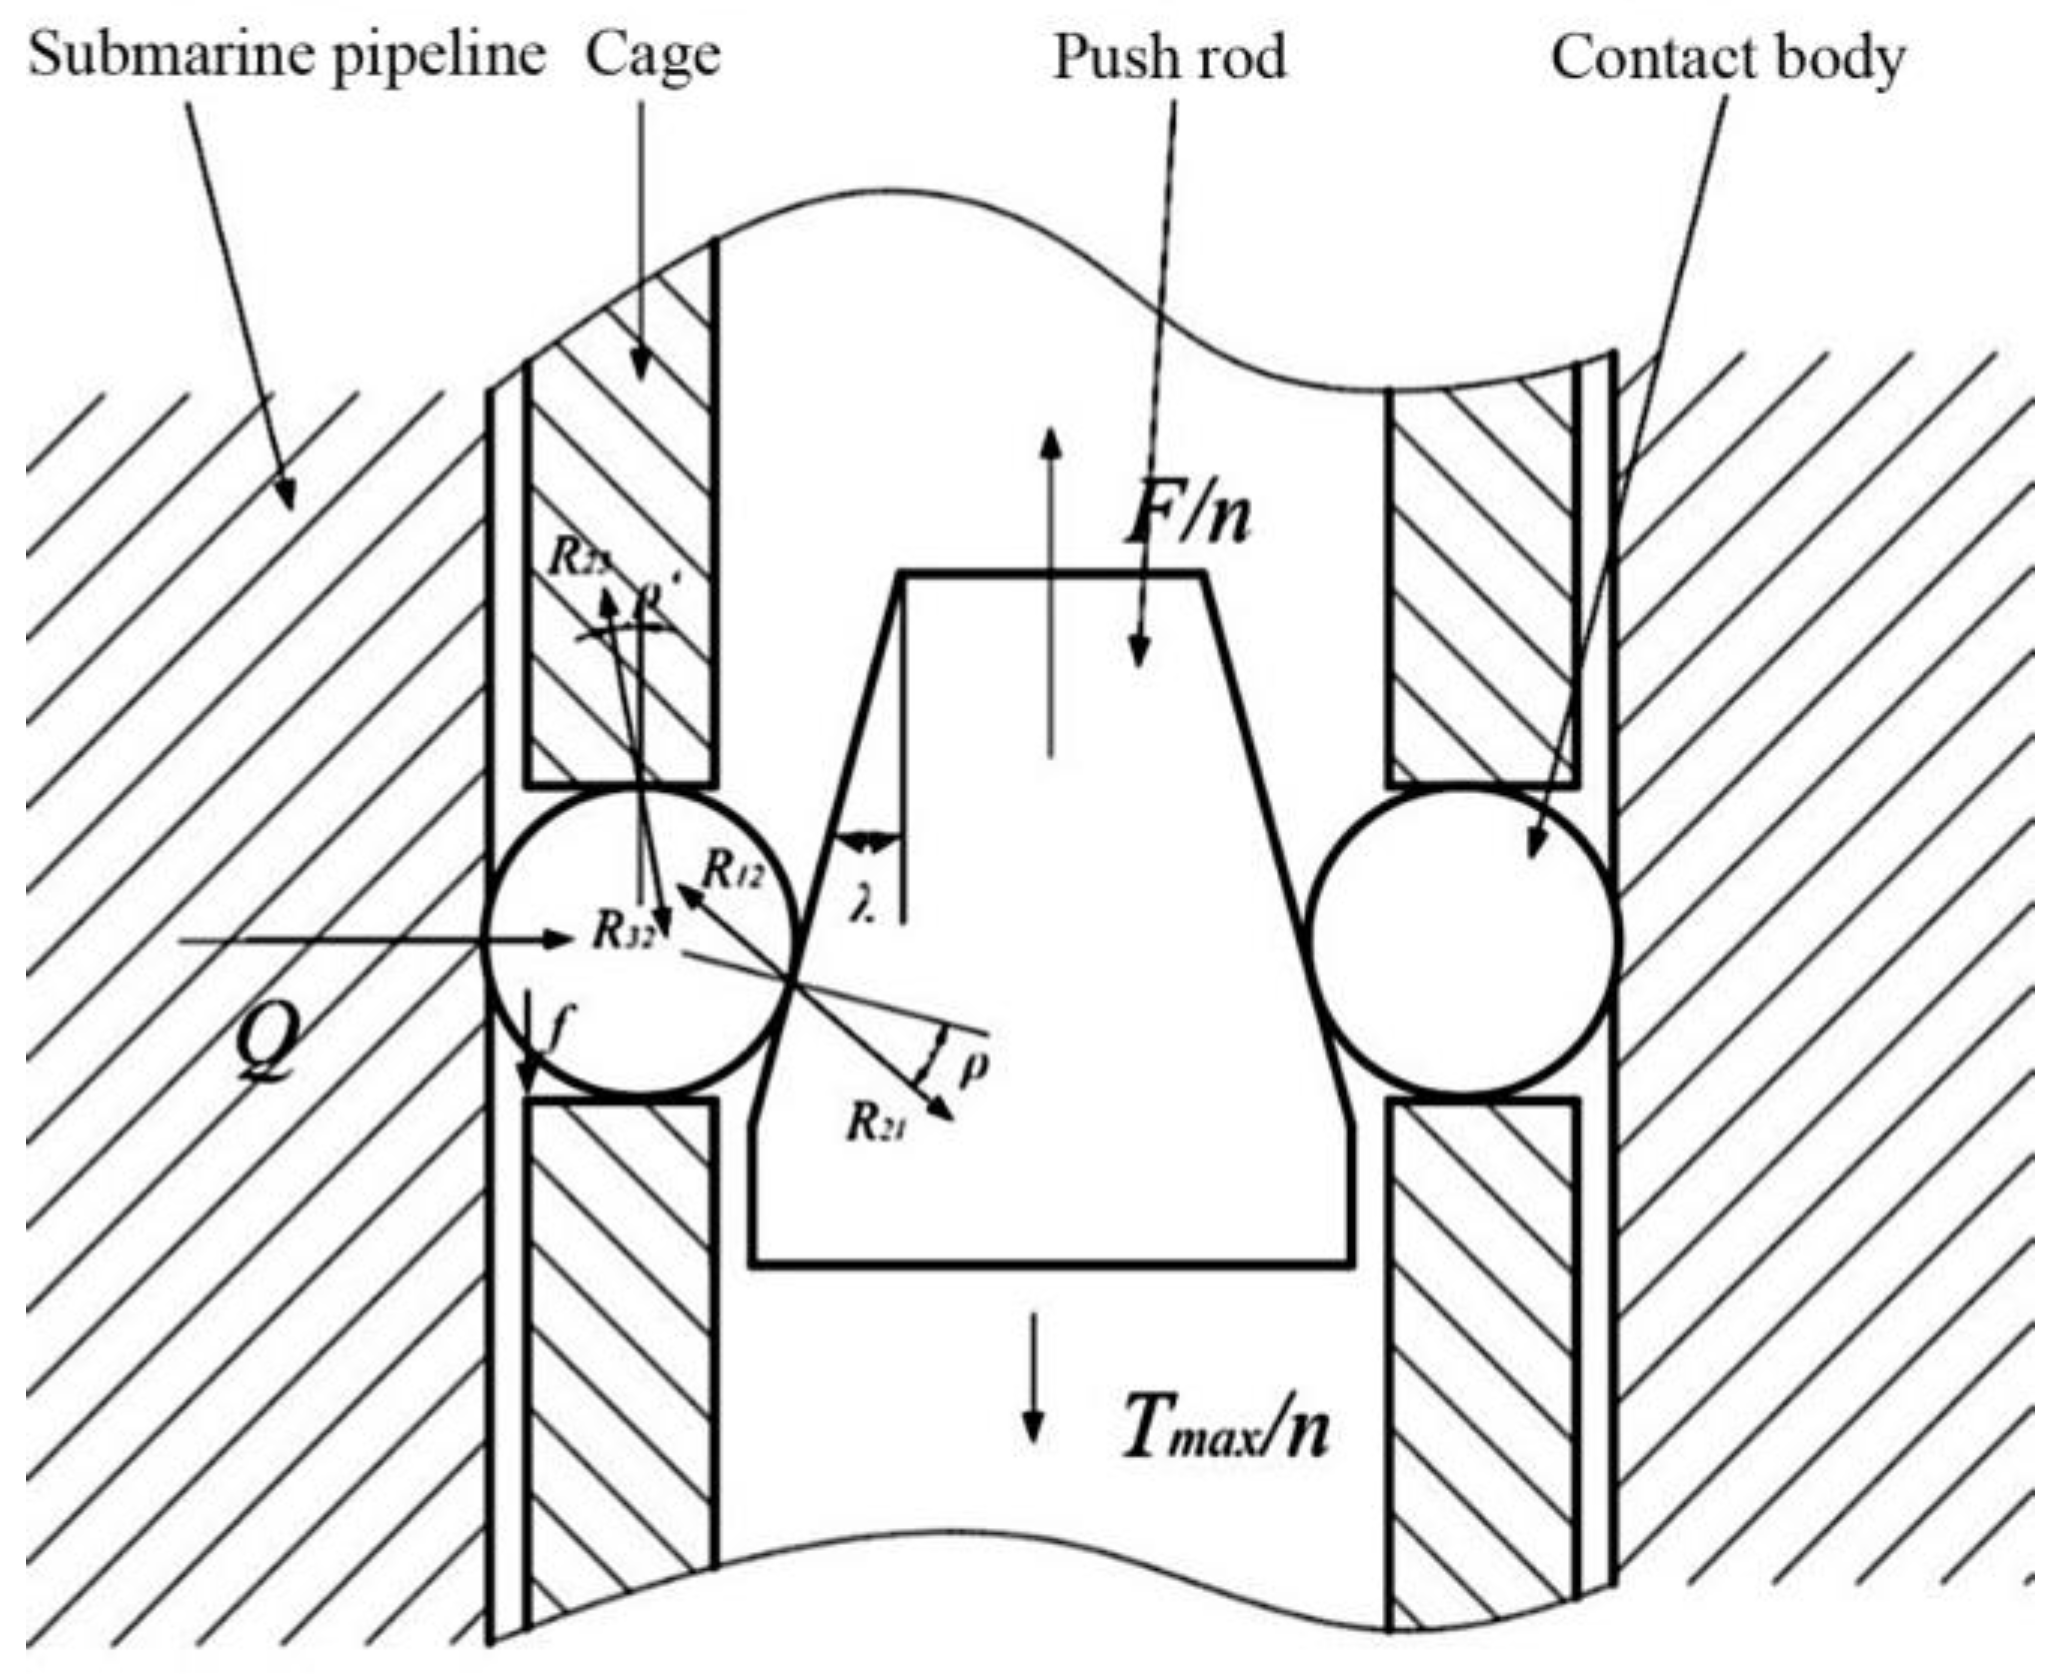
3. Contact Anchoring Theory Analysis

Anchorage theory has figured prominently in many studies. Based on the structural theory of inclined plane reinforcement and elastic-plastic mechanics, Zhang L. et al. [9] finished the anchoring device’s structural design. On the design of anchoring blocks, material choice, anchorage depth between the anchorage blocks and the inner wall of the pipe, and contact stress, theoretical and simulation studies have been done. The anchoring experiment confirms that the theoretical and simulation analysis was accurate. To examine the anchoring and suspension mechanics of slip inserts, Li T. et al. [10] uses the thick-walled cylinder theory and the wedge stress theory. The numerical outcomes demonstrate that the anchoring and suspension stresses (average stresses) of slip inserts can be analyzed using the wedge stress theory and the thick-walled cylinder theory, respectively. The structural strength of the object determines the damage during the anchoring phase of slip, whereas the structural shear strength determines the damage during the suspension period. In this paper, the study also utilizes the anchoring theory in the process of recycling pipes.

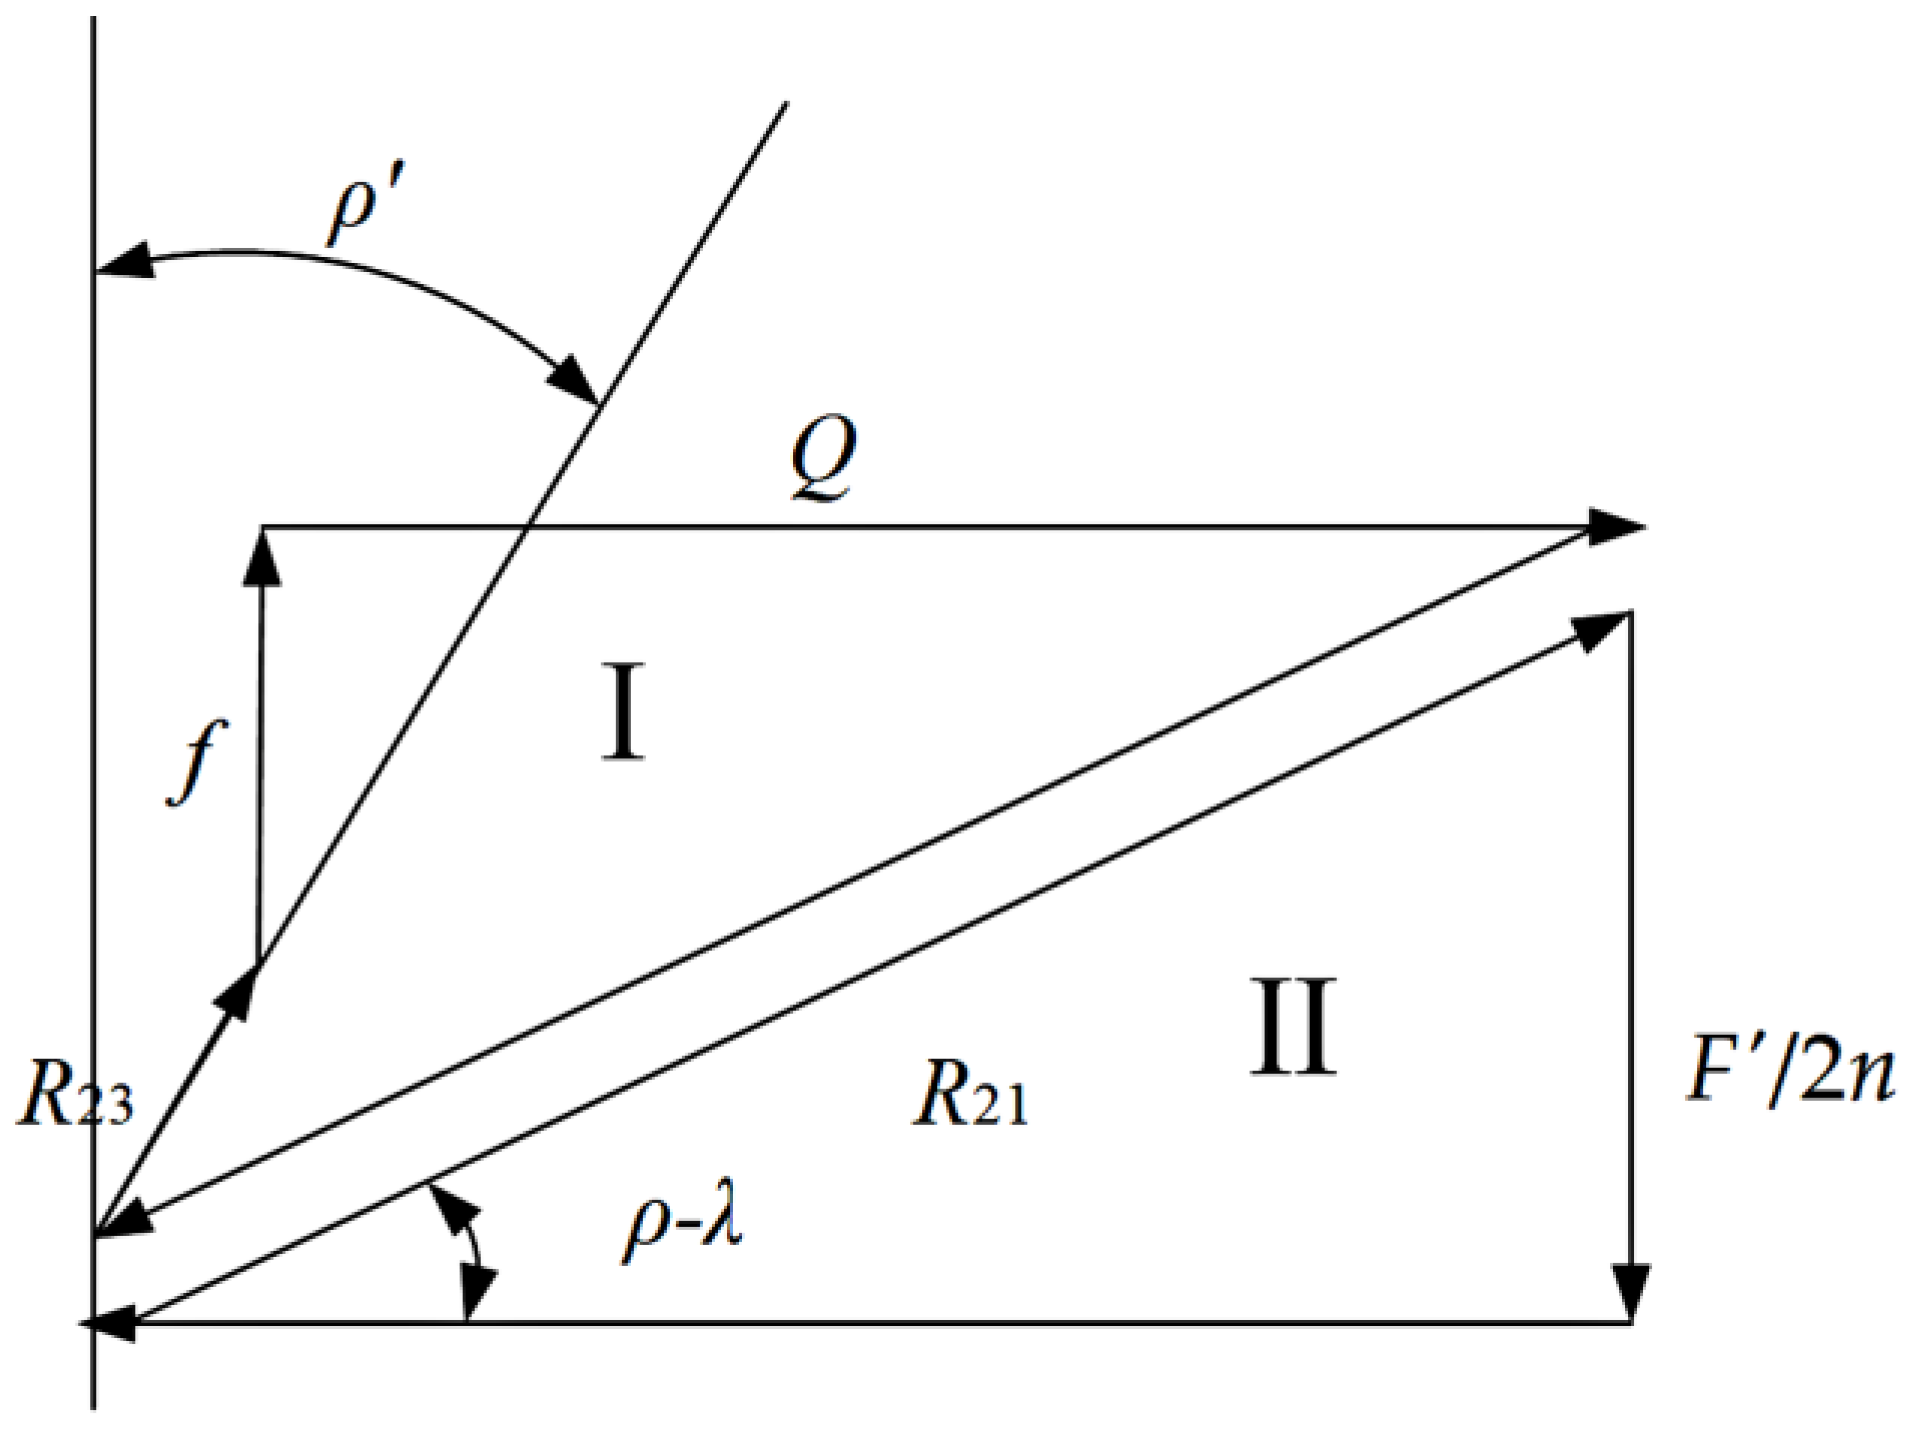
3.1. Force Analysis during Loading Stroke

The hydraulic cylinder pulls the pusher, which forces the spherical contact body to travel along the slanting surface and press against the inner wall of the pipeline in order for the underwater pipeline recovery tool to recover the pipeline. Subsequently, as a result of the friction generated between the spherical contact body and the pipeline’s inner wall, the spherical contact body descends along the inclined plane, increasing the friction between it and the inner wall. Figure 2 illustrates the force acting on the contact body during the recovery process, which will be subjected to force analysis.
In Figure 3, n denotes the number of pairs of spherical contact bodies, F denotes the lifting force, Tmax is the tension at this point in time when the pipe is connected to the PRT, λ is the angle of inclination of the sloping surface of the push rod, ρ is the friction angle between the contact surfaces of the push rod and the contact body, ρ′ the friction angle between the contact surfaces of the contact body and the wall of the inner sphere cage aperture, Q is the positive pressure of the pipe wall on the spherical contact body, f is the friction force exerted by the pipe inner wall on the spherical contact body, R12 is the combined force of the pressure of the push rod on the contact body and its friction, R21 is the combined force of the pressure of the contact body on the push rod and its friction; R23 is the combined force of the pressure of the contact body on the ball cage and its friction, and R32 is the combined force of the pressure of the ball cage on the contact body and its friction.
It is necessary to evaluate it in terms of sliding friction because when the spherical contact body is pushed to expand and tighten the pipe, incomplete sliding friction occurs between the pipe and the spherical contact body as well as between the spherical contact body and the pusher. Force polygons, as seen in Figure 3, may be used to achieve the force analysis.
When the pipe is lifted, if the pipe is not dislodged, the friction f between the spherical contact body and the pipe is 1/2n of the total weight of the pipe. From the force triangle I:
R 12 = F 2 n s i n ( λ + ρ ) .
In general, the friction angle and the coefficient of friction μ between materials are related as follows:
ρ = a r c t a n μ .
From the force polygon II:
Q = R 21 c o s ( λ + ρ ) R 32 s i n ρ ,
R 32 = 1 c o s ρ ( R 12 c o s ( λ + ρ ) f ) .
Thus, in summary, it can be concluded:
Q = F 2 n t a n ( λ + ρ ) ( F 2 n f ) t a n ρ .
In lifting the pipe, the friction f between the inner wall of the pipe and the spherical contact body is equal to the single-ball lifting force F/2n, so Equation (5) can be simplified to:
Q = F / 2 n t a n ( λ + ρ ) .
If the ideal state is frictionless, i.e., when ρ = ρ′ = 0, then there is:
( F 2 n ) 0 = Q t a n λ .
In this working stroke, F is the driving force Q is the load force, and its efficiency is:
η = ( F 2 n ) 0 F 2 n = t a n λ t a n ( λ + ρ ) ,
where f is the friction force between the contact body and the pipe and is also the main force for the PRT to recover the pipe, with a value of F/2n. If the subsea pipe recovery tool is to achieve an incremental self-locking effect when lifting, the stroke should not self-lock and thus should satisfy η ≥ 0. Based on the demand, it is known that there should be a self-locking between the pipe, the spherical contact body, and the actuator at F = 0:
Q s i n λ Q c o s λ t a n ρ = t a n λ t a n ρ 1 .
Therefore, in accordance with Equations (8) and (9), the actuator’s taper angle can take on the following range of values:
0 λ ρ .

3.2. Force Analysis during Unloading

The hydraulic cylinder rod of the subsea pipeline recovery tool recovers and pulls back the push rod, designating this process as the unloading stroke, when the pipeline is lifted back to the ship and clamped with the tensioner in the laying device or other clamps on the ship. The contact body and the inner wall of the pipeline squeeze against each other during the unloading stroke, and the hydraulic cylinder then drives the inner ball cage to lift under the influence of hydraulic pressure, bringing the contact body into contact with the inner ball cage’s bottom hole wall. As the hydraulic cylinder continues to increase pressure, the flange end of the ball cage and the pipeline mouth then make contact with the ball cage, and the contact body that loses the push rod’s sustaining force. Additionally, the contact body loses its force of traction on the pipe’s inner wall, resulting in unloading. Figure 4 displays the force diagram.
For the unloading process, Q is the driving force and F′ is the load force. So F′ is the force that makes the subsea pipeline recovery tool unloadable. The corresponding force polygon is shown in Figure 5.
In force triangle II, by the sine theorem:
Q s i n [ 90 ° ( ρ λ ) + ρ ] = R 12 s i n ( 90 ° ρ ) .
From the above equation:
R 21 = R 12 = Q s i n ( 90 ° ρ ) c o s ( ρ λ ρ ) .
In the force triangle I there are:
F 2 n = R 21 s i n ( ρ λ ) = Q s i n ( ρ λ ) c o s ρ c o s ( ρ λ ρ ) .
According to Equation (5), the relationship between the friction f and the pressure Q between the inner wall of the pipe and the contact body is:
f = t a n ( λ + ρ ) Q .
Therefore, if the effect of locking the pipe is to be achieved, the equivalent coefficient of friction μ″ between the spherical contact body of the pipe and the inner wall of the pipe should be satisfied:
μ t a n ( λ + ρ ) .

3.3. Analysis of Locking Structure

At the start of pipe recovery, the PRT should raise the coefficient of friction between the contact body and the pipe’s inner wall in order to lock the pipe. The tribological theory states that in order to increase the real contact area between the spherical contact body and the inner wall of the pipe, which increases the friction coefficient between the inner wall of the pipe and the ball, a certain amount of pressure must be applied to the spherical contact body. According to the theory of adhesive friction proposed by Bowden et al. [11,12], As can be seen, the friction surface between the spherical contact body and the pipe is in a plastic state, and the friction between the pipe and the spherical contact body when the pipe is locked is the result of the sum of the adhesion effect and the furrow effect. The contact area is thus composed of two parts: the spherical contact body pressed into the pipeline, sliding when pushing the soft material (pipeline wall material), and the ellipsoid surface, where the spherical contact body contact pipe wall adhesion effect occurs. The stress analysis is shown in Figure 6.
So the composition of the friction force F is:
F = T + P e = S τ b + A p e ,
where T represents the shear force, T = Sτb; S represents the actual contact surface area; τb represents the shear strength of the adhesion junction; A represents the cross-sectional area of the furrow, and pe represents the furrow force per unit area.
According to the relevant experimental verification, τb is very close to the shear strength limit τs of the soft material (i.e., pipe inner wall material) in the friction vice, which indicates that the shear of the adhesion junction usually occurs in the inner part of the soft material, resulting in the material migration phenomenon in the wear. the value of pe depends on the nature of the soft material. For a sphere embedded in the inner wall of a pipe, the value of pe is the yield limit of the pipe wall material, σs. Equation (9) can then be written as:
F = S τ s + A σ s ,
where S is the real contact area between the spherical contact body and the inner wall of the pipe, which can be calculated with the Hertzian contact theory; A is the cross-sectional area of the spherical contact body embedded in the pipe part in the direction of the friction force, and according to the geometrical relationship, there is:
{ A = [ a r c s i n ( x r ) 360 ° π r 2 x r 2 x 2 2 ] [ a r c s i n ( x R ) 360 ° π R 2 x R 2 x 2 2 ] h = [ r r 2 x 2 ] [ R R 2 x 2 ] x = R g s i n ( a R ) ,
where R represents the radius of the inner wall of the pipe; r represents the radius of the spherical contact body; h represents the depth of the spherical contact body pressed into the inner wall of the pipe, which can be obtained by the Hertzian contact theory; a represents the long half-axis of the elliptic surface between the spherical contact body and the inner wall of the pipe. At this time, the equivalent friction coefficient between the spherical contact body and the inner wall of the pipe is:
μ = F F N = S τ s + A σ s Q .
So according to Equations (15) and (19), the relationship between the actuator cone angle λ and the depth h of the spherical contact body pressed into the inner wall of the pipe is:
λ a r c t a n ( S τ s + A σ s Q ) ρ .

4. Damage Mechanism Analysis

A subsea pipeline recovery tool’s contact body presses against the pipeline when it makes contact with the inner wall of the pipe. It harms the pipeline when it is forced into the surface of the pipe. As a result, a sliding zone forms on the contact surface when the pipe is lifted because tangential contact is formed between the contact body’s surface and the pipe’s inner wall. Figure 7 illustrates how the pipe damage grew deeper and more extensive as the raised pipe section’s length and mass increased. Due to wave stresses, the recycling process also causes cyclic friction between the contact body and the pipe’s inner wall. These wounds might lead to contact damage zones with compressive stress concentrations on the pipeline’s inner surface, along with corrosion, internal pressure, and fatigue damage, all of which would likely turn the pipeline into a very dangerous safety concern.
Compared to the inner wall of the pipe, the contact body’s hardness is significantly higher. The inner wall of the pipe and the contact body are vulnerable to abrasive wear, according to the friction hypothesis [13]. Material will be lost from the surface of the pipeline, and the friction surface will deform as a result of contact and friction between the contact body and the pipeline’s inner wall. This type of abrasion will harm the pipeline’s outer layer and inner layer, which will cause the pipeline to experience stress concentration when exposed to bending moments and reduce the pipeline’s following service life. In order to avoid damaging the inner wall of the pipe, it must be recycled as little as possible.
The wear of the inner wall of the pipe can be categorized as a mix of adhesive and abrasive wear, depending on the manner in which the contact body made contact with the pipe. Adhesive wear [14,15] occurs on the contact surface of the two objects. The adhesive junction on the soft material side is destroyed due to wear brought on by relative sliding. Abrasive wear [16] is a technique that involves pressing a contact body into a friction surface while it is under pressure. As the contact body slides, the plastic material’s surface shears, ploughs, and slices, leaving behind groove-like indentations.
Currently, three basic techniques exist to assess wear: wear ratio, wear resistance, and wear quantity. The wear volume typically controls the amount of wear between the contact body and the inner wall of the pipe [17]. The three basic wear quantities for evaluating material wear are length wear Wl, volume wear Wv, and weight wear Ww. Length wear, which is frequently employed in the wear monitoring of actual equipment, is the amount of change in the dimensions of an object’s surface throughout the wear process. A part or specimen’s change in volume or weight as a result of wear is referred to as weight wear or volume wear. Combined with the working conditions, it can be seen that when determining the wear of the inner wall of the pipe, the volumetric wear amount Wv should be used as the criterion.
Adhesive wear does not result in considerable material loss from the inner wall of the pipe or relocation; rather, it merely causes a few microns of soft material that is present between the contact body and the pipe to stick to the contact body. Additionally, there is no adhesion due to the temperature difference between the inner wall of the pipe and the spherical contact body. on the other hand, abrasive wear is influenced by the contact body’s depth of indentation and the distance swept during sliding. The abrasive cutting mechanism’s straightforward calculating approach, or the Rabinovitch model [18], it is assumed that the abrasive shape is a cone, the half angle is θ, the load is W, the indentation depth is h, the sliding distance is S, the yield limit is σs, and the hardness of the abrasive material is H.
The relationship between the volumetric wear amount, Wv, the indentation depth, h, and the sliding distance, S, is shown in Equation (21).
W v = A S = W S c o t θ π H .
The wear volume of the inner wall of the pipeline is positively connected with the depth of the indentation h and the sliding distance S during the operation of the submerged pipeline recovery tool because the wear of the contact body on the inner wall of the pipeline is comparable.

5. Simulation and Experimentation

5.1. Grid Division

Table 1 provide the material property parameters for the contact body and pipe. Global meshing is used to split the model into hexahedral meshes. For the areas where the contact body is in contact with the pipe, the mesh is then locally encrypted. It is chosen to be sluggish and excessively large to use the coarse mesh and encrypted mesh. The chosen mesh growth rate is 1.1. The mesh’s minimal size at the point where the load-bearing sphere and pipe come into contact has been fixed at 0.4 mm due to computer restrictions. Around 280,000 meshes and 1,000,000 nodes make up the total number of nodes in the system.

5.2. Boundary Conditions

The outside wall and sides of the pipe model were set as frictionless constraints, and the contact body’s upper surface was set with displacement constraints to limit the contact body’s movement in the y and z directions. A pressure of 20,000 N in a downward direction was placed on the contact body’s upper surface. The tensile force was set at 4000 N in the forward direction in front of the pipe model. Figure 8 displays the loading curves for boundary conditions and forces.

5.3. Simulation Verification Experiment

This study examines the PRT while recovering 12-inch flexible pipes in an environment with a 300-m water depth. At this moment, the 12-inch PRT design index is as follows: 300-m water depth, recovering 12-inch ID, 15.25-inch OD pipes, and a 160-kg design load. Calculations reveal that there are 7 rows, with 8 connections in each row, of spherical contacts in the 12-inch PRT’s insertion mechanism. The spherical contact body has a 60-mm diameter. The experiment makes use of the scaled-down model, with the diameter of the spherical contact body set to 15 mm. For the sake of the experiment, the inner wall of the pipe may be roughly represented as a flat surface because its radius is significantly bigger than the radius of the contact body. To replicate the contact between the contact body and the pipe, the contact between the contact body and the flat metal plate was employed. By monitoring the reduction c in the distance between the two steel plates, a laser displacement sensor may determine the sinking depth d = c/2 of the spherical contact body. Trials using the spherical contact body of the GCr15 bearing steel material and the 45 steel metal plate. The carrier ball caused relatively little deformation while pressing the steel plate since the bearing steel, GCr15, has a substantially higher hardness than 45 steel. The loaded balls were forced to extrude the flat surface using a press, and the displacement change resulting from the force loading was recorded using a laser displacement sensor. The press applied pressure loading to the support block to transfer force to the ball. A pressure sensor was positioned atop the block. With ten flat plates, the load-bearing ball was extruded. The top and bottom of the spherical contact body each included a pair of plates. The experimental steel plates were subjected to forces of 1000 N, 2000 N, 3000 N, 4000 N, and 5000 N, respectively, from the press. Each pair of experimental steel plates had its pit diameter measured in order to reduce experimental error. The pair of plates whose pit diameter matched the pair’s data was considered acceptable. In Figure 9, the experimental technique is displayed.
Finite element analysis was performed on the experimental model, and the boundary conditions were established using the same technique as the simulation mentioned before. It is possible to fit the rigid sphere’s displacement curve using mathematical computation tools. As a result, the experimental simulation mentioned above yielded the experimental-simulation comparison curve connection. Figure 10 compares how the subsidence displacement changes as the load increases from 0 to 1.25 KN. The sinking gradually deepens as the load rises. The modeling yielded a subsidence displacement of approximately 26.7 μm at a 1.25 KN load, while the experiment yielded a displacement of around 28 μm. Furthermore, there is a similarity between the simulation and experimental curves, indicating the greater accuracy and dependability of the previously mentioned simulation and analysis approaches. As a consequence, both the simulation results and the finite element approach we employed in the contact body structure optimization design are accurate.

6. Multi-Objective Optimization Design

Multi-objective optimization is generally characterized by the fact that the different sub-objectives in the problem are mutually contradictory. This means that achieving one sub-objective may result in the other sub-objective performing worse. It is also challenging to achieve multiple sub-objectives at once and arrive at the optimal value; instead, one can only compromise between the sub-objectives in a number of objectives in order to arrive at the best solution possible. A multi-objective optimization issue has several Pareto optimum solutions rather than a single, unique solution. This is the primary difference between multi-objective and single-objective optimization. It is more difficult for relative sliding to occur between the contact body and the pipe when the contact body is deeper into the inner wall of the pipe during the work of the contact body contacting the inner wall of the pipe; that is, the greater h is, the smaller S is. Thus, the design of multi-objective optimization is employed. The optimization process for the contact body of the subsea pipeline recovery tool is shown in Figure 11.

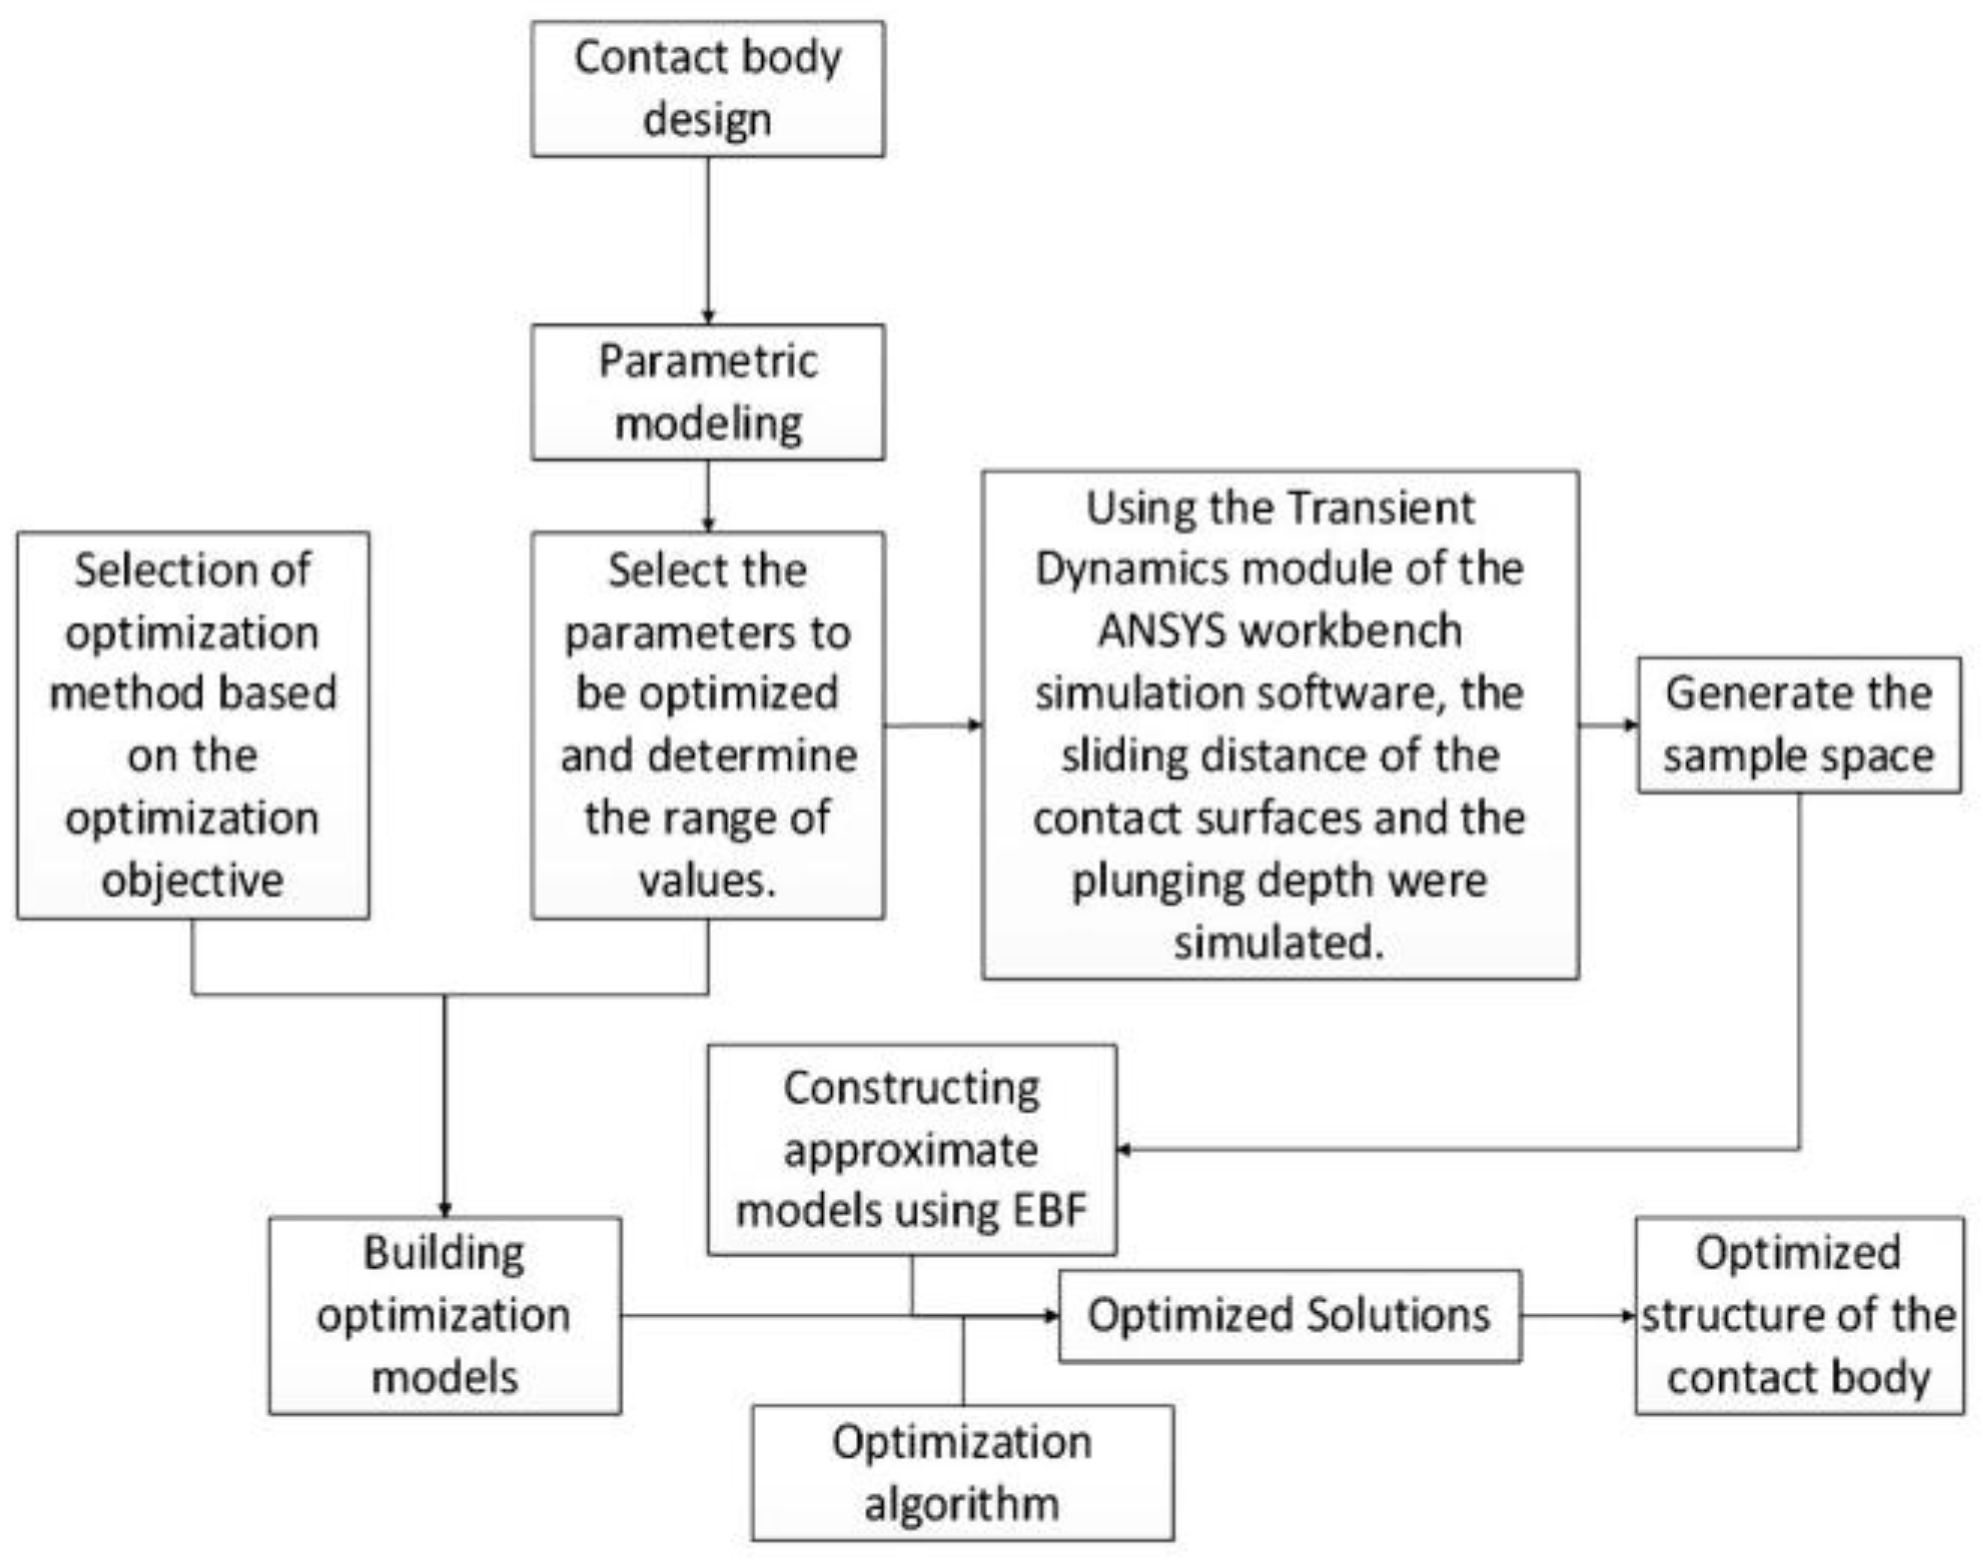
6.1. Parametric Modeling

It is essential to do a multi-objective optimization design for the contact body’s structure and parameterize the contact body model in order to lessen the damage that the undersea pipeline recovery tool contact body causes to the inner wall of the pipeline when it is in operation.
The primary parameters of the contact body were chosen for parameterization after a geometric model of the underwater pipeline recovery tool’s contact body was created using SolidWorks. specifying the cylindrical diameter (D) and the rounded corner (R) of the contact body as the input parameters for structural optimization. Figure 12 illustrates the size of the contact body that has to be optimized. Equation (22) displays the range of values for the design variables.
The input variables contact body fillet R and contact body cylindrical diameter D were chosen to take on a range of values since the contact body diameter of the 12-inch subsea pipe recovery tool was initially intended to be 60 mm:
D [ 50 mm , 70 mm ] R [ 5 mm , 35 mm ] .

6.2. Design of Experiment Method

An experimental design methodology was used to repeat the sampling in the design space in order to create a rough model. The experiment design in this work utilizes Optimized Latin Hypercube Sampling (OLHS). The Optimized Latin Hypercube, as opposed to a random combination, is the best way to combine the levels of the factors [19]. With this approach, the design space is uniformly divided into sections for each factor. The best method for simulating the actual response is optimized Latin hypercube sampling, which also offers a useful method for forecasting the model’s response properties [20].
The OLHS design was used as the experimental design method in this study, and the design variables were based on a range of values. The OLHS method created 100 sample points. The sample points and the surfaces’ matching values were discovered. Based on these results, an approximate model for each output variable was constructed using the Elliptic Basis Function (EBF) approximation algorithm and Universal Kriging (UK) algorithms, respectively.

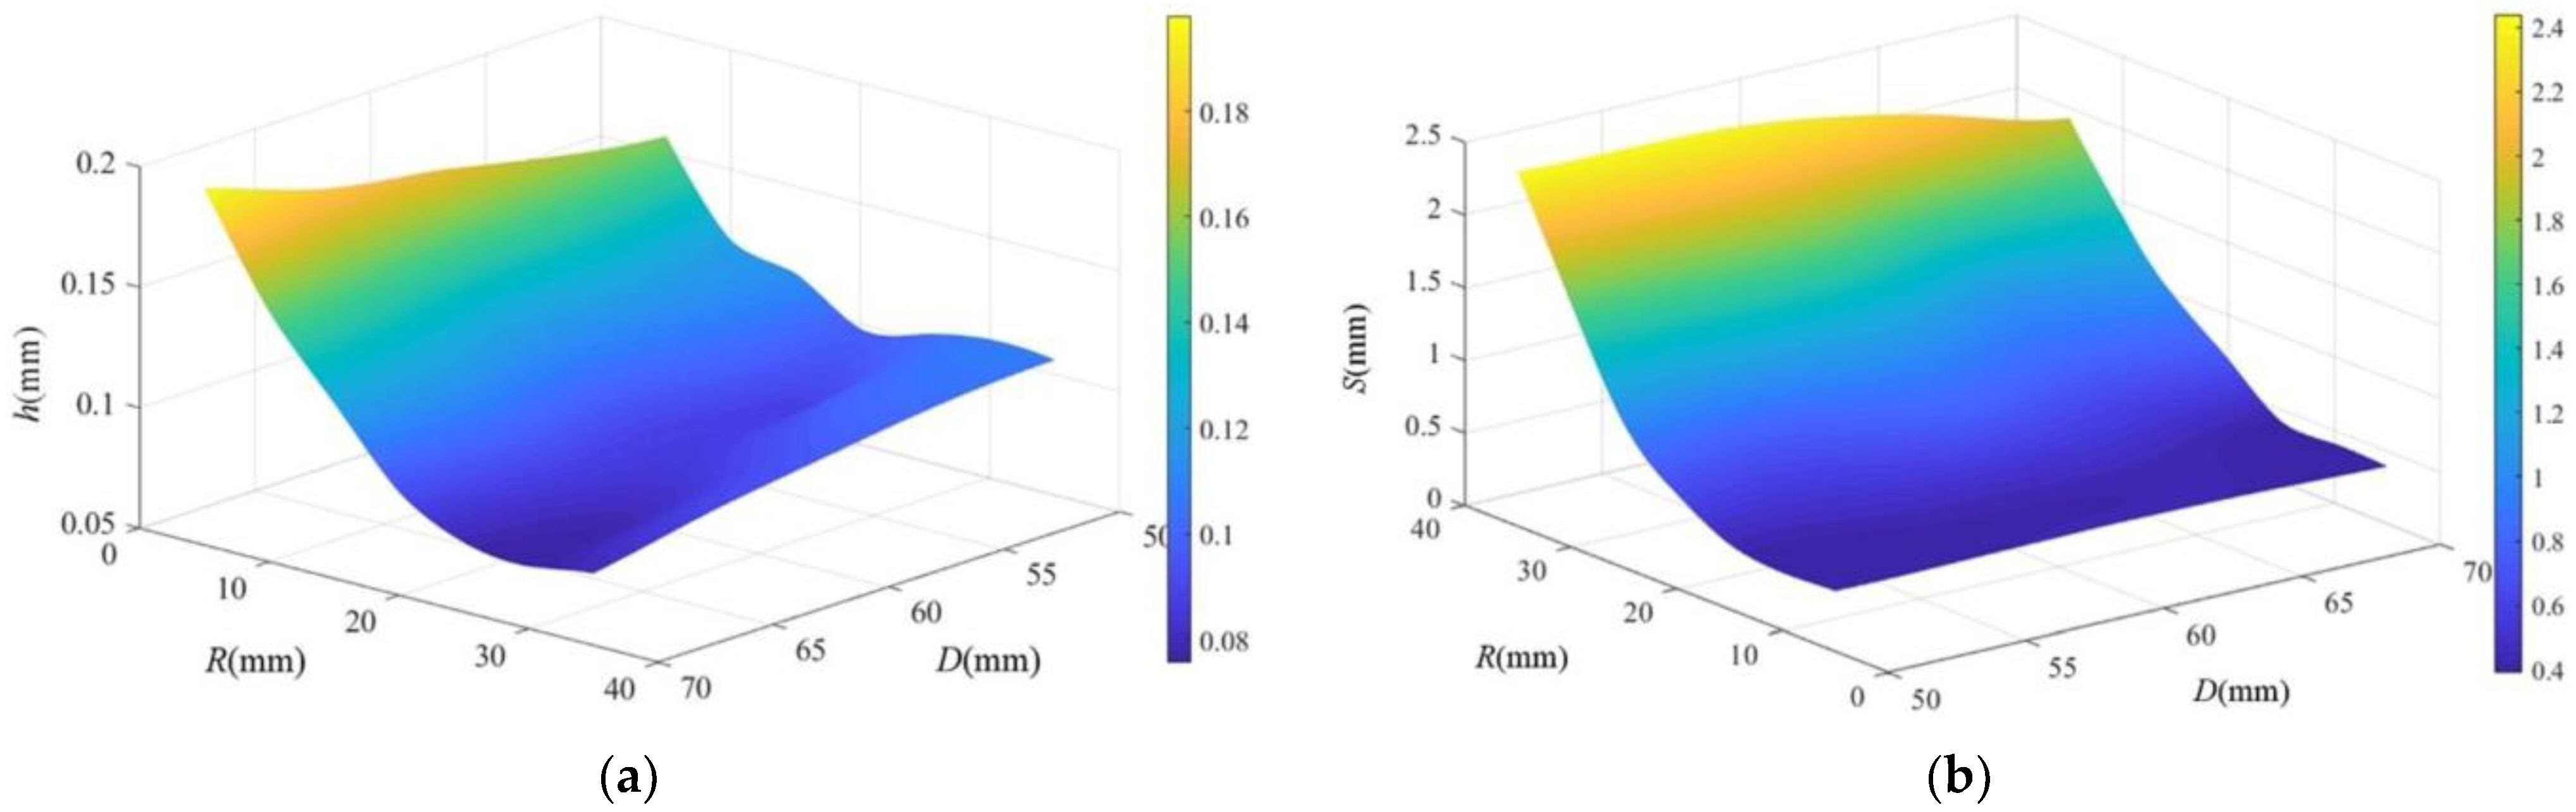
6.3. Approximation Model

6.3.1. Sensitivity Analysis

In this paper, the response surface model (RSM) method [21,22] was used to evaluate the sensitivity. In light of the foregoing results, Figure 13a,b depict the response surface model based on the effect of the contactor fillet R and contactor cylindrical diameter D on the contactor indentation depth h and the relative sliding distance S between the contactor and the pipe.
As can be seen from Figure 13a,b, the value of the depth h of the contact body pressed into the pipeline decreases and then increases, and the value of the relative slip distance S between the contact body and the inner wall of the pipeline gradually decreases as the round angle R of the contact body increases. When the value of the round angle R is held constant, the relative slip distance S between the contact body and the inner wall of the pipeline also decreases and then increases, along with the depth h of the contact body pressed into the pipeline as the diameter of the cylinder of the contact body D increases.

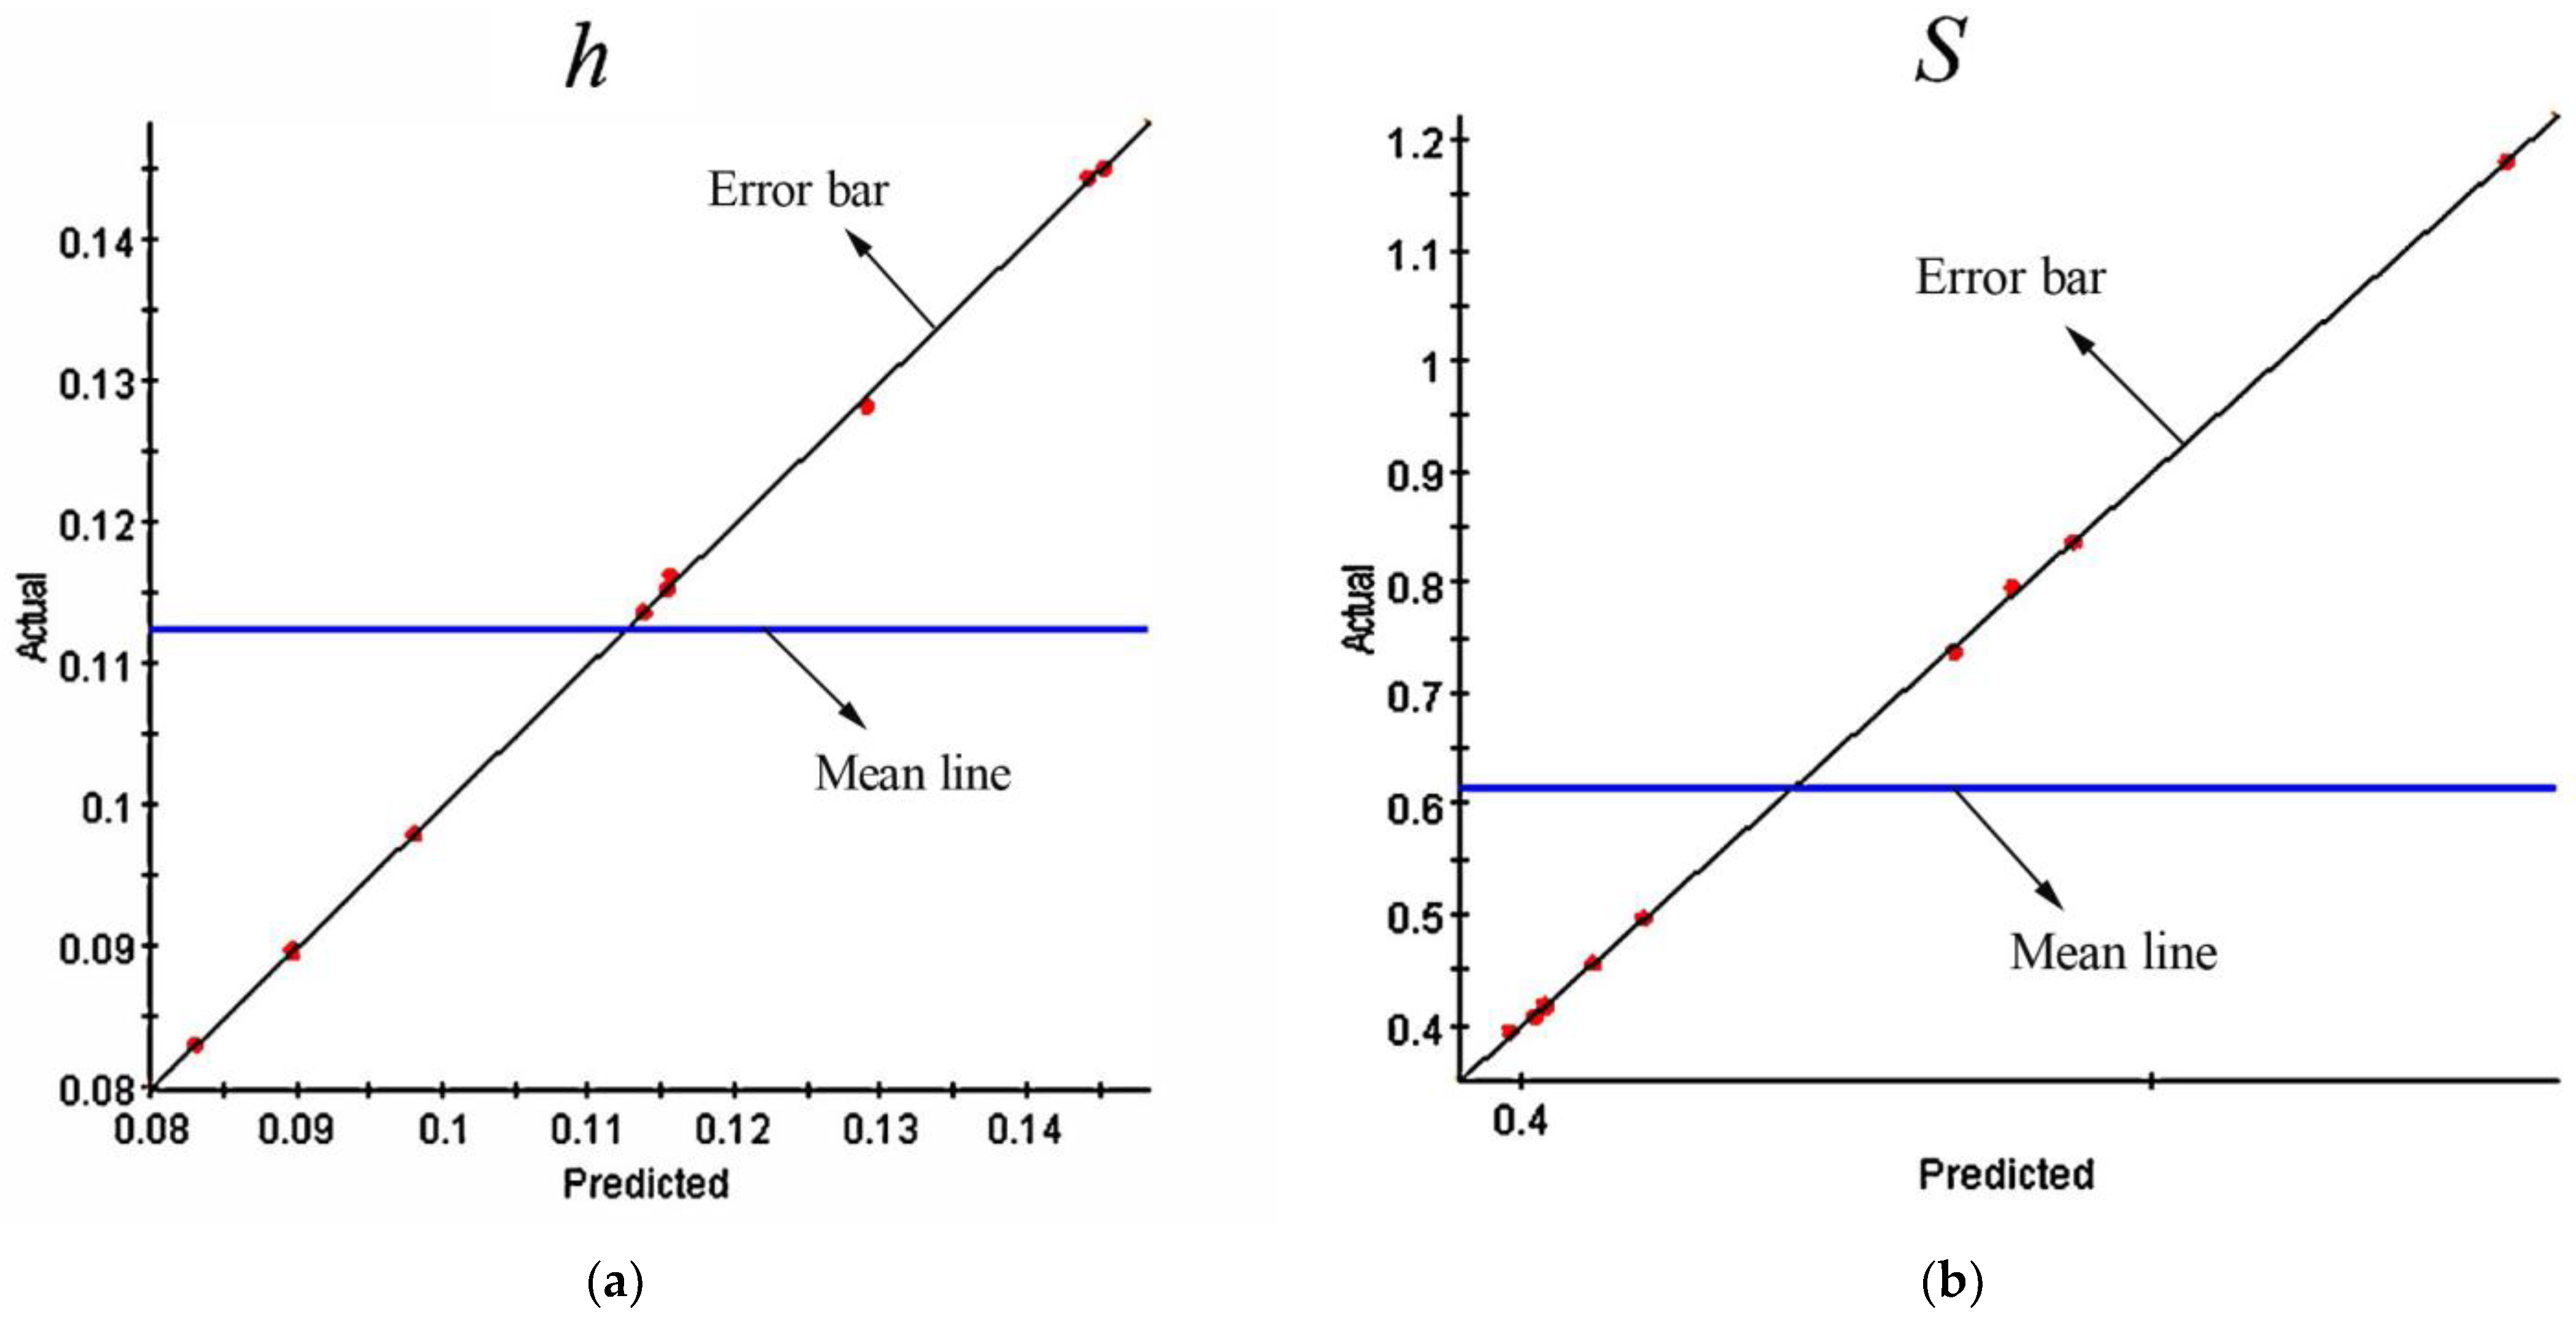
6.3.2. Approximate Modeling

To improve the optimization efficiency, multi-objective optimization was performed using approximation models. The EBF approximation model [23] and the UK approximation model [24] were used instead of the simulation model to express the relationship between each design variable and each performance index, respectively. Using the OLHS design of experiments technique, 10 sample points were chosen in the finite element model based on the range of values of each design variable. Using the cross-validation approach, which chose to evaluate the model’s accuracy using the root mean square and the root cubic, the model’s correctness was confirmed. The approximation model with more accuracy was chosen during the optimization phase after comparing the models produced by the two approaches. The root mean square and cube root of the approximations produced by EBF and UK are displayed in Table 2.
Table 2 shows that both of the approximation models created using the two approaches satisfied the accuracy standards, with the EBF approximation model having a greater level of accuracy. As a result, throughout the optimization phase, the EBF approximation model was chosen. The EBF model’s fitting curves for h and S are shown in Figure 14.
Figure 15a,b depict the EBF approximation model for the depth h at which the contact body enters the pipe and the slip distance S between the contact body and the pipe. The degree of the design variables D and R’s impact on the values of h and S was assessed using the optimization design program Isight [25]. All of the chosen factors have an impact on the sub-objectives. Greater than contact body cylindrical diameter D is the overall impact of contact body rounding angle R on contact body indentation depth h. The difference between the two is not obvious, while the global influence of contact body rounding angle R on contact body indentation depth S is higher than that of contact body cylindrical diameter D.

6.4. Multi-Objective Optimization Mathematical Model

The core of the optimization problem is the optimization model. In this study, a multi-objective optimization function was created, and the objective function was normalized and combined using the weighting approach. In order to resolve the optimization model, the optimization strategy was applied.
Using a linear weighting approach, the multi-objective issue is reduced to a single goal in order to discover the required optimal solution from the Pareto solution set. Each sub-objective has two terms before it. One is based on the sub-objective’s significance in real-world engineering. The alternative is to modify the sub-objective values in accordance with the orders of magnitude depicted in Equation (23).
F ( X ) = i w i u i f i ( X ) ( i = 1 , 2 , L , q ) ,
where fi(X) is the sub-objective function; wi is the weighting factor of each sub-objective; ui is the standardized term to normalize the value of the sub-objective function. In this paper, the depth h of the contact body pressed into the pipe and the relative slip distance S between the contact body and the pipe is selected as the sub-objectives. The objective function is shown in Equation (24).
M i n F ( X ) = w 1 u 1 f 1 ( X ) + w 2 u 2 f 2 ( X ) ,
where f1(X) is the depth h of the contact body pressed into the pipe; f2(X) is the relative slip distance S between the contact body and the pipe; w1 is the weighting factor of the pressed-in depth H; w2 is the weighting factor of the slip distance; u1 and u2 are the normalization terms of the sub-objective function. The input variables were selected as contact body round angle R and contact body cylindrical diameter D. The optimization problem is formulated as:
{ m i n H m i n S 5 R 35 25 D 70

6.5. Multi-Objective Optimization Algorithm

The linear weighting approach employs subjective weights, which are less objective and require more calculation even if they are simple to compute and comprehend. Second, the findings of the assessment are skewed since this approach is unable to capture the important effects of certain evaluation markers. On the other hand, the GA method has better convergence, converges more quickly, and can continuously maintain the convergence state. So, NSGA-II and NCGA were selected to optimize the contact body’s form and structure, respectively. Intelligent optimization methods like the simulated annealing algorithm, the genetic algorithm, the particle swarm algorithm, and others may often be used to acquire the Pareto solution set of a mathematical issue of multi-objective optimization. A popular multi-objective optimization technique today is NSGA-II [26]. The benefit of NSGA-II is that its exploratory performance is better. The Pareto forward ability is strengthened in non-dominated sorting because the Pareto front-proximate individuals are chosen [27]. The NCGA method [28] is derived from the first GA algorithm, which values each objective equally and implements the “neighbor reproduction” process by grouping the crossover after sorting. The computational convergence process is sped up by the higher likelihood of solutions at the Pareto front cross-propagating.

7. Results and Discussion

7.1. Optimization Results Analysis

Finding a representative collection of Pareto optimum solutions that fulfill various criteria was the major goal of the optimization procedure, which used the genetic algorithms NSGA-II and NCGA. The crossover rate is set to 0.9, the population size is set to 100, and the number of hereditary generations is set to 200. Following the computation, the possible solutions satisfying the example’s requirements are discovered, forming the Pareto front solution set curve seen in Figure 16.
In Figure 16, the derived Pareto borders for h and S are displayed. As indicated by a red point, the Pareto ideal solution exists. The Pareto front is made up of all red points, and the green point is the ideal design position recommended by the Isight optimization tool. S is more significant in this optimization. In order to confirm the accuracy of the optimization findings and the correctness of the ideal design, the optimal design point and the four points around it were chosen as the candidate points for simulation computations. The candidate points were chosen within a 10% range of the ideal candidate points’ anticipated values for h and S. Figure 16 depicts the selection of candidate spots. Table 3 and Table 4 provide the values of the goal function at these points as well as the outcomes of the simulation.
Because two approximation models were utilized in the optimization, as can be seen from the findings in Table 3 and Table 4, the errors of h and S are significant. When using the NSGA-II method to optimize, the maximum errors of h and S are 7.02% and 5.33%, and they are acceptable in the optimization process when using the NCGA algorithm, where they are 8.18% and 7.06%. Table 5 demonstrates that when the NSGA-II algorithm was used to optimize the contact body, h grew by 38.3% and S fell by 49.5%, but when the NCGA method was used, h increased by 35.8% and S decreased by 46.3%. Additionally, S has a bigger impact on pipe damage than h. The outcomes of the optimization are viable since the rise in h is likewise within the permitted range. The wear on the inner wall of the pipe is greatly reduced by both improved contact bodies, and NSGA-II achieved superior optimization results compared to NCGA.
The NSGA-II optimization results converge nicely. The convergence stage is where the best results are found, demonstrating that the optimization process does not lead to the local best solution. According to the Pareto results of NSGA-II optimization, it is known that at the optimal design point, D = 57.1 mm, R = 11.82 mm, h = 0.118 mm, S = 0.396 mm. The design variables for the undersea pipeline recovery tool contact body are D = 57 mm and R = 11.5 mm as a result of the proximity theory and mechanical rounding requirements.

7.2. Simulation Verification

An Adams dynamics simulation of the model [29] is required to determine whether the revised model is capable of uniformly tightening the pipe and self-locking recovery of the pipe. The push rod unit was given a continuous 16 s, evenly increasing to 24 KN thrust for simulation in order to see if the ball-cone construction could actually achieve uniform expansion of the pipe. The thrust curve is depicted in Figure 17a. As illustrated in Figure 18a,b, the contact force between each contact body and the inner wall of the pipe after optimization was compared with the pre-optimization. The push rod unit was uniformly increased to 24 KN and then uniformly decreased to 0, and the thrust curve is displayed in Figure 17b to demonstrate the self-locking of the ball-cone construction. We examined the contact force between each contact body and the pipe’s inner wall before and after optimization, as shown in Figure 18c,d. The actuator unit was given a thrust force that lasts for 5 s, increases to 10 KN, and then decreases to 0 after 5 s, and then the pipe was given a displacement opposite to the thrust force with a duration of 8 s and a total displacement of 2 mm. This was done to test the locking of the pipeline recovery tool. Figure 17c depicts the displacement and thrust curves. As illustrated in Figure 18e,f, the simulation yields a comparison of the contact force between each contactor and the inner wall of the pipe between pre- and post-optimization.
It is evident from Figure 18a,b that the pusher construction and optimized contact body can extend the pipe equally. It can be demonstrated that the motion between the optimized contact body and the pusher is more steady during the process of expanding the pipe because the contact force between the pipe and the contact body grows more smoothly as the pipe expands. The contact force between the optimal contact body and the pipe is spread more equally, and the pipe expands more evenly, even though the contact force between each optimized contact body and the pipe differs when compared to the ball-cone construction. The optimized contact body’s average contact force with the pipe is 12,650 N, which is less than the spherical contact body’s average contact force of 13,106 N. Consequently, the contact force between the pipe and the optimized contact body is spread more uniformly in comparison to the ball-cone construction. When compared to an insertion mechanism with a ball-cone shape, the optimized contact body and push rod have less force-generating capability, but their greater stability can make pipe recovery work safer. Most significantly, the improved contact body’s and the push rod’s force-generating capability still satisfy the design specifications.
The improved contact body and actuator construction continue to have self-locking characteristics when the pipe is expanded, as shown in Figure 18c,d. There is greater uniformity in the contact force between the pipe and the contact body. Furthermore, in contrast to the ball-cone structure’s insertion mechanism, the minimum contact force between the contactor and the pipe in this construction is 9028 N, greater than the minimum contact force of 8521 N between the spherical contactor and the pipe in the ball-cone structure.
It is evident from Figure 18e,f that when the pipe is expanded and tightened, the optimum contact body and push rod construction may still lock the pipe. In particular, when the pipe is being displaced, the contact force between the contact body and the pipe is more uniform. While the contact force between the optimized contact body and the pipe has remained stable, the contact force between the spherical contact body in the ball-cone configuration and the pipe will fluctuate significantly. This behavior demonstrates that while expanding and recovering the pipe, the optimized contact body and actuator construction have superior stability.

8. Conclusions

This study examines the anchoring hypothesis, the pipeline’s inner wall damage process during PRT recovery, and the methodology used to describe the inner wall’s degree of damage. Based on this analysis, a dual-approximation model based on a multi-objective genetic algorithm is used to optimize the structural design of the contact body structure of the sub-marine pipeline recycling tool. It also analyzes the effects of the contact body’s diameter and radius of rounded corners on the depth of the press into the pipeline and the slip distance. Additionally, the optimization outcomes of the NSGA-II and NCGA algorithms are also contrasted. Lastly, the dynamics simulation of the entire insertion mechanism is carried out using Adams simulation software, and the following conclusions are drawn:
  • When compared to NCGA, NSGA-II’s optimization results have greater convergence. S reduces by 49.5%, while h rises by 38.3%. The wear issue between the contact body and the inner wall of the pipe is greatly reduced by the improved contact body. The ideal design parameters are D = 57 mm and R = 11.5 mm;
  • In comparison to the pre-optimization, the maximum average contact force between the optimized contact body and the pipe is low at 12,650 N. However, the improved contact body and actuator continue to fulfill the design criteria with regard to force increase capacity, making the pipe recovery operation safer;
  • The minimum value of the optimal contact force between the contact body and the pipe is 9028 N, which is higher than the optimal value of 8521 N. When the pipe is expanded, the improved contact body and actuator structure remain self-locking, and the contact force between the contact body and the pipe is more consistent;
  • The pipe may still be locked when it is expanded and tightened, thanks to the improved contact body and actuator construction. The contact force between the pre-optimized contact body and the pipe varies significantly during the pipe displacement stage, but the contact force between the optimized contact body and the pipe is steady. As a result, when expanding and recovering the pipe, the improved contact body and actuator construction have superior stability.

Author Contributions

Conceptualization, H.G. and Z.P.; methodology, Z.P. and T.Z.; software, P.Q. and F.Z.; validation, H.G. and S.H.; formal analysis, Z.P. and T.Z.; investigation, H.G.; resources, J.Q.; data curation, T.Z.; writing—original draft preparation, H.G., Z.P., T.Z., P.Q. and F.Z.; writing—review and editing, H.G., Z.P., T.Z., S.H. and J.Q.; visualization, P.Q. and F.Z.; supervision, S.H. and J.Q.; project administration, H.G. and S.H.; funding acquisition, H.G. All authors have read and agreed to the published version of the manuscript.

Funding

This research was funded by the Key R&D Program of Shandong Province of China, grant number 2021JMR0302 and the National Natural Science Foundation of China, grant number 5207110396.

Data Availability Statement

The data used to support the findings of this study are available from the corresponding author upon request.

Conflicts of Interest

The authors declare no conflict of interest.

References

  1. Gong, H.; Zhao, T.; You, X.; Wang, L.; Yun, F.J. Scaled model simulation and experimental verification of submarine flexible pipeline laying system. Appl. Sci. 2021, 11, 10292. [Google Scholar] [CrossRef]
  2. Zhang, L.; Chen, H.; Liu, M.; Zhu, Z.; Sha, X.; Wang, L. Simulation study on mechanical wear of the diamond grain cutting pipeline steel. Part C J. Mech. Eng. Sci. 2023, 237, 3493–3506. [Google Scholar] [CrossRef]
  3. Javidi, A.; Salajegheh, E.; Salajegheh, J. Optimization of weight and collapse energy of space structures using the multi-objective modified crow search algorithm. Eng. Comput. 2021, 38, 2879–2896. [Google Scholar] [CrossRef]
  4. Guo, X.-S.; Nian, T.-K.; Fan, N.; Jia, Y.-G. Optimization design of a honeycomb-hole submarine pipeline under a hydrodynamic landslide impact. Mar. Georesour. Geotechnol. 2021, 39, 1055–1070. [Google Scholar] [CrossRef]
  5. Gong, H.; Li, H.; Yu, W.; Liu, S.; Yang, S.; Wang, C. Structural Design and Optimization of an Underwater Skirt Pile Gripper. Int. J. Perform. Eng. 2018, 14, 3033. [Google Scholar] [CrossRef]
  6. Hou, S.; Zhang, Z.; Lian, H.; Xing, X.; Gong, H.; Xu, X. Hull shape optimization of small underwater vehicle based on Kriging-based response surface method and multi-objective optimization algorithm. Brodogradnja 2022, 73, 111–134. [Google Scholar] [CrossRef]
  7. Liu, F.; Hu, Y.-M.; Feng, G.-Q.; Zhao, W.-D.; Zhang, M. A study on the multi-objective optimization method of brackets in ship structures. China Ocean Eng. 2022, 36, 208–222. [Google Scholar] [CrossRef]
  8. Yang, H.; Wang, A.; Li, H. Multi-objective optimization for deepwater dynamic umbilical installation analysis. Sci. China Phys. Mech. Astron. 2012, 55, 1445–1453. [Google Scholar] [CrossRef]
  9. Zhang, L.; Zhao, C.Q.; Wang, L.Q.; Ru, C.; Zhu, Z.B. Design and Experimental Research of Expansion-Anchorage Device in Deepwater Pipeline. In Proceedings of the International Symposium on Power Electronics and Control Engineering (ISPECE), Xian, China, 28–30 December 2018. [Google Scholar]
  10. Li, T.; Jiang, D.P.; Xie, P. Anchoring and suspending pipe string mechanical behavior of slip ram for subsea blowout preventer. Ocean. Eng. 2022, 247, 110670. [Google Scholar] [CrossRef]
  11. Brach, S.; Collet, S. Criterion for critical junctions in elastic-plastic adhesive wear. Phys. Rev. Lett. 2021, 127, 185501. [Google Scholar] [CrossRef] [PubMed]
  12. Bowden, F.P.; Tabor, D. The Friction and Lubrication of Solids; Oxford University Press: Oxford, UK, 2001; Volume 1. [Google Scholar]
  13. Akbarzadeh, S.; Khonsari, M. On the applicability of miner’s rule to adhesive wear. Tribol. Lett. 2016, 63, 29. [Google Scholar] [CrossRef]
  14. Aghababaei, R.; Warner, D.H.; Molinari, J.-F. Critical length scale controls adhesive wear mechanisms. Nat. Commun. 2016, 7, 11816. [Google Scholar] [CrossRef]
  15. Mishina, H.; Hase, A. Effect of the adhesion force on the equation of adhesive wear and the generation process of wear elements in adhesive wear of metals. Wear 2019, 432, 202936. [Google Scholar] [CrossRef]
  16. Anderson, D.; Warkentin, A.; Bauer, R. Experimental and numerical investigations of single abrasive-grain cutting. Int. J. Mach. Tools Manuf. 2011, 51, 898–910. [Google Scholar] [CrossRef]
  17. Godet, M. Third-bodies in tribology. Wear 1990, 136, 29–45. [Google Scholar] [CrossRef]
  18. Rabinowicz, E. The effect of size on the looseness of wear fragments. Wear 1958, 2, 4–8. [Google Scholar] [CrossRef]
  19. Jin, R.; Chen, W.; Sudjianto, A. An efficient algorithm for constructing optimal design of computer experiments. In Proceedings of the International Design Engineering Technical Conferences and Computers and Information in Engineering Conference, Chicago, IL, USA, 2–6 September 2003; pp. 545–554. [Google Scholar]
  20. Zhao, M.; Cui, W.-C. Application of the optimal Latin hypercube design and radial basis function network to collaborative optimization. J. Mar. Sci. Appl. 2007, 6, 24–32. [Google Scholar] [CrossRef]
  21. Yu, Y.; Pan, Y.; Chen, Q.; Zeng, D.; Hu, Y.; Goh, H.-H.; Niu, S.; Zhao, Z. Cogging Torque Minimization of Surface-Mounted Permanent Magnet Synchronous Motor Based on RSM and NSGA-II. Actuators 2022, 11, 379. [Google Scholar] [CrossRef]
  22. Chakraborty, S.; Sen, A. Adaptive response surface based efficient finite element model updating. Finite Elem. Anal. Des. 2014, 80, 33–40. [Google Scholar] [CrossRef]
  23. Guan, G.; Wang, L.; Geng, J.; Zhuang, Z.; Yang, Q. Parametric automatic optimal design of USV hull form with respect to wave resistance and seakeeping. Ocean Eng. 2021, 235, 109462. [Google Scholar] [CrossRef]
  24. Mao, Z.Y.; Pi, Y.B.; Li, B.; Lu, C.Y.; Tian, W.L. Parametric optimization for liquid cooling microchannels of AUV’s battery thermal management system. J. Therm. Anal. Calorim. 2022, 147, 9523–9537. [Google Scholar] [CrossRef]
  25. Wu, X.; Chen, C.; Hong, C.; He, Y. Flow ripple analysis and structural parametric design of a piston pump. J. Mech. Sci. Technol. 2017, 31, 4245–4254. [Google Scholar] [CrossRef]
  26. Bekele, E.G.; Nicklow, J.W. Multi-objective automatic calibration of SWAT using NSGA-II. J. Hydrol. 2007, 341, 165–176. [Google Scholar] [CrossRef]
  27. Cai, L.G.; Zhang, C.; Cheng, Q.; Gu, P.H.; Wang, H.Y. An Optimization Method for Geometric Error of Machine Tool Based on NSGA-II. Appl. Mech. Mater. 2013, 418, 180–186. [Google Scholar] [CrossRef]
  28. Wu, M.; Nie, Q.; Li, Y.; Chen, W.; Yue, X.; Zhang, Y. Multi-objective optimization of a new special-shaped tube for heating deicing fluid. J. Therm. Anal. Calorim. 2019, 138, 1487–1498. [Google Scholar]
  29. Xu, H.M.; Ma, X.B.; Liu, Q.H. Simulation and analysis of the in-pipe robot based on the software of Pro/E and ADAMS. In Proceedings of the 2014 International Symposium on Information Technology (ISIT 2014), Dalian, China, 14–16 October 2014; pp. 337–342. [Google Scholar]
Figure 1. Submarine pipeline recovery tool. (a) Holistic model; (b) Contact model of the contact body.
Processes 11 03166 g001
Figure 2. Sketch of the force analysis between the actuator and the contact body during the working process.
Processes 11 03166 g002
Figure 3. Polygon of forces between the actuator and spherical contact body for the pipe recovery process.
Processes 11 03166 g003
Figure 4. Sketch of the force analysis between the actuator and the contact body during the unloading process.
Processes 11 03166 g004
Figure 5. Force polygon between the actuator and the contact body during unloading.
Processes 11 03166 g005
Figure 6. Force analysis of spherical contact body during pipe lifting.
Processes 11 03166 g006
Figure 7. Schematic diagram of the contact between the contact body and the pipe.
Processes 11 03166 g007
Figure 8. Force loading curves.
Processes 11 03166 g008
Figure 9. Experimental setups. (a) Schematic drawing; (b) Physical drawing.
Processes 11 03166 g009
Figure 10. Comparison of experimental result curve and simulation result curve.
Processes 11 03166 g010
Figure 11. The optimization process for contact bodies of subsea pipeline recovery tools.
Processes 11 03166 g011
Figure 12. Schematic diagram of structural dimensions of the contact body to be optimized.
Processes 11 03166 g012
Figure 13. Surface fit. (a) Effect of contact body rounding angle R and contact body cylindrical diameter D on the depth of contact body pressed into the pipe h; (b) Effect of contact body rounding angle R and contact body cylindrical diameter D on the relative sliding distance S between the contact body and the pipe.
Processes 11 03166 g013
Figure 14. Curve fit. (a) Fitted curves of the EBF model for h; (b) Fitted curves of the EBF model for S.
Processes 11 03166 g014
Figure 15. EBF approximation model. (a) EBF approximation model for indentation depth h; (b) EBF approximation model for catch slip distance S.
Processes 11 03166 g015
Figure 16. Pareto results. (a) NSGA-II optimized Pareto results; (b) NCGA optimized Pareto results.
Processes 11 03166 g016
Figure 17. Thrust curve. (a) Thrust curve for pipe expansion uniformity verification; (b) Thrust curves for self-locking verification of ball-cone structures; (c) Push force on actuator unit and pipe displacement curves for PRT locking verification.
Processes 11 03166 g017
Figure 18. Simulation results. (a) The plot of contact force between spherical contact body and pipe in the simulation for verification of pipe tightening uniformity before optimization; (b) The plot of contact force between spherical contact body and pipe in the simulation for verification of pipe tightening uniformity after optimization. (c) Contact force profile between contact body and pipe in self-locking verification simulation before optimization of contact body structure; (d) Contact force profile between contact body and pipe in self-locking verification simulation after optimization of contact body structure. (e) Plot of contact force between contact body and pipe before optimization in pipe locking validation simulation; (f) Plot of contact force between contact body and pipe after optimization in pipe locking validation simulation.
Processes 11 03166 g018aProcesses 11 03166 g018b
Table 1. Material performance parameters of contact bodies and pipes.
ComponentMetal GradeMaterial Density
(Kg/m3)
Young’s Modulus
(N/m2)
Poisson’s RatioCompressive Yield Strength
(MPa)
Tensile Yield Strength
(MPa)
Contact BodyGCr157.85 × 1032.11 × 10110.318151902
PipeX657.85 × 1032.05 × 10110.3414549
Table 2. Root Mean Square and Cubic Roots of EBF and UK Generation Approximation Models.
Sports Event Cubic Root (≥0.9)Root Mean Square (≤0.2)
EBF-modelh0.989830.028
S0.995650.01776
Universal Krigingh0.963250.05522
S0.954760.06202
Table 3. NSGA-II optimization results with numerical results.
NSGA-IID (mm)R (mm)h (mm)S (mm)
Optimal design point57.111.820.1180.396
Simulation results 0.1120.417
Prediction error 5.35%5.30%
C157.312.00.1170.403
Simulation results 0.1100.419
Prediction error 6.36%3.97%
C258.313.80.1130.441
Simulation results 0.1070.450
Prediction error 5.61%2.04%
C356.712.00.1220.394
Simulation results 0.1140.415
Prediction error 7.02%5.33%
C456.512.10.1250.392
Simulation results 0.1170.406
Prediction error 6.84%3.57%
Table 4. NCGA optimization results with numerical results.
NCGAD (mm)R (mm)h (mm)S (mm)
Optimal design point5711.40.1190.397
Simulation results 0.1100.421
Prediction error 8.18%6.05%
C157.211.40.1170.417
Simulation results 0.1090.442
Prediction error 7.34%6.00%
C258.312.00.1160.425
Simulation results 0.110.455
Prediction error 5.45%7.06%
C356.712.10.1210.398
Simulation results 0.1130.415
Prediction error 6.15%4.27%
C456.611.00.1290.390
Simulation results 0.1200.410
Prediction error 7.50%5.13%
Table 5. Comparison of initial and optimized results.
Numerical ValueOriginal FormNSGA-II OptimizationNCGA Optimization
R (mm)3011.7211.4
D(mm)6057.157
hValue (mm)0.0810.1120.110
Difference (%) 38.335.8
SValue (mm)0.7840.3960.421
Difference (%) 49.546.3
Disclaimer/Publisher’s Note: The statements, opinions and data contained in all publications are solely those of the individual author(s) and contributor(s) and not of MDPI and/or the editor(s). MDPI and/or the editor(s) disclaim responsibility for any injury to people or property resulting from any ideas, methods, instructions or products referred to in the content.

