Article

Optimizing Manufacturing Cycles to Improve Production: Application in the Traditional Shipyard Industry

1
Laboratory of Advanced Systems Engineering, National School of Applied Sciences ENSA, Ibn Tofail University Campus, Kenitra 14000, Morocco
2
Faculty of Engineering, Liwa College of Technology, Abu Dhabi 41009, United Arab Emirates
*
Author to whom correspondence should be addressed.
Processes 2023, 11(11), 3136; https://doi.org/10.3390/pr11113136
Submission received: 9 October 2023 / Revised: 26 October 2023 / Accepted: 30 October 2023 / Published: 2 November 2023

Abstract

:
This article explores the important role of traditional shipyards in the global maritime industry, covering aspects of construction, repair, and maintenance. With the advent of faster manufacturing techniques, traditional shipyards face important challenges, such as planning errors, coordination problems, delivery delays, and underutilization of technology, which results in high costs, reduced productivity, and prolonged projects. The application of Manufacturing Cycle Efficiency (MCE) emerged as an important solution to significantly increase production efficiency. MCE empowers shipyards to deal effectively with waste, bottlenecks, and disruptions, thereby increasing performance, competitiveness, and profitability. Using a comprehensive approach that uses both qualitative and quantitative methods, including field surveys, and in-depth interviews in the traditional shipyard industry, this research identifies Nonvalue-Added (NVA) processes, conducts process mapping, and calculates MCE. The findings reported in this article underscore the significant wastage in the production process, indicating an urgent need for improvement, given the current average MCE value of 67.08%, indicating considerable room for improvement. This article provides innovative perspectives on optimizing the traditional shipyard industry through production cycle efficiencies while offering actionable recommendations. Key focus areas include integrating management systems, adopting advanced technologies, and implementing sustainable strategies to improve MCE, especially by reducing nonvalue-added time wastage, such as inspection and storage. By implementing strategies that optimize production, minimize waste, and overcome the challenges of global competition, this research contributes to improving MCE. In conclusion, this study is an invaluable guide for industry stakeholders, enabling them to enhance their competitiveness and adapt effectively to a dynamic business environment.

1. Introduction

The traditional shipbuilding industry (TSI) has long been a crucial pillar of the global economy, providing essential services for the construction, repair, and maintenance of large vessels. It serves as a strategic sector, supporting vital areas such as transportation, sea trade, fishing, and maritime tourism [1]. However, in recent years, this industry has encountered numerous challenges when it comes to enhancing the efficiency and performance of its production processes [2]. The manufacturing process involved in the TSI is intricate, demanding seamless coordination among various departments and specialties. Regrettably, the lack of efficiency in the manufacturing cycle persists as a significant issue within the industry. These challenges encompass errors in production planning [3], inadequate interdepartmental coordination, delays in material delivery, and underutilization of cutting-edge technologies in the process. Consequently, these inefficiencies lead to escalated production costs, diminished productivity, and prolonged project completion [4].
Meanwhile, the management structure in the TSI predominantly retains its family-oriented nature, with a significant portion of the workforce hailing from large family units [5]. Moreover, the technology employed in the construction and repair of wooden ships draws heavily from ancestral knowledge and long-standing expertise acquired over generations [6,7]. The TSI, specializing in wooden ship production, operates within a traditional framework where tools and production techniques remain simplistic [8]. The reliance on manual hammers for nail fastening exemplifies the traditional approach, which not only consumes excessive energy but also poses safety risks [9,10]. Consequently, this approach leads to challenges in material flow alignment with work process planning [11], resulting in substantial nonvalue-added (NVA) activities and suboptimal efficiency in the ship production process [12]. Additionally, the subpar production line balance further accentuates this condition. Several indicators of an inadequate production line include the absence of well-defined work standards influenced by rudimentary work methods, tools, and technology [13,14,15].
In addition to internal challenges, the TSI is confronted with external pressures to embrace sustainable and environmentally friendly practices. The rising demand for energy-efficient and ecoconscious ships in recent years necessitates the optimization of manufacturing cycles within these industries [16,17,18]. This optimization is vital to enhance production efficiency, minimize environmental impact, and sustain competitiveness in an ever-competitive global market [19,20].
Several studies have been conducted to identify and address the challenges associated with enhancing the manufacturing cycle efficiency in the TSI. For instance, [21,22] conducted studies that shed light on various challenges faced by the industry, including prolonged lead times, excessive material wastage, inefficient production layouts, and suboptimal workforce management. These findings underline the significance of implementing appropriate strategies and approaches to overcome these challenges and enhance the performance of the production processes. One of the proposed strategies is the integration of efficient management systems, such as Lean Manufacturing and Total Quality Management [23,24,25]. Meanwhile, research shows how the application of lean principles can result in significant increases in lead times and productivity in shipyards. In this case, emphasizing value mapping and eliminating waste are important in achieving increased efficiency [22,23,24,25,26,27,28].
The research presented above underscores the imperative to delve into the incorporation of streamlined management systems within the TSI. Despite the implementation of broad management systems, like Lean Manufacturing or Total Quality Management in diverse manufacturing sectors, research voids persist concerning their tailored implementation and adaptation in the conventional shipbuilding setting. Hence, it becomes imperative to discern the most efficient and pertinent management practices that can optimize the manufacturing cycle within this industry.
Project Time Deployment (PTD) and Project Cost Deployment (PCD) are two further lean manufacturing techniques that minimize losses by reducing production lead times in Engineer-to-Order (ETO) settings and estimating the effects of prospective (lean) enhancement projects [29,30,31,32]. The lean indicator known as Overall Task Effectiveness (OTE) can assist the analyst in defining target task timeframes and in locating hidden losses that are responsible for the majority of the observed time spent on manual assembly tasks [33].
The literature review presented herein underscores the imperative for a holistic approach to optimizing the TSI. Integrating efficient management systems, utilizing advanced technology, and adopting sustainable practices emerge as pivotal strategies to enhance the manufacturing cycle efficiency and elevate production process performance [34,35]. However, further research is warranted to delve into the practical implementation of these strategies within the context of typical, traditional shipbuilding operations. Moreover, longitudinal studies examining the long-term ramifications of optimization endeavors and the scalability of the proposed solutions would yield profound insights into optimizing the manufacturing cycle within the TSI.
With the aforementioned research gap in mind, the primary objective of this article is to address the existing knowledge deficit and present fresh perspectives on optimizing the TSI through heightened manufacturing cycle efficiency. By delving deeper into the integration of management systems, the application of advanced technology, and the implementation of sustainable strategies, it is anticipated that this article will make a valuable contribution toward the development of a more efficient, sustainable, and competitive TSI.
The utilization of the Manufacturing Cycle Efficiency (MCE) method in the TSI holds paramount importance for enhancing the efficiency and performance of the production process [36]. The MCE method serves as a valuable tool for measuring the efficiency of the entire manufacturing cycle [37]. Through a comprehensive analysis of each production step encompassing waste identification, bottleneck recognition, and interruption assessment, the MCE method facilitates workflow optimization, reduction in lead times, and increased productivity [38,39]. Notably, studies conducted by [40] demonstrate the efficacy of MCE in identifying nonvalue-added activities and curtailing production process duration. Similarly, research conducted by [41] reveals the role of MCE in waste reduction and efficiency enhancement within shipyards. By adopting a holistic approach to manufacturing cycle analysis, these studies enable the identification of areas where time and resources are squandered, thereby facilitating the implementation of measures to bolster efficiency. Furthermore, investigations by [42,43,44] indicate that the MCE method can be leveraged to improve shipyard layouts by scrutinizing material flow and production activities and identifying areas requiring layout modifications or enhancements to optimize workflow and mitigate conflicts. The application of the MCE method also yields benefits in the identification of quality issues and bolsters the effectiveness of quality management. Research by [45,46,47] underscores the significance of comprehending the production process as a whole and employing the MCE method to pinpoint key causes of quality problems, subsequently enabling necessary improvements.
Through a comprehensive analysis of the manufacturing cycle encompassing waste, bottlenecks, and disruptions, the MCE method proves instrumental in augmenting efficiency, minimizing lead times, enhancing quality, and optimizing overall production management. The application of the MCE method empowers shipyards to attain superior production process performance, bolster competitiveness, and yield substantial advantages for the TSI.
This article aims to make a significant research contribution toward optimizing the TSI and enhancing the performance of its production processes. Firstly, it will meticulously identify and analyze the primary challenges encountered by the industry in terms of manufacturing cycle efficiency. Secondly, it will present an array of strategies and steps that the TSI can adopt to enhance the efficiency of its manufacturing cycle. Thirdly, it will expound upon the manifold benefits derived from optimizing the manufacturing cycle within the TSI. Fourthly, this article will offer insights into recent technological advancements and industry practices that can be applied effectively within the traditional shipbuilding context. Fifthly, it will emphasize the pivotal role of sustainability aspects [48] in optimizing the TSI. By providing practical guidance and novel insights, this article endeavors to empower the TSI in its pursuit of improved manufacturing cycle efficiency and enhanced production process performance.
As a result, the paper presents a method of improving the efficiency of production processes in the TSI, aiding in addressing prevailing challenges and fostering sustainable and innovative development in the future.

2. Materials and Methods

The type of research used is descriptive research. Descriptive research is performed by examining job analysis and activities on an object. Initial preparations were made to complete this research by conducting a study of the literature, namely, by collecting relevant material, compiling an analytical framework and a settlement model, collecting secondary data, and preparing the primary data requirements in survey activities for the TSI. In this descriptive study, data collection was obtained from observations, library research, and field research in the form of interviews with sources who had confirmed they knew the information needed by researchers or by direct observation of the actual situation within the company. The selected respondents are stakeholders who have a stake in the implementation and who have in-depth knowledge about the production process in the TSI. The conditions of the existing production process will be analyzed, and recommendations for improvement are sought to increase the productivity of the production system and reduce waste in the production process.
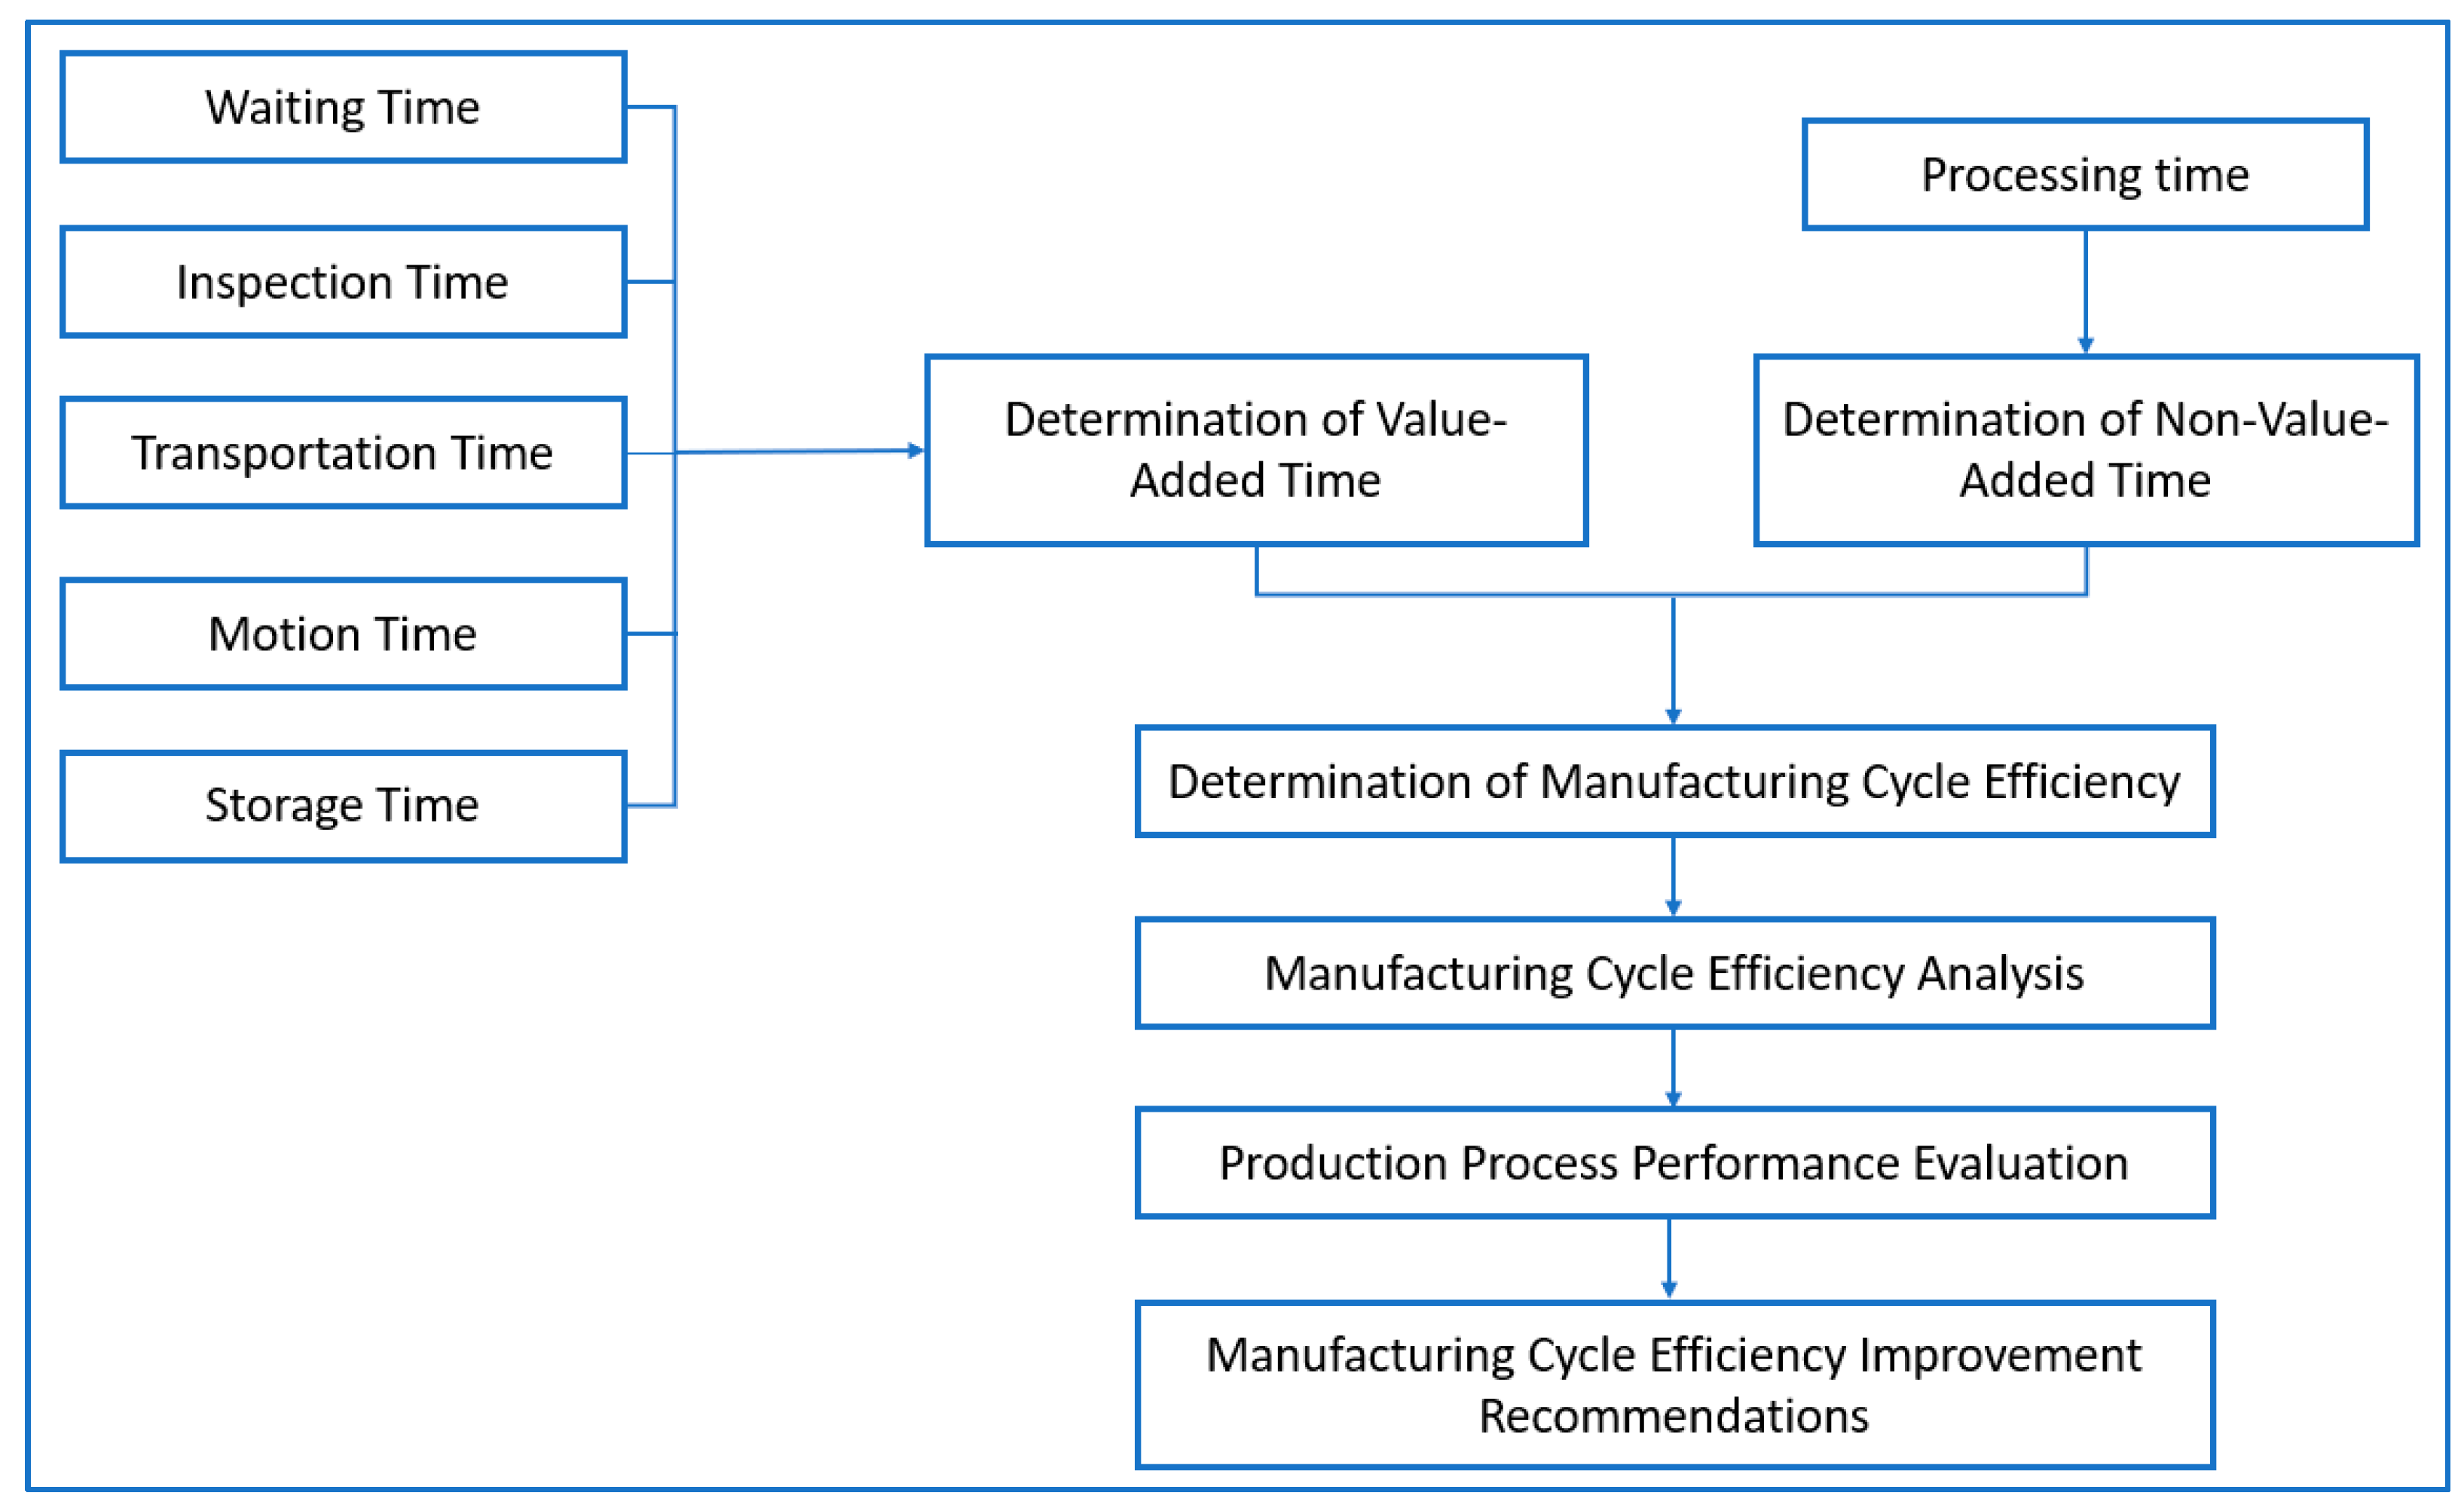
The conceptual framework of research is a relationship or connection between one concept to another concept of the problem to be studied. This conceptual framework is useful for connecting or explaining at length a topic to be discussed. This framework is obtained from the concept of science/theory that is used as the basis for research obtained in the literature review, or, one might say, the research is a summary of the literature review, which is connected by lines according to the variables studied. The conceptual framework is an arrangement of logical constructs arranged in order to explain the variables studied. This framework is formulated to explain the construction of the flow of logic to study empirical reality systematically. The following conceptual framework in this study can be seen in Figure 1.
Data processing with the tools used according to their respective functions.
  • NVA identification
At this stage, the waste that often occurs in the production process was weighted. Direct interviews were carried out with the parties involved in the study implementation focused on the production division, which consisted of 5–7 people to carry out the weighting. The results of this identification yielded nonvalue-added time (NVAT).
b.
Process Activity Mapping
Process Activity Mapping is used to describe the production system (starting from how to order to finished goods as a whole) along with the value stream that exists in the company, so that later, an overview of the information flow and physical flow of the existing system is obtained, identifying where NVA occurs and describing lead times required based on each characteristic of the process that occurs.
c.
MCE measurement
MCE is a metric used to measure the overall efficiency of a production process. MCE describes the extent to which the production process can produce value-added output in one production cycle. The determination of MCE involves calculating the ratio between Value-Added Time (VAT) and Total Cycle Time (TCT). TCT is the time used to convert raw materials into finished products by adding value to the product.
In determining the MCE, the following steps can be followed:
-
VAT identification: Identification and in-depth analysis of all the steps or operations that add direct value to the product. VAT involves operations that transform raw materials into finished products by giving the product new characteristics, uses, or features.
-
Calculate VAT: Calculate the total time spent on those value-added steps. VAT can be measured in relevant time units, such as minutes or hours.
-
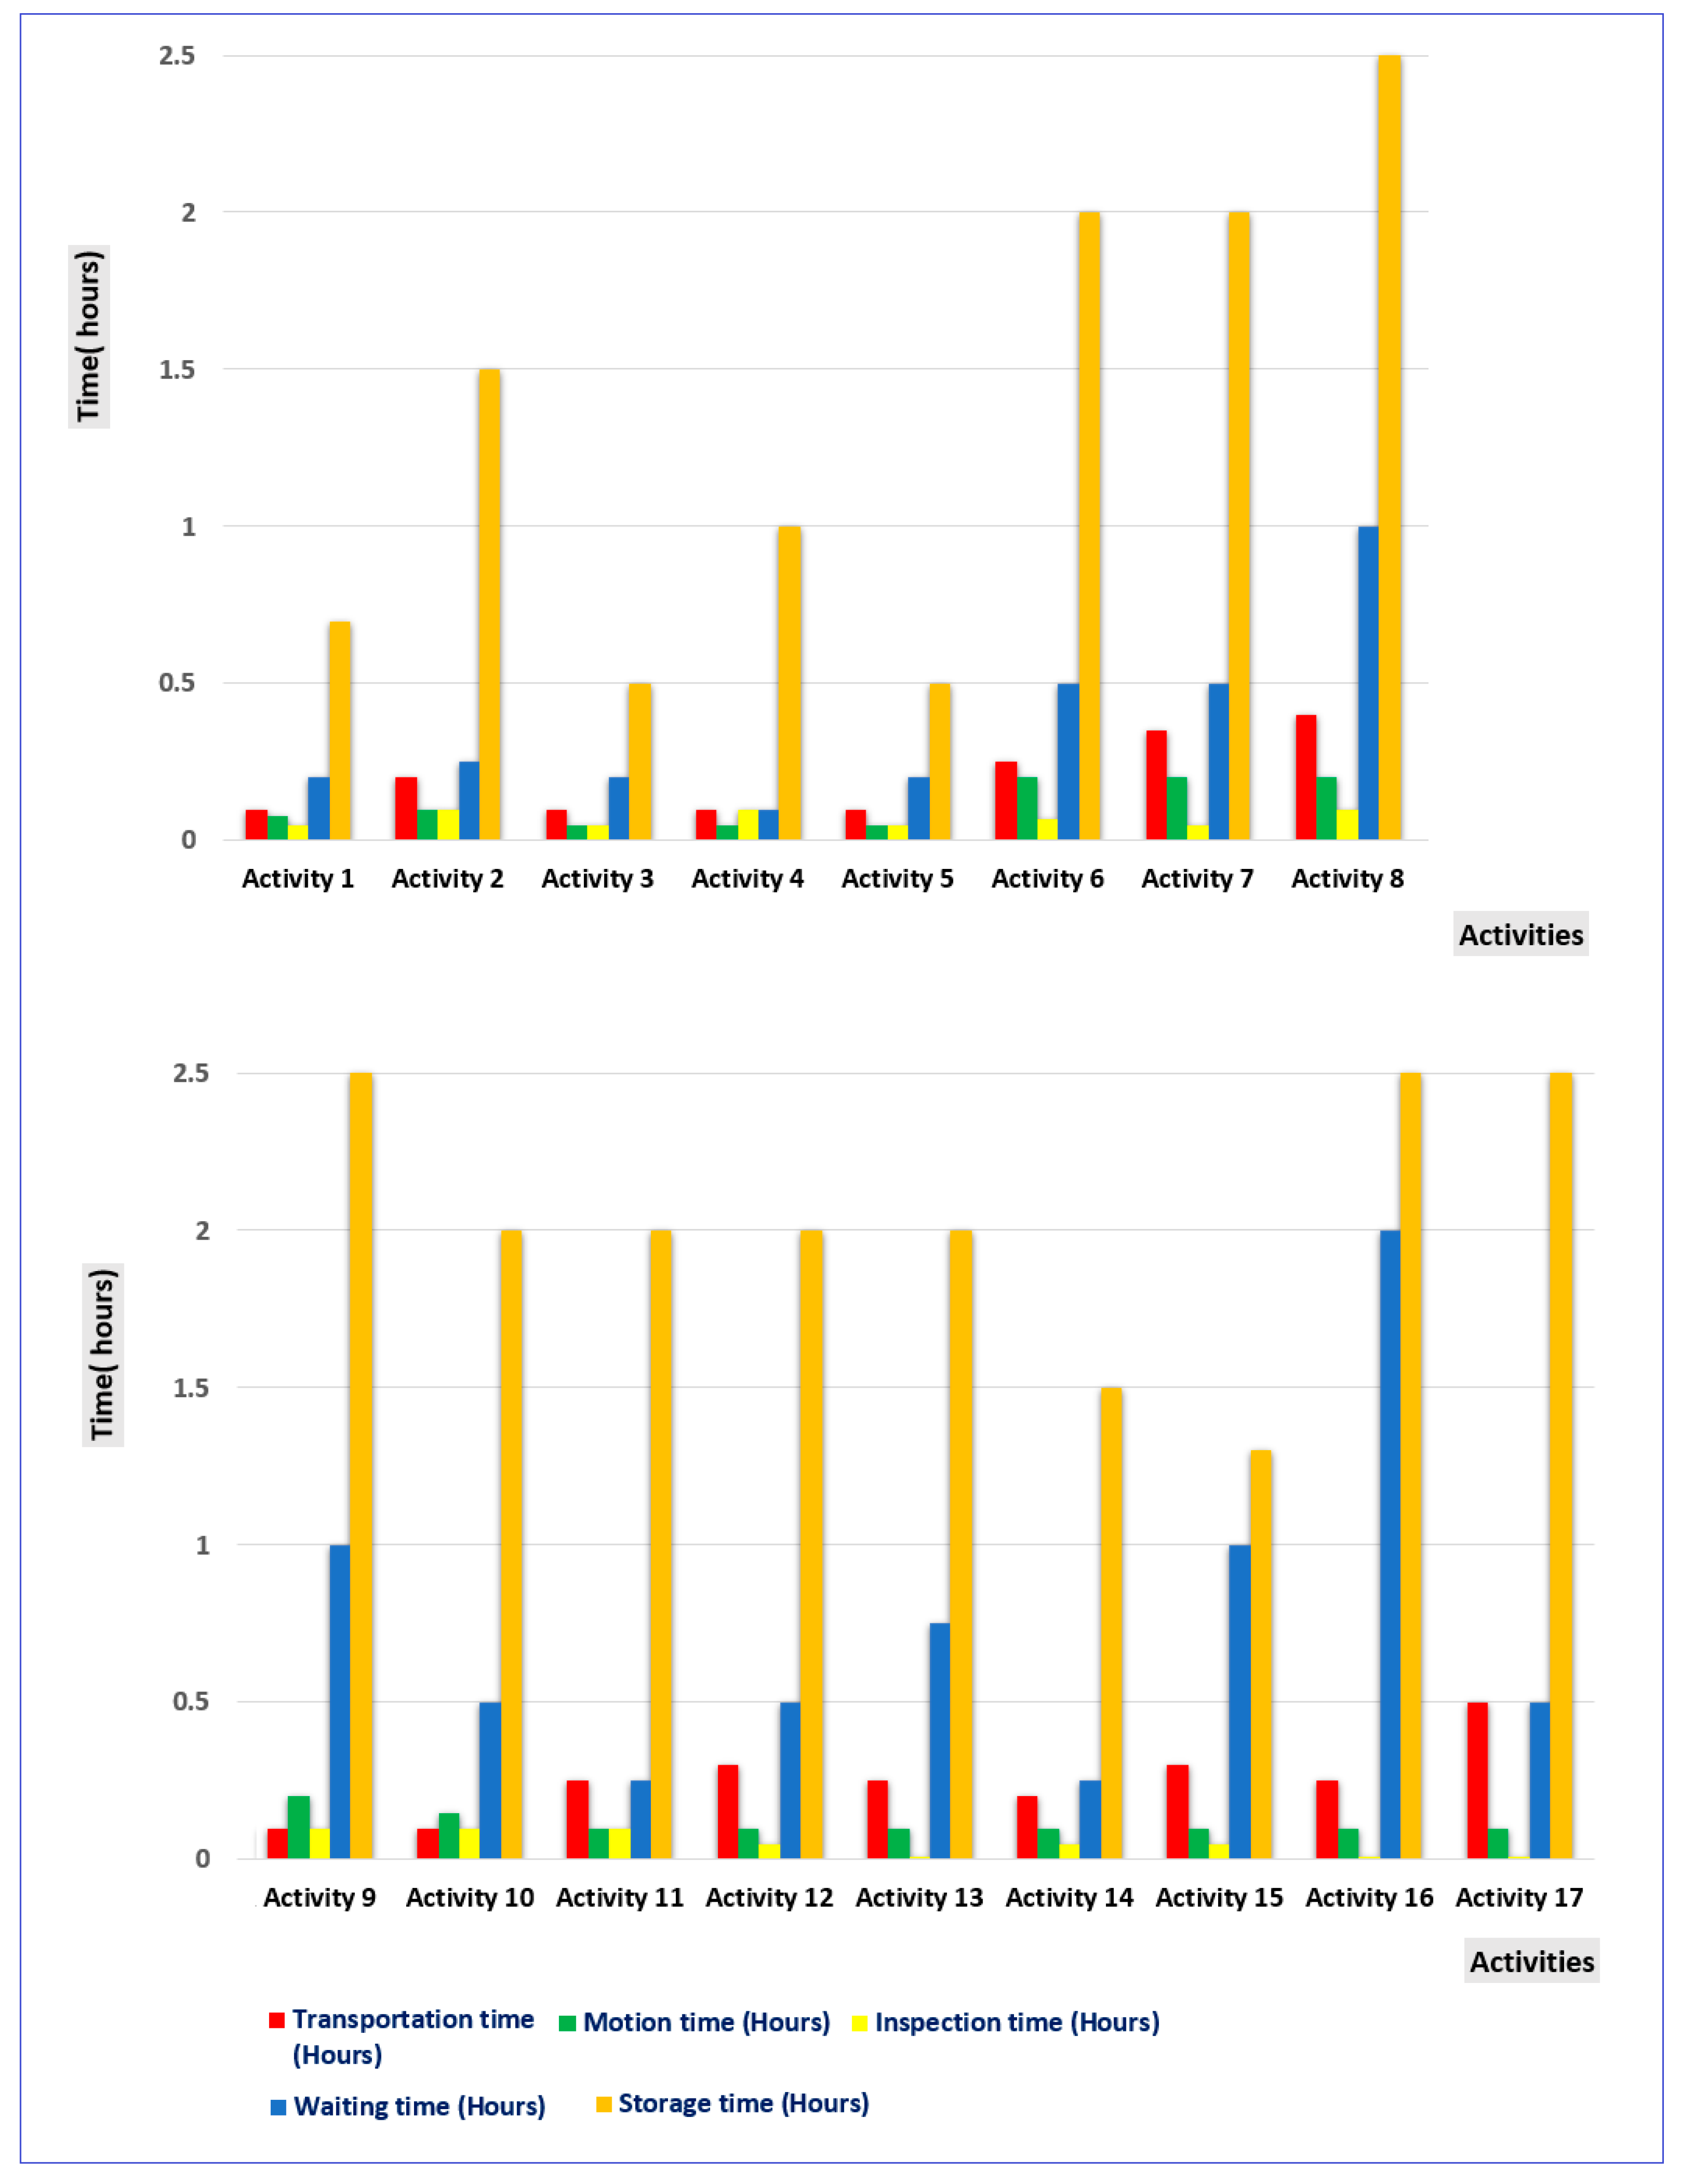
Identification: Identification and analysis of all time elements involved in the production cycle, which consists of processing time (PT), waiting time (WT), transportation time (TT), motion time (MT), inspection time (IT), storage time (ST), and other time that does not provide direct added value.
-
Calculate TCT: Calculate the total time required from start to finish of the production cycle, including all time elements identified in the previous step. The formula for calculating MCE is shown in the following equation:
NVAT = WT + TT + MT + IT + ST
TCT = PT + NVAT
VAT = PT − NVAT
MCE = V A T T C T × 100 %
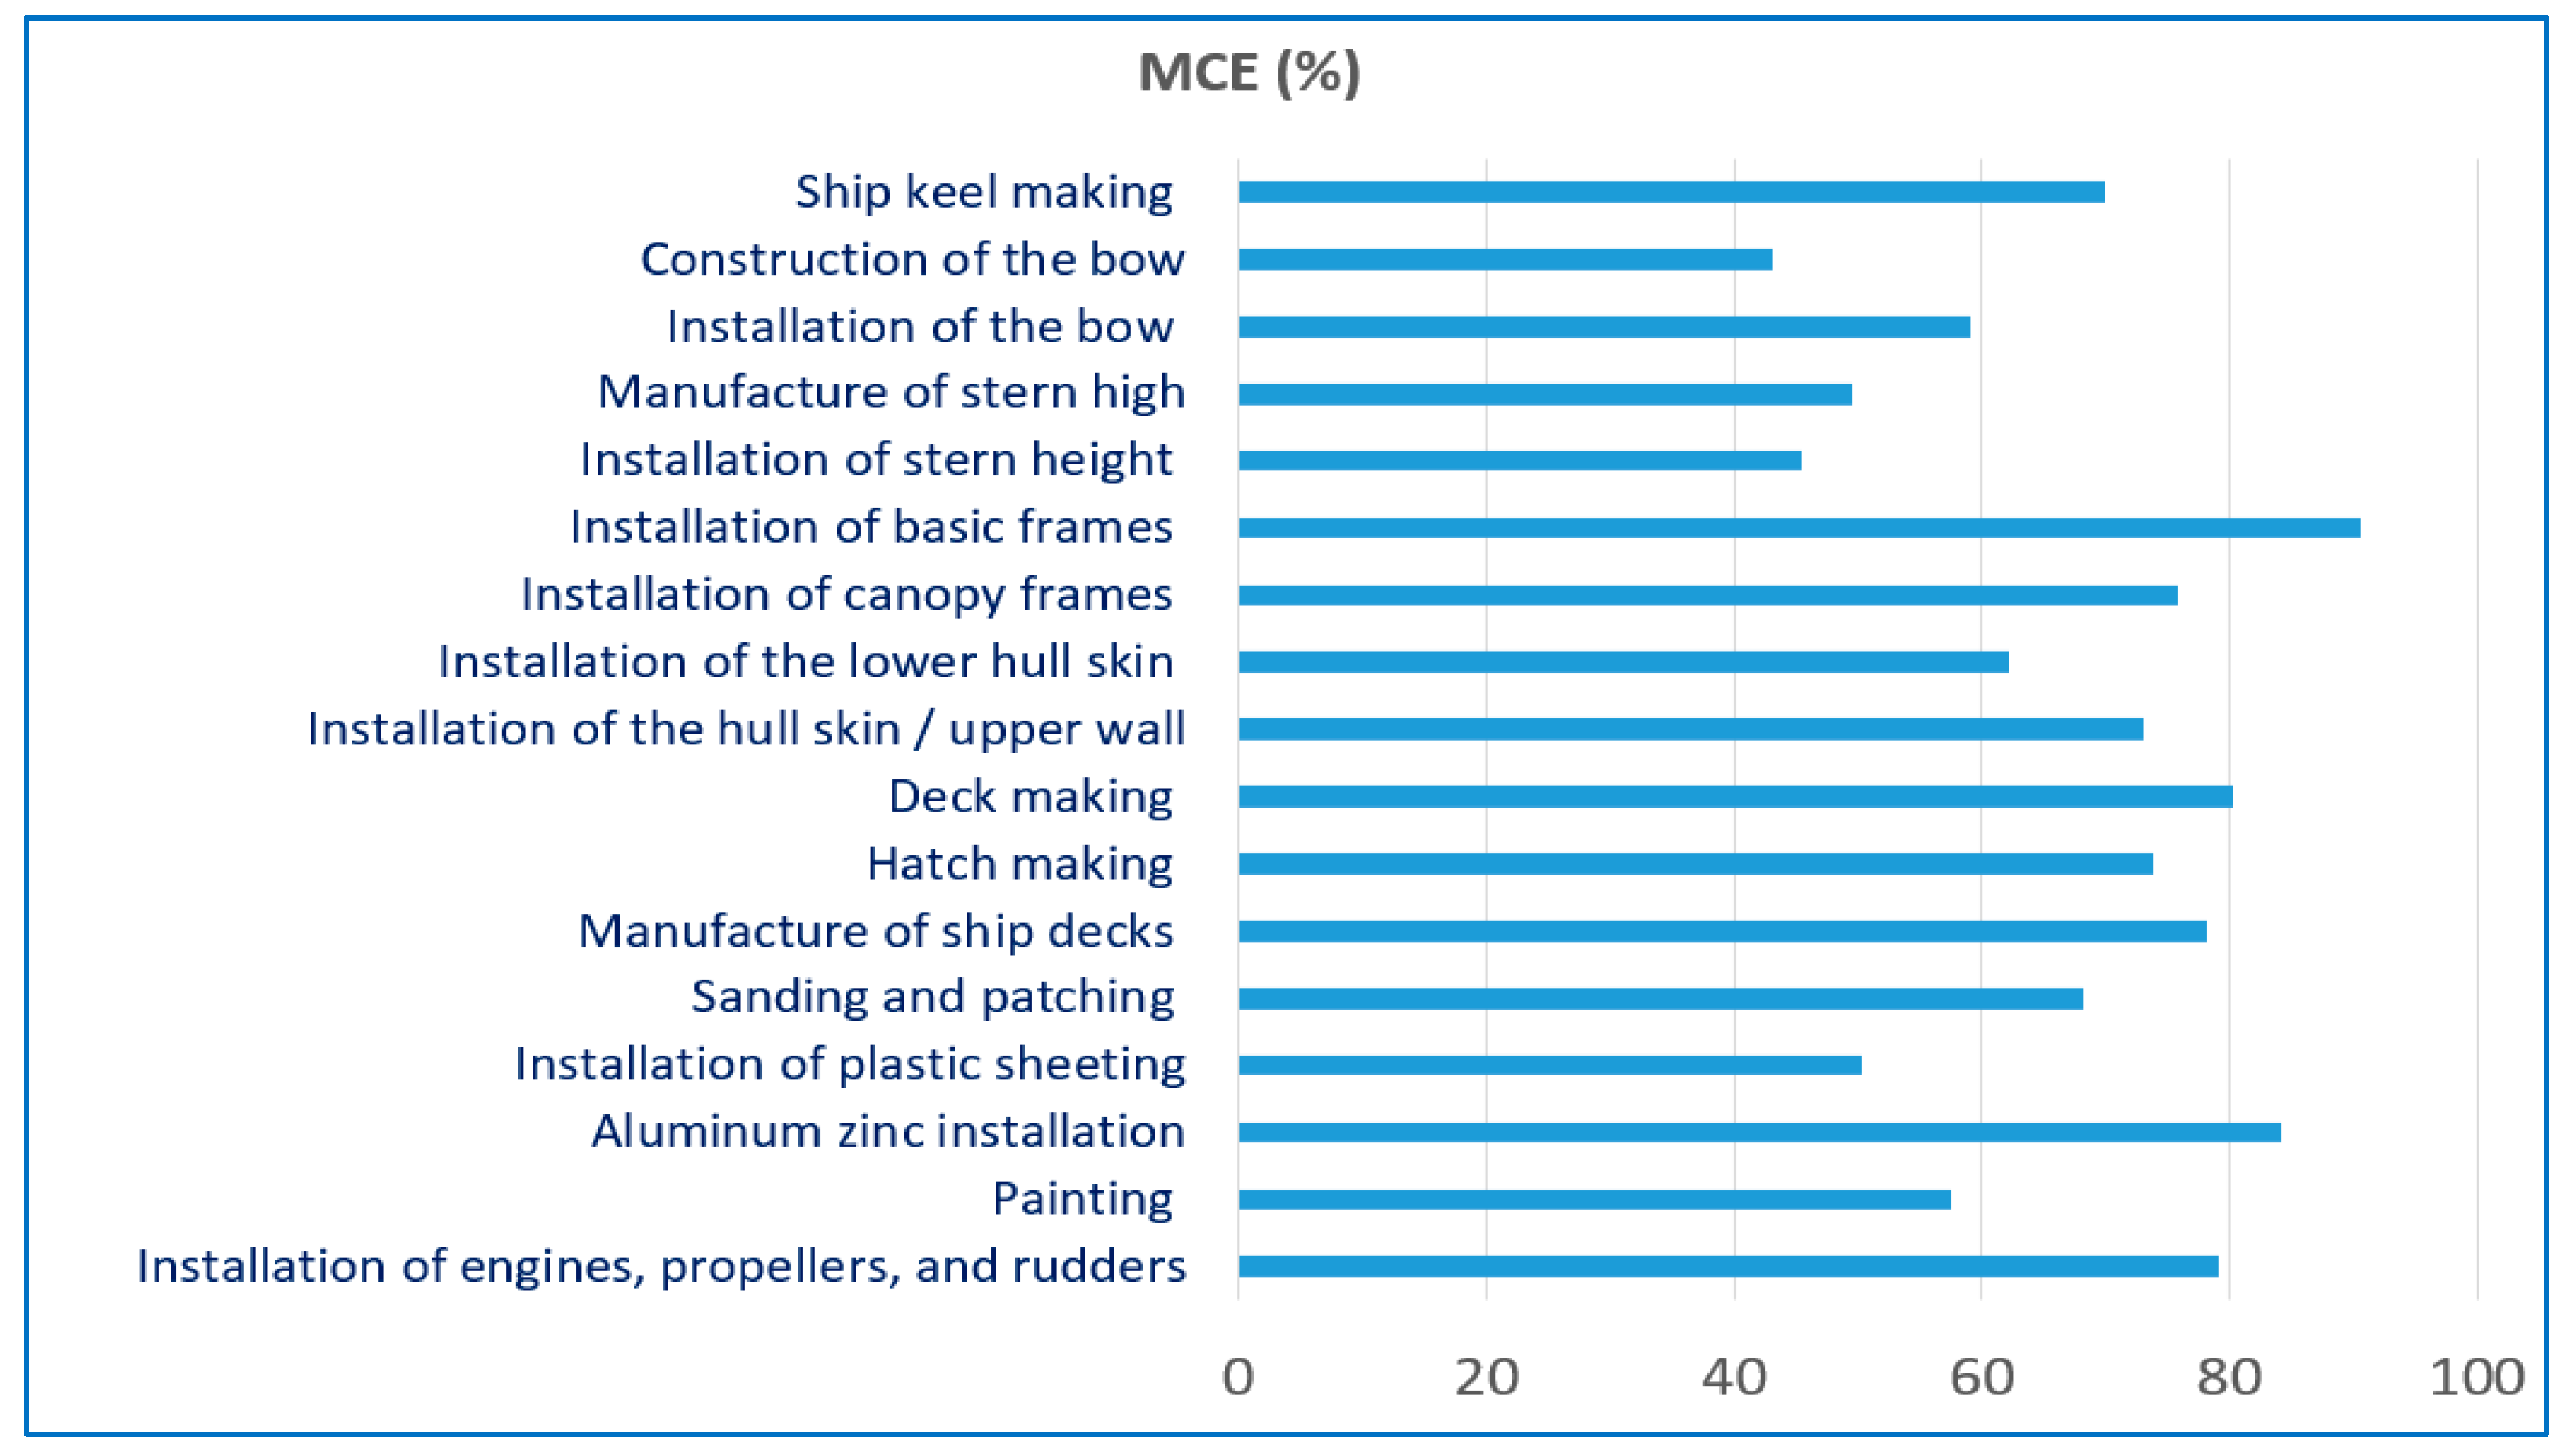
A high MCE indicates that the production process experiences little waste and most of the time is used for value-added activities. Conversely, a low MCE indicates significant time wastage in the production cycle. MCE can be used as a tool to identify and reduce unnecessary time wastage in production processes. By increasing MCE, companies can achieve higher efficiencies, reduce production costs, increase productivity, and improve customer satisfaction with faster delivery times.

3. Results

In a study, collecting data is essential to resolving issues. Additionally, data-gathering techniques play a critical role in obtaining accurate data. The data were obtained in this study through several data collection methods including recording traditional shipyard companies in north of Morocco, historical data, and observing operators work, such as paying attention to the length of time operators spend changing stations while working.

3.1. Waiting Time

Waiting time is an activity in which raw materials and products in the process use up time and resources by waiting for the next process. Data from waiting time activities at shipbuilding production stations were collected through direct observation and interviews with workers who are in the TSI. The waiting time in the traditional shipbuilding process at the TSI starts with the installation of the keel and is then followed by the waiting time for other installations. Data from waiting time activities at shipbuilding production stations were collected through direct observation and interviews with shipyard workers and can be seen in Table 1.
Based on Table 1, almost the entire average waiting time in traditional shipbuilding in the TSI is 24 h and several other waiting times are longer, namely 24–32 h. In the installation of the keel, there is no waiting time because the installation of the keel is the first step and only happens once in the shipbuilding process. Because any material can be used in shipbuilding, and the operator has not started using it yet, this period is defined as waiting time. The waiting time data shown in the table above were used to calculate MCE.

3.2. Transportation Time

This is the activity of moving from the first storage station (warehouse) to the shipbuilding location and then forming and processing it into materials for use in shipbuilding. A certain transportation time is sometimes required in each production process. However, precise sequencing of activities, tasks, and application of technology is required, which can significantly eliminate transportation time. The calculation was performed by adding up all the activities included in the transportation time. The time was obtained by using a stopwatch and a camera. An overview of the operator’s task transfer activities at the shipyard production station was obtained through direct observation and can be seen in Table 2.

3.3. Inspection Time

Inspection activities are carried out in each production process. The calculation made is the sum of all activities starting from the beginning to the end of traditional shipbuilding. The description of the work activities at TSI was obtained through direct observation of the operator at work, by looking at and systematically checking the work being performed. A description of the inspection time activities can be seen in Table 3.

3.4. Motion Time

Motion time in the production process refers to the time required to carry out physical movements or human activities that are not required in the production process. Movements that are inefficient or nonvalue-added can take up valuable time and resources without contributing significantly to product value. An overview of work activities in the TSI was obtained through direct observation of the operator at work and by looking at and systematically checking the work being performed. An overview of moving time activity can be seen in Table 4.

3.5. Storage Time

Storage time is an activity that uses time and resources, as long as products and raw materials are stored as inventory. This storage time is due to the storage process, both raw materials before the production process finally starts and finished goods stored in the warehouse as inventory. Table 5 contains a description of the length of storage time of raw materials in the TSI.

3.6. Processing Time

Processing time in the traditional shipbuilding process refers to the time required to complete a particular operation or stage in shipbuilding. Traditional ships involve complex processes and various stages, from planning to construction and completion. Processing time includes the time required to perform special operations, such as cutting, welding, assembling structures, and painting. Table 6 is an overview of the length of processing time for traditional shipbuilding in the TSI.
The graph in Figure 2 illustrates the correlation between traditional shipbuilding activities and different nonvalue-added time factors.

3.7. MCE Determination

Determining the MCE value begins with identifying the time that does not have added value or NVAT, which consists of WT, TT, MT, IT, and ST. Equation (1) can be used to calculate the NVAT value. The results of these calculations are shown in Table 7. Furthermore, to determine the values of TCT, VAT, and MCE, Equations (2)–(4) can be used, respectively. This calculation uses the data contained in Table 1, Table 2, Table 3, Table 4, Table 5 and Table 6, and the results of this calculation are shown in Table 7.
Based on the calculations presented in Table 7, the obtained TCT value is 364.21 h. Additionally, the MCE value achieved 67.08%. These results indicate that the traditional shipbuilding process in the TSI still exhibits a significant amount of waste, as evidenced by the identified NVAT value of 44.98 h derived from WT, TT, MT, IT, and ST activities in the TSI. For a more comprehensive understanding of the correlation between the MCE value and each specific work activity in traditional shipbuilding in the TSI, please refer to Figure 3.

4. Discussion

In this subchapter, we will delve into a comprehensive analysis of the significant findings previously presented. We aim to expand our understanding of the implementation and significance of the research results within a broader context. Through open-mindedness and critical evaluation, we can identify patterns, trends, and potential alternative explanations that contribute to strengthening the validity of our findings. Let us embark on an exploration of diverse perspectives and generate valuable insights to advance knowledge and shape future research directions.

4.1. Production Process Performance Evaluation

Based on the findings of the MCE research, the calculation results show that the performance of the traditional shipbuilding process in the TSI has a lot of wasteful activities, so it needs to be adjusted. Based on the findings, the average MCE value was 67.08%. This MCE value is indeed not so bad. However, there is no universally permitted minimum value for MCE. The MCE value that is considered good or optimal can vary depending on the industry, product type, complexity of the production process, and company goals. However, in general, the higher the MCE value, the more efficient the production process is. As a general guide, companies often strive to achieve as high an MCE as possible, ideally close to 100%. In this case, most of the time spent in the production cycle is time that adds value to the product.
However, keep in mind that very high MCE values may be difficult to achieve with absolute certainty as some wastage or bottleneck factors may remain in the production process. Factors such as waiting time, transportation, or repair of defects may not be completely eliminated. In addition, each company must consider the balance between MCE and other factors such as production costs, flexibility, order completion speed, and customer satisfaction. In some cases, achieving an MCE that is too high may not be practical or profitable for business. In practice, companies often compare their MCE with previous internal performance or with similar companies in the same industry to determine how far they have achieved production process efficiency. The company’s goal then is to continue to improve its MCE over time through efforts to eliminate waste and increase operational efficiency.
Therefore, to obtain the optimal MCE value, it is necessary to improve the production process in the TSI. The results of calculating the MCE value with various percentage ranges related to activity can be seen in Table 8.
Based on Table 8, the activities that need to be improved have a low MCE % range, namely the range of 40–60% with a total of six activities. Therefore, it must be evaluated in detail, whether the causes of these six activities contribute to the low MCE % value in the traditional shipbuilding process in the TSI. So, to see which wastage factors cause these activities to contribute to the MCE value, a correlation calculation was carried out between MCE and NVAT, which consists of WT, TT, MT, IT, and ST; the correlation values obtained are shown in Table 9.

4.2. Improvement Recommendations

Building upon the evaluation results from the preceding subchapter, recommendations for enhancements are put forth for six activities falling within the MCE % range of 40–60%, with the goal of reducing nonvalue-added time waste based on correlation values exhibiting a moderate relationship within the range of 0.4–0.599. Specifically, the areas that require improvements are the time parameters associated with inspection and storage, which lack added value. These improvement recommendations have been summarized and are presented in Table 10.

5. Conclusions

This research on optimizing the traditional shipyard industry and enhancing manufacturing cycle efficiency has provided valuable insights into improving production process performance. Through an analysis of the industry’s challenges, including production planning errors, coordination issues, material delivery delays, and limited technology integration, it is evident that implementing efficient management systems and utilizing tools, such as the Manufacturing Cycle Efficiency (MCE) method, are essential.
By adopting efficient management systems, like Lean Manufacturing and Total Quality Management, shipyards can eliminate nonvalue-added activities, simplify processes, and reduce waiting times. The application of the MCE method enables a comprehensive analysis of production processes, facilitating the identification of waste, bottlenecks, and interruptions, thus optimizing workflows.
Future Research Plans: To further advance the optimization of the traditional shipyard industry, future research should focus on the practical implementation of these recommendations in real-world shipbuilding contexts. Longitudinal studies evaluating the long-term impact of optimization efforts and assessing the scalability of proposed solutions would provide valuable insights.
Furthermore, future research should explore the integration of advanced technologies and innovative practices within the traditional shipbuilding industry. Investigating the use of digitalization, automation, robotics, and data analytics can lead to significant improvements in manufacturing cycle efficiency and overall production process performance.
Additionally, examining the role of sustainability practices, such as ecofriendly materials, energy-efficient processes, and waste reduction strategies, is crucial for the industry’s long-term viability and environmental responsibility. By conducting these future research studies, the traditional shipyard industry can continue to enhance manufacturing cycle efficiency, improve production process performance, and stay competitive in the evolving global maritime sector.

Author Contributions

Conceptualization, I.J.; Methodology, I.J., Z.B. and H.H.; Software, I.J.; Validation, Z.B.; Formal analysis, Z.B.; Investigation, Z.B.; Resources, I.J.; Data curation, I.J. and H.H.; Writing—original draft, I.J.; Writing—review & editing, I.J. and Z.B.; Supervision, Z.B. and H.H.; Project administration, H.H.; Funding acquisition, H.H. All authors have read and agreed to the published version of the manuscript.

Funding

This research received no external funding.

Data Availability Statement

Data are contained within the article.

Conflicts of Interest

The authors declare no conflict of interest.

References

  1. Soh, M.C.; Shamsuddin, S.M.; Hasan, S. A new framework for dynamical resources planning system in the shipbuilding industry. Int. J. Adv. Soft Comput. Its Appl. 2019, 11. [Google Scholar]
  2. Sukisno; Singgih, M.L. Location Selection Analysis for New Shipyard Using Integration of DEMATEL and ANP: A Case Study (PT IKI). IOP Conf. Ser. Mater. Sci. Eng. 2019, 598, 012109. [Google Scholar] [CrossRef]
  3. Benmamoun, Z.; Hachimi, H.; Amine, A. Comparison of Inventory Models for Optimal Working Capital; Case of Aeronautics Company. Int. J. Eng. 2018, 31, 605–611. [Google Scholar]
  4. Fitriadi, F.; Ayob, A.F.M. Identifying the Shipyard Waste: An Application of the Lean Manufacturing Approach. Int. J. Glob. Optim. Its Appl. 2022, 1, 100–110. [Google Scholar] [CrossRef]
  5. Fitriadi, F.; Mohamad Ayob, A.F. Continuous Improvement Strategy in Traditional Shipyard Industry: A Holistic Approach towards Sustainability. J. Optim. Ind. Eng. 2023, 16, 255–268. [Google Scholar] [CrossRef]
  6. Misra, S.C. Design principles of ships and marine structures. In Design Principles of Ships and Marine Structures; CRC Press: Boca Raton, FL, USA, 2015; pp. 1–461. [Google Scholar] [CrossRef]
  7. Rizwan, T.; Rizki, A.; Salsabila, U.; Muhammad, M.; Maulana, R.; A Chaliluddin, M.; Affan, J.M.; Thaib, R.; Suhendrianto, S.; Muchlis, Y. Literature review on shipyard productivity in Indonesia. Depik 2021, 10, 1–10. [Google Scholar] [CrossRef]
  8. Zazzaro, C.; Liebner, H.; Soriente, A.; Ferraioli, G.; Purnawibawa, A.G. The Construction of a Historical Boat in South Sulawesi (Indonesia): The Padewakang. J. Marit. Archaeol. 2022, 17, 507–557. [Google Scholar] [CrossRef]
  9. Astuti, R.D.; Susmartini, S.; Kinanthi, A.P. Improving the work position of workers based on manual material handling in rice mill industry. AIP Conf. Proc. 2017, 1902, 20043. [Google Scholar] [CrossRef]
  10. Holtermann, A.; Krause, N.; van der Beek, A.J.; Straker, L. The physical activity paradox: Six reasons why occupational physical activity (OPA) does not confer the cardiovascular health benefits that leisure time physical activity does. Br. J. Sports Med. 2017, 52, 149–150. [Google Scholar] [CrossRef]
  11. Elkhechafi, M.; Benmamoun, Z.; Hachimi, H.; Amine, A.; Elkettani, Y. Firefly Algorithm for Supply Chain Optimization. Lobachevskii J. Math. 2018, 39, 355–367. [Google Scholar] [CrossRef]
  12. Tasdemir, C.; Gazo, R. Validation of Sustainability Benchmarking Tool in the Context of Value-Added Wood Products Manufacturing Activities. Sustainability 2019, 11, 2361. [Google Scholar] [CrossRef]
  13. Navarro, A.M.; Sancho, M.P.L.; Garrido, J.A.M. Business process management systems in port processes: A systematic literature review. Int. J. Agil. Syst. Manag. 2020, 13, 258–278. [Google Scholar] [CrossRef]
  14. Schulze, F.; Dallasega, P. Barriers to lean implementation in engineer-to-order manufacturing with subsequent assembly on-site: State of the art and future directions. Prod. Plan. Control. 2021, 34, 91–115. [Google Scholar] [CrossRef]
  15. Vidal-Balea, A.; Blanco-Novoa, O.; Fraga-Lamas, P.; Vilar-Montesinos, M.; Fernández Caramés, T.M. A Collaborative Industrial Augmented Reality Digital Twin: Developing the Future of Shipyard 4.0. In Lecture Notes of the Institute for Computer Sciences, Social-Informatics and Telecommunications Engineering; LNICST; Springer International Publishing: Cham, Switzerland, 2022; Volume 442, pp. 104–120. [Google Scholar] [CrossRef]
  16. Ferreira, F.d.A.L.; Scavarda, L.F.; Ceryno, P.S.; Leiras, A. Supply chain risk analysis: A shipbuilding industry case. Int. J. Logist. Res. Appl. 2018, 21, 542–556. [Google Scholar] [CrossRef]
  17. Jasmi, M.F.A.; Fernando, Y. Drivers of maritime green supply chain management. Sustain. Cities Soc. 2018, 43, 366–383. [Google Scholar] [CrossRef]
  18. Zhou, Y.; Li, X.; Yuen, K.F. Sustainable shipping: A critical review for a unified framework and future research agenda. Mar. Policy 2023, 148, 105478. [Google Scholar] [CrossRef]
  19. Ghatorha, K.S.; Sharma, R.; Singh, G. Lean Manufacturing through PDCA: A Case Study of a Press Manufacturing Industry. In Proceedings of the International Conference on Industrial and Manufacturing Systems; Springer International Publishing: Cham, Switzerland, 2022; pp. 167–187. [Google Scholar] [CrossRef]
  20. Vaidya, S.; Ambad, P.; Bhosle, S. Industry 4.0—A Glimpse. Procedia Manuf. 2018, 20, 233–238. [Google Scholar] [CrossRef]
  21. Praharsi, Y.; Jami’in, M.A.; Suhardjito, G.; Wee, H.M. The application of Lean Six Sigma and supply chain resilience in the maritime industry during the era of COVID-19. Int. J. Lean Six Sigma 2021, 12, 800–834. [Google Scholar] [CrossRef]
  22. Benmamoun, Z.; Fethallah, W.; Ahlaqqach, M.; Jebbor, I.; Benmamoun, M.; Elkhechafi, M. Butterfly Algorithm for Sustainable Lot Size Optimization. Sustainability 2023, 15, 11761. [Google Scholar] [CrossRef]
  23. Aleksandrova, S.V.; Vasiliev, V.A.; Letuchev, G.M. Digital Technology and Quality Management. In Proceedings of the 2018 International Conference “Quality Management, Transport, and Information Security, Information Technologies”, IT and QM and IS, St. Petersburg, Russia, 24–28 September 2018; pp. 18–21. [Google Scholar] [CrossRef]
  24. Sá, J.C.; Vaz, S.; Carvalho, O.; Lima, V.; Morgado, L.; Fonseca, L.; Doiro, M.; Santos, G. A model of integration ISO 9001 with Lean Six Sigma and main benefits achieved. Total. Qual. Manag. Bus. Excel. 2020, 33, 218–242. [Google Scholar] [CrossRef]
  25. Santos Bento, G.D.; Tontini, G. Developing an instrument to measure lean manufacturing maturity and its relationship with operational performance. Total Qual. Manag. Bus. Excell. 2018, 29, 977–995. [Google Scholar] [CrossRef]
  26. Kunkera, Z.; Tošanović, N.; Štefanić, N. Improving the Shipbuilding Sales Process by Selected Lean Management Tool. Machines 2022, 10, 766. [Google Scholar] [CrossRef]
  27. Shahsavar, A.; Sadeghi, J.K.; Shockley, J.; Ojha, D. On the relationship between lean scheduling and economic performance in shipbuilding: A proposed model and comparative evaluation. Int. J. Prod. Econ. 2021, 239, 108202. [Google Scholar] [CrossRef]
  28. Sharma, S.; Gandhi, P.J. Scope and Impact of Implementing Lean Principles & Practices in Shipbuilding. Procedia Eng. 2017, 194, 232–240. [Google Scholar] [CrossRef]
  29. Bertolini, M.; Braglia, M.; Marrazzini, L.; Neroni, M. Project Time Deployment: A new lean tool for losses analysis in Engineer-to-Order production environments. Int. J. Prod. Res. 2022, 60, 3129–3146. [Google Scholar] [CrossRef]
  30. Braglia, M.; Frosolini, M.; Gallo, M.; Marrazzini, L. Lean Manufacturing Tool in Engineering-to-Order Environment: Project Cost Deployment. Int. J. Prod. Res. 2019, 57, 1825–1839. [Google Scholar] [CrossRef]
  31. Braglia, M.; Gallo, M.; Marrazzini, L. A lean approach to address material losses: Materials cost deployment (MaCD). Int. J. Adv. Manuf. Technol. 2021, 113, 565–584. [Google Scholar] [CrossRef]
  32. Matt, D.T. Adaptation of the Value Stream Mapping Approach to the Design of Lean Engineer-to-Order Production Systems: A Case Study. J. Manuf. Technol. Manag. 2014, 253, 334–350. [Google Scholar] [CrossRef]
  33. Braglia, M.; Gabbrielli, R.; Marrazzini, L. Overall Task Effectiveness: A new Lean performance Indicator in engineer-to-order Environment. Int. J. Prod. Perform. Manag. 2019, 68, 407–422. [Google Scholar] [CrossRef]
  34. Jebbor, I.; Benmamoun, Z.; Hachimi, H.; Raouf, Y.; Haqqi, M.; Akikiz, M. Improvement of an Assembly Line in the Automotive Industry: A Case Study in Wiring Harness Assembly Line. In Advances in Transdisciplinary Engineering; Tang, L.-C., Ed.; IOS Press: Amsterdam, The Netherlands, 2023; pp. 62–71. [Google Scholar] [CrossRef]
  35. Raouf, Y.; Benmamoun, Z.; Hachimi, H.; Jebbor, I.; Haqqi, M.; Akikiz, M. Towards a Smart and Sustainable Industry: Cycle Time optimization. In Proceedings of the 2023 3rd International Conference on Innovative Research in Applied Science, Engineering and Technology (IRASET), Mohammedia, Morocco, 18–19 May 2023; pp. 1–7. [Google Scholar] [CrossRef]
  36. Braglia, M.; Frosolini, M.; Gabbrielli, R.; Marrazzini, L. Process Engineering and Optimization. In Operations, Logistics and Supply Chain Management; Zijm, H., Klumpp, M., Regattieri, A., Heragu, S., Eds.; Lecture Notes in Logistics; Springer: Cham, Switzerland, 2019. [Google Scholar] [CrossRef]
  37. da Silva, A.F.; Marins, F.A.S.; Dias, E.X.; Ushizima, C.A. Improving manufacturing cycle efficiency through new multiple criteria data envelopment analysis models: An application in green and lean manufacturing processes. Prod. Plan. Control. 2020, 32, 104–120. [Google Scholar] [CrossRef]
  38. Karim, A.; Arif-Uz-Zaman, K. A methodology for effective implementation of lean strategies and its performance evaluation in manufacturing organizations. Bus. Process Manag. J. 2013, 19, 169–196. [Google Scholar] [CrossRef]
  39. Swarnakar, V.; Singh, A.R.; Antony, J.; Tiwari, A.K.; Cudney, E. Development of a conceptual method for sustainability assessment in manufacturing. Comput. Ind. Eng. 2021, 158, 107403. [Google Scholar] [CrossRef]
  40. Zhang, Y.; Lei, Z.; Han, S.; Bouferguene, A.; Al-Hussein, M. Process-Oriented Framework to Improve Modular and Offsite Construction Manufacturing Performance. J. Constr. Eng. Manag. 2020, 146, 04020116. [Google Scholar] [CrossRef]
  41. Ding, L.-L.; Lei, L.; Wang, L.; Zhang, L.-F.; Calin, A.C. A novel cooperative game network DEA model for marine circular economy performance evaluation of China. J. Clean. Prod. 2020, 253, 120071. [Google Scholar] [CrossRef]
  42. Centobelli, P.; Cerchione, R.; Murino, T.; Gallo, M. Layout and material flow optimization in digital factory. Int. J. Simul. Model. 2016, 15, 223–235. [Google Scholar] [CrossRef] [PubMed]
  43. Jerin Leno, I.; Saravanasankar, S.; Ponnambalam, S.G. Layout Design for Efficient Material Flow Path. Procedia Eng. 2012, 38, 872–879. [Google Scholar] [CrossRef]
  44. Purnamasari, I.; Adhimursandi, D.; Nadir, M. Optimalisasi manufacturing cycle effectivieness (mce) terhadap pengelolaan value added activities dan non value added activities dalam meningkatkan efisiensi produksi. J. Manaj. 2018, 10, 29–37. [Google Scholar] [CrossRef]
  45. Tao, F.; Cheng, J.; Qi, Q.; Zhang, M.; Zhang, H.; Sui, F. Digital twin-driven product design, manufacturing and service with big data. Int. J. Adv. Manuf. Technol. 2018, 94, 3563–3576. [Google Scholar] [CrossRef]
  46. Tao, F.; Qi, Q.; Liu, A.; Kusiak, A. Data-driven smart manufacturing. J. Manuf. Syst. 2018, 48, 157–169. [Google Scholar] [CrossRef]
  47. Yan, J.; Meng, Y.; Lu, L.; Li, L. Industrial Big Data in an Industry 4.0 Environment: Challenges, Schemes, and Applications for Predictive Maintenance. IEEE Access 2017, 5, 23484–23491. [Google Scholar] [CrossRef]
  48. Benmamoun, Z.; Fethallah, W.; Bouazza, S.; Abu Abdo, A.; Serrou, D.; Benchekroun, H. A framework for sustainability evaluation and improvement of radiology service. J. Clean. Prod. 2023, 401, 136796. [Google Scholar] [CrossRef]
Figure 1. The conceptual framework of the research.
Processes 11 03136 g001
Figure 2. Different nonvalue-added time factors for traditional shipbuilding activities.
Processes 11 03136 g002
Figure 3. Graph depicting the relationship between each activity and MCE %.
Processes 11 03136 g003
Table 1. Waiting Time Data on Traditional Ship Production.
No.Activity DescriptionWaiting Time (h)
1Ship keel making0.2
2Construction of the bow0.25
3Installation of the bow0.2
4Manufacture of stern high0.1
5Installation of stern high0.2
6Installation of basic frames0.5
7Installation of canopy frames0.5
8Installation of the lower hull skin1
9Installation of the hull skin/upper wall1
10Deck making0.5
11Hatch making0.25
12Manufacture of ship decks0.5
13Sanding and patching0.75
14Installation of plastic sheeting0.25
15Aluminum zinc installation1
16Painting2
17Installation of engines, propellers, and rudders0.5
Sum9.7
Table 2. Transportation Time Data on Traditional Ship Production.
No.Activity DescriptionTransportation Time (h)
1Ship keel making0.1
2Construction of the bow0.2
3Installation of the bow0.1
4Manufacture of stern high0.1
5Installation of stern high0.1
6Installation of basic frames0.25
7Installation of canopy frames0.35
8Installation of the lower hull skin0.4
9Installation of the hull skin/upper wall0.1
10Deck making0.1
11Hatch making0.25
12Manufacture of ship decks0.3
13Sanding and patching0.25
14Installation of plastic sheeting0.2
15Aluminum zinc installation0.3
16Painting0.25
17Installation of engines, propellers, and rudders0.5
Sum3.85
Table 3. Inspection Time Data on Traditional Ship Production.
No.Activity DescriptionInspection Time (h)
1Ship keel making0.05
2Construction of the bow0.1
3Installation of the bow0.05
4Manufacture of stern high0.1
5Installation of stern high0.05
6Installation of basic frames0.07
7Installation of canopy frames0.05
8Installation of the lower hull skin0.1
9Installation of the hull skin/upper wall0.1
10Deck making0.1
11Hatch making0.1
12Manufacture of ship decks0.05
13Sanding and patching0.01
14Installation of plastic sheeting0.05
15Aluminum zinc installation0.05
16Painting0.01
17Installation of engines, propellers, and rudders0.01
Sum1.05
Table 4. Motion Time Data on Traditional Ship Production.
No.Activity DescriptionMotion Time (h)
1Ship keel making0.08
2Construction of the bow0.1
3Installation of the bow0.05
4Manufacture of stern high0.05
5Installation of stern high0.05
6Installation of basic frames0.2
7Installation of canopy frames0.2
8Installation of the lower hull skin0.2
9Installation of the hull skin/upper wall0.2
10Deck making0.15
11Hatch making0.1
12Manufacture of ship decks0.1
13Sanding and patching0.1
14Installation of plastic sheeting0.1
15Aluminum zinc installation0.1
16Painting0.1
17Installation of engines, propellers, and rudders0.1
Sum1.98
Table 5. Storage Time Data on Traditional Ship Production.
No.Activity DescriptionStorage Time (h)
1Ship keel making0.7
2Construction of the bow1.5
3Installation of the bow0.5
4Manufacture of stern high1
5Installation of stern high0.5
6Installation of basic frames2
7Installation of canopy frames2
8Installation of the lower hull skin2.5
9Installation of the hull skin/upper wall2.5
10Deck making2
11Hatch making2
12Manufacture of ship decks2
13Sanding and patching2
14Installation of plastic sheeting1.5
15Aluminum zinc installation1.3
16Painting2.5
17Installation of engines, propellers, and rudders2.5
Sum29
Table 6. Processing Time Data on Traditional Ship Production.
No.Activity DescriptionProcessing Time (h)
1Ship keel making0.7
2Construction of the bow1.5
3Installation of the bow0.5
4Manufacture of stern high1
5Installation of stern high0.5
6Installation of basic frames2
7Installation of canopy frames2
8Installation of the lower hull skin2.5
9Installation of the hull skin/upper wall2.5
10Deck making2
11Hatch making2
12Manufacture of ship decks2
13Sanding and patching2
14Installation of plastic sheeting1.5
15Aluminum zinc installation1.3
16Painting2.5
17Installation of engines, propellers, and rudders2.5
Sum29
Table 7. MCE determination.
No.Activity DescriptionNVAT (h)TCT (h)VAT (h)MCE (%)
1Ship keel making1.137.535.2769.99
2Construction of the bow2.157.553.2543.05
3Installation of the bow0.94.42.659.09
4Manufacture of stern high1.355.352.6549.53
5Installation of stern high0.93.31.545.45
6Installation of basic frames3.0265.0258.9890.71
7Installation of canopy frames3.125.619.475.78
8Installation of the lower hull skin4.222.213.862.16
9Installation of the hull skin/upper wall3.928.921.173.01
10Deck making2.8528.8523.1580.24
11Hatch making2.720.715.373.91
12Manufacture of ship decks2.9526.9521.0578.11
13Sanding and patching3.1119.6113.3968.28
14Installation of plastic sheeting1.56.033.0350.25
15Aluminum zinc installation2.7534.7529.2584.17
16Painting4.8622.8613.1457.48
17Installation of engines, propellers, and rudders3.6134.6127.3979.14
Sum44.98364.21274.2567.08
Table 8. MCE Range.
Table 8. MCE Range.
No.MCE % RangeNumber of ActivitiesActivity Type
140–60%6Construction of the bow, Installation of the bow, Manufacture of stern high, Installation of stern height, Installation of plastic sheeting, Painting
260–80%8Installation of canopy frames, Installation of the lower hull skin, Installation of the hull skin/upper wall, Hatch making, Manufacture of ship decks, Sanding and patching, Installation of engines, propellers, and rudders
380–100%3Ship keel making, Installation of basic frames, Deck making
Table 9. The correlation of MCE and NVAT.
No.NVATCorrelation Value
1WT0.1704
2TT−0.0919
3MT0.3774
4IT0.5139
5ST0.4304
Table 10. Improvement recommendations.
No.Activity DescriptionImprovement Recommendations for IT ReductionImprovement Recommendations for ST Reduction
1Construction of the bow
-
Improve training and skill development: Invest in training programs to enhance the skills and knowledge of inspection personnel. Well-trained inspectors can perform efficient and accurate inspections, reducing inspection time without compromising quality.
-
Optimize material planning and procurement: Enhance material planning and procurement by accurately forecasting requirements, building strong supplier relationships, and implementing efficient inventory management techniques.
2Installation of the bow
-
Implement quality control checkpoints: Establish checkpoints at key stages of the manufacturing process to ensure adherence to quality standards. Early identification and resolution of potential issues at these checkpoints minimize the need for extensive inspections in later stages.
-
Implement just-in-time (JIT) inventory management: Adopt the JIT approach to minimize storage inventory by receiving materials and components as needed, reducing storage times.
3Manufacture of stern high
-
Standardize inspection procedures: Develop standardized procedures outlining inspection steps, criteria, and documentation requirements. These streamline inspections and ensure consistency across projects.
-
Optimize material handling: Analyze layouts, implement efficient transportation methods, and use appropriate equipment to minimize material transfer time between storage and production areas.
4Installation of stern height
-
Implement risk-based: inspection approach: Prioritize inspections based on risk assessment, targeting critical areas with higher defect probabilities. This approach optimizes inspections, saving time and resources.
-
Implement visual management: Use color-coding and labeling systems to enhance material identification and accessibility, reducing search time and improving overall efficiency in material handling.
5Installation of plastic sheeting
-
Embrace digitalization and automation: Adopt digital solutions and automation technologies for streamlined inspection data collection, analysis, and reporting. These technologies reduce manual paperwork and streamline the inspection process.
-
Implement lean principles: Utilize the 5S methodology to organize and optimize storage areas, eliminating waste and maximizing storage space through sorting, setting in order, shining, standardizing, and sustaining practices.
-
Embrace digitalization and automation: Adopt digital solutions and automation technologies to optimize storage processes. This includes implementing inventory management software, utilizing barcode or RFID systems for efficient tracking, and automating material handling tasks.
6Painting
-
Enhance communication and collaboration: Improve interdepartmental communication and collaboration among design, production, and quality assurance teams. This streamlines the inspection process and minimizes delays.
-
Enhance communication and coordination: Improve interdepartmental communication and coordination for efficient material movement, reducing storage time.
Disclaimer/Publisher’s Note: The statements, opinions and data contained in all publications are solely those of the individual author(s) and contributor(s) and not of MDPI and/or the editor(s). MDPI and/or the editor(s) disclaim responsibility for any injury to people or property resulting from any ideas, methods, instructions or products referred to in the content.

