Article

Kinetic Modeling of Cornstalk Cellulose Hydrolysis in Supercritical Water: A Comparative Study of the Effects of Temperature and Residence Time on Derivative Production

Department of Mechanical Engineering, North Dakota State University, Fargo, ND 58108-6050, USA
*
Author to whom correspondence should be addressed.
Processes 2023, 11(10), 3030; https://doi.org/10.3390/pr11103030
Submission received: 16 September 2023 / Revised: 8 October 2023 / Accepted: 20 October 2023 / Published: 21 October 2023
(This article belongs to the Topic Advances in Biomass Conversion)

Abstract

:
Kinetic modeling is essential in understanding and controlling the process of cellulose hydrolysis for producing value-added cellulose derivatives. This study aims to adopt a set of dominate kinetic ordinary differential equations of cornstalk cellulose hydrolysis in supercritical water for mechanism-based prediction of the production of cellulose, glucose, fructose, glyceraldehyde, erythrose, 5-hydroxymethyl furfural, glycolaldehyde, threose, aldose, and other cellulose derivatives from cornstalks under processing conditions with a pressure of 89 MPa and a temperature of 378 °C, as considered in a recent experimental study in the literature. The yield rates of several cellulose derivatives, e.g., glucose, fructose, 5-HMF, and erythrose as predicted by the present model, are close to those of experimental measurements. The model is further used to predict the yield rates of a few new cellulose derivatives, e.g., glycolaldehyde, threose, and aldose, that are potentially generated in cornstalk cellulose hydrolysis in supercritical water. The present model and computational simulations can be utilized as a rational tool to predict, control, and optimize the derivative yields in cellulose hydrolysis in supercritical water via tuning the process parameters, and, therefore, are useful for the optimal production of targeted bio-based fuels and chemicals from cornstalks and other agricultural and municipal wastes.

1. Introduction

Fast depletion of fossil fuels and increasingly severe global warming due to the over-emission of greenhouse gases have resulted in global concerns about the sustainable development of the world economy and our ecosystem. Increasing research endeavors have been made toward harnessing various renewable energy sources, e.g., exploration of producing plant-derived carbon-neutral biofuels and chemicals to meet the growing demand for energy and materials. Biomass is a renewable and sustainable energy source as well as the fundamental feedstock for producing biofuels and chemicals. Traditionally, biomass is primarily used to produce feedstock for foods and secondarily for biochemicals [1,2]. Biomass consists mainly of cellulose (34–50%), hemicellulose (19–35%), and lignin (11–30%), depending upon the type of biomass [3]. The main interest in exploiting biomass for biofuels and chemicals is its promising resolution in mitigating utilization of nonfood biomass crops [4,5,6].
In a typical industrial process of producing biofuels and biochemicals from biomass, e.g., biomass hydrolysis, the lignin needs to be removed to enable easy access to cellulose, since lignin is a barrier to the high yield of glucose and other valuable polymers from cellulose. Technically, cellulose can be easily hydrolyzed into intermediate monosaccharides and glucose in the presence of acid catalysts, which can be further used for organic synthesis and fermentation. Typically, more organic compounds with higher mass fractions can be derived from cellulose hydrolysis in subcritical water than in supercritical water. Thus, research has shown that cellulose hydrolysis in subcritical water leads to a higher yield of glucose from cellulose [7]. Experimental study has also indicated that the glucose yield cannot be improved from cellulose hydrolysis in subcritical water by simply enhancing the operating temperature due to the unique crystalline structure of cellulose [8]. Glucose is the most abundant and cheapest organic compound derived from cellulose hydrolysis with a yield rate as high as 98–100%. Fructose is another important derivative from cellulose hydrolysis and carries a higher market value than glucose [9]. In addition, 5-hydroxymethyl furfural (5-HMF) is a derivative of glucose with a yield rate of 68–70%, while in the ionic catalyst environment, a yield rate higher than 98% can be achieved. Maximizing the yield of 5-HMF is one of the most important research endeavors in cellulose hydrolysis studies [10,11,12,13]. In addition, harnessing cellulose as the most abundant biopolymer in nature promises groundbreaking advancements in green chemistry based on sustainable and renewable resources in the modern era [14].
To date, the conversion of glucose to glycolaldehyde and erythrose with a yield rate of 50% has been realized by means of the hydrothermal technique at 673 K and 30 MPa. In addition, quick solubilization of cellulose in water and subsequent hydrolysis of the principal constituents into small-molecular-weight compounds are guaranteed through a process of supercritical water treatment. Pretreatment in supercritical water at high pressure and temperature can enhance the glucose yield with a low residence time [15]. Yet, the high operating temperature and pressure are intrinsic economic barriers to the extensive use of supercritical water pretreatment. Nevertheless, the stable production of value-added coproducts may compromise the high cost of this process. In addition, the pretreatment time is an essential process parameter to control the yield of byproducts from cellulosic biomass [15,16,17]. So far, hydrothermal decomposition of cellulosic derivatives has been studied extensively for the purpose of extracting a variety of byproducts from rice husks, among others [18].
Furthermore, all these derivative substances are extremely reactive and can be rapidly converted into water-insoluble humic acids with increasing reaction times. Significant investigation has been devoted to exploring how glucose is converted hydrothermally into biofuels and other chemicals [19]. In principle, acid-assisted or enzymatic hydrolysis requires a longer treatment time, typically more than 3 h, to achieve a derivative from cellulose with low selectivity [20]. Thus, hydrolysis in supercritical water is considered a more adaptable technique for high-efficiency cellulosic depolymerization.
Comparatively, kinetic modeling of cellulose hydrolysis is still not fully explored, though it is important to understand this process for optimal, high-efficiency production of cellulose derivatives from biomass [21,22,23,24,25]. Such research efforts can be beneficial to the advancement of cellulose electrolysis in practice.
This study aims to formulate a kinetic model for the simulation of an experimental process of cellulose hydrolysis in supercritical water as reported in the literature [23]. A system of ordinary differential equations (ODEs) is established, and the high-efficiency 4th-order Runge–Kutta numerical method is adopted to numerically solve this set of ODEs for the kinetic process. The computational results are compared with those in the literature [23]. Though quite a few experimental studies have been reported in the literature for cellulose hydrolysis [6,26,27], detailed kinetic modeling of the hydrolysis process is still lacking. The present study can contribute to the rational understanding of cellulose hydrolysis for better, controllable production of cellulose-derived biofuels and other value-added chemicals, especially, beneficial to predict the yield of cellulose derivatives, e.g., glucose, fructose, 5-HMF, glyceraldehyde, erythrose, glycolaldehyde, aldose, threose, and others. The paper is organized as follows. After the introduction, the detailed procedure to establish the rational ODEs for the kinetic cellulose hydrolysis is detailed in Section 2. The numerical results and discussion, as well as comparisons with experimental data in the literature, are presented in Section 3. Consequently, the conclusions of the present study are drawn in Section 4.

2. Statement of the Problem and Solution

Under subcritical water conditions, acid- and base-catalyzed mechanisms predominate in cellulose hydrolysis. By contrast, supercritical water can act as an effective medium for the efficient conversion of cellulosic materials into intermediate chemicals of small molecular weights, e.g., polysaccharides, cellobiose, glucose, fructose, 5-HMF, starch, sorbitol, glycolaldehyde, furan, erythrose, threose, aldose, pyruvaldehyde, and others. Figure 1 shows several possible reaction pathways of cellulose hydrolysis in supercritical water, and Table 1 lists the kinetic constants of a few corresponding conversion reactions. To understand the effects of various material properties and process conditions on the yield of cellulose derivatives, it is necessary to investigate the entire chemical reactions involved in cellulose hydrolysis [21]. To date, the hydrolysis of cellulosic biomass under various experimental conditions has been broadly investigated in the literature to determine the main product yields and related kinetic reaction rate constants.
In this work, a system of first-order ODEs and related high-efficiency numerical methods are formulated to simulate the kinetic process of hydrothermal degradation of cellulose into aldehydes in supercritical water. This modeling process is specifically used to monitor the conversion of cellobiose to 5-HMF and glyceraldehyde, and the relevant reaction pathways are shown in Figure 1. It is noted that, in the experimental process of cellulose hydrolysis, cellulose reaches the maximum temperature at the reactor inlet where the supercritical water is mixed with the cellulose. Thus, the dehydration reaction can be accelerated with the enhancement of the thermal properties [26]. In this study, the cellulose mass concentration at the reactor inlet is selected as the same as that reported in a recent experimental study [27].
The reaction pathway consists of three different steps, i.e., cellulose hydrolysis, monomers to saccharides, and the isomerization process of polysaccharides to glucose and other derivative compounds. The intricate nature of cellulose hydrolysis renders it a formidable task to isolate each of the cellulose derivatives. Herein, to adopt a similar modeling process available in the literature [28], a modified first-order kinetic equation is formed to model the degradation of cellulose in supercritical water as
d x d t = 2 k 1 x ,
which leads to an explicit solution of the mass concentration of cellulose:
x = 1 1 k t 2 .
When t = 0 in Equation (2), it results in x = 1, corresponding to the initial mass concentration of cellulose, and the value of k varies with the product to be hydrolyzed. In addition, the reactor flow rate Qr (m3s−1) is an essential parameter, which is determined as
Q r = v ˙ × A × t = V / t ,
where the hydrolysis reactor is assumed as a cylindrical tube of constant temperature and pressure, V = π r 2 z is the volume of the entire reactor tube, and A = π D 2 / 4 is the cross-sectional area, with the tube diameter D = 0.0032 m as used in the experimental study [18]. In addition, v ˙ is the flow rate, and t is the entire reaction time of the cellulose undergoing in the reactor tube [5]. The conversion rate of cellulosic biomass is one of the process indicators used to assess how efficiently cellulose is being depolymerized into its derivatives. For instance, a higher conversion rate corresponds to a faster product yield. The conversion rate X in cellulose hydrolysis is defined as
X = W 0 W W 0
where W0 is the cellulose concentration at the inlet of the reactor, and W is the cellulose concentration at the reactor outlet after hydrolysis. The entire conversion of cellulose can be divided into several steps from biomass to pretreatment, which are not discussed in this study, followed by cellulose hydrolysis into saccharides and cellobiose, and finally degradation of glucose into further derivatives. The present modeling study is employed to simulate the kinetic processes from cellulose to erythrose and others. The cellulosic biomass is depolymerized into cellobiose and oligosaccharides, which are carbohydrates consisting of 3–10 saccharide units and are further hydrolyzed into glucose. Oligosaccharides can exist alone in the reaction, or bonded with lipids and proteins in the shape of glycoproteins and glycolipids. The kinetic process of dehydration of cellulose ncell to glucose ng can be described as
d n c e l l d t = ρ a m ˙   [ ( k o g W c e l l u l o s e M W g l u c o s e C W g l u c o s e ) n c e l l u l o s e + 2 k h m f n c e l l o b i o s e + k g e g n g ]
and the evolution of the oligosaccharide concentration nog is described as
d n o g d t = ρ a m ˙ [ F M c 2 k 1 x 1 2 k o g ] n o g .
During the hydrolysis reaction, degradation of cellulose can generate various by-products including cellopentaose, cellotetraose, cellotriose, and cellobiose. In addition, the process consumes supercritical water, which consequently increases the overall mass of reactants. To ensure accurate mass computations in the modeling process, carbon fraction φ is introduced and defined as φ = φ c e l l u l o s e φ c e l l o b i o s e = C W c e l l u l o s e / M W c e l l u l o s e C W c e l l o b i o s e / M W c e l l o b i o s e , where C W c e l l u l o s e / M W c e l l u l o s e and C W c e l l o b i o s e / M W c e l l o b i o s e are given below. The values used in the present simulation and the molecular weights of all the cellulose, cellobiose, and glucose depend on the volume of cellulose used in the experiment. Thus, the concentration of cellobiose ncello is determined by kinetic Equation (7) as
d n c e l l o d t = ρ a m ˙ [ 1 F φ m c M W c e l l o 2 k   1 x 1 2 k c e l l ] n c e l l
In Equation (7), mc is the cellulose mass in the reactor after being mixed with the supercritical water. For one mole of glucose, one mole of water is added to the reaction to increase its overall mass. Here ncell is the molar concentration of cellulose, ncello cellobiose, ng glucose, nf fructose, ngly glycolaldehyde, nh 5-HMF, ne erythrose, and nglyd glyceraldehyde. These molar flow profiles can be altered by post-experimental products. kcell, kcello, and kog are the kinetic rate constants for cellulose, cellobiose, and oligosaccharides, respectively. The values of these kinetic rate constants are selected according to the recent experiments as shown in Table 2 [29].
Furthermore, the molar concentration ng of glucose (molL−1) is determined by the below kinetic equation as
d n g d z = ρ a m ˙ [ k p g   n c e l l   C W c e l l C W g M W g + 2 k h m f n c e l l o b i o s e ( k g f n O H + k g ) n g ]
where the kinetic rate constant kg is given in Table 2, CWcell is the mass of carbon per unit of the cellulose molecule, and MWg is the molecular weight of a glucose molecule as given in Table 3. In addition, ncell, ng, nhmf, ncello, and nOH stand for the molar concentrations (molL−1) of cellulose, glucose, 5-HMF, cellobiose, and ions, respectively. In addition, the molar concentrations of fructose nf, glycolaldehyde nglyd, and 5-HMF nhmf in cellulose hydrolysis are determined by the following three kinetic equations, respectively,
d n f d t = ρ a m ˙ 2 k g g l y n f + 2 k f g l y n g k h m f n h m f n f ,
d n g l y d d t = ρ a m ˙ [ k g f k g ( k f e + k f g l y ) k f ] n g l y ,
d n h m f d t = ρ a m ˙ ( k h m f k g k g l y ) n h m f .
In the above, kfe, kfglyd, and kggly are the constant reaction rate rates of fructose to erythrose, fructose to glyceraldehyde, and glucose to glycolaldehyde, respectively, with the unit of Lmol−1s−1. In addition, the molar concentration of erythrose ne can be determined by the kinetic equation based on experimental observation [23] as
d n e d t = ρ a m ˙ k g e k f + 2 k f g l y k g k g g l y n e .
Therefore, solving the above set of kinetic Equations (4)–(12) with proper initial conditions and kinetic rate constants can determine the instantaneous molecular concentrations of all the cellulose derivatives in hydrolysis, which can be validated using experimental results available in the literature [23]. The MATLAB® (Version 2020a) software provides the high-efficiency 4th-order Range–Kutta method, a powerful tool for precisely solving the present set of kinetic ODEs. Through detailed numerical modeling, the primary chemicals derived from cellulose, e.g., cellobiose, oligosaccharides, fructose, 5-HMF, glyceraldehyde, erythrose, glycolaldehyde, threose, and aldose, can be determined. Other potential derivatives in cellulose hydrolysis, e.g., sorbitol, 2,5-furan, isosorbide, D-glucitol, anhydro, and phosphoglucomutase, can also be investigated by this type of numerical simulation with the assistance of experimental measurements.
Moreover, the above set of kinetic equations can be further extended to model the evolution of molar concentrations of threose (nt), 6-phosfogluconic acid (nph), aldose (na), and pyruvaldehyde (npyr), respectively, according to the reaction pathways as shown in Figure 1. Therefore, the molar concentration of erythrose (nt) can be determined as
d n t d t = ρ a m ˙ ( k g e n g k t n g k e n e ) ,
where nt is the molar concentration of threose (molL−1), and kge is the kinetic rate constant from the glucose to erythrose reaction (Lmol−1s−1). The chemical conversion of cellulose to pyruvaldehyde in supercritical water is a well-known process, similar to the conversion of ketose to aldose through the hydrolysis of erythrose to threose to achieve 6-phosfogluconic acid and aldose. The kinetic equation to generate aldose can be described as
d n a d t = ρ a m ˙   ( k g e n g + k t n t )
where na is the molar concentration of aldose (molL−1). In addition, ketose contains a ketone functional group, and the aldehyde functional group is also found in glucose, aldose, and threose, which results from the conversion of glucose to aldose in a series of isomerizations. The kinetic constants kt and ka are for threose and aldose, respectively. Furthermore, the kinetic equation for phosphoglucomutase generation can be described as
d n p h o s d t = ρ a m ˙ k g n g n O H k t n t + k a n a .
Herein, nphos is the molar concentration of phosphoglucomutase (molL−1) and nOH is the moles of water added to increase the total mass of solution. Conversion of phosphoglucomutase to aldose involves several conversion reactions from fructose to ribulose-5-phosphate. In reality, glucose with five carbon atoms in each molecule can be further converted into erythrose, aldose, threose, etc. Thus, the overall conversion of phosphoglucomutase to aldose is a complex process of hydrolysis. Consequently, the kinetic equation for generating pyruvaldehyde can be described as
d n p y r d t = ρ a m ˙   ( k g e n g + k t n t + k p g n p g k a n a ) ,
where npyr is the molar concentration of pyruvaldehyde (molL−1), and kge and kphos are the kinetic rate constants for conversions of glucose to erythrose and 6-phosphogluconate, respectively.
As mentioned above, cellulose is the most common polymer in plants with a mass concentration of about 40–50% depending on the plant type, and its functionalities in plants are fundamental [3,30]. Cellulose is made up of glucose units joined to each other through the β-1,4-glycosidic bondages. In this study, the above kinetic ODEs are adopted to mimic the process of cellulose depolymerization via breaking down the covalent bonds of cellulose in supercritical water and then producing smaller molecules of cellobiose and its saccharides. In principle, the kinetic rate constants and initial cellulose concentration influence all the reactions in hydrolysis. The reaction parameters, such as the rate constants and activation energies, determine the intrinsic properties of the reactions involved in cellulose hydrolysis and govern the reaction rates. The kinetic constants and activation energies carry inverse relations. In this study, all the kinetic rate constants are selected according to the actual reactions observed in experiments as reported in the literature [18].

3. Results and Discussion

3.1. Cellulose Hydrolysis

With the above set of ODEs to describe the kinetic process of cellulose hydrolysis and the available kinetic rate constants, an effective numerical algorithm based on the 4th-order Range–Kutta method, available in MATLAB® (Version 2020a), is employed to predict the conversions of cellulose and its derivatives with the residence time at several operating temperatures, as shown in Figure 2, Figure 3, Figure 4, Figure 5, Figure 6, Figure 7 and Figure 8. It needs to be mentioned that the experimental data available in the literature were obtained in the specified temperature ranges. For the convenience of the comparative study herein, the present numerical modeling adopts the same operating temperature of 378 °C and residence time of 15 s. In addition, residence time is an essential parameter to dominate the yields of cellulose and other cellulosic derivatives, and the present modeling indicates that it is challenging to tailor the residual time to achieve a better yield for all the derivatives at a given temperature. In reality, the temperature range of 378–382 °C is typically employed for cellulose hydrolysis in supercritical water, while the residence time range is typically chosen as 15–18 s [22,27,29]. The model parameters used in the present numerical simulation are listed in Table 3.
Figure 2 shows the variation of the cellulose concentration with the residence time during a supercritical water hydrolysis of cornstalk cellulose at 378 °C. For comparison, the experimental measurement is also presented. It is evident that the cellulose hydrolysis process exhibits a rapid pace in supercritical water, which results in over 80% of cellulose being converted into its derivatives after a short duration of 15 s. Notably, the numerical prediction made by the present model agrees well with the experimental measurement [18].
In addition, at the operating temperature of 378 to 382 °C, the present model predicts that 60–80% of cellulose is converted into cellobiose, while 20–40% is hydrolyzed into other derivatives. For instance, at 378 °C cellulose is hydrolyzed into cellopentaose, cellotetraose, cellotriose, and cellobiose. The reaction rates typically increase with increasing temperature, since, at high temperatures, the reactant molecules are more likely to react with each other with their high kinetic energy and pass over the activation energy barriers. Yet, hydrolysis at high temperatures has its limitations since excessive thermal energy can negatively induce undesired cellulose derivatives. During the process of cellulose hydrolysis, a long polymeric chain breaks down into smaller oligomers, cellopentaose, cellotetraose, cellotriose, and cellobiose; correspondingly, the cellulose percentage decreases [28]. Furthermore, extended residence time can result in an elevated hydrolysis rate. Essentially since more cellulose tends to break down over a longer residence time, which also enables more cellulose to convert into glucose. As a result, cellulose needs a residence time of >15 s to degrade into other derivatives, though a higher operating temperature (e.g., 380 °C) may negatively deteriorate the hydrolysis. In addition, it is observed that more than 50% of cellulose is hydrolyzed into oligosaccharides and glucose at a normal residence time, and higher temperature and residence time commonly work inversely [23].

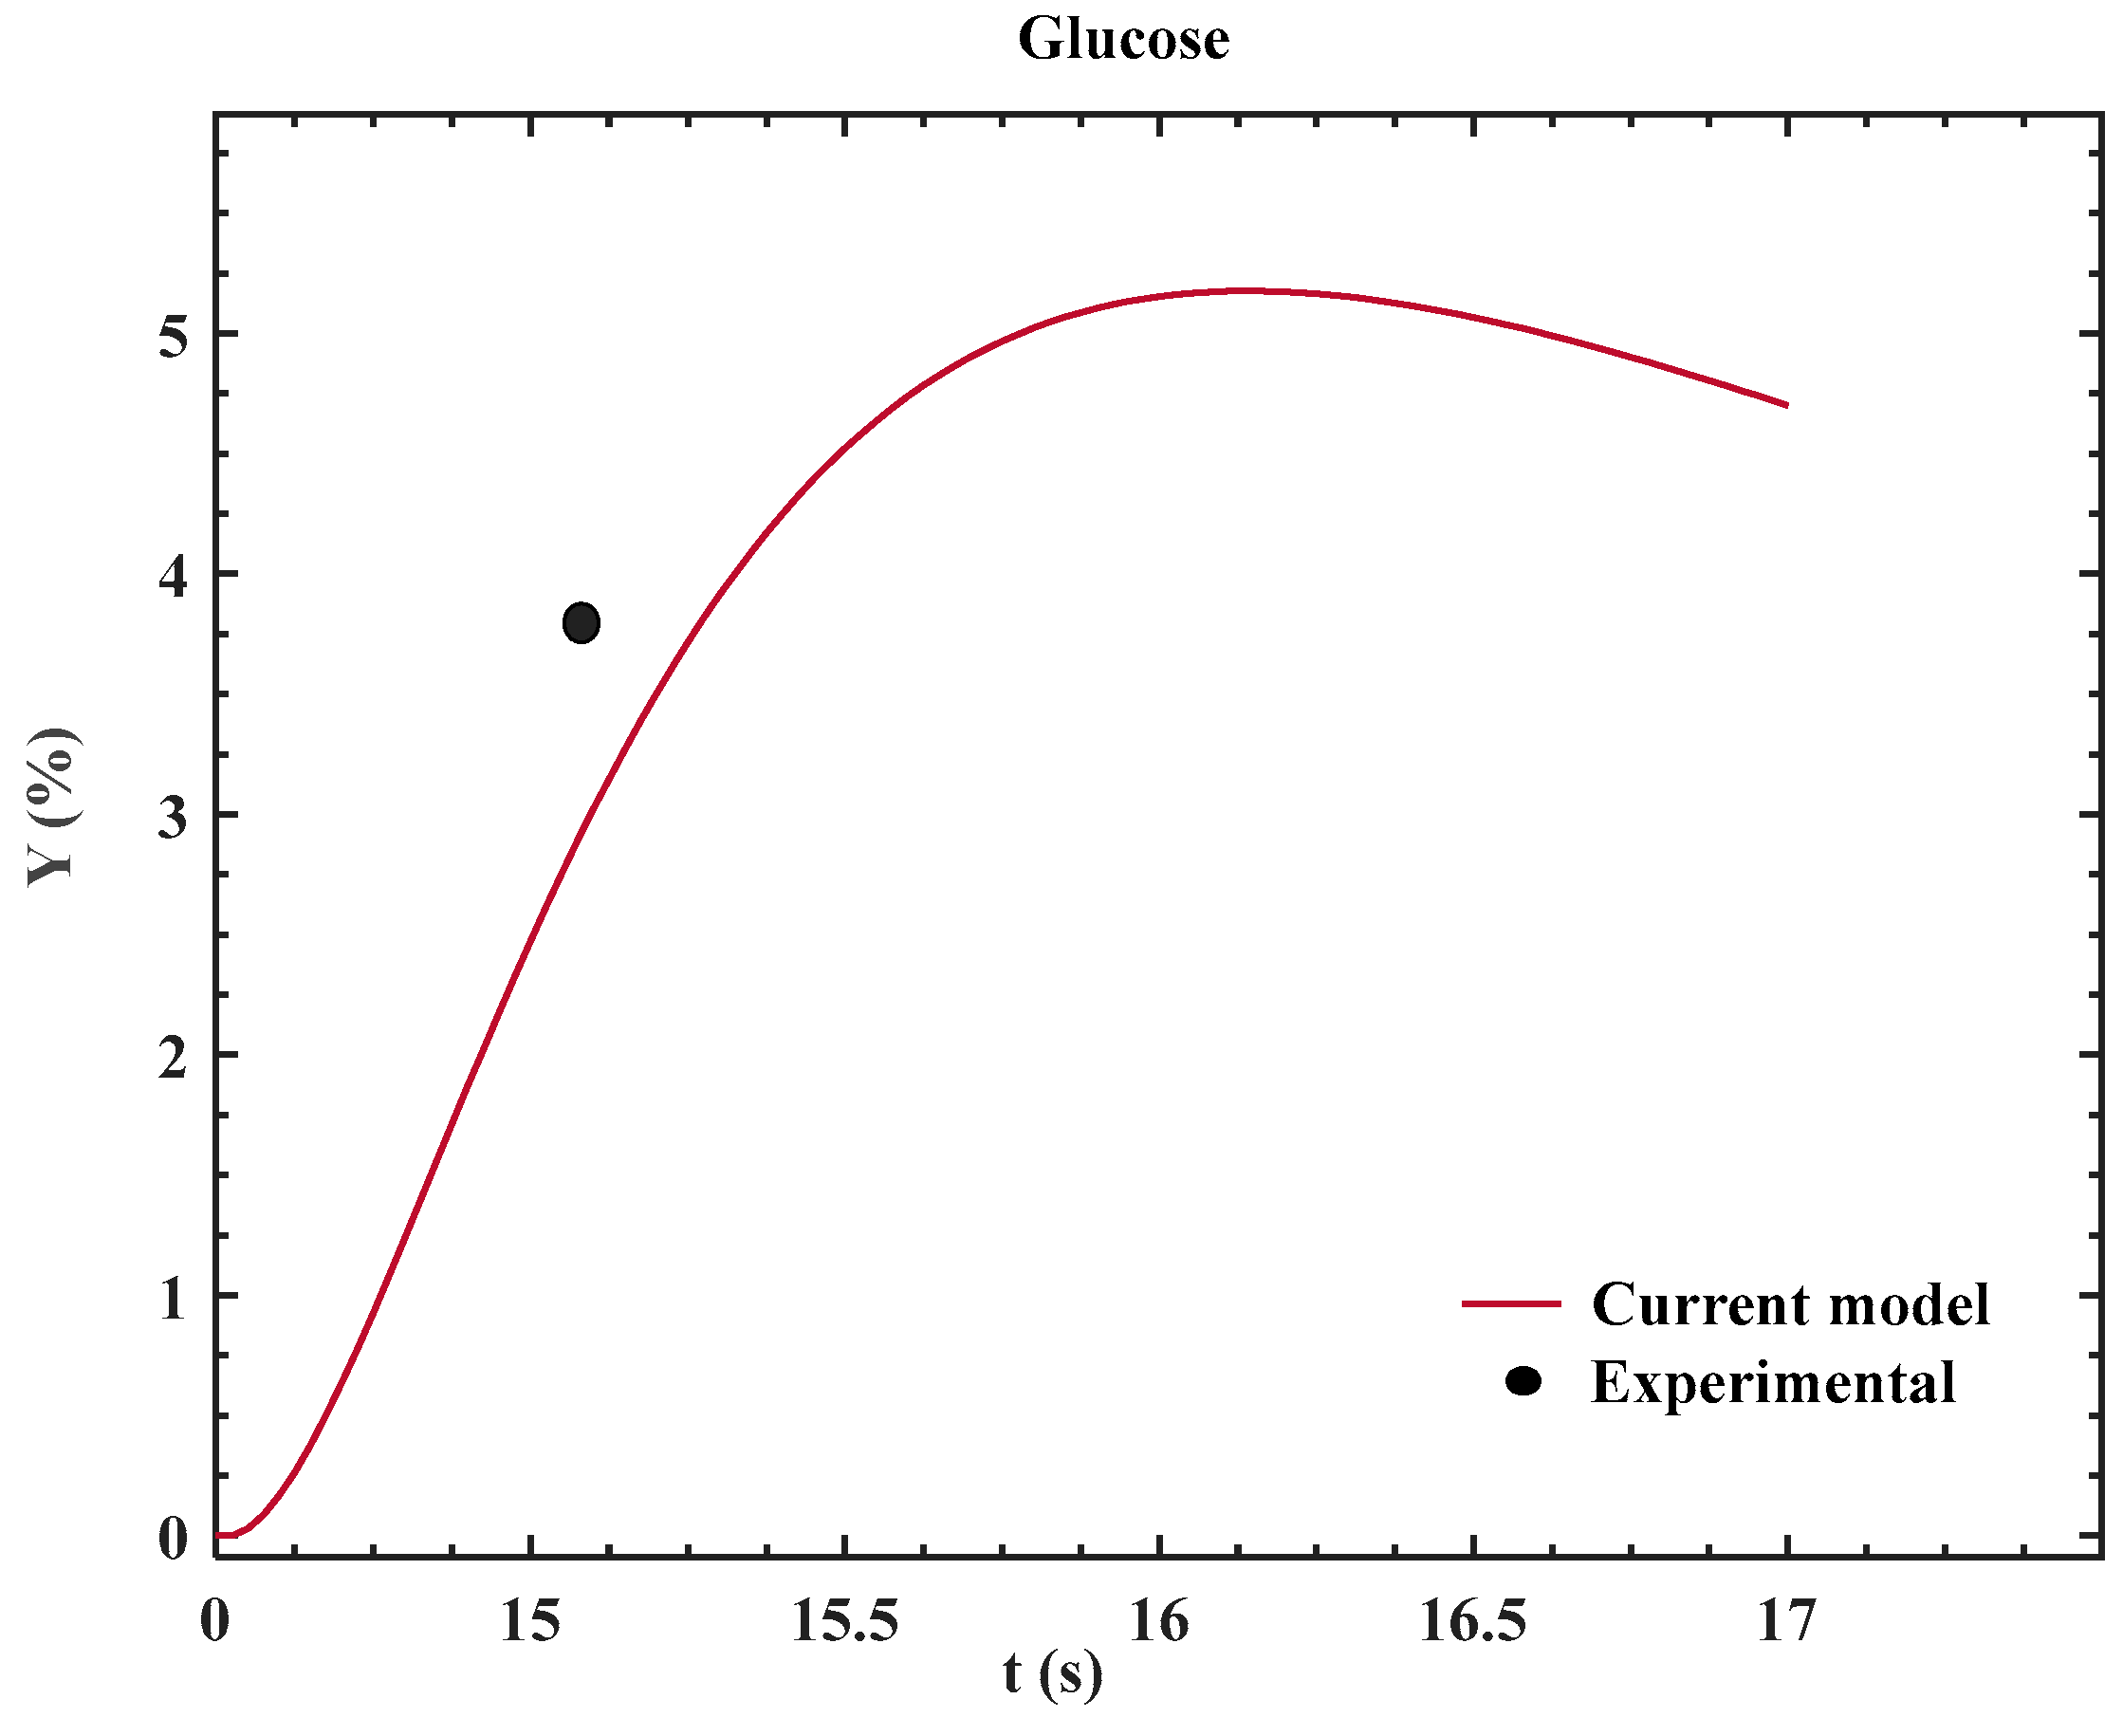
3.2. Glucose Hydrolysis with Fixed Temperature and Residence Time

As reported in the recent experimental study [23], cellulose was deionized in 2.5 mL (about 0.08 oz) in the temperature range of 378–382 °C, with a residence time of 15–18 s. Glucose was observed to hydrolyze into oligosaccharides and hexose.
Figure 3 shows that the experimental measurement of glucose yield from cellulose hydrolysis is 3.8% under conditions of 378 °C with a residence time of 15 s, close to that predicted by the present model. Furthermore, at 382 °C and a residence time of >16 s, unexpected products, e.g., dihydroxy acetone, were observed in the experiments, which is beyond the prediction of the present model.
In principle, the rate constants of hydrolysis reactions are influenced by the activation energy, which is the minimum amount of energy needed to trigger a chemical reaction. Elevating reaction temperatures can lower the activation energy and thus enhance the reaction rate constants. This phenomenon elucidates the rationale behind the observed correlation that a higher temperature coupled with a prolonged residence time can enhance the yield in the conversion of cellulose into glucose. Furthermore, a dynamic interplay becomes evident in cellulose hydrolysis, whereby the cellulose concentration exhibits an inverse tendency with the glucose concentration. This intricate relationship underscores the interdependence among the reaction rates of diverse hydrolysis reactions in supercritical water, which provides insight to substantiate the viability and potential of cellulose hydrolysis in supercritical water [31].

3.3. Glucose Isomerization into Fructose

Glucose-to-fructose conversion in hydrolysis is a reversible reaction, which is catalyzed by glucose isomerase and affected jointly by temperature, pressure, residence time, and glucose concentration. In this modeling study, the range of the operating temperature is 378–382 °C and the reaction pressure is kept constant. It is found that a small variation in pressure does not noticeably influence the kinetic rate constant of the reaction to generate fructose. However, it does affect the yield of fructose. At a residence time of less than 15 s, the fructose yield increases till its peak concentration and then decreases to a plateau at a residence time of 15 s. Figure 4 shows the comparative results from the present model and experimental measurement [5,18]. The latter can qualitatively validate the present model.
During the initial phase, within the residence time window of 15 to 15.5 s at 378 °C, a pronounced surge in fructose yield is detected. However, at 380 °C, the fructose yield does not reach the peak value at the residence time of >15 s. Both the experimental measurements and the present model predictions give a similar glucose yield of 3.7% at a residence time of 15 s and temperature of 378 °C as shown in Figure 4 [23]. In reality, a complex dependency of the reaction rate exists upon the reaction temperature and residence time in some cases. If the reaction is extremely exothermic, the temperature will be raised too much. The optimal work temperature and residence time in cellulose hydrolysis depend on the specific nature of the reaction.
The modeling results also indicate a lower fructose yield compared to that of glucose and cellobiose, a fact in agreement with the experimental observations [18]. The current model also elucidates that, when operated at a temperature higher than the critical point, glucose isomerization to yield fructose exists with the degree of isomerization appropriate for the extended residence time [32]. Yet, the yield level of fructose is lower than that of glucose and cellobiose as also indicated in experimental measurements [18].

3.4. 5-HMF Hydrolysis into Derivatives

5-HMF is generated in the process of the dehydration of fructose and its subsequent transformation into derivatives at 378 °C in an acidic environment. 5-HMF is treated as a derivative of furan, characterized by the linkage of the furan ring to a hydroxymethyl group. In cellulose hydrolysis, the generation of various secondary products (e.g., levulinic acid, formic acid, and humic acid) is expected. It is noteworthy that the formation of these byproducts may influence the yield of 5-HMF. In practice, yielding 5-HMF, but not glyceraldehyde, is observed at 380 °C with a residence time of 15 s, as concluded in the literature [23].
The derivative yield at the residence time of 15 s is acceptable. Both modeling and experiments can generate reasonable results at the beginning of the 378 °C temperature, and experimental 5-HMF yields of 0.9% and 1.3% are plotted in Figure 5. In addition, the rate constant of the 5-HMF generation reaction was also studied to show its increase with increasing temperature in a specific temperature range [33].

3.5. Erythrose and Further Derivatives

Experimental investigations have indicated that the erythrose yield in cellulose hydrolysis increases with increasing concentrations of either glucose or fructose [5,29]. Erythrose is derived through the metabolic pathway from a five-carbon analog of glucose after isomerization. In addition, fructose can undergo isomerization to yield ribose, facilitating the erythrose metabolism. However, with extremely high concentrations, a reverse reaction could occur [5].
In addition, at either 380 or 382 °C, it is unable to achieve an acceptable erythrose yield at a residence time of 15 s. The optimal process parameters for an ideal yield of erythrose are temperature of 380 °C and a residence time of 18 s, based on the experimental measurements [23]. Besides, both modeling and experiments give a similar erythrose yield, i.e., 2.8% with a residence time of 15 s at 378 °C, as shown in Figure 6.

3.6. Glycolaldehyde Conversion

Glycolaldehyde results from the degradation of glucose and fructose in cellulose hydrolysis in supercritical water, which reaches the peak value in generation of formaldehyde and glycolic acid. In the process of glucose breakdown, it cleaves into two pyruvate molecules, one of which is glycolaldehyde. At high temperatures, glycolaldehyde undergoes thermal degradation, giving rise to acetaldehyde and formic acid. Again, the reaction temperature and residence time are the two dominate factors that govern the glycolaldehyde yield during cellulose hydrolysis in supercritical water [34].
Temperature and residence time influence the reaction kinetics. Experimental observations did not confirm the generation of glycolaldehyde [18]. However, the present model does predict the yield of glycolaldehyde at the concentration of 2.1%, under the condition of 378 °C with a residence time of 15 s, as shown in Figure 7. Furthermore, close yields can be achieved under comparable circumstances of similar temperatures and with extended residence times of >15 s, specifically at 17 s. Remarkably, given the reaction temperature, the extension of the residence time results in a yield of 2.1 to 4.3%, as shown in Figure 7.

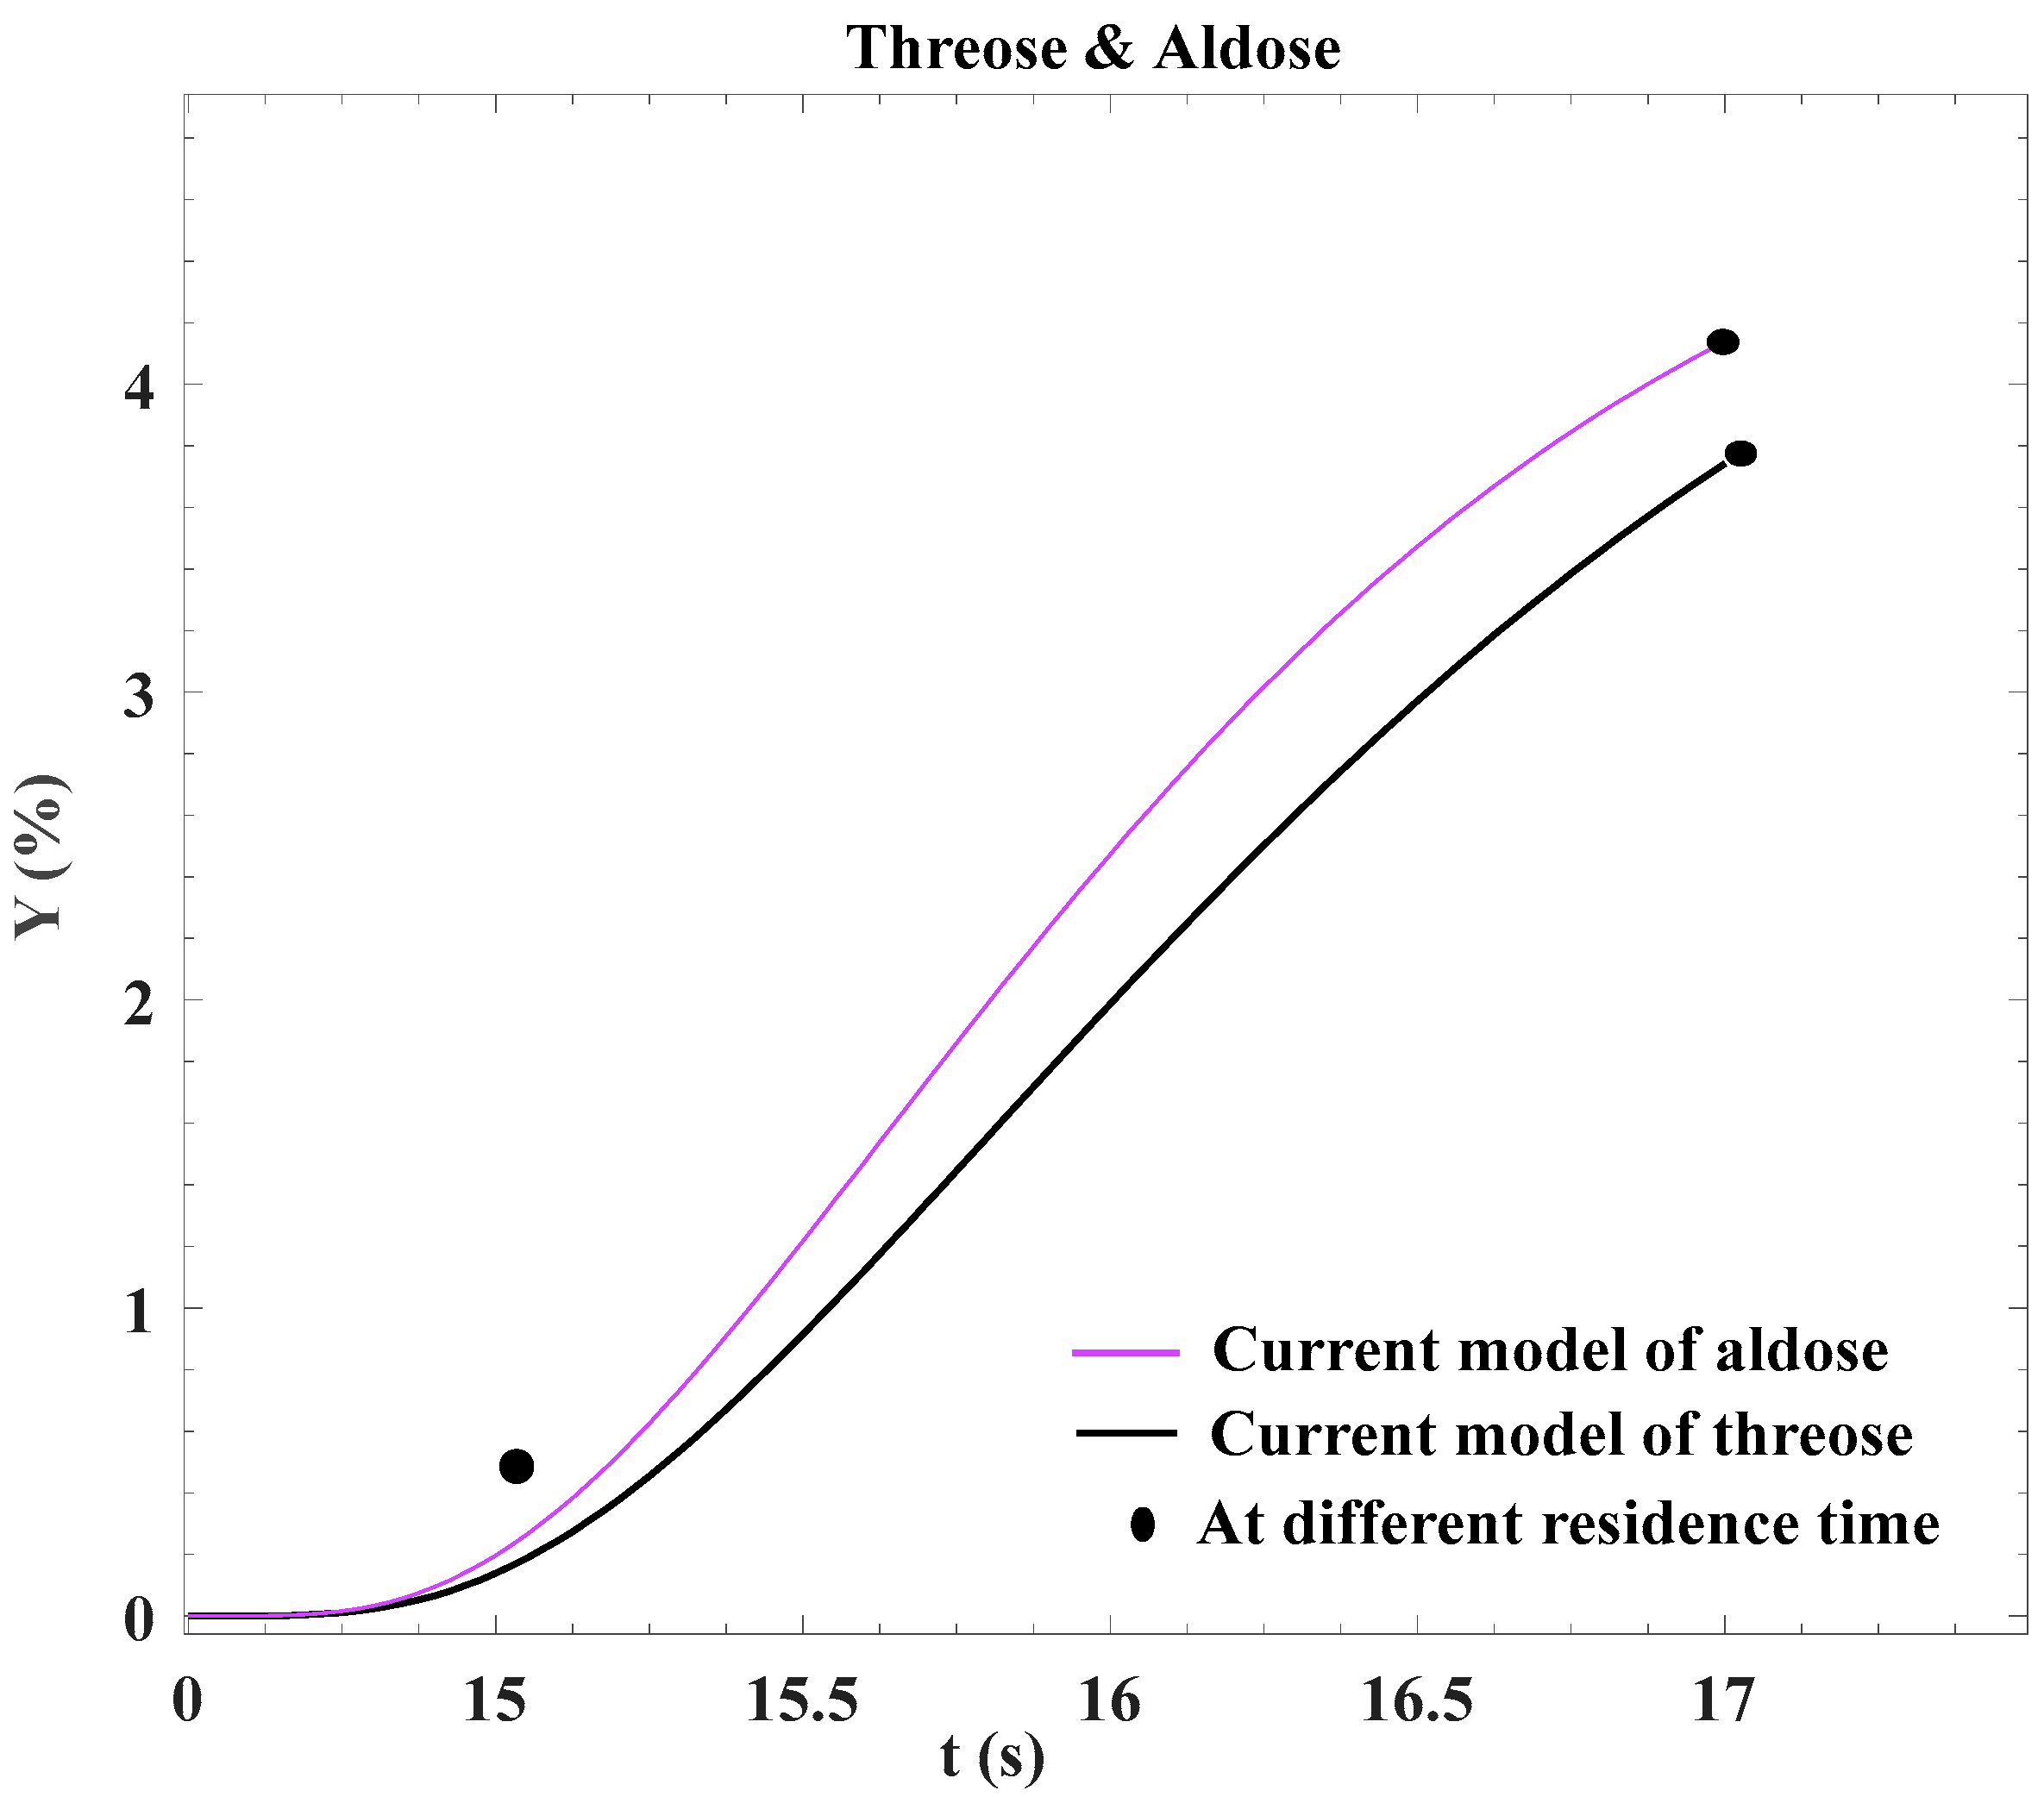
3.7. Prediction of Threose and Aldose Yield

Threose and aldose belong to a class of monosaccharides with an aldehyde functional group. Their source is not directly from erythrose but rather goes back to glucose and fructose. Threose naturally appear within amino acids and nucleotides. In contrast, aldose carries the representative groups in its close entities, e.g., glucose, galactose, and fructose. It is worth noting that recent experimental studies have not yet validated the occurrence of threose or aldose in cellulose hydrolysis [23]. However, the present model predicts a reasonable yield of threose and aldose via the rational choice of the kinetic rate constants, as shown in Figure 8.
The present model predicts reasonable yields of threose and aldose at 0.4%, which is achieved under the conditions of an operating temperature of 378 °C and a residence time of 15 s, as determined for all derivatives. In addition, yields of 4.1% and 3.6% for aldose and threose, respectively, are also predicted at 380 °C and a residence time of 17 s. The modeling results imply that more favorable yields could be achieved by increasing the reaction temperature.
For the convenience of comparison, Table 4 lists the yield rates of several cellulose derivatives extracted from Figure 2, Figure 3, Figure 4, Figure 5 and Figure 6 and their corresponding experimental measurements [23], and Table 5 lists the yield rates of several model-predicted cellulose derivatives with no experimental measurements available yet.
In summary, Figure 2, Figure 3, Figure 4, Figure 5, Figure 6, Figure 7 and Figure 8 and Table 4 and Table 5 show the comparative results of the derivative yields in cellulose hydrolysis in supercritical water based on the present kinetic model predictions, and those of experimental studies as reported in the literature. The kinetic process of cellulose hydrolysis is modeled by establishing and solving a set of ODEs for predicting the yields of cellulosic derivatives including cellulose, glucose, fructose, 5-HMF, and erythrose, which have been reasonably validated by the experimental results in the literature. Moreover, the present model predictions of the yields for several potential new value-added cellulosic derivatives (e.g., glycolaldehyde, threose, and aldose) could be achievable, though no experimental results are available yet to verify these modeling discoveries. Without a doubt, the establishment of rational models based on experimental observations to understand the kinetic process of cellulose hydrolysis is crucial to process control and optimization for the optimal production of value-added cellulose derivatives for use as biofuels and biochemicals.

4. Concluding Remarks

In this study, a system of kinetic ODEs has been established to rationally model the cellulose hydrolysis of cornstalks in supercritical water. The model predictions of the yield rates of several cellulose derivatives have been quantitively validated by the experimental results available in the literature. During the process, the kinetic rate constants of the reactions to generate cellulosic derivatives, e.g., kcell, kcello, kog, kg, kf, kgly, khmf, ke, ka, and kt, are determined by fitting the experimental data and are used for determining the yield rates of various cellulose derivatives in hydrolysis. In addition, the modeling outcomes reveal that at an operating temperature of 378 °C, the optimal yield rates of cellulose, glucose, fructose, and erythrose can be achieved at the residence times of 17 and 18 s. In contrast, at the residence time of 15 s, the yield rates of 5-HMF, glycolaldehyde, threose, and aldose are lower. However, by raising the temperature to ~380 °C, while maintaining a similar residence time, higher yield rates can be achieved. This observation underscores the complex interplay among residence time, temperature, and the yield rates of various cellulosic derivatives.
In the present modeling, the reaction pressure and temperature are kept constant throughout the entire cellulose hydrolysis process. However, the residence time, as one of key process parameters, exerts a significant impact on the derivative yields. Notably, this study concludes that, at process temperatures higher than a certain threshold of ~382 °C, high derivative rates cannot be achieved, as validated by the present modeling results and those experimental results available in the literature. Though pressure is another vital process parameter, the present study is only focused on the effects of a residence time of 15 s and a reaction temperature of 378 °C. The reaction pressure is fixed at a constant value of 89 MPa throughout the hydrolysis process in the modeling. The present modeling methodology can be further extended to predict the yield rates of derivatives of hemicellulose and lignin in hydrolysis under varying process conditions.
Finally, significant experimental studies of cellulose hydrolysis have been conducted, and related process modeling has also been initiated in recent years to predict the pre-experimental results for optimal process control. Yet, additional research efforts are still needed to correlate the model results to the experimental measurements, including exploration of the fundamental mechanisms of cellulose hydrolysis for the generation of various derivatives as well as improving the rational estimate and experimental measurements of the kinetic constants. By enhancing the robustness of kinetic models of cellulose hydrolysis, the model prediction can provide the capability to estimate the yield rates of diverse cellulose derivatives. Such kinetic models can serve as a valuable theoretical tool to optimize the process parameters of cellulose hydrolysis in supercritical water, e.g., temperature, pressure, residence time, and catalyst utilization, among others. Such process optimization can be used to realize an intelligent hydrolysis of cellulose for controllable production of renewable and sustainable biofuels and chemicals derived from hydrolysis of cornstalks and other biomass and agricultural waste.

Author Contributions

X.-F.W. conceived and designed the modeling study; M.M.A. conducted all numerical simulations and figure plotting; M.M.A., O.Z., and X.-F.W. analyzed the process and model outcomes; M.M.A. and X.-F.W. analyzed the data, wrote, and revised the paper. All authors have read and agreed to the published version of the manuscript.

Funding

This research received no external funding.

Data Availability Statement

All the research data generated in this study are included in this article based on the computational simulations of the kinetic model. Additional data used in the models were obtained from the cited journal articles in this article.

Conflicts of Interest

The authors declare no conflict of interest.

References

  1. Popp, J.; Kovács, S.; Oláh, J.; Divéki, Z.; Balázs, E. Bioeconomy: Biomass and biomass-based energy supply and demand. N. Biotechnol. 2021, 60, 76–84. [Google Scholar] [CrossRef] [PubMed]
  2. Zhou, C.; Wang, Y. Recent progress in the conversion of biomass wastes into functional materials for value-added applications. Sci. Technol. Adv. Mater. 2020, 21, 787–804. [Google Scholar] [CrossRef] [PubMed]
  3. Waliszewska, B.; Mleczek, M.; Zborowska, M.; Goliński, P.; Rutkowski, P.; Szentner, K. Changes in the chemical composition and the structure of cellulose and lignin in elm wood exposed to various forms of arsenic. Cellulose 2019, 26, 6303–6315. [Google Scholar] [CrossRef]
  4. Teong, S.P.; Yi, G.; Zhang, Y. Hydroxymethylfurfural production from bioresources: Past, present and future. Green Chem. 2014, 16, 2015–2026. [Google Scholar] [CrossRef]
  5. Cantero, D.A.; Tapia, Á.S.; Bermejo, M.D.; Cocero, M.J. Pressure and temperature effect on cellulose hydrolysis in pressurized water. Chem. Eng. J. 2015, 276, 145–154. [Google Scholar] [CrossRef]
  6. Bobleter, O. Hydrothermal degradation of polymers derived from plants. Prog. Polym. Sci. 1994, 19, 797–841. [Google Scholar] [CrossRef]
  7. Ehara, K.; Saka, S. A comparative study on chemical conversion of cellulose between the batch-type and flow-type systems in supercritical water. Cellulose 2002, 9, 301–311. [Google Scholar] [CrossRef]
  8. Assary, R.S.; Curtiss, L.A. Comparison of sugar molecule decomposition through glucose and fructose: A high-level quantum chemical study. Energy Fuels 2012, 26, 1344–1352. [Google Scholar] [CrossRef]
  9. Zhang, Y.; Hidajat, K.; Ray, A.K. Optimal design and operation of SMB bioreactor: Production of high fructose syrup by isomerization of glucose. Biochem. Eng. J. 2004, 21, 111–121. [Google Scholar] [CrossRef]
  10. Zakrzewska, M.E.; Bogel-Yukasik, E.; Bogel-Yukasik, R. Solubility of carbohydrates in ionic liquids. Energy Fuels 2010, 24, 737–745. [Google Scholar] [CrossRef]
  11. Zhao, H.; Holladay, J.E.; Brown, H.; Zhang, Z.C. Metal chlorides in ionic liquid solvents convert sugars to 5-hydroxymethylfurfural. Science 2007, 316, 1597–1600. [Google Scholar] [CrossRef] [PubMed]
  12. Bicker, M.; Hirth, J.; Vogel, H. Dehydration of fructose to 5-hydroxymethylfurfural in sub-and supercritical acetone. Green Chem. 2003, 5, 280–284. [Google Scholar] [CrossRef]
  13. Tarabanko, N.; Baryshnikov, S.V.; Kazachenko, A.S.; Miroshnikova, A.; Skripnikov, A.M.; Lavrenov, A.V.; Taran, O.; Kuznetsov, B.N. Hydrothermal hydrolysis of microcrystalline cellulose from birch wood catalyzed by Al2O3-B2O3 mixed oxides. Wood Sci. Technol. 2022, 56, 437–457. [Google Scholar] [CrossRef]
  14. Nasution, H.; Yahya, E.B.; Abdul Khalil, H.P.S.; Shaah, M.A.; Suriani, A.B.; Mohamed, A.; Alfatah, T.; Abdullah, C.K. Extraction and Isolation of Cellulose Nanofibers from Carpet Wastes Using Supercritical Carbon Dioxide Approach. Polymers 2022, 14, 326. [Google Scholar] [CrossRef] [PubMed]
  15. Escobar, E.L.N.; da Silva, T.A.; Pirich, C.L.; Corazza, M.L.; Pereira Ramos, L. Supercritical Fluids: A Promising Technique for Biomass Pretreatment and Fractionation. Front. Bioeng. Biotechnol. 2020, 8, 252. [Google Scholar] [CrossRef]
  16. Acharya, S.; Hu, Y.; Abidi, N. Cellulose dissolution in ionic liquid under mild conditions: Effect of hydrolysis and temperature. Fibers 2021, 9, 5. [Google Scholar] [CrossRef]
  17. Ahmad Kamaroddin, M.F.; Sabli, N.; Tuan Abdullah, T.A.; Siajam, S.I.; Abdullah, L.C.; Abdul Jalil, A.; Ahmad, A. Membrane-based electrolysis for hydrogen production: A review. Membranes 2021, 11, 810. [Google Scholar] [CrossRef]
  18. Lewis, N.S.; Nocera, D.G. Powering the planet: Chemical challenges in solar energy utilization. Proc. Natl. Acad. Sci. USA 2006, 103, 15729–15735. [Google Scholar] [CrossRef]
  19. Efrinalia, W.; Novia, N.; Melwita, E. Kinetic Model for Enzymatic Hydrolysis of Cellulose from Pre-Treated Rice Husks. Fermentation 2022, 8, 417. [Google Scholar] [CrossRef]
  20. Sasaki, M.; Goto, K.; Tajima, K.; Adschiri, T.; Arai, K. Rapid and selective retro-aldol condensation of glucose to glycolaldehyde in supercritical water. Green Chem. 2002, 4, 285–287. [Google Scholar] [CrossRef]
  21. Asghari, F.S.; Yoshida, H. Acid-catalyzed production of 5-hydroxymethyl furfural from D-fructose in subcritical water. Ind. Eng. Chem. Res. 2006, 45, 2163–2173. [Google Scholar] [CrossRef]
  22. Tyufekchiev, M.; Finzel, J.; Zhang, Z.; Yao, W.; Sontgerath, S.; Skangos, C.; Duan, P.; Schmidt-Rohr, K.; Timko, M.T. A New Method for Solid Acid Catalyst Evaluation for Cellulose Hydrolysis. Sustain. Chem. 2021, 2, 645–669. [Google Scholar] [CrossRef]
  23. Zhao, Y.; Lu, W.J.; Wang, H.T. Supercritical hydrolysis of cellulose for oligosaccharide production in combined technology. Chem. Eng. J. 2009, 150, 411–417. [Google Scholar] [CrossRef]
  24. Li, M.; Cao, S.; Meng, X.; Studer, M.; Wyman, C.E.; Ragauskas, A.J.; Pu, Y. The effect of liquid hot water pretreatment on the chemical-structural alteration and the reduced recalcitrance in poplar. Biotechnol. Biofuels 2017, 10, 237. [Google Scholar] [CrossRef]
  25. Cantero, D.A.; Bermejo, M.D.; Cocero, M.J. Governing Chemistry of Cellulose Hydrolysis in Supercritical Water. ChemSusChem 2015, 8, 1026–1033. [Google Scholar] [CrossRef]
  26. Zhang, J.; Huo, H.; Zhang, L.; Yang, Y.; Li, H.; Ren, Y.; Zhang, Z. Effect of High-Temperature Hydrothermal Treatment on the Cellulose Derived from the Buxus Plant. Polymers 2022, 14, 2053. [Google Scholar] [CrossRef]
  27. Martínez, C.M.; Cantero, D.A.; Bermejo, M.D.; Cocero, M.J. Hydrolysis of cellulose in supercritical water: Reagent concentration as a selectivity factor. Cellulose 2015, 22, 2231–2243. [Google Scholar] [CrossRef]
  28. Cantero, D.A.; Bermejo, M.D.; Cocero, M.J. Kinetic analysis of cellulose depolymerization reactions in near critical water. J. Supercrit. Fluids 2013, 75, 48–57. [Google Scholar] [CrossRef]
  29. Kawamura, K.; Sako, K.; Ogata, T.; Mine, T.; Tanabe, K. Production of 5′-hydroxymethylfurfural by the hydrothermal treatment of cotton fabric wastes using a pilot-plant scale flow reactor. Bioresour. Technol. Rep. 2020, 11, 100476. [Google Scholar] [CrossRef]
  30. Díez, D.; Urueña, A.; Piñero, R.; Barrio, A.; Tamminen, T. Determination of Hemicellulose, Cellulose, and Lignin Content in Different Types of Biomasses by Thermogravimetric Analysis and Pseudocomponent Kinetic Model. Processes 2020, 8, 1048. [Google Scholar] [CrossRef]
  31. Takahashi, T.; Karita, S.; Ogawa, N.; Goto, M. Crystalline cellulose reduces plasma glucose concentrations and stimulates water absorption by increasing the digesta viscosity in rats. J. Nutr. 2005, 135, 2405–2410. [Google Scholar] [CrossRef] [PubMed]
  32. Kassaye, S.; Gupta, D.; Pant, K.K.; Jain, S. Valorization of Microcrystalline Cellulose Using Heterogeneous Protonated Zeolite Catalyst: An Experimental and Kinetics Approach. Reactions 2022, 3, 283–299. [Google Scholar] [CrossRef]
  33. Ehara, K.; Saka, S. Decomposition behavior of cellulose in supercritical water, subcritical water, and their combined treatments. J. Wood Sci. 2005, 51, 148–153. [Google Scholar] [CrossRef]
  34. Sabli, N.; Toat, S.A.; Yoshida, H.; Izhar, S. Hydrolysis of Blended Cotton/Polyester Fabric from Hospital Waste using Subcritical Water. Sains Malays. 2023, 52, 139–151. [Google Scholar] [CrossRef]
Figure 1. Possible reaction pathways in cellulose hydrolysis.
Processes 11 03030 g001
Figure 2. Variation of the cellulose concentration with the residence time at 378 °C [23].
Processes 11 03030 g002
Figure 3. Variation of the glucose with the residue time at 378 °C [23].
Processes 11 03030 g003
Figure 4. Variation in the fructose concentration with the residual time in cellulose hydrolysis at 378 °C [23].
Processes 11 03030 g004
Figure 5. Variation of the 5-HMF yield with the residence time at 378 °C [23].
Processes 11 03030 g005
Figure 6. Variation of the erythrose yield with the residence time in supercritical cellulose hydrolysis at 378 °C [23].
Processes 11 03030 g006
Figure 7. Variation of the glycolaldehyde yield with the residence time at 378 °C.
Processes 11 03030 g007
Figure 8. Variation of the predicted yields of threose and aldose with the residence time at 378 °C and 380 °C, respectively.
Processes 11 03030 g008
Table 1. Kinetic constants in cellulose hydrolysis and their symbols.
Kinetic ConstantsSymbol
cellulose k c e l l u l o s e
cellobiose k c e l l o
oligosaccharides k o g
glucose k g
glyceraldehyde k g l y d
fructose k f
glycolaldehyde k g l y
5-HMF k h m f
erythrose k e
aldose k a
threose k t
Table 2. Kinetic constants of cellulose hydrolysis measured in experiments [29].
NameKinetic ConstantsValueEa (kJ/mol)
cellulose k c e l l u l o s e 0.01145.9
cellobiose k c e l l o 0.0366.89
oligosaccharides k o g 0.0569.3
glucose k g 0.025112.69
fructose k f 0.05140.44
glycolaldehyde k g l y 0.019150
5-HMF k h m f 0.15105
glyceraldehyde k g l y d 0.0182.56
Erythrose k e 0.03106.1
Threose k t 0.001587.8
Aldose k a 0.02860.8
6-phosfogluconic acid k p h o s 0.02125
pyruvaldehyde k p y r 0.012594
Table 3. Model parameters and their values adopted in the present computational simulations.
NameSymbolValue
mass flow rate m c 0.1 kg/s
fraction of cellulose to saccharidesF0.5
moisture contentMc10 molar/h
molecular weight per unit of cellulose M W c e l l u l o s e 162.14
mass of carbon per unit of cellulose C W c e l l u l o s e 120
molecular weight of cellobiose M W c e l l o b i o s e 342.30
mass of carbon per unit of glucose C W g l u c o s e 60
molecular weight of carbon per unit of glucose M W g l u c o s e 180.15
density of water ρ 1000 kg/m3
area of cellulose grain a 0.02 m2
mass flow m ˙ 0.5 kg/s
Table 4. Comparison of the yield rates of cellulose derivatives between experimental measurements [23] and the present model predictions.
No.ProductResidence
Time (s)
Experimental Results (%)Model Predictions (%)Temperature (°C)
1Cellulose1560–8074378
2Glucose153.83.8378
3Fructose153.73.6378
45-HMF150.9, 1.30.8, 1.4378, 382
5Erythrose152.82.78378
Table 5. Model prediction of the yield rates of cellulose derivatives.
No.ProductResidence Time (s)TemperatureModel Prediction (%)
1Glycolaldehyde15, 173782.1, 4.3
2Threose15.6, 173781.2,3.6
3Aldose173804.1
Disclaimer/Publisher’s Note: The statements, opinions and data contained in all publications are solely those of the individual author(s) and contributor(s) and not of MDPI and/or the editor(s). MDPI and/or the editor(s) disclaim responsibility for any injury to people or property resulting from any ideas, methods, instructions or products referred to in the content.

