Article

Competitive Equilibrium Analysis of Power Generation Transaction Subjects Considering Tradable Green Certificates

1
School of Electrical Engineering, Xi’an University of Technology, Xi’an 710048, China
2
Northwest Subsection of State Grid Corporation of China, Xi’an 710048, China
*
Author to whom correspondence should be addressed.
Processes 2023, 11(10), 3008; https://doi.org/10.3390/pr11103008
Submission received: 22 September 2023 / Revised: 11 October 2023 / Accepted: 17 October 2023 / Published: 19 October 2023

Abstract

:
The implementation of renewable portfolio standards (RPS) and tradable green certificate schemes will exert significant influences on the market equilibrium outcomes and generation firms’ strategic behaviors. To quantitatively investigate these influences, firstly, considering the difference in power generation cost and the uncertainty of renewable energy power generation, the equilibrium model for various trade subjects in the electricity market is established. Secondly, the nondominated sorting genetic algorithm II is adopted for solving the equilibrium model to find well-distributed Pareto-optimal solutions. Finally, the grey relational projection method is used to calculate the priority membership of each decision-making scheme so as to determine the optimal compromise solution. The simulation focuses on analyzing the impact of RPS on the equilibrium results and market behavior of power generators and introduces the Lerner index to quantify the market power of generators. The results show that: (1) An increase in the quota ratio can effectively increase power generation in renewable energy generators. The game between thermal power generators and renewable energy generators raises the prices of both markets at the same time. (2) Improving the forecasting accuracy is conducive to alleviating the market power behavior of various power generators, thereby ensuring the healthy operation of the power market.

1. Introduction

To support the development of renewable energy, China was the first to implement mandatory grid access and fixed electricity prices for renewable energy [1]. In the early stage of the market, the fixed electricity price system plays a certain role in supporting renewable energy, but with the further maturity of the market, it can not solve the root problem of renewable energy consumption [2]. With the gradual decline in the cost of renewable energy in recent years, the government actively encouraged renewable energy companies to participate in the electricity market competition [3] and the adoption of renewable portfolio standard (RPS), which is more suitable for the current market environment, has become a consensus [4].
The influence of RPS on the operation of the power market has always been a research hotspot [5]. Existing studies can be divided into two categories: first, feasibility analyses based on foreign experience to design renewable energy power and green certificate trading mechanisms applicable to China. Reference [6] studied different foreign renewable energy electricity consumption mechanisms, providing reference experience for China to establish the quota system, but did not put forward a specific implementation plan of the quota system suitable for China’s national conditions. Reference [7] demonstrates the rationality and effectiveness of the quota system from the perspective of institutional construction and the evolution of power generation manufacturers’ behavior strategies. Combined with China’s specific national conditions, countermeasures and suggestions are given. Based on the oligarchic competitive equilibrium theory, reference [8] established Cournot competitive equilibrium models in the electricity market, respectively, considering feed-in tariff and tradable green certificates (TGC) policies, and studied the influence of the two different policies on the equilibrium results of the electricity market and social welfare. The simulation results show that compared with the TGC mechanism, under feed-in tariff policy, fossil fuel power generators do not directly bear environmental costs, which makes them less incentive to reduce power generation output. Therefore, feed-in tariff policy has a poor effect on energy conservation and emission reduction. Compared with the feed-in tariff mechanism, TGC policy is closer to the market competition mechanism, so social welfare is higher. Reference [9] proposed the TGC-fractional fuzzy stochastic robust optimization model, which effectively deals with the multi-objective tradeoff between economy and environment. The simulation results show that the TGC mechanism is a cost-effective way to achieve carbon emission reduction. Specifically, it can effectively promote the development of renewable energy and reduce the use of fossil fuels. In the framework of a two-level market, reference [10] establishes a nonlinear two-level optimal absorption model with the goal of minimizing market operation costs. The simulation results show that the implementation of RPS can effectively stimulate the enthusiasm of market subjects to consume new energy and reduce the phenomenon of abandoning wind and solar power, but it will also bring corresponding market costs. In reference [11], a grid-connected energy-saving economic dispatching model of wind power under the quota system is constructed, and the thermal power and wind power output plans before and after the implementation of the quota system are compared and analyzed so as to study the influence of the implementation of the quota system on wind power consumption. Simulation results show that RPS is beneficial in increasing wind power consumption. Based on RPS policy, reference [12] constructed the system dynamics model of a multi-market coupled trading system in the renewable power market, over-quota consumption market, and tradable green certificate market. Based on six scenarios, the effects of policy parameters such as RPS quota planning target, unit penalty, and TGC price caps were investigated. The results show that RPS not only affects the price and trading volume of multi-markets but also promotes renewable energy generation in China. Reference [13] established a market equilibrium model for TGC and analyzed the strategic behavior of renewable energy companies. The results suggest that renewable energy companies will exercise market power to drive up energy prices, reduce renewable energy integration, and raise consumer costs when renewables penetration is high. However, upon introducing the TGC market, the strategic behavior of renewable energy generators in the energy market will be largely mitigated because they can earn TGC incentives by selling more electricity.
The second is to establish an equilibrium or optimization model to discuss the transfer relationship between power price and certificate price and study the decision-making behavior of each market subject [14]. The falling costs of renewable energy generators have led to a growing number of countries allowing and encouraging renewable energy generators to compete directly in wholesale markets. The participation of renewable energy generators in market competition will not only affect the competitive behaviors of original participants in the market but also may have strategic behaviors in order to ensure profits. Based on equilibrium theory, the following reference studies the impact of renewable energy generators’ participation in market competition on the electricity market. Based on the oligarchic competitive equilibrium theory, reference [15] uses the Cournot equilibrium model to simulate the competitive behavior of power generators in the unilateral open power market and studies the strategic quotation of power generators. The literature shows that in the oligopoly competition market environments, the power generation will choose to deliberately bid high prices to exercise the market power and then raise the market price, increasing income. However, this model does not consider the impact of new energy generators on market competition behavior. Reference [16] establishes an electricity market equilibrium model based on a stackdberg competition, which allows wind power generators to directly participate in day-ahead market competition and studies the strategic behavior changes in wind power generators in different market states. However, this model does not involve the strategic competitive behavior of traditional energy generators. In order to promote renewable energy consumption, reference [17] established an evolutionary game model between power grid enterprises and renewable energy enterprises under the RPS, studied the decision-making behavior and interaction between the two in the green certificate market and electricity market, and analyzed the influence of combination standard parameter adjustment on the evolution direction. However, this model does not consider the volatility and intermittency of renewable energy generation. Reference [18] established a Nash–Cournot market clearing model considering the high penetration of prosumers. The influence of the uncertainty of renewable energy output, the penetration level of wind power, and the demand level on the market equilibrium are studied, but this model does not consider the effect of the implementation of the quota system on the decision-making behavior of power generators. Reference [19] introduced the TGC system into the daily scheduling plan model of a wind power generation system and, combined with an RPS system, established an economic scheduling model with the maximum net income of both parties as the objective function. The simulation results comprehensively analyze the influence of large-scale wind power grid entry on TGC-based power system economy but ignore the influence of different proportions of renewable energy quota. Reference [20] proposed the competitive edge model of leading enterprises for the market power in the implementation of RPS and analyzed the influence of the market power of different leading enterprises on TGC price and feed-in price. Under different quota ratio requirements, empirical research is conducted to obtain the impact of the market power of different leading enterprises on TGC price and feed-in tariff, indicating that too low TGC price will lead to insufficient investment in long-term renewable energy development, while too high a TGC price will distort the incentive signal of investment and lead to inefficient allocation of long-term power generation resources. In addition, this model is limited to theoretical analysis, and no empirical analysis is conducted.
Based on the above analysis, the existing literature does not consider the uncertainty of renewable energy power generation, the impact of the difference in the cost of thermal power generation and renewable energy power generation on the market equilibrium result, and the decision-making behavior and interaction between various power generation entities under the renewable energy quota system. In order to fill the gaps in the existing literature, this study proposes a multi-transaction entity equilibrium model of the electricity market under the renewable energy quota system. The main contributions of this study are summarized as follows:
(1)
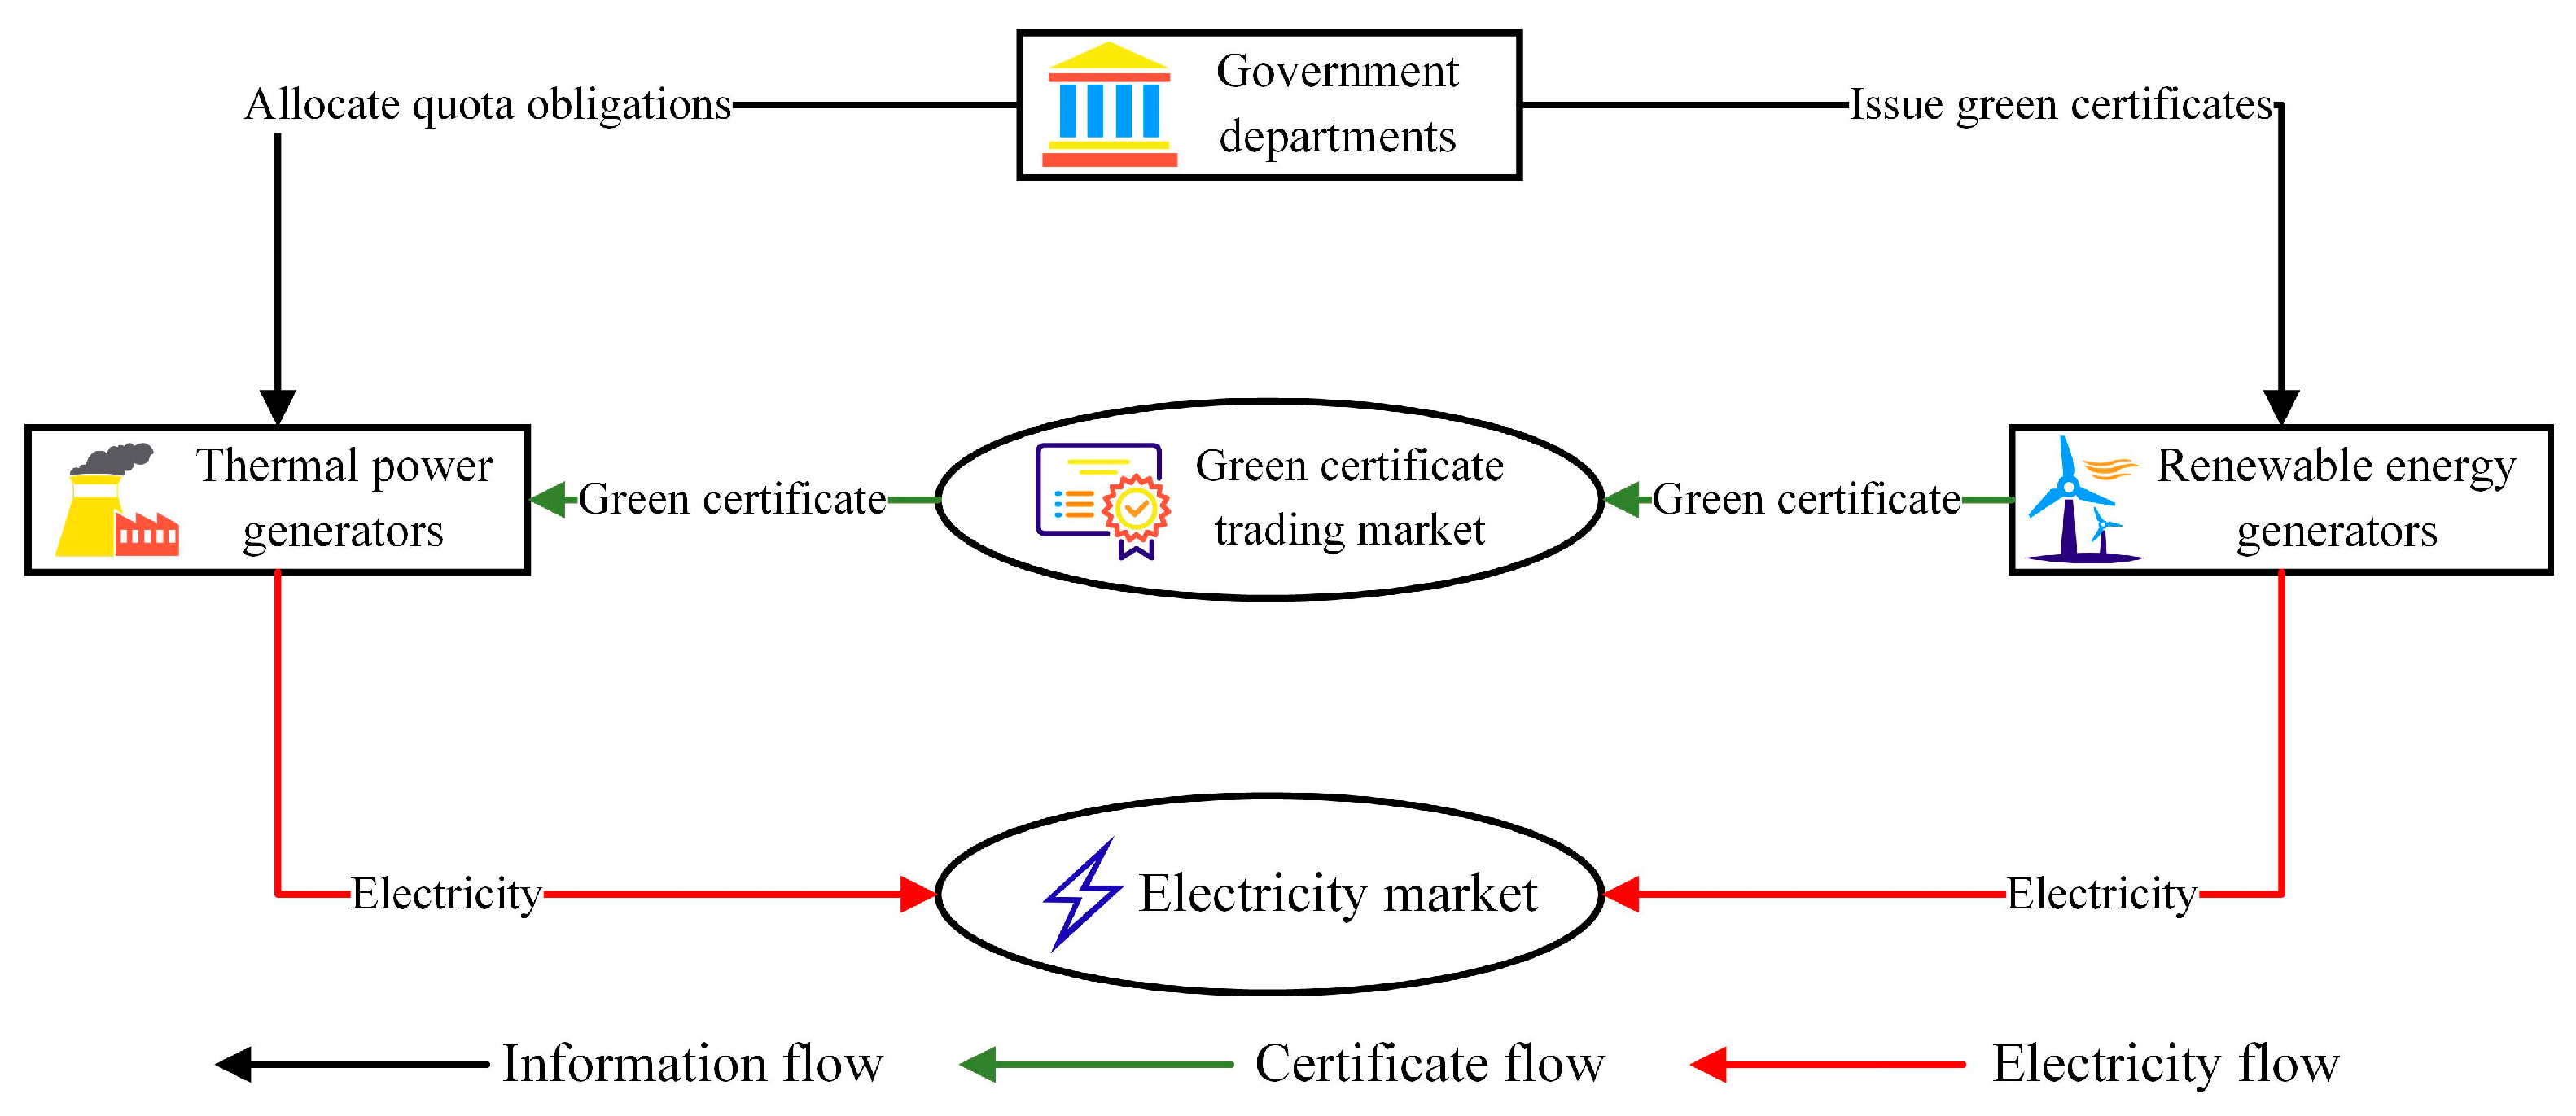
By studying the cost difference between thermal power generation and renewable energy power generation, the power generation cost of the two power generation modes is analyzed in detail. In order to maximize the revenue of the thermal power producers alliance and renewable energy power producers alliance, a market equilibrium model including the green certificate trading market and electricity market is constructed.
(2)
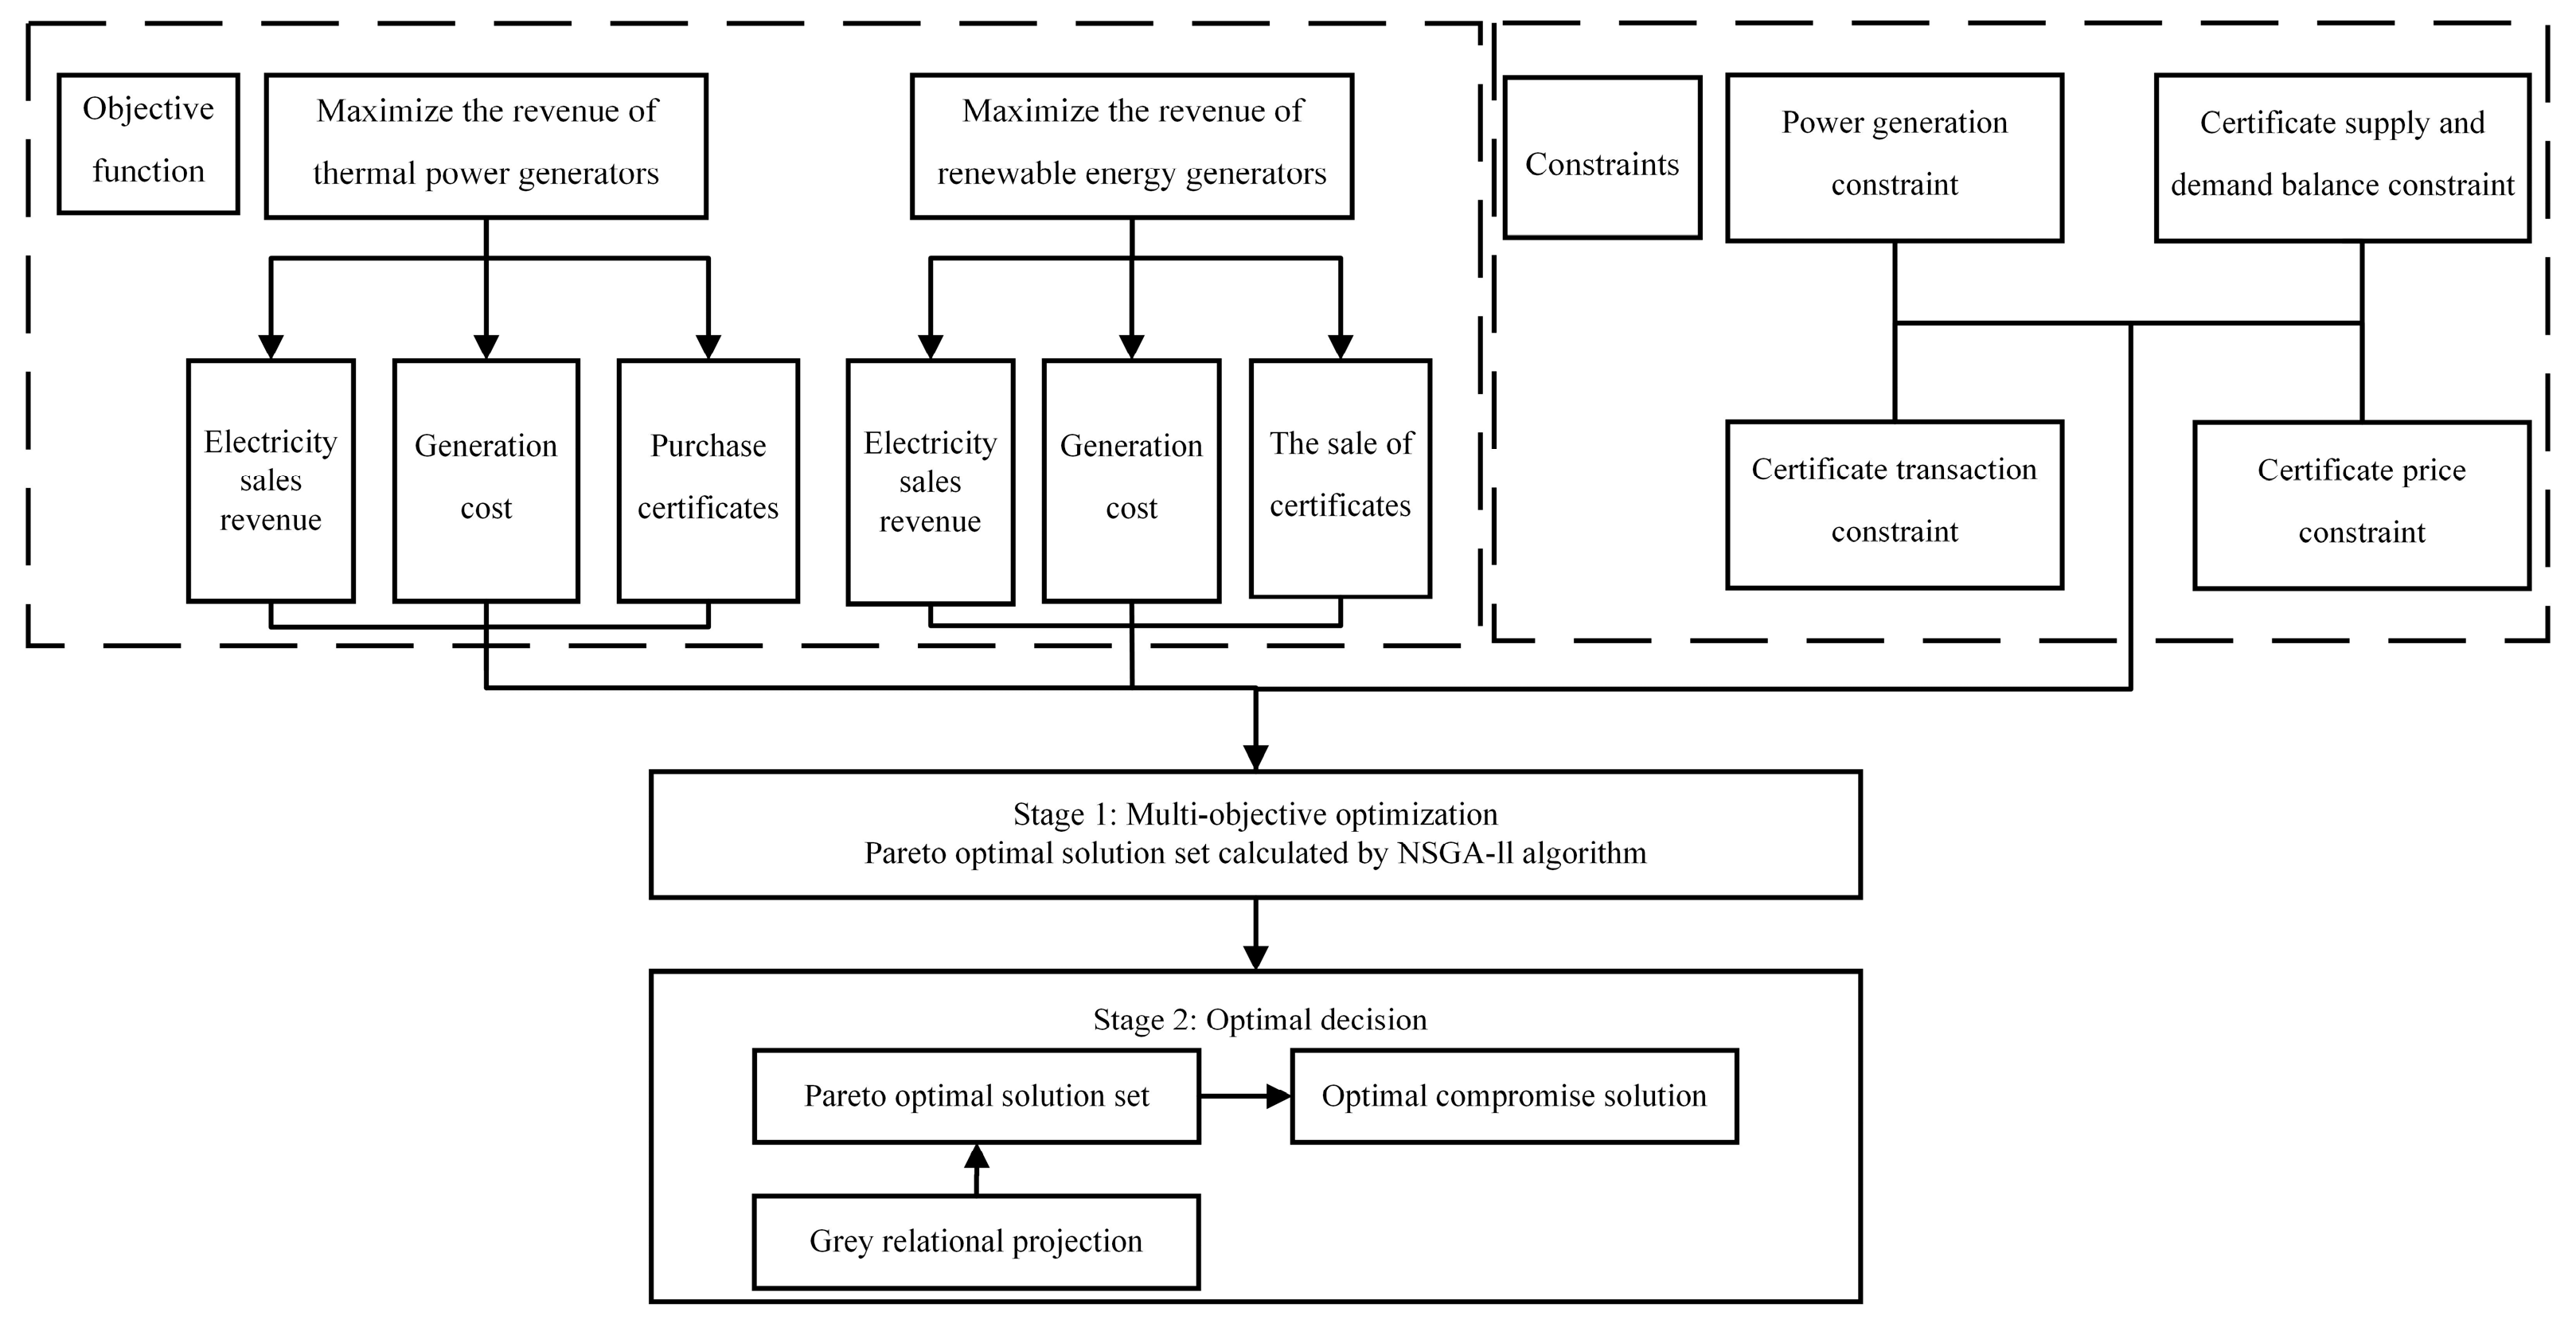
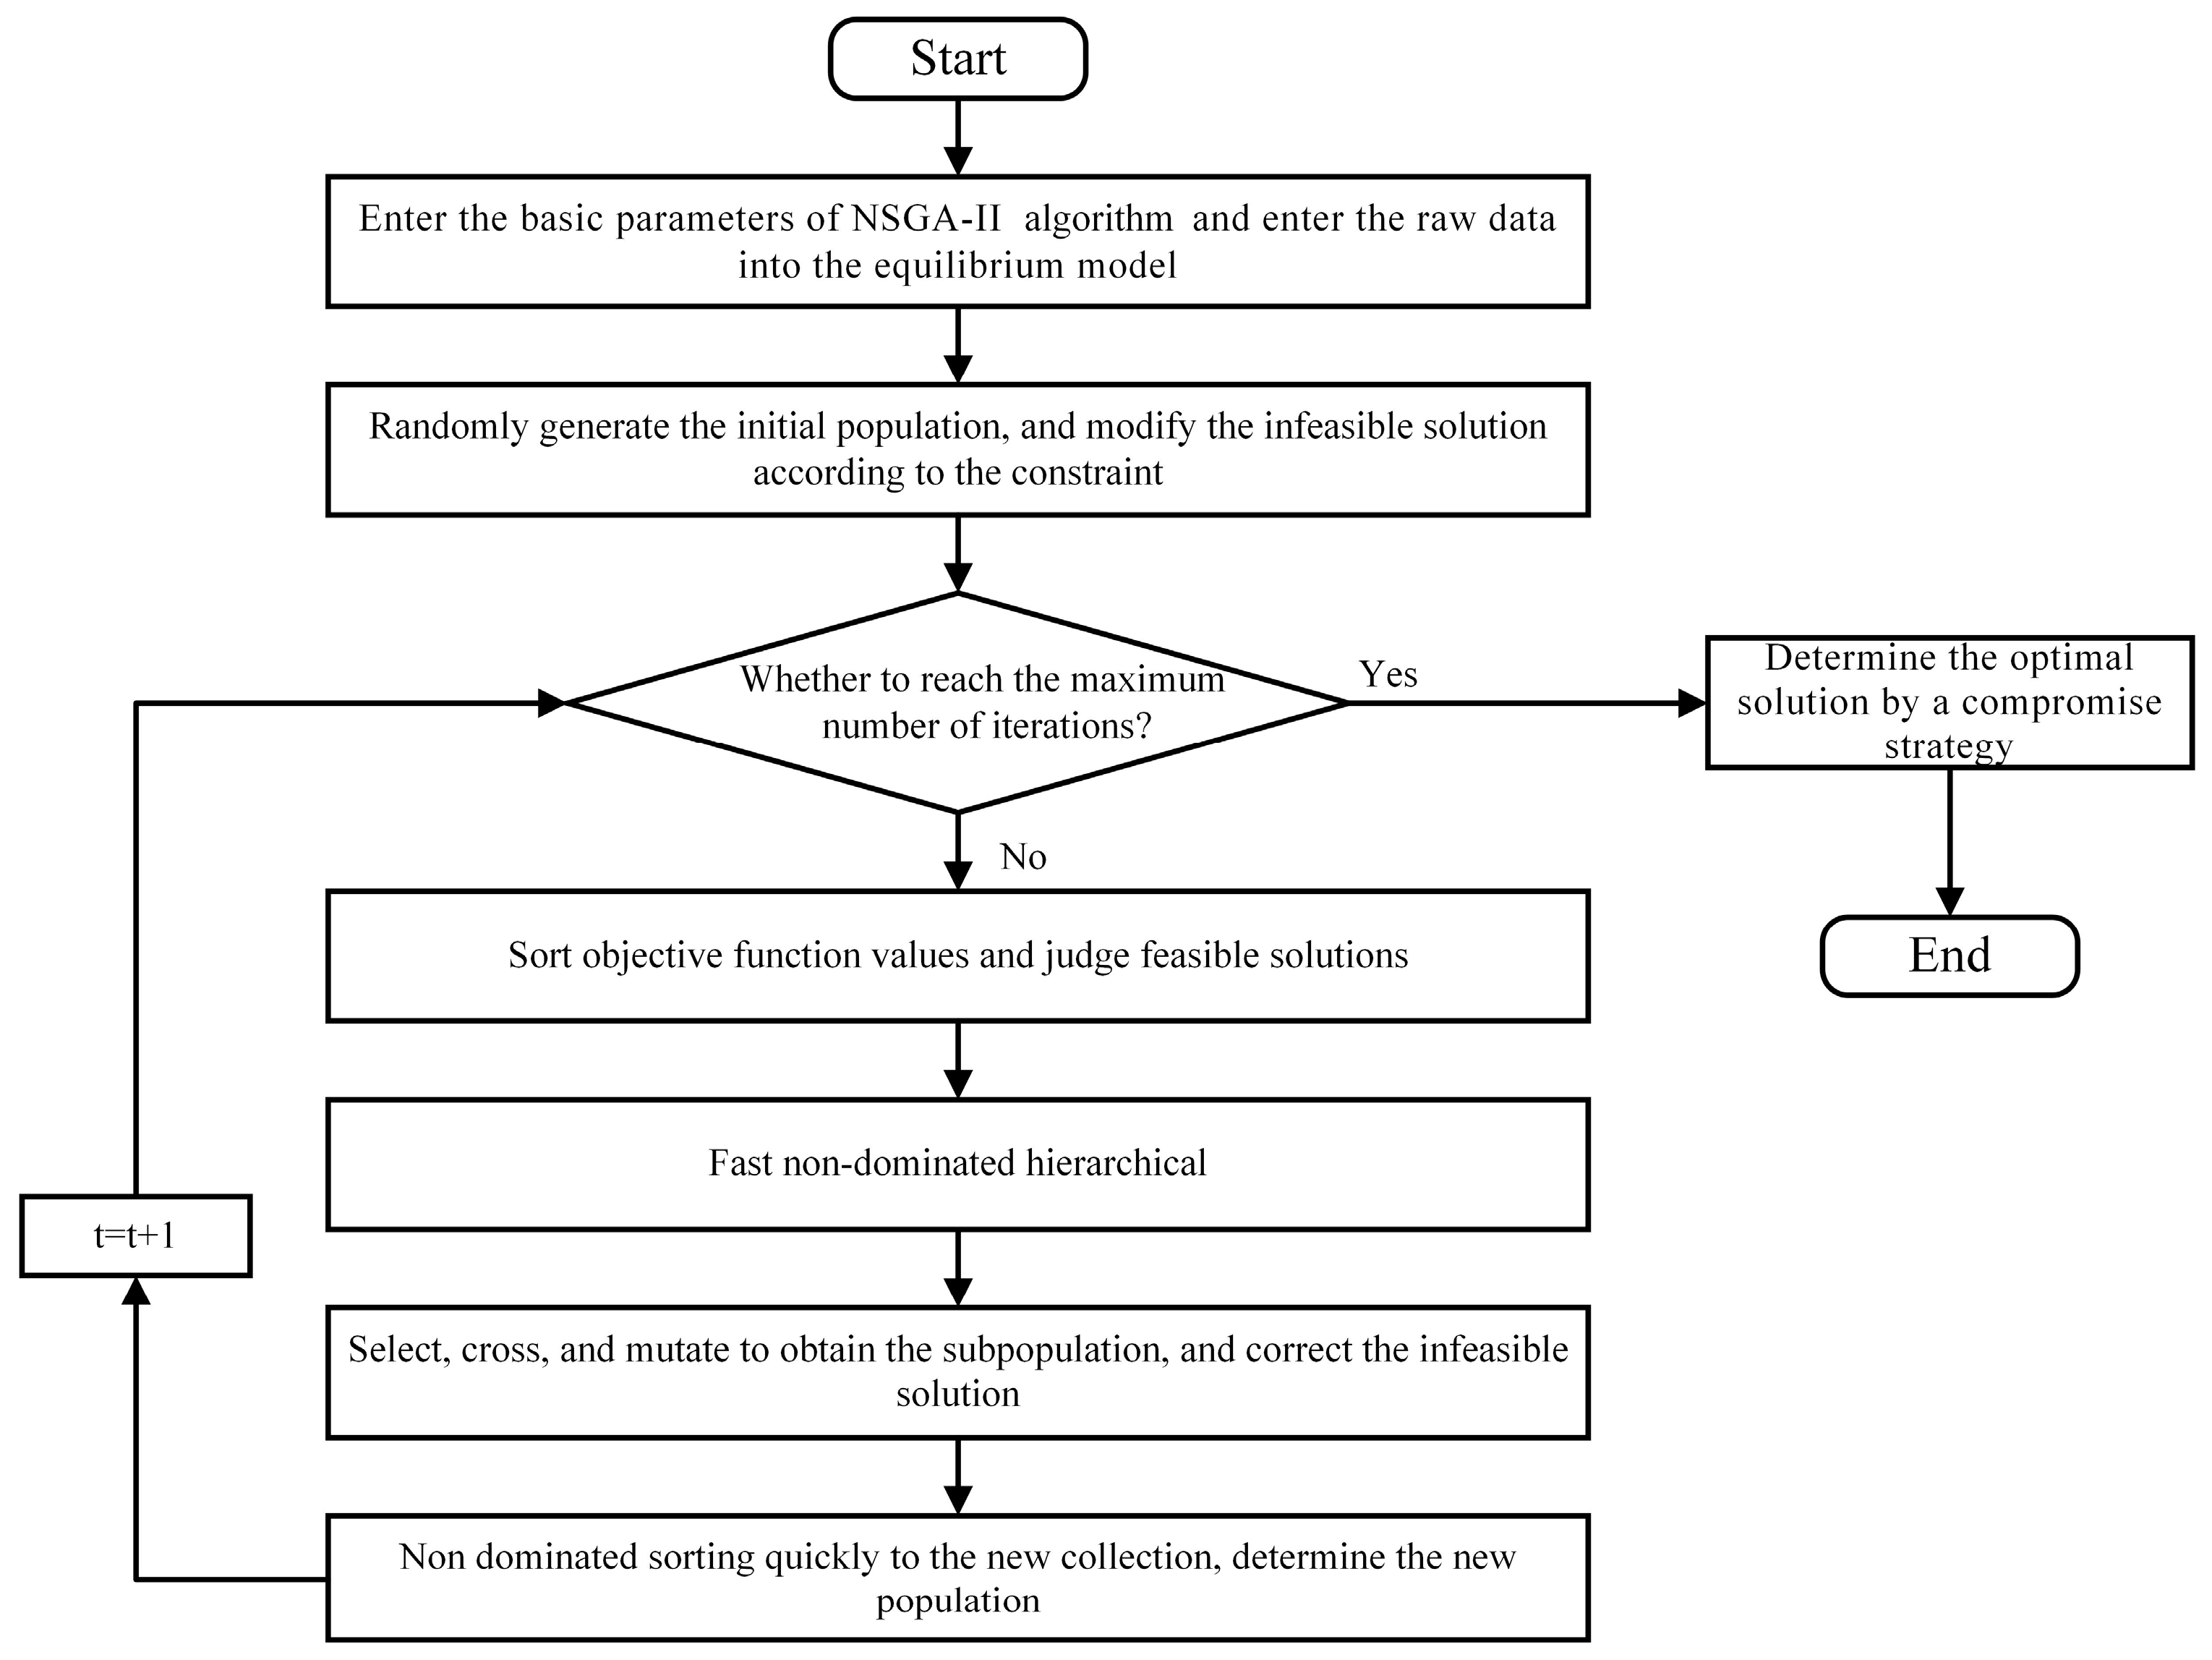
The model was solved by combining nondominated sorting genetic algorithm II (NSGA-II) with grey relational projection (GRP). In the first stage, the NSGA-II algorithm was used to find a well-distributed Pareto solution set. In the second stage, the GRP method is used to calculate the priority membership of the solution set to select the best compromise solution.
(3)
The changes in power generation and clearance results of different types of power producers under different quota ratios were compared, and the market power behavior of each power producer based on the market equilibrium results was analyzed. By introducing the market power index, this study quantifies the influence of renewable energy forecasting errors on the market power of power generators.
The remainder of this study is organized as follows: Section 2 constructs the electricity market equilibrium model under the renewable energy quota system. In Section 3, the process of solving the equilibrium model is studied. In Section 4, the validity of the model is verified by simulation analysis. Section 5 concludes.

2. Equilibrium Model of Electricity Market under Renewable Portfolio Standard

2.1. Model Building Ideas

Based on the basic idea of game theory, this study simulates the bidding behavior of generators in the electricity market, and each generator formulates a reasonable bidding strategy to seek the maximization of its own interests. After many games, all the generators involved in the market will reach an equilibrium state. In this state, each generator has no motivation to change its own strategy and achieves the maximization of its own interests, also known as the Nash equilibrium state.

2.2. Model Assumptions

Assumption 1.
Consider the energy market composed of a green certificate market and an electricity market, in which the number of thermal power generators is M, and the number of renewable energy power generators is N. The market stipulates that power generators have quota requirements, and the quota is represented by K; that is, each power generator must ensure that K’s share of its total power generation comes from renewable energy. At the same time, one unit of green certificate can be obtained for every 1 MWh of renewable energy produced.
Assumption 2.
In the electricity market, the electricity supply and demand are always in a state of balance, and a linear function relationship is satisfied between the transaction price and the total electricity demand. Therefore, the inverse demand function of the transaction price can be expressed as:
P s = A B Q
where  P s is the electricity market transaction price, A and B are constants greater than 0, and Q is the total demand in the electricity market.
Assumption 3.
Assume that all generators compete in the electricity market in a Cournot competition model. Renewable energy generators can sell excess green certificates for additional income. Renewable energy generators participate in the certificate market competition in the form of the following supply functions:
Q j T G C = α j + β j p c
where α j and β j are the intercept and slope of the supply function, respectively. Q j T G C is the number of green certificates sold by the j-th renewable energy generator, and p c is the price of green certificates.

2.3. Green Certificate Transaction Mode

Figure 1 shows the interrelationships among various participants, including government departments, thermal power generators, and renewable energy generators. Government departments, as policymakers, assign quota tasks to power generators. Both thermal power generators and renewable energy generators can make profits by selling electricity in the electricity market. When renewable energy generators produce green electricity, the government issues green certificates to them. As a green certificate holder, it trades with thermal power generators in the green certificate market and attains additional income. In the green certificate market, the price of the certificate is inversely proportional to the quantity. The volume of green certificates is related to the amount of electricity generated and sold by renewable energy generators. For renewable energy generators, they can choose to sell their existing certificates in time, or they can hold certificates and wait for them to be sold when the price of these certificates rises.

2.4. Renewable Energy Uncertainty

With the rapid increase in the grid-connected scale of renewable energy, in order to ensure the safe and stable operation of the power system, the allocation of reserve capacity must be strengthened on the original basis to cope with the volatility and intermittency of renewable energy generation.
For a power system with renewable energy, an important basis for examining whether the reserve configuration is reasonable is whether the reliability of the system remains unchanged before and after the renewable energy is connected. In this study, the reliability index loss-of-load probability (LOLP) is used as the basis for determining the reserve capacity. According to the reference [21], it can be seen that the user load prediction approximately obeys the law of normal distribution, so the calculation formula of the probability of loss of load is shown in Equation (3).
L O L P = R l 1 2 π σ l exp ( Δ P l 2 2 σ l 2 ) d Δ P l
where σ l is the standard deviation of the load forecast error, which is generally considered to be inversely proportional to the installed capacity of the system; R l is the load reserve of the system, which can usually be set as a fixed proportion of the load demand; Δ P l is the load prediction error.
In the existing studies, the probability distribution of renewable energy prediction error exists in various forms, and this study takes wind power uncertainty as an example. Reference [22] regards renewable energy as a negative equivalent load and believes that it also obeys the law of normal distribution near the predicted value, thus obtaining the additional reserve capacity after renewable energy is connected to the grid. However, a large number of statistical data prove that the use of normal distribution to simulate the power prediction error of renewable energy cannot accurately reflect the peak and thick tail characteristics of the probability density curve. Therefore, this study uses the joint probability density function of normal and Laplace distributions to fit the forecast error of renewable energy generation, namely:
f 1 ( Δ P w i n d ) = a 1 2 b exp ( Δ P w i n d b ) + a 2 2 π σ w i n d exp ( Δ P w i n d 2 2 σ w i n d 2 )
where Δ P w i n d is the renewable energy generation forecast error, σ w i n d is the standard deviation of the renewable energy generation forecast error, b is the scale parameter, a 1 , a 2 is the proportional coefficient, and its calculation formula is:
3 a 1 + 6 a 2 = k W a 1 + a 2 = 1
where k W is the kurtosis, and its size is related to the peak value of the probability density curve at the mean value.
It can be seen from the reference [23] that the forecast error of renewable energy and the load forecast error are independent of each other. If the renewable energy power generation is regarded as a negative equivalent load, the probability density function of the forecast error of the net load of the system is:
f ( Δ P n e t ) = f ( Δ P w i n d + Δ P l ) = f 1 ( Δ P w i n d ) f 2 ( Δ P l )
where f 2 is the probability density function of the normal distribution.
Since the probability of system load loss remains the same before and after the addition of renewable energy, the reserve capacity to be set can be determined according to Equation (7):
R d e m a n d f ( Δ P n e t ) d Δ P n e t = 1 L O L P
where R d e m a n d is the reserve capacity that the renewable energy generator needs to configure.

2.5. Objective Function

2.5.1. Maximize the Revenue of Thermal Power Generators

The income of each thermal power generator mainly includes two parts: the first part is the net income from power generation, which is the income from power generation minus the cost of power generation; the second part is the fee that thermal power generators need to pay for purchasing green certificates in the green certificate market. Therefore, the maximum revenue objective function of the thermal power generation alliance can be expressed as:
max i = 1 m f T e r m a l , i = i = 1 m ( P s q i C T e r m a l , i K p c q i ) C T e r m a l , i = C R L , i + C M E , i + C Z J , i C R L , i = a i q i 2 + b i q i + c i C M E , i = K m e , i q i C Z J , i = C a z , i 8760 f i r ( 1 + r ) k i ( 1 + r ) k i 1 q i
where f T e r m a l , i is the revenue of the i-th thermal power generator, C T e r m a l , i is the power generation cost of the i-th thermal power generator, C R L , i is the fuel cost of the i-th thermal power generator, q i is the power generation of the i-th thermal power generator, a i , b j , c j are the fuel cost coefficients of the i-th thermal power generator, respectively, C M E , i is the maintenance cost of the i-th thermal power generator, K m e , i is the equipment maintenance coefficient of the i-th thermal power generator, C Z J , i is the equipment depreciation cost of the i-th thermal power generator, C a z , i is the installation cost of the i-th thermal power generator, f i is the installation volume coefficient of the i-th thermal power generator, k i is the operating life period of the device of the i-th thermal power generator, and r is the annual interest rate.

2.5.2. Maximize the Revenue of Renewable Energy Generators

The income of each renewable energy generator mainly includes two parts: the first part is the net income of power generation, which is the income from power generation minus the cost of power generation; the second part is the income from selling a part of the green certificate in the green certificate market. Therefore, the maximum revenue objective function of the renewable energy generator alliance can be expressed as:
max j = 1 n f R e n e w a b l e , j = j = 1 n ( P s q j C R e n e w a b l e , j + p c Q j T G C ) C R e n e w a b l e , j = C M E , j + C Z J , j + C D E , j C M E , j = K m e , j q j C Z J , j = C a z , j 8760 f j r ( 1 + r ) k j ( 1 + r ) k j 1 q j C D E , j = m j R d e m a n d , j 2 + n j R d e m a n d , j
where f R e n e w a b l e , j is the revenue of the j-th renewable energy generator, C R e n e w a b l e , j is the power generation cost of the j-th renewable energy generator, C M E , j is the maintenance cost of the j-th renewable energy generator, K m e , j is the equipment maintenance coefficient of the j-th renewable energy generator, and q j is the power generation of the j-th renewable energy generator, C Z J , j is the equipment depreciation cost of the j-th renewable energy generator, C a z , j is the installation cost of the j-th renewable energy generator, f j is the installation volume factor of the j-th renewable energy generator, k j is the operating life of the device of the j-th renewable energy generator, C D E , j is the reserve cost when the j-th renewable energy generator configures the reserve capacity R d e m a n d , j , m j , n j are the reserve capacity coefficient of the j-th renewable energy generator.

2.6. Constraints

Constraint 1: The upper and lower limits of the power generation capacity of each generator.
q i min q i q i max
q j min q j q j max
where q i min , q i max , q j min , and q j max represent the minimum and maximum power generation of the i-th thermal power generator and the j-th renewable energy generator, respectively.
Constraint 2: The total number of green certificates actually sold by each renewable energy generator is equal to the total number of green certificates purchased by each thermal power generator.
j = 1 n Q j T G C = K i = 1 m q i
Constraint 3: The number of green certificates actually sold by renewable energy generators does not exceed the upper limit of the number of green certificates available for sale.
0 Q j T G C ( 1 K ) q j
Constraint 4: Green certificate price constraint.
Q j T G C = α j + β j p c

3. Model Solving

3.1. Solving Framework

The competitive equilibrium of power generation trading entities is not only an optimization problem but also a decision problem. In this study, the method of multi-objective optimization combined with GRP is adopted. In order to show the logical structure of this study more clearly, the overall solution framework of the market equilibrium model, as shown in Figure 2, is constructed. The solution of the market equilibrium model is divided into two stages. The first stage is the multi-objective optimization stage. The NSGA-II algorithm is used to solve the established model, and a Pareto solution set is obtained, which enters the optimal decision stage in the decision range. The second stage is the optimal decision stage. GRP method is used to evaluate each solution of the Pareto solution set, and the optimal compromise solution under different quota ratios is obtained.

3.2. NSGA-II Solving Algorithm

The revenue maximization of the power generator alliance is a multi-objective problem, which can be solved using the NSGA-II algorithm [24]. In the green certificate trading market, renewable energy generators use α j as the decision variable of renewable energy generators in the certificate market, determine their own strategy variable α j to affect the price of green certificates, and then seek to maximize their own benefits under strategic equilibrium. In the electricity market, all generators participate in output competition in the form of a Cournot, and a non-cooperative game is adopted among generators, and the decision variable of each generator is selected as its own power generation. Each generator seeks to maximize its own benefits by choosing the amount of electricity it generates in the electricity market.
Firstly, a set of optimal parameters is randomly generated in the feasible region, and the clearing results of the electricity market and the green certificate market are simulated. The two optimization objective function values of the model are obtained, the statistical objective function values are fed back to the optimization algorithm, and the fast, non-dominated sorting and congestion calculation are achieved in the optimization algorithm. Then, the optimal algorithm is used to cross and mutate the optimal parameters, and then the appropriate individuals are selected to evolve into a new parent population, which is simulated again in the simulation module. Follow the above steps to iterate until the requirements are met, as shown in Figure 3.

3.3. Grey Relation Projection

Upon combining the grey system theory and the vector projection principle, the GRP method suitable for dealing with grey decision-making problems in practical systems can be obtained [25]. In order to further solve the optimal revenue of the power generation alliance under different quota ratios, this section uses GRP to evaluate each revenue and selects the optimal revenue according to the value of priority membership. The process of calculating the priority membership is as follows:
According to the characteristics of the indicators, the two objectives in this study are “benefit-type” indicators and the projection value V l + ( ) of the l -th scheme on the ideal (negative ideal) scheme is:
V l + ( ) = k = 1 N g γ l k + ( ) w G , k 2 k = 1 t w k 2
where the superscript “+” represents the ideal solution, and the superscript “−” represents the negative ideal solution, N g is the number of indicators used to assess a scheme, γ l k is the gray correlation coefficient between the k -th indicator of the l -th solution and the ideal (negative ideal) solution, w G , k is the weight of each indicator of the scheme. The priority membership d l is
d l = ( V 0 V l ) 2 ( V 0 V l ) 2 + ( V 0 V l + ) 2 , 0 d l 1
where V 0 is the value of V l at γ = 1. It can be seen from the above formula that in order to make the selected scheme closer to the ideal scheme and away from the negative ideal scheme, the method proposed in this study selects the scheme with the largest priority membership as the optimal compromise solution.
The overall calculation process of GRP is as follows: (1) Calculate the grey relation coefficient γ l k between the indicator and scheme. (2) Calculate the projection value V l of the scheme l onto the ideal schemes according to Formula (15). (3) Calculate the priority membership d l of the scheme l according to Formula (16). (4) Output the best comprise solutions with the highest priority membership values.

4. Case Study

4.1. Parameter Setting

This study assumes that there are six power generators participating in the market competition, including four thermal power generators (G1, G2, G3, G4) and two renewable energy generators (G5, G6). The electricity market transaction price is the inverse demand function P s = 100 − 0.04 Q . The parameter settings are shown in Table 1 below.

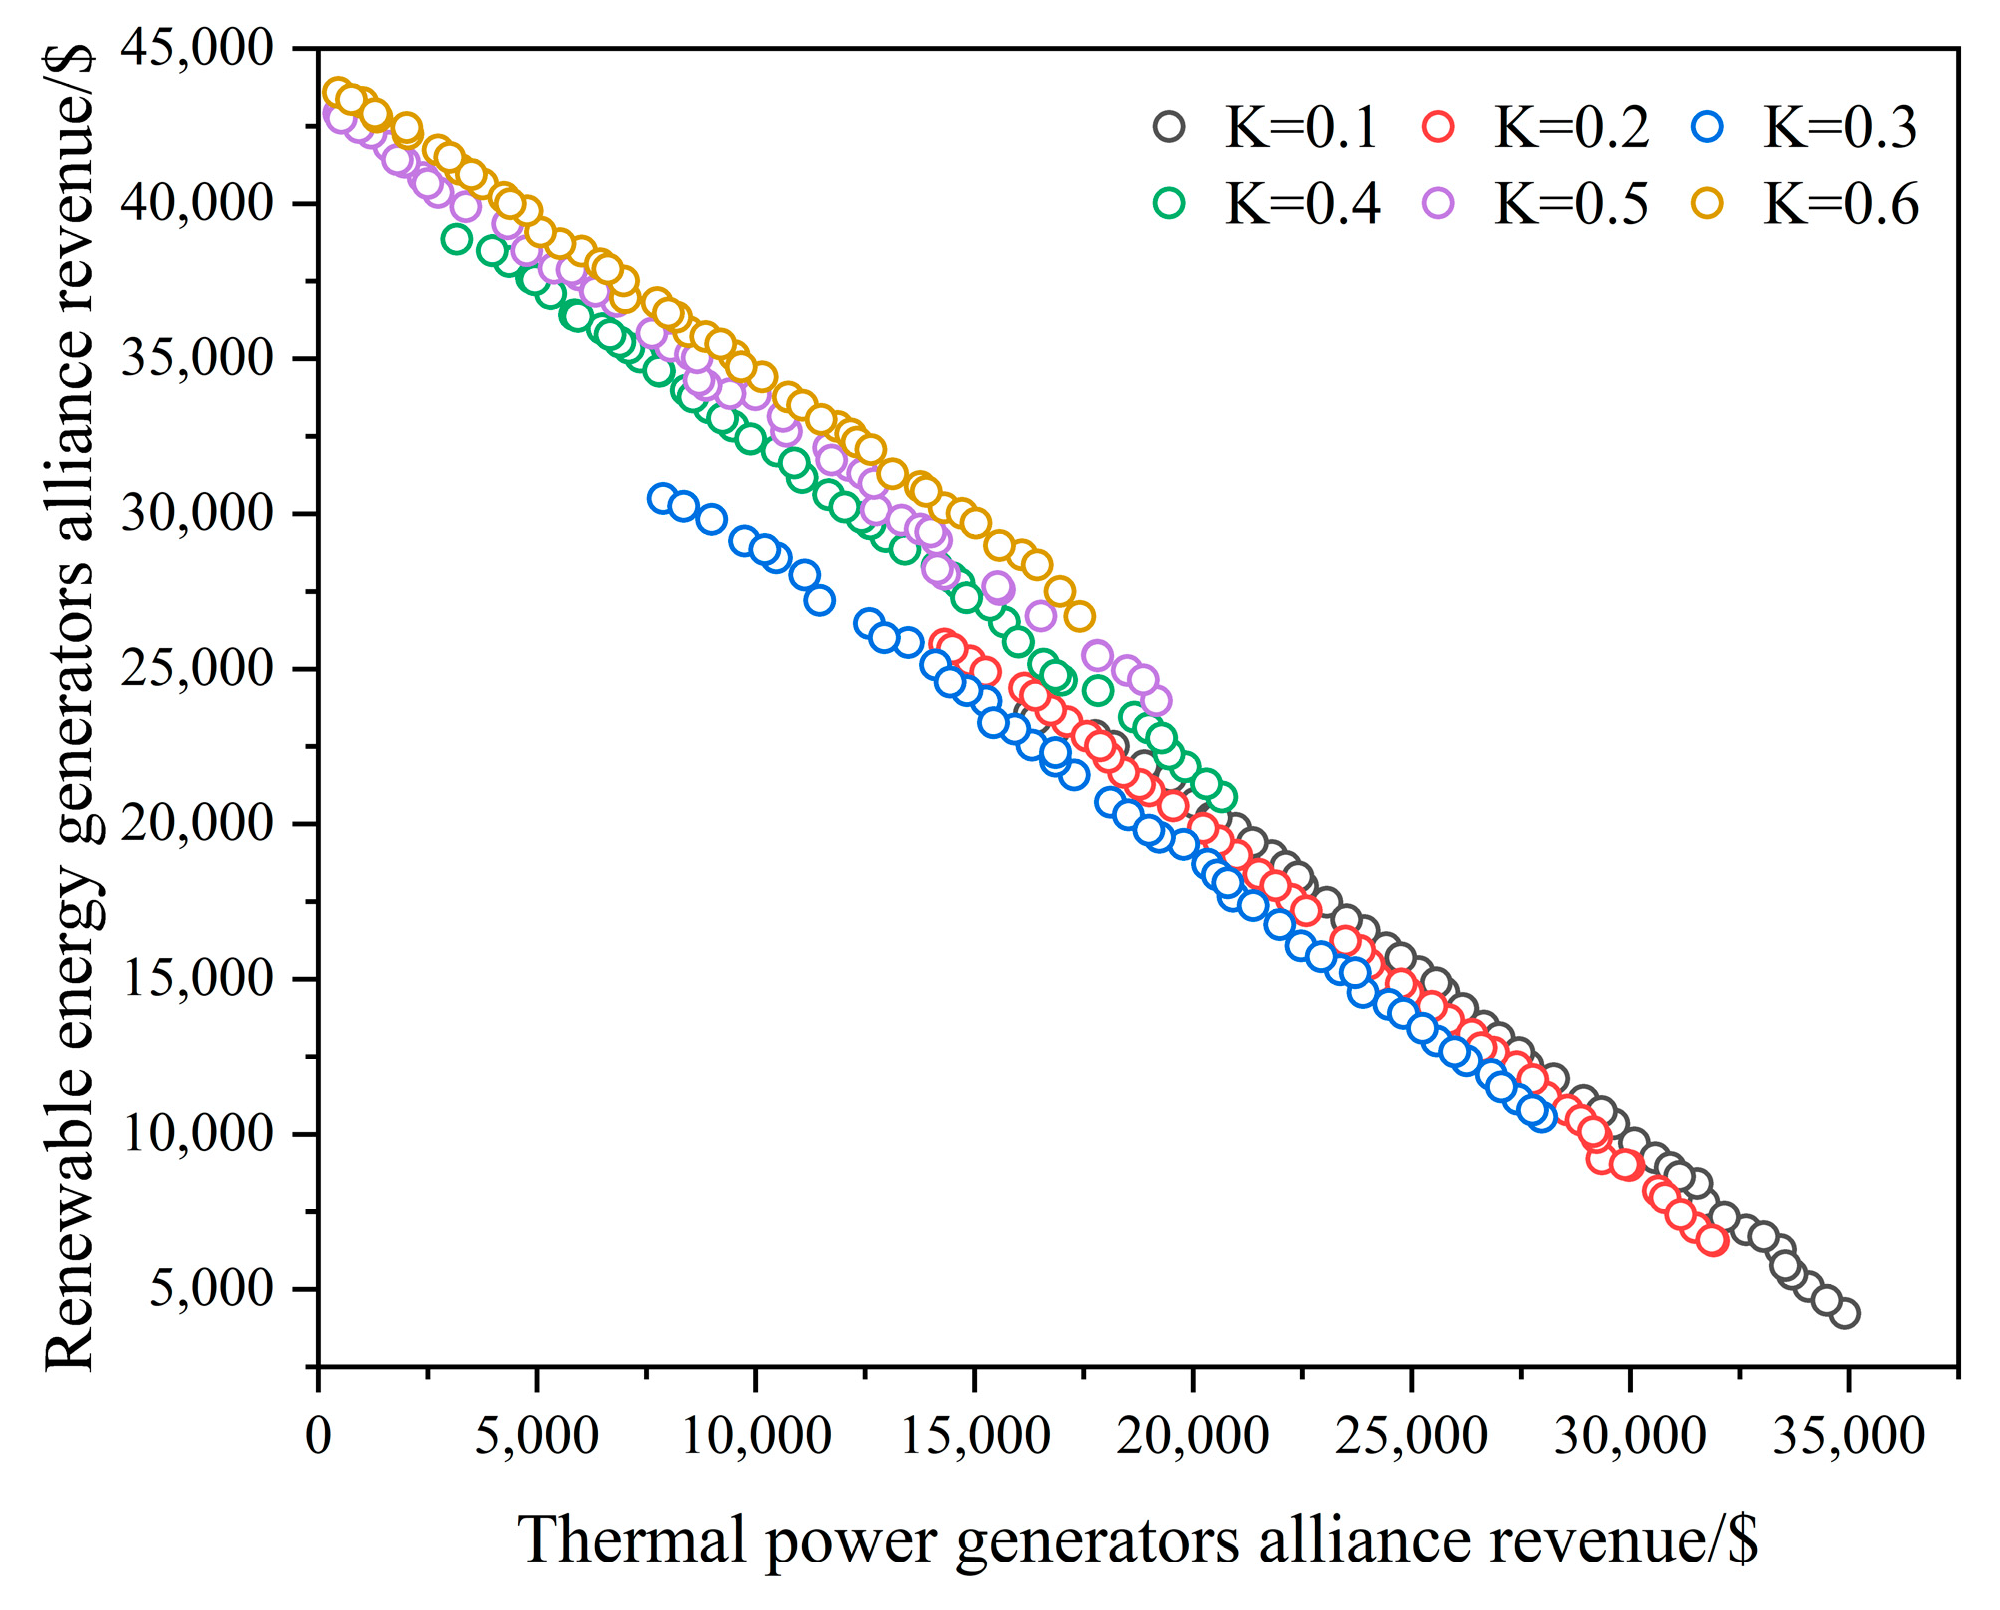
4.2. Pareto Optimal Solution Set

The population size of the NSGA-II algorithm is 50, the genetic algebra is 50, the probability of intersection is 0.9 [26], the probability of mutation is 0.1, and the maximum number of iterations is set to 100. The Pareto solution sets obtained when the quota ratio ranges from 0.1 to 0.6 are shown in Figure 4.
The priority membership degree of each solution in the Pareto solution set is calculated using GRP, and the solution with the highest priority membership degree is regarded as the optimal revenue of the power generation alliance. The results are shown in Table 2.
It can be seen from the above that the proposed algorithm can solve the multi-objective optimization problem of this example by effectively combining NSGA-II and GRP and screening out the optimal compromise solution.

4.3. Analysis on the Equilibrium Results under Renewable Portfolio Standard

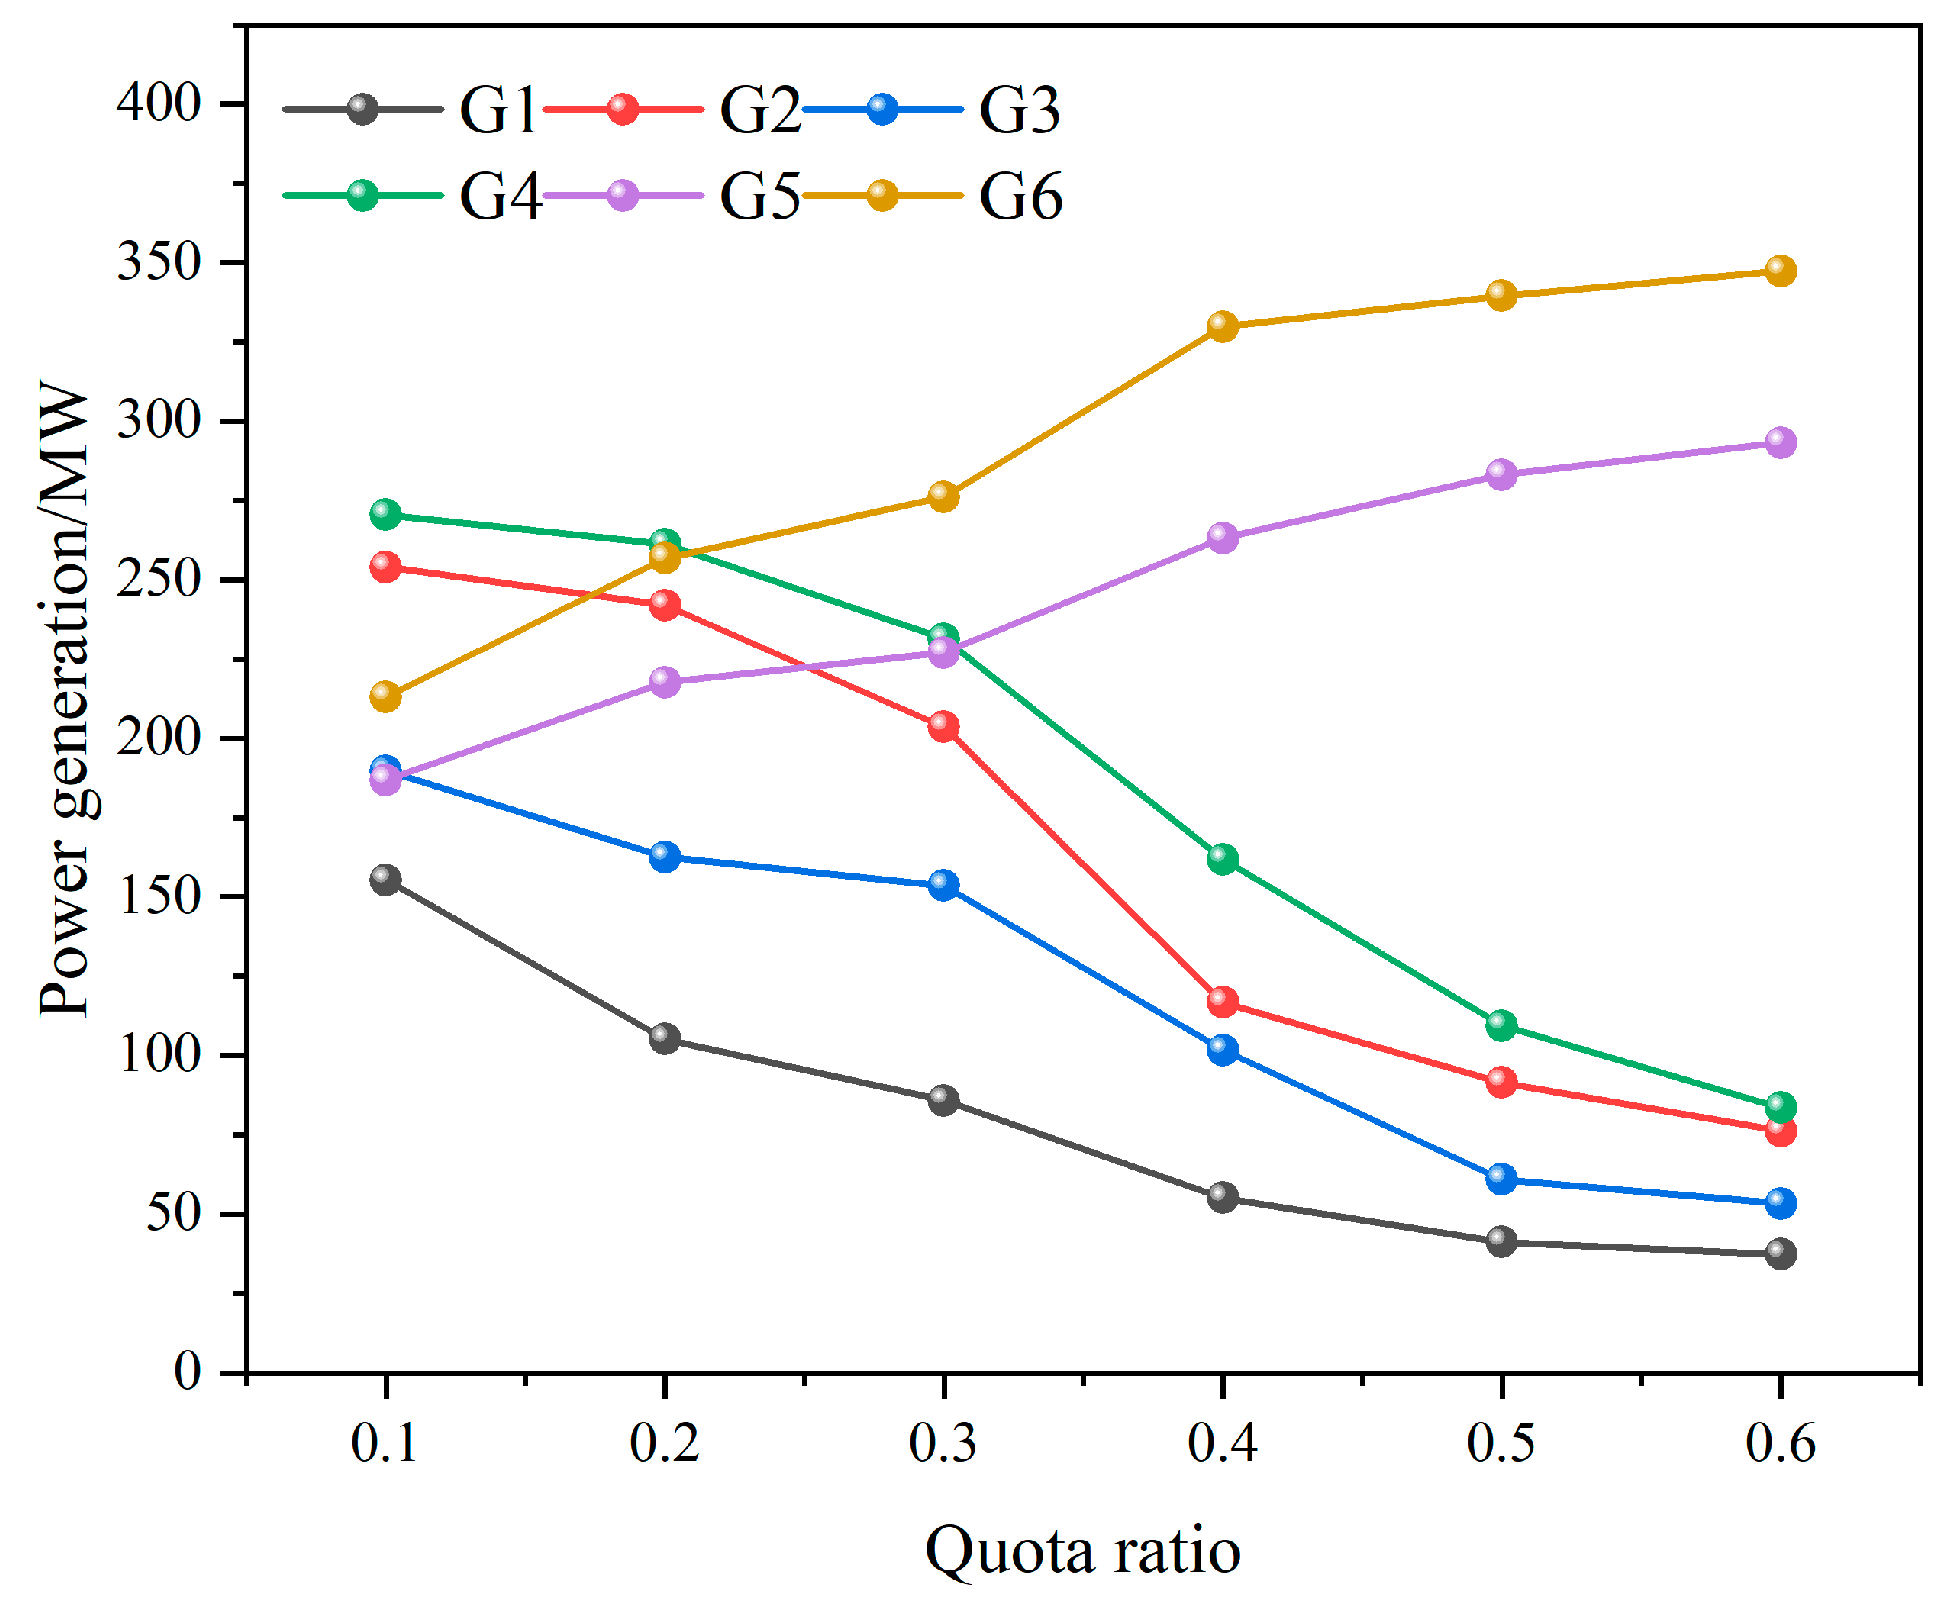
4.3.1. The Impact of Quota Changes on the Power Generation of Power Generators

Figure 5 shows the impact of quota changes on the power generation of thermal power generators and renewable energy generators.
As can be seen from Figure 5, with a continuous increase in the quota, the power generation of renewable energy generators gradually increases, while the power generation of thermal power generators gradually decreases. The reason is that when the quota increases, the market price of certificates increases, which increases the power generation cost of thermal power generators. In order to reduce costs, rational thermal power generators will choose to reduce power generation. Among them, the coal consumption coefficient of the thermal power generator G1 is relatively high, which is a high energy-consuming unit and is in a disadvantageous position in this market competition. The thermal power generation alliance chooses to let low energy-consuming power generators generate more power and high energy-consuming power generators less power when striving for maximum revenue.

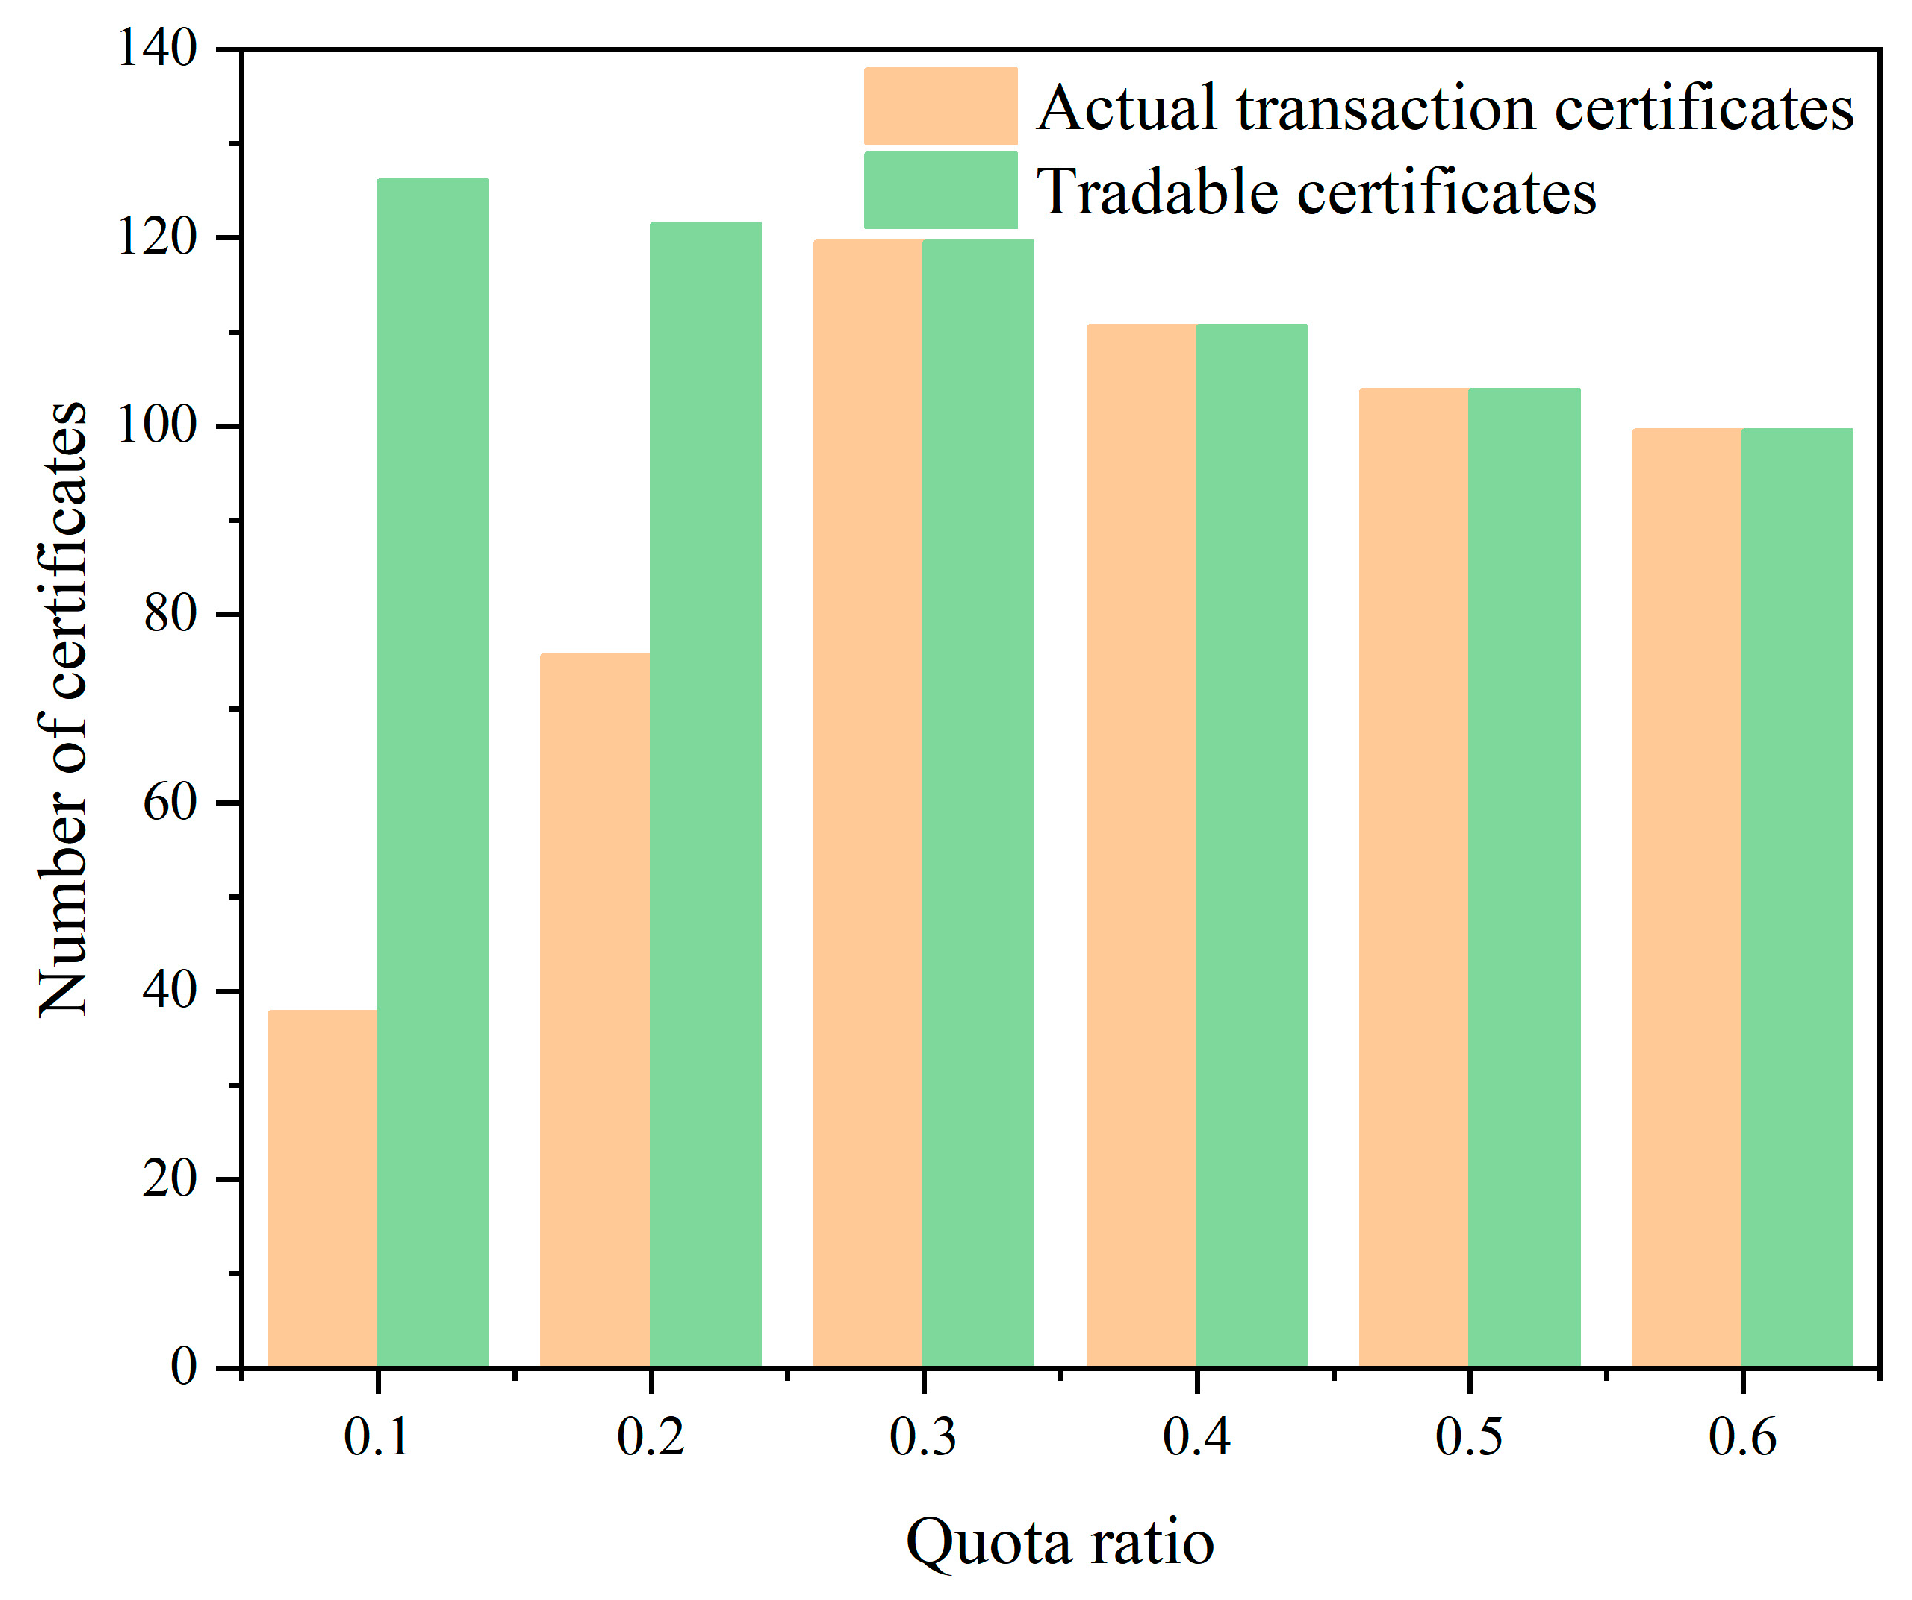
4.3.2. The Impact of Quota Changes on the Number of Market Transaction Certificates

Taking the renewable energy generator G5 as an example, Figure 6 shows the impact of quota changes on the actual number of traded certificates and the number of tradable certificates for the G5.
As can be seen from Figure 6, under the same quota, the more electricity generated by renewable energy generators means more certificates they can sell in the certificate market. When the quota is below 30%, the actual number of certificates sold is always lower than the number of certificates that can be traded. This means that renewable energy generators choose to retain some green certificates in order to increase the price of green certificates and increase their earnings. When the quota ratio is 0.1, the number of green certificates held by renewable energy generators is 89; When the quota ratio is 0.2, the number of green certificates retained is 46. It can be seen that the lower the quota ratio, the more green certificates are retained by renewable energy generators. With an increase in the proportion of quotas, the demand for quotas by renewable energy generators themselves and the volume of green certificates demanded in the market also increased. When the quota is higher than 30%, the number of certificates that can be traded is equal to the number of certificates actually traded, indicating that at this time, renewable energy generators no longer hold green certificates in the certificate market (no excess green certificates can be retained), but with an increase in the quota proportion, their power generation gradually decreases. It can be seen that renewable energy generators reduce the number of certificates that can be traded in the certificate market by reducing the amount of electricity generated and thus increasing the certificate price. To sum up, renewable energy generators choose different strategies under different quotas to ensure the maximization of their own interests.

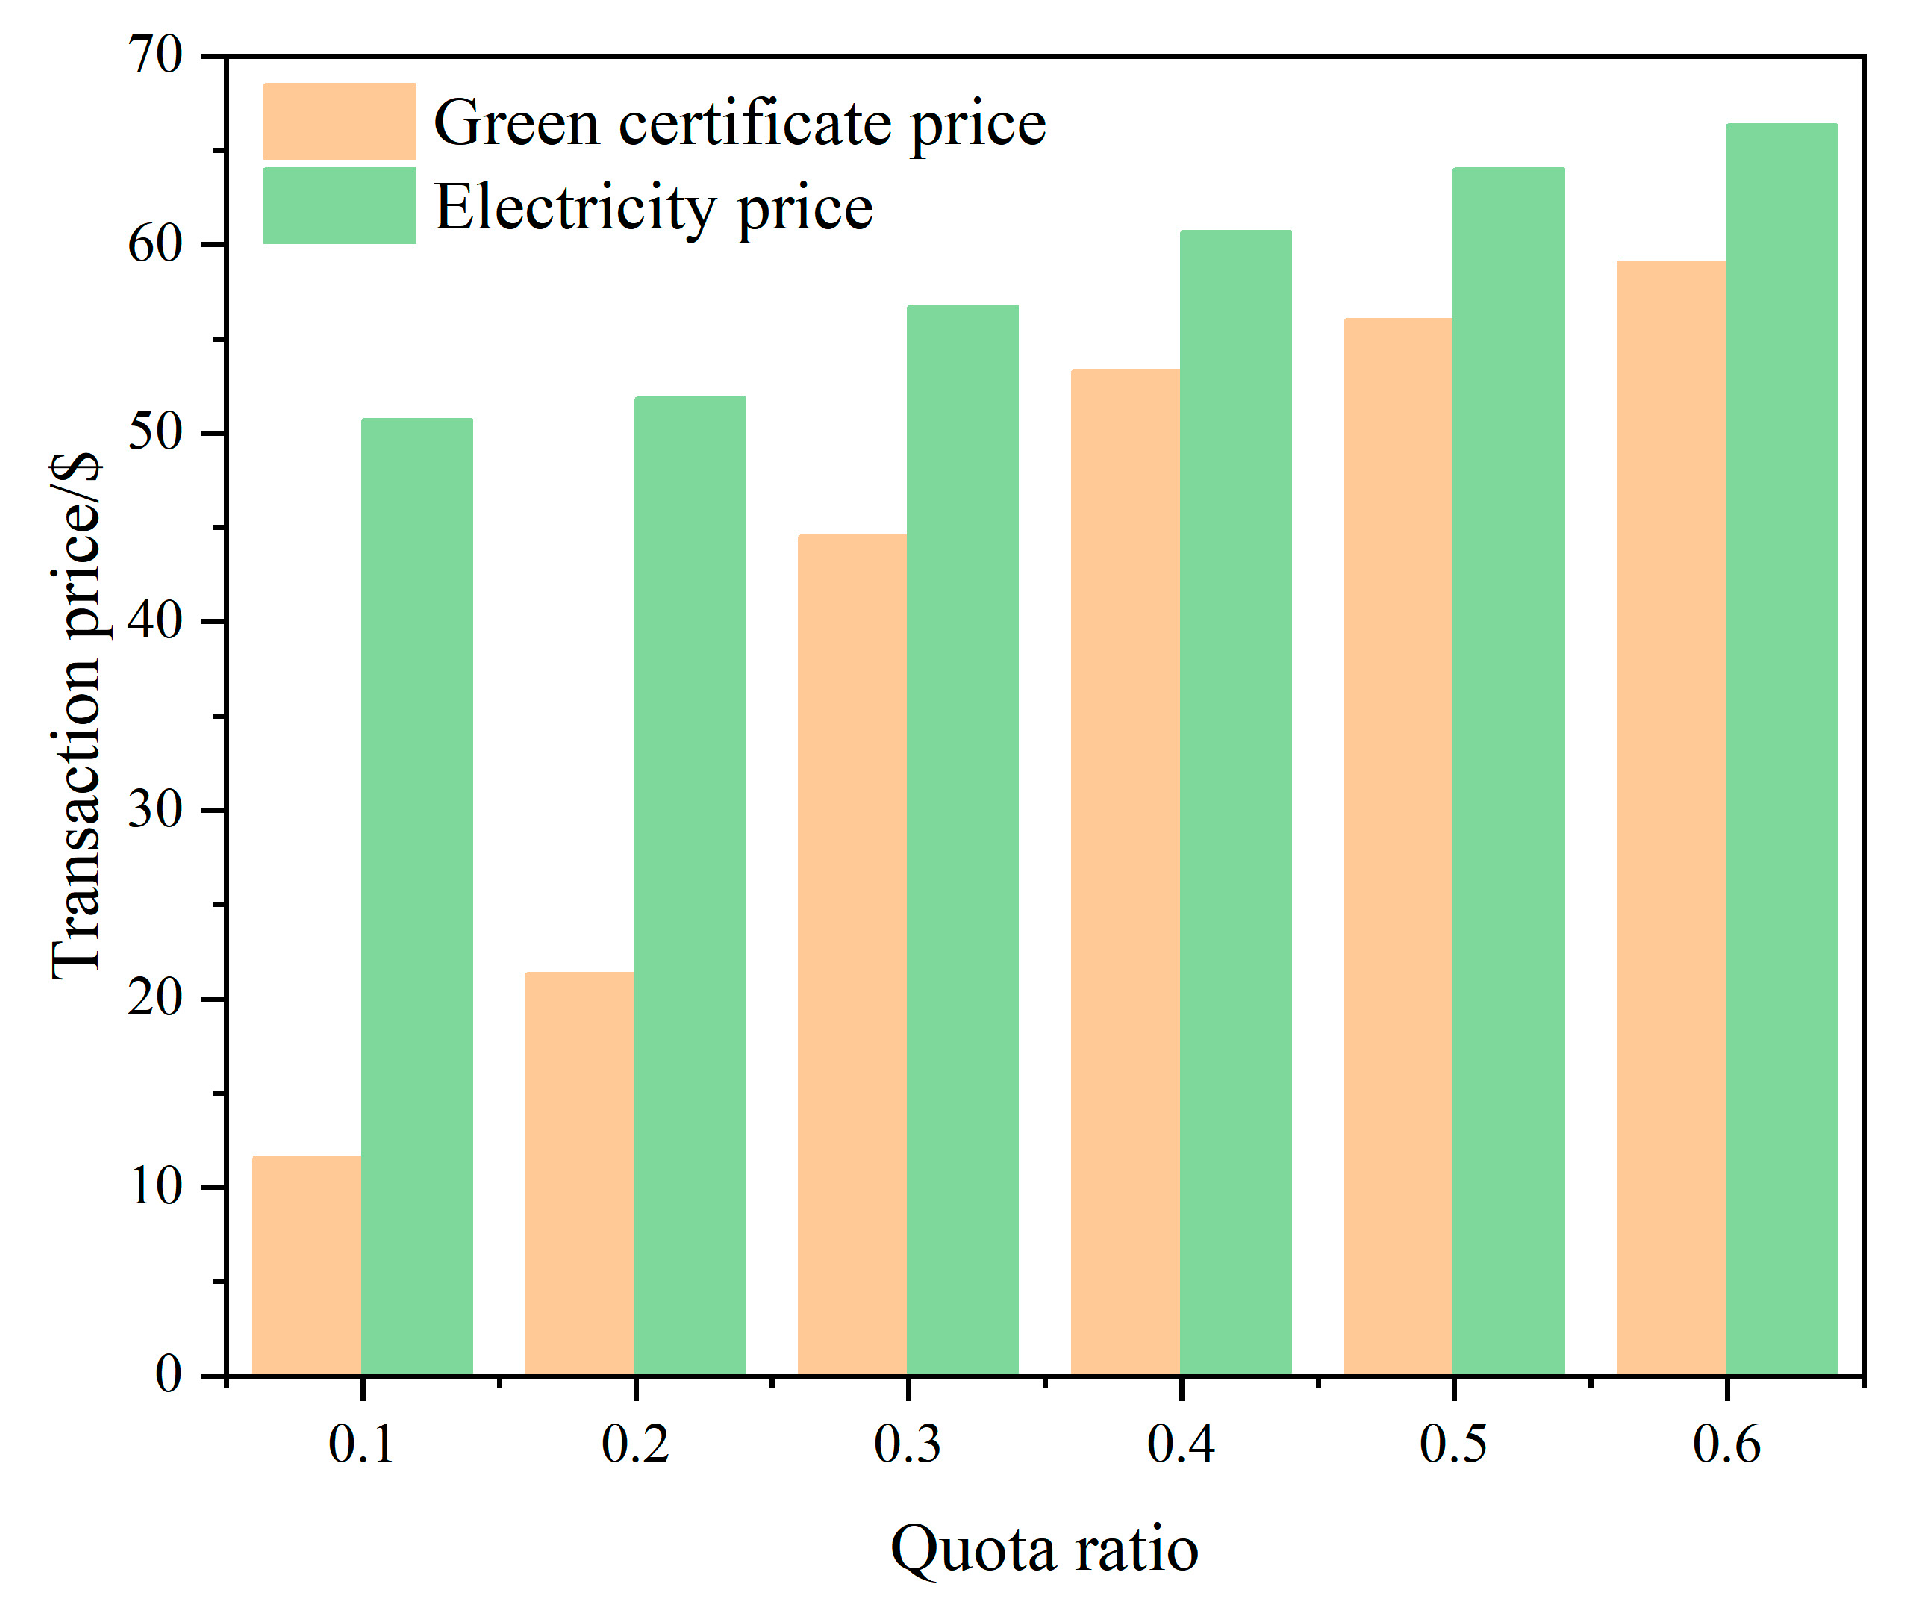
4.3.3. The Impact of Quota Changes on Electricity Market Transaction Prices and Green Certificate Prices

Figure 7 shows the impact of quota changes on electricity market transaction prices and green certificate prices.
As can be seen from Figure 7, with an increase in the quota ratio, the transaction price of the two markets increases simultaneously. The reason is that with an increase in the quota ratio, on the one hand, when the quota ratio is low, the renewable energy power generators hold green certificates, which increases the price of green certificates; on the other hand, the thermal power generators need to buy more green certificates, and the thermal power generators will reduce the purchase cost of green certificates by reducing power generation, thus increasing the transaction price in the power market. In the green certificate market, with an increase in the quota ratio, the number of green certificates traded by renewable energy power generators gradually equals the number of green certificates actually traded. Renewable energy power generators cannot raise the price of green certificates by retaining them, and renewable energy power generators will reduce the number of green certificates traded by reducing power generation, thus increasing the price of green certificates.

4.3.4. The Impact of Quota Changes on the Market Power of Generators

In order to more directly reflect the market power of generators, this study introduces the Lerner index, which can measure the difference between the transaction price of the electricity market and the marginal cost of generators. The Lerner index of the x-th generator is:
L e r n e r x = P s M C x P s
where M C x is the marginal cost of the x-th generator. Table 3 shows the impact of quota changes on the Lerner index of G1 and G5.
As can be seen from Table 3, with an increase in quota ratio, the market power of both thermal power generators and renewable energy power generators is on the rise, and the average increase in the market power of renewable energy power generators is 26.8%, much higher than the 6.49% of thermal power generators. In particular, when the quota ratio is 0.2, its market power index increases by 0.235. The reason is that, with an increase in quotas for renewable energy generators, the simultaneous increase in both market prices is the result of their exercise of market power. For thermal power generators, an increase in the market price of certificates makes the cost of power generation increase. Thermal power generators will choose to reduce the cost by reducing the power generation. On the one hand, reducing the power generation will increase the transaction price of the power market. On the other hand, a reduction in power generation reduces the demand for certificates in the certificate market, which can reduce the purchase of certificates.

4.4. Sensitivity Analysis of Model Parameters

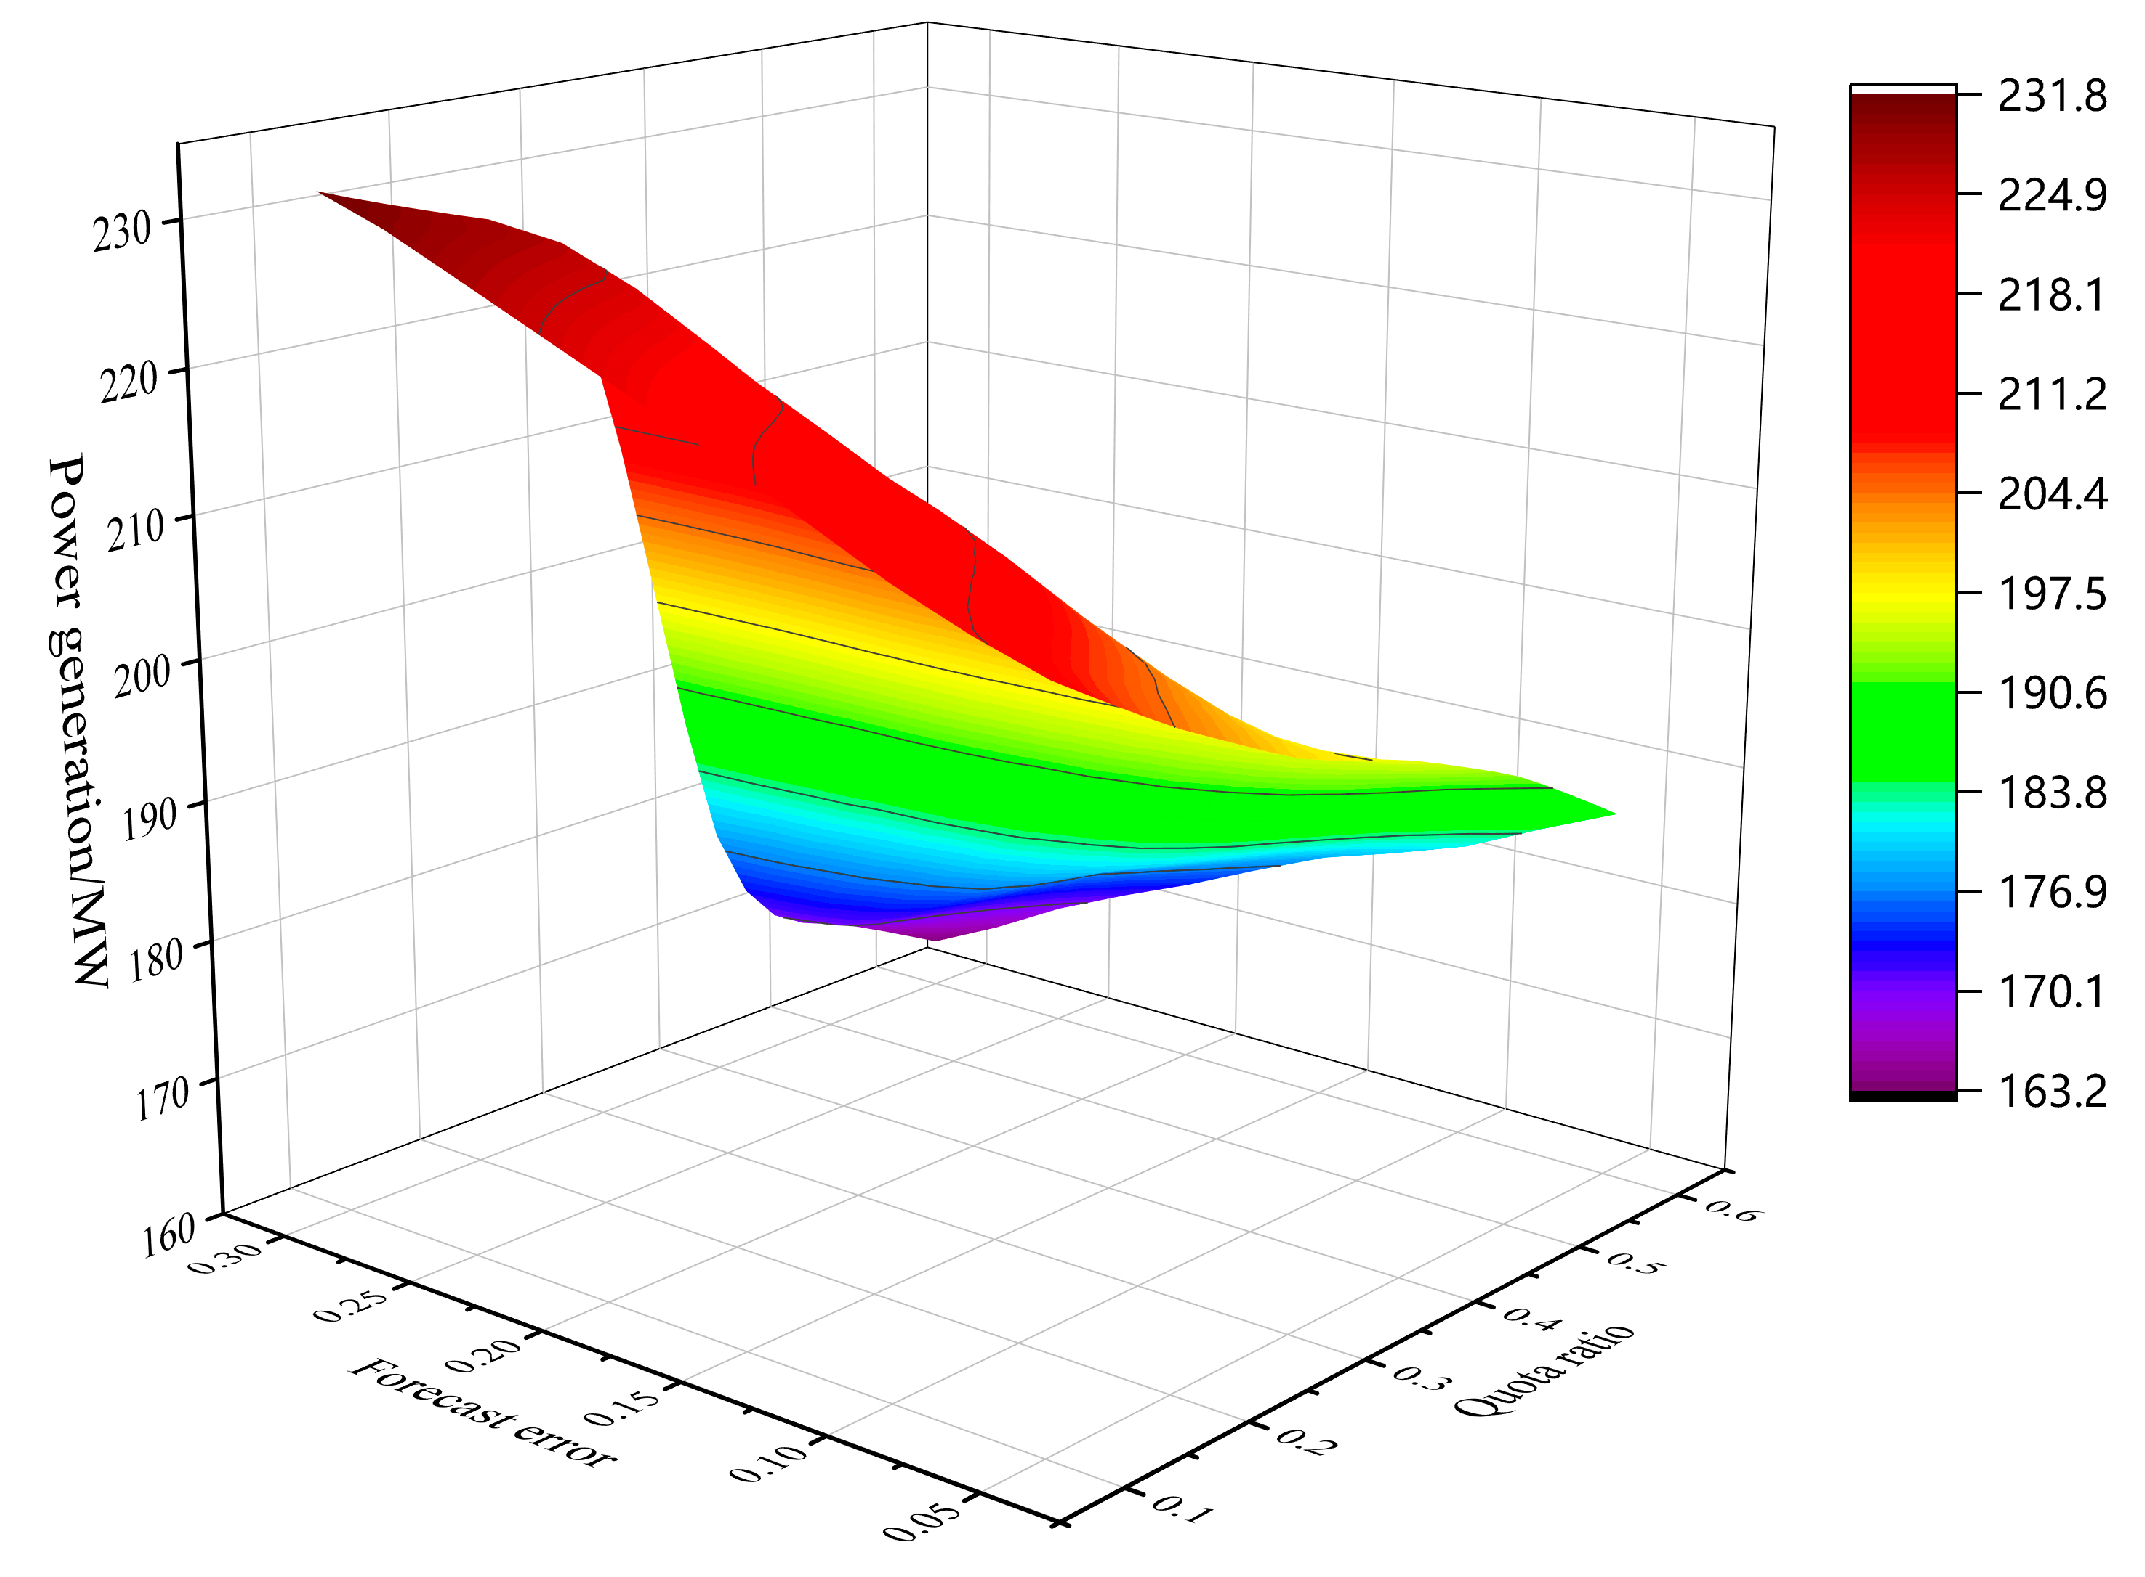
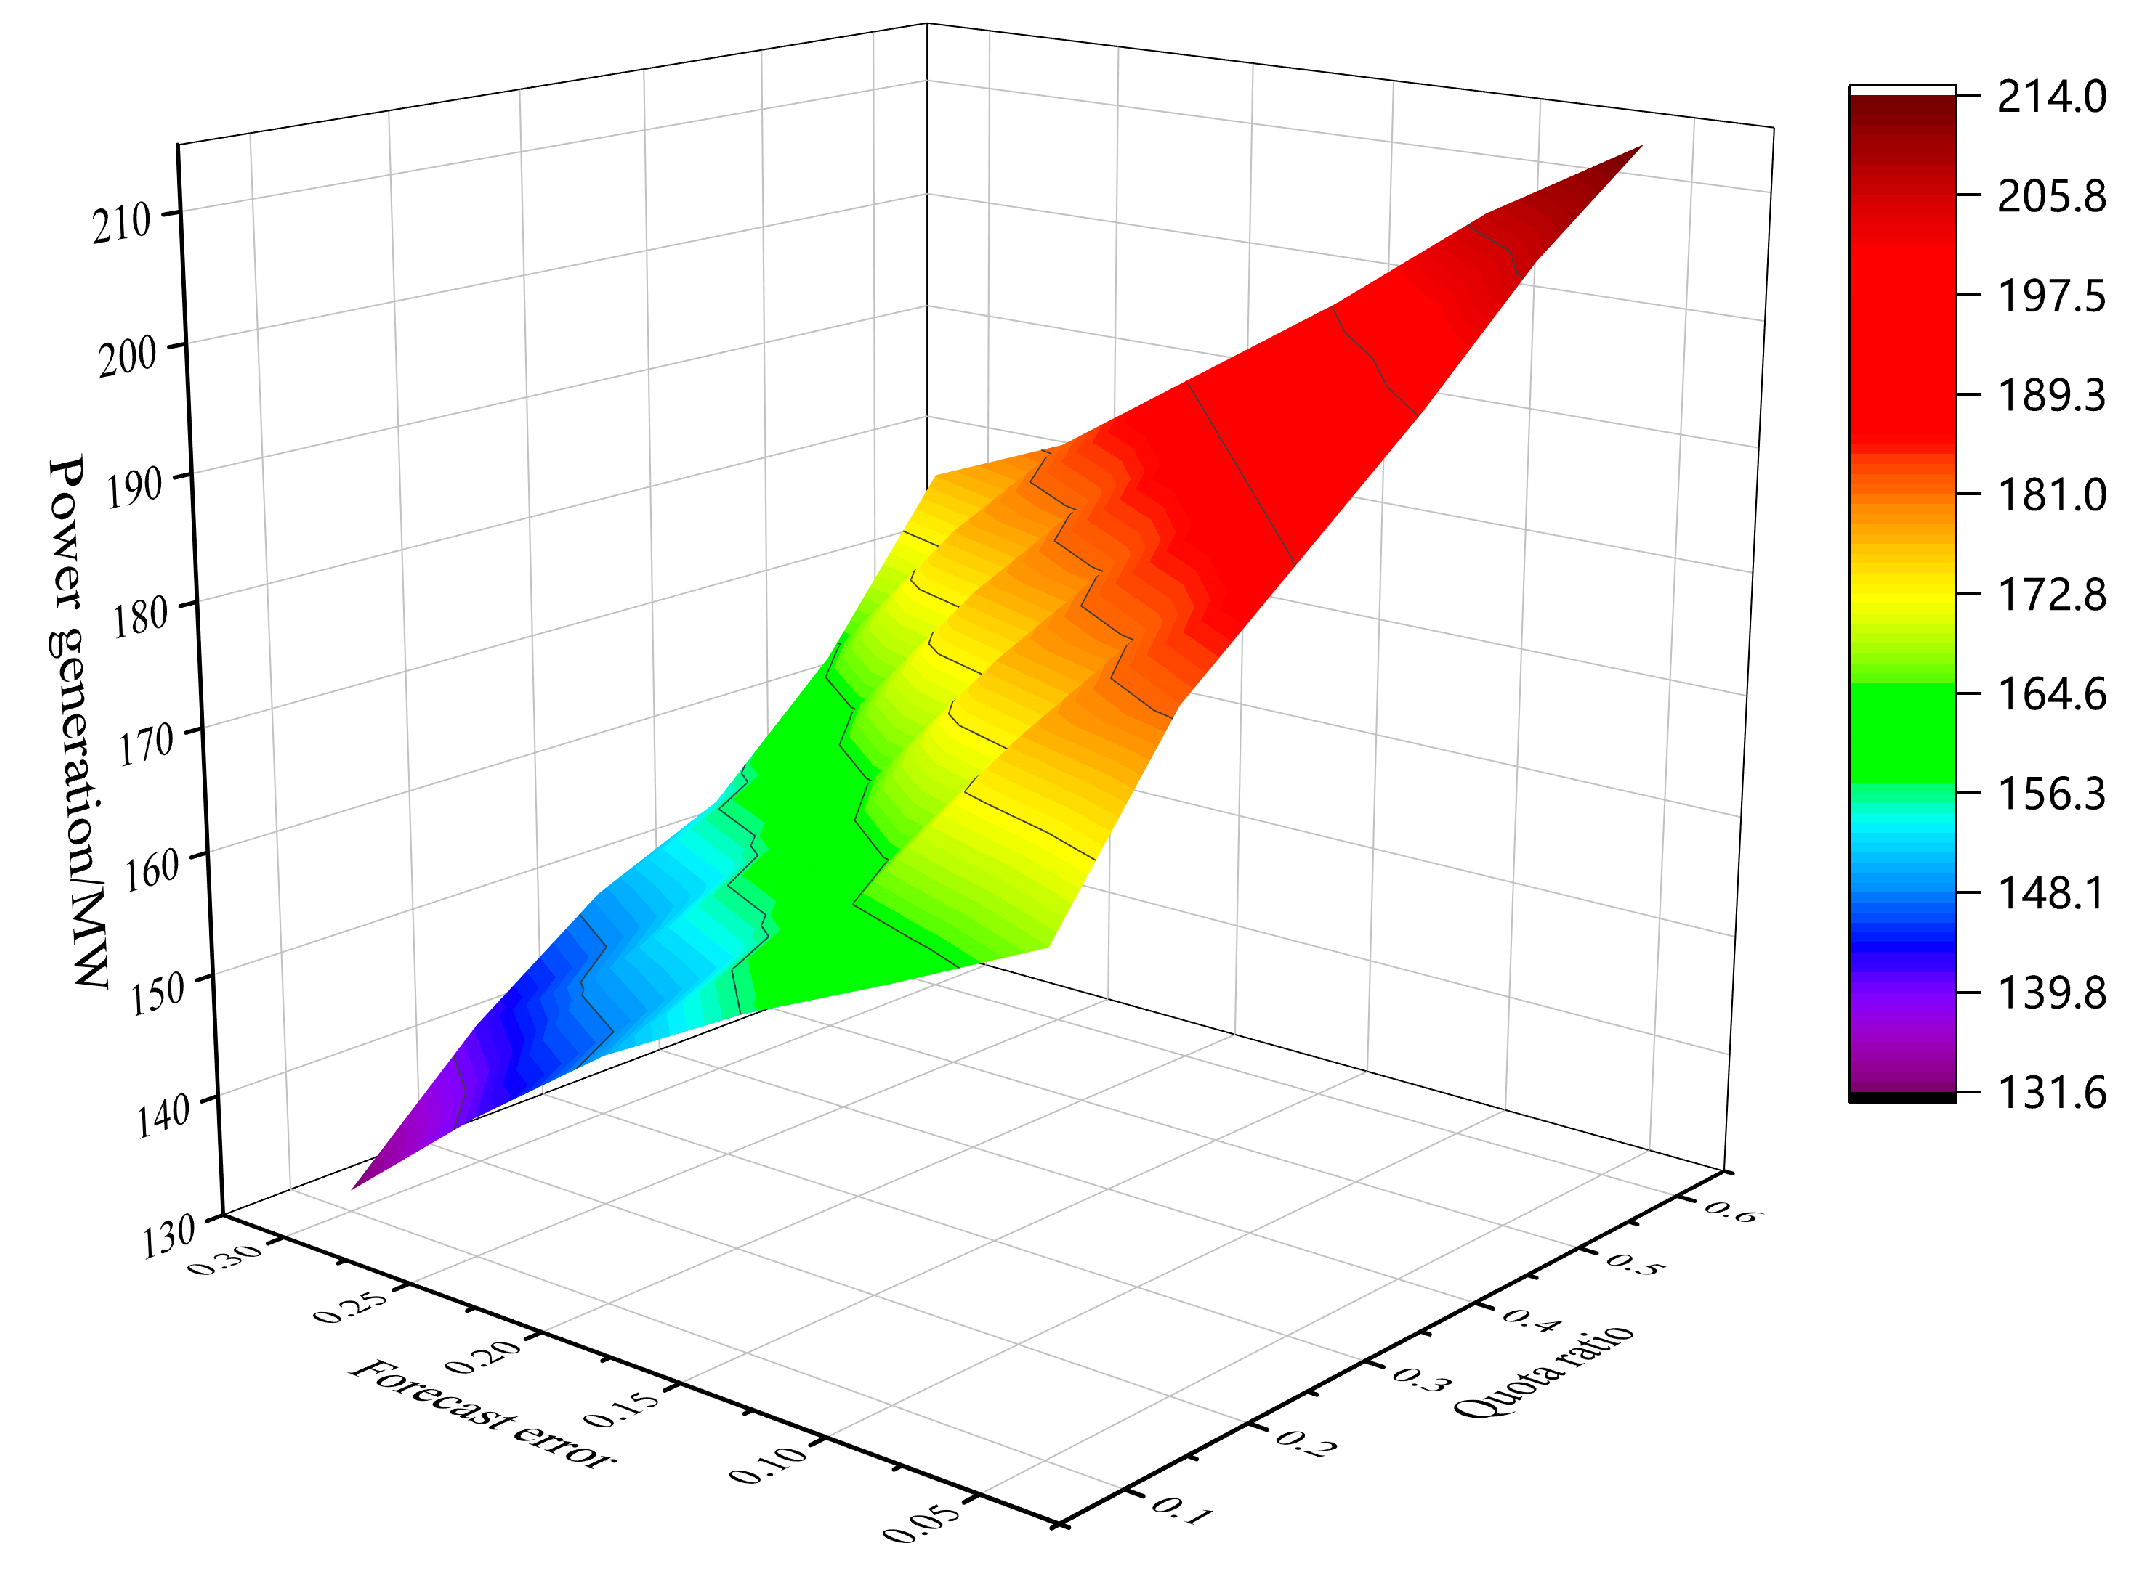
4.4.1. The Impact of Renewable Energy Forecast Errors on the Power Generation of Power Generators

Taking the thermal power generator G1 and the renewable energy generator G5 as examples, Figure 8 and Figure 9 show the impact of renewable energy forecast errors on the power generation of renewable energy generators and thermal power generators when the quota ratio ranges from 0.1 to 0.6.
As can be seen from Figure 8, with an increase in quota ratio, the power generation of thermal power generators presents a trend of first increasing and then decreasing. The reason is that when the quota is low, the higher the cost of electricity generation for the renewable energy generator, the more competitive the thermal power generator, and therefore the more electricity generation. However, when the quota is higher, the market power of renewable energy power generators is larger, and the higher forecast error of renewable energy will make renewable energy generators have stronger market power, and they will choose to reduce more power generation to reduce the number of tradable certificates, which limits the power generation of thermal power generators. Therefore, the higher the prediction error of renewable energy, the lower the power generation of thermal power generators.
As can be seen from Figure 9, the reduction in renewable energy forecast error leads to an overall increase in the power generation of renewable energy generators. The reason is that a reduction in forecasting errors makes renewable energy generators more competitive, and their power generation increases and the increase is significant at low quotas. The reason is that, under different quotas, renewable energy generators exercise market power in different ways. When the quota is lower than 30%, because its own demand for quota is low, the way for renewable energy power generators to exercise market power is to hold the number of tradable certificates in the certificate market and then increase the certificate price and reduce the power generation of thermal power generators. This strategic behavior has little impact on its power generation, so the power generation increases significantly. When the quota is higher than 30%, the renewable energy generators themselves have an increased demand for the number of green certificates, and they have no surplus certificates to keep in the certificate market. In order to increase the certificate price, the renewable energy generators will exercise market power by reducing the power generation, thereby reducing the number of tradable green certificates and increasing the certificate price.

4.4.2. The Impact of Renewable Energy Forecast Errors on the Market Power of Generators

Selecting the thermal power generator G1 and the renewable energy power generator G5 for analysis. Table 4 shows the impact of the forecast accuracy of renewable energy on the Lerner index of G1 and G5 when the quota ratio ranges from 0.1 to 0.6.
As can be seen from Table 4, with a decrease in renewable energy prediction accuracy, the Lerner index of both types of power generators decreases correspondingly, which indicates that the market power of both thermal power generators and renewable energy power generators decreases. Especially when the quota is high, the change is more obvious. Specifically, the Lerner index of G5, a renewable energy generator with higher generation costs, is larger, which means that the renewable energy generator with higher generation costs has greater market power in the two markets. When the power generation cost of renewable energy generators is relatively high, the Lerner index of thermal power generators is relatively large. The reason is that when the electricity generation cost of renewable energy generators is higher, renewable energy generators have more market power to raise the price of green certificates. In order to reduce the purchase cost of green certificates, thermal power generators will exercise more market power to lower the price of green certificates. In addition, when the forecast accuracy is 0.2, the average increase in the market power of the renewable energy power producer G5 is 26.79%, which is higher than the average increase of 26.25% when the forecast accuracy is 0.1, which confirms the mitigation effect of improving the forecast accuracy on the market power of the power producer.

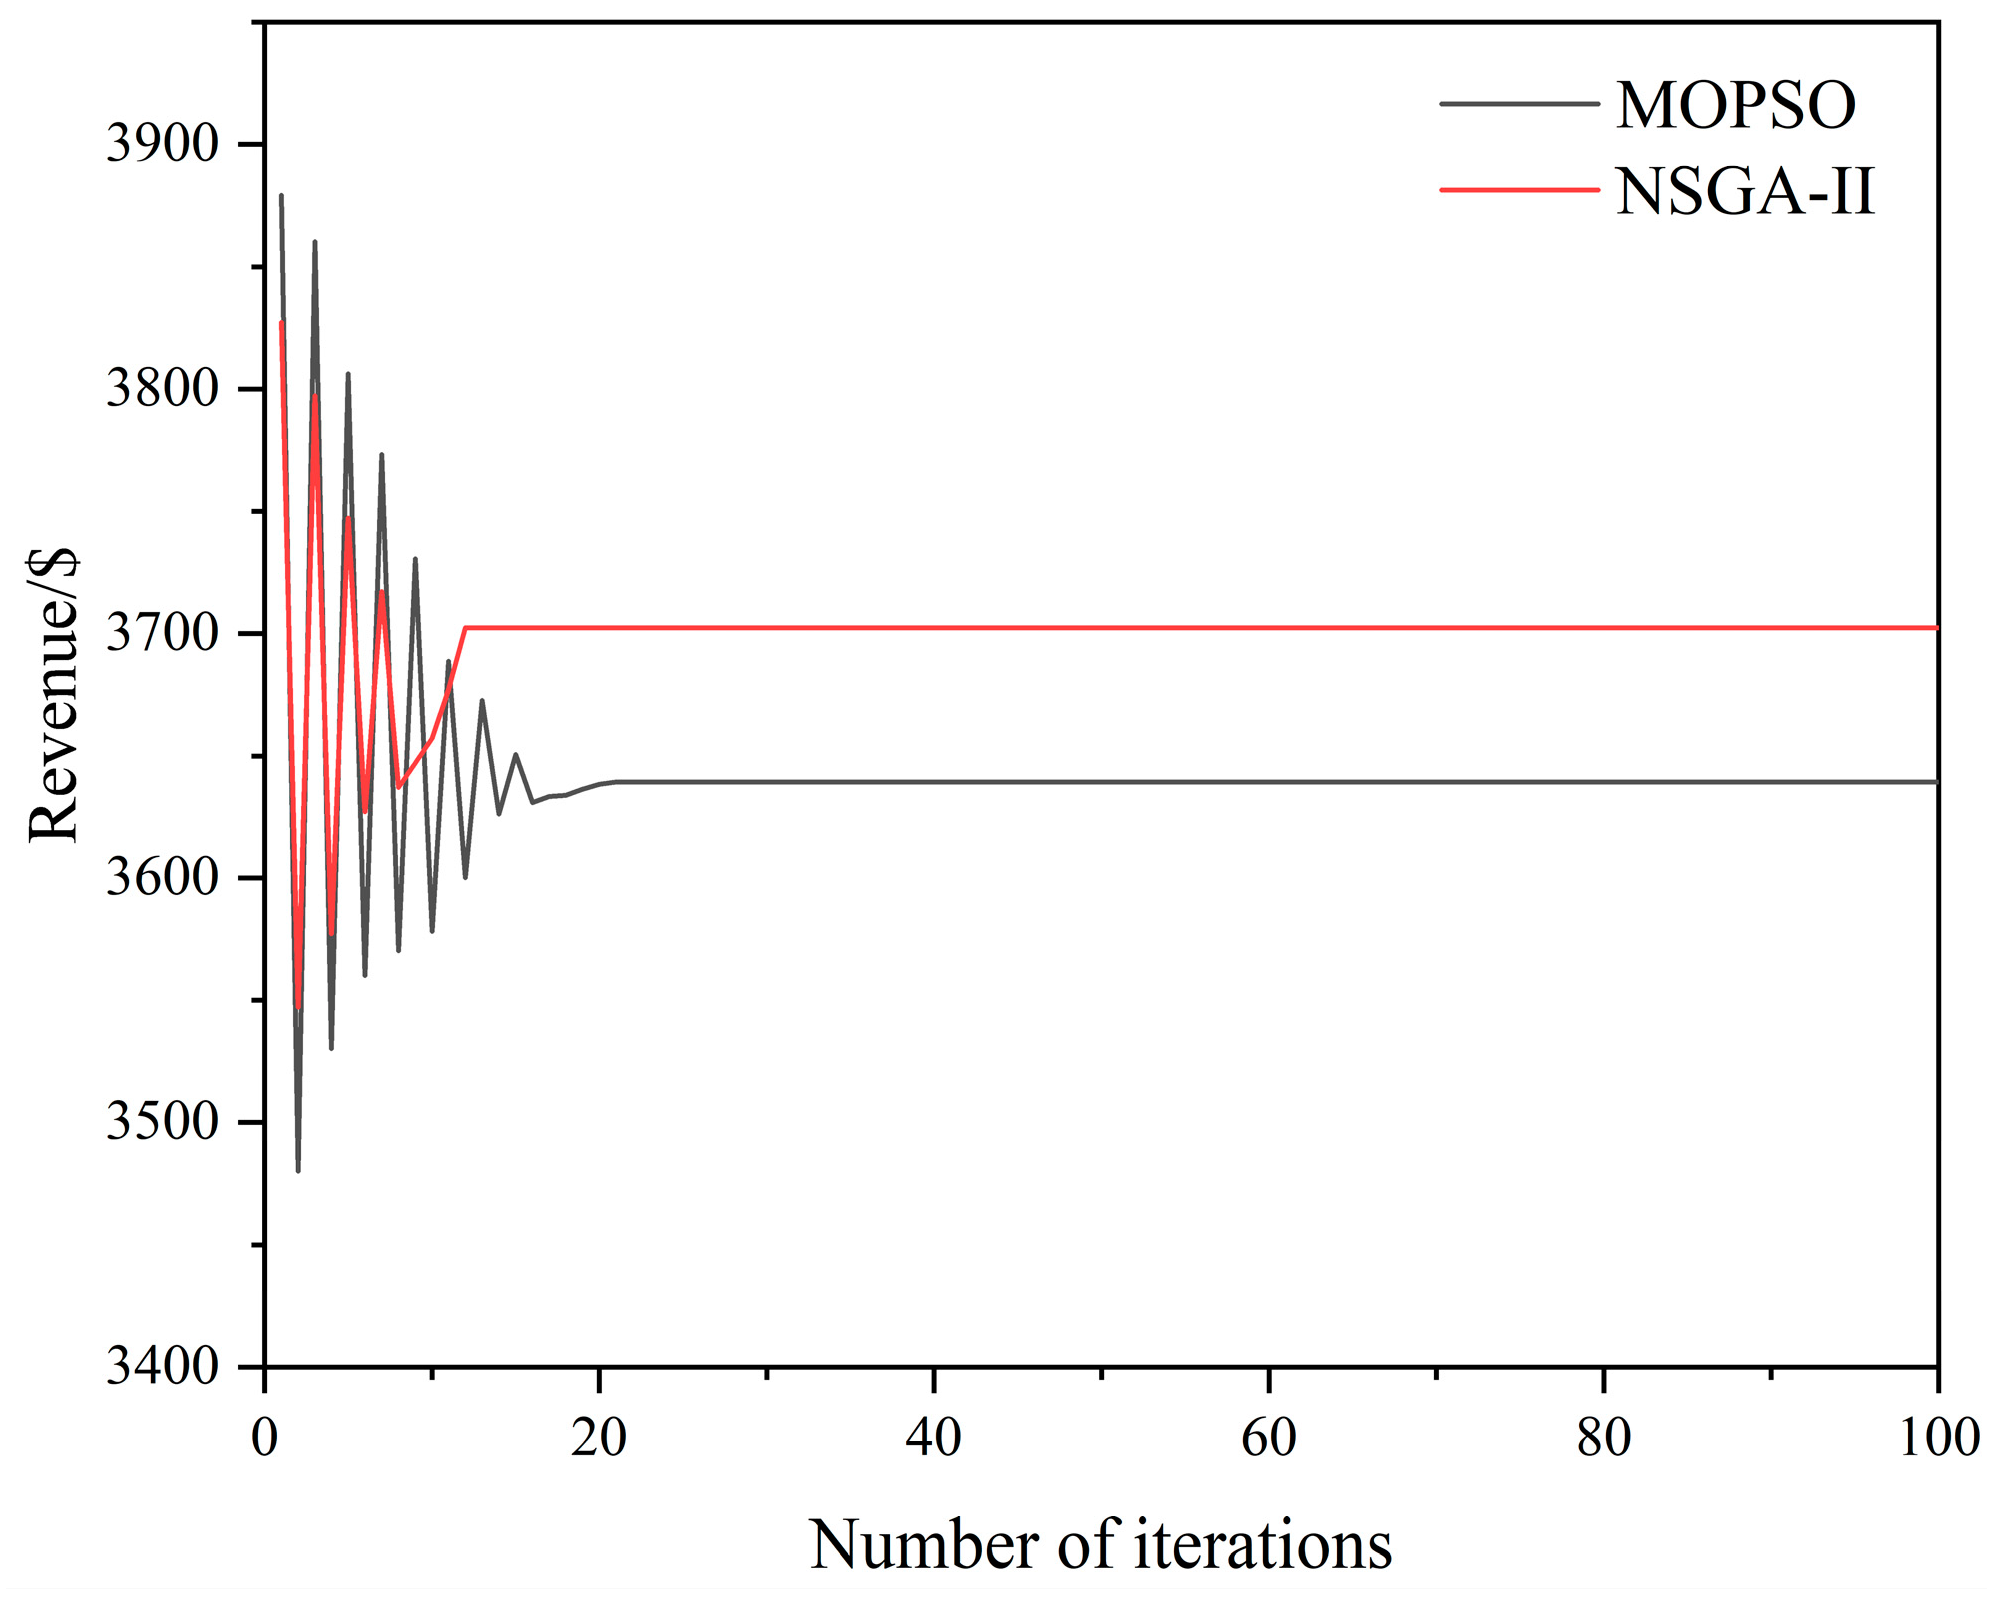
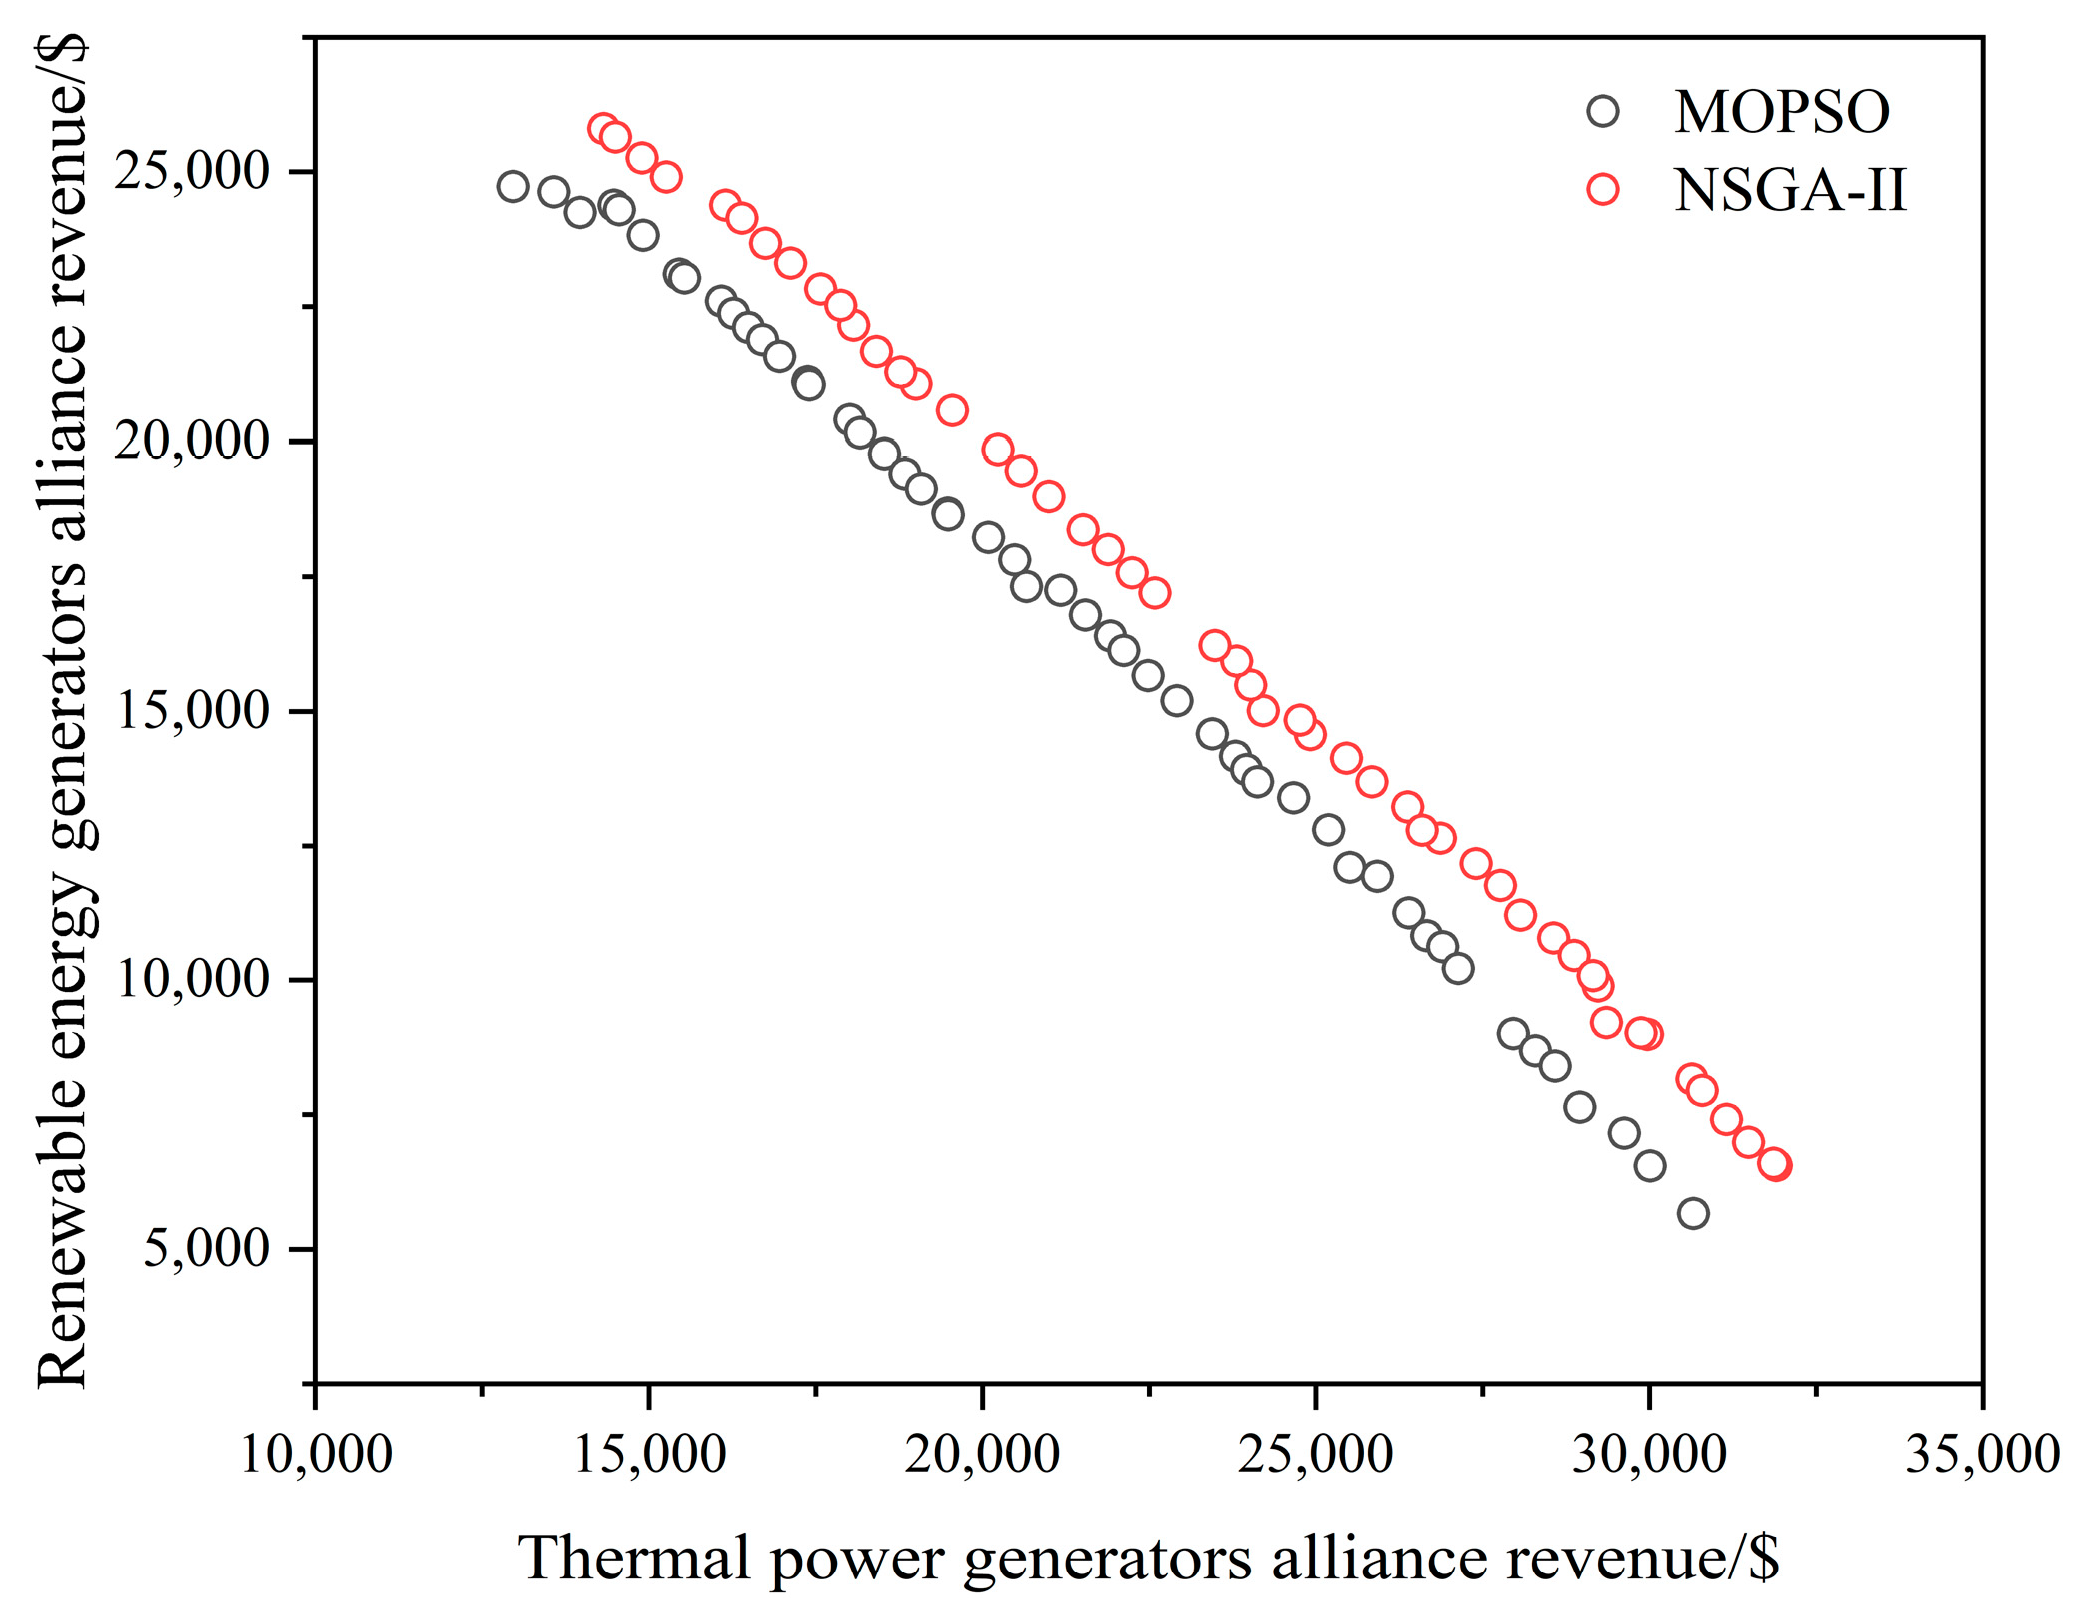
4.5. Comparison with Multi-Objective Particle Swarm Optimization Algorithm

In order to verify the optimization performance of the NSGA-II algorithm used in this study, the multi-objective particle swarm optimization algorithm (MOPSO) is used as a comparison algorithm of the equilibrium model, and the convergence speed and optimization effect are compared. The parameters of the multi-objective PSO are set as follows: the population size is 50, and the maximum number of iterations is 100. In order to analyze the solving speed of the two algorithms, the convergence of the two independent repeated operations is compared. Taking thermal power producer G1 with a quota ratio of 0.2 as an example, the change in its income with the number of iterations is shown in Figure 10.
As can be seen from Figure 10, the convergence speed of the NSGA-II algorithm is better than that of the MOPSO algorithm. When the revenue of the generator reaches a stable level, MOPSO needs to repeat 20 iterations, while NSGA-II requires only 15 iterations. In the early stage of evolution, because of the uncertainty of the search direction, the volatility is large, and the power generator constantly revises its strategy to obtain the maximum benefit. With an increase in evolutionary algebra, the income of power generators tends to be stable. When the preset maximum number of iterations is reached, the distribution of the Pareto optimal solution sets obtained by the MOPSO algorithm and NSGA-II algorithm in the target space is shown in Figure 11.
As can be seen from Figure 11, although MOPSO algorithm can also obtain a Pareto optimal solution set that is generally complete and evenly distributed, the optimization effect of the algorithm used is significantly superior to MOPSO algorithm, and the obtained extreme solutions are all better than MOPSO algorithm, further confirming its superiority. In summary, the optimization effect and convergence speed of the NSGA-II algorithm are superior to the commonly used MOPSO algorithm.

5. Conclusions

Based on the market competition equilibrium theory, this study establishes a multi-transaction entity market equilibrium model, including the green certificate trading market and electricity trading market, considering the uncertainty of renewable energy power generation and the difference between traditional power generation and renewable energy power generation cost. The NSGA-II algorithm combined with GRP is used to solve the model, which not only provides a well-distributed Pareto solution set through multi-objective optimization but also obtains the optimal compromise solution. Based on the analysis of market equilibrium results, this study focuses on the market power decision-making behavior and interaction between thermal power producers and renewable energy power producers in two markets under different quota requirements. The case study shows that:
(1)
In the process of electricity market transactions, renewable energy generators will exercise market power in two markets, and under different quota requirements, renewable energy generators will choose to exercise market power in different markets. When the quota is relatively low, renewable energy generators will choose to exercise market power by holding certificates in the green certificate market; when the quota is relatively high, renewable energy generators will exercise market power by reducing power generation in the electricity market. These strategic actions will lead to the rise of certificate prices and electricity market transaction prices. The higher the quota, the greater the market power of renewable energy generators.
(2)
For thermal power generators the increase in the price of green certificates increases the cost of power generation for thermal power generators. In response to the higher price of green certificates, thermal power generators choose to reduce their demand for certificates by reducing the electricity market generation, thereby reducing the cost of purchasing green certificates. At the same time, a reduction in electricity generation in the power market will further increase the market trading price.
(3)
The improvement of the prediction accuracy of renewable energy means a reduction in the power generation cost of renewable energy generators, which can effectively reduce the transaction price of the two markets and ease the market power behavior of power generators. Renewable energy generators with relatively low power generation costs are more inclined to earn higher returns by selling more electricity in the power market, which has a positive effect on easing the market power of renewable energy generators. By introducing the Lerner index, we can intuitively quantify and verify the market power decision-making behavior of each power producer in the two markets.

Author Contributions

Conceptualization, J.W.; methodology, J.W. and R.J.; software, X.G., G.C. and J.D.; data curation, W.L. and P.L.; validation, R.J.; writing–original draft, J.W.; writing–review and editing, J.W. and R.J.; resources, R.J. and G.C.; supervision, R.J. and J.D.; funding acquisition, R.J. and J.D. All authors have read and agreed to the published version of the manuscript.

Funding

This work was partly supported by a Research Grant from the National Natural Science Foundation of China (Grant No. 52009106) and the Special Scientific Research Plan of Shaanxi Provincial Department of Education (Grant No. 22JK0473).

Institutional Review Board Statement

Not applicable.

Informed Consent Statement

Not applicable.

Data Availability Statement

Not applicable.

Conflicts of Interest

The authors declare no conflict of interest.

Abbreviations

AbbreviationMeaning
RPSRenewable portfolio standard
TGCTradable green certificates
NSGA-IINondominated sorting genetic algorithm II
GRPGrey relational projection
P s Electricity market transaction price
A , B Constants greater than 0
Q Total demand in the electricity market
α j , β j Intercept and slope of the supply function, respectively
Q j T G C Number of green certificates sold by the j-th renewable energy generator
p c Price of green certificates
σ l Standard deviation of the load forecast error
R l Load reserve of the system
Δ P l Load prediction error
Δ P w i n d Renewable energy generation forecast error
σ w i n d Standard deviation of the renewable energy generation forecast error
b Scale parameter
a 1 , a 2 Proportional coefficient
k W Kurtosis
f 2 Probability density function of the normal distribution
R d e m a n d Reserve capacity that the renewable energy generator needs to configure
f T e r m a l , i , f R e n e w a b l e , j i-th thermal power generator and the j-th renewable energy generator
C T e r m a l , i , C R e n e w a b l e , j the power generation cost of the i-th thermal power generator and the j-th renewable energy generator
C R L , i Fuel cost of the i-th thermal power generator
q i , q j Power generation of the i-th thermal power generator and the j-th renewable energy generator
a i , b j , c j Fuel cost coefficients of the i-th thermal power generator
C M E , i , C M E , j Maintenance cost of the i-th thermal power generator and the j-th renewable energy generator
K m e , i , K m e , j Equipment maintenance coefficient of the i-th thermal power generator and the j-th renewable energy generator
C Z J , i , C Z J , j Equipment depreciation cost of the i-th thermal power generator and the j-th renewable energy generator
C a z , i , C a z , j Installation cost of the i-th thermal power generator and the j-th renewable energy generator
f i , f j Installation volume coefficient of the i-th thermal power generator and the j-th renewable energy generator
k i , k j Operating life period of the device of the i-th thermal power generator and the j-th renewable energy generator
r Annual interest rate
C D E , j Reserve cost of the j-th renewable energy generator
m j , n j Reserve capacity coefficient
V l Projection value
N g Number of indicators
γ l k Gray correlation coefficient
w G , k Weight of each indicator
d l Priority membership

References

  1. Zhang, J.H.; Gao, R.; Xu, N.H.; Xie, C.P. How Can China Achieve Its Non-fossil Energy Target? An Effective Allocation of China’s Renewable Electricity Consumption Obligation. Front. Energy Res. 2020, 8, 103. [Google Scholar] [CrossRef]
  2. Jiang, Y.C.; Cao, H.X.; Yang, L.; Fei, F.; Li, J.; Lin, Z.M. Mechanism Design and Impact Analysis of Renewable Portfolio Standard. Autom. Electr. Power Syst. 2020, 44, 187–199. [Google Scholar]
  3. Xiao, Y.P.; Wang, X.F.; Wang, X.L.; Bie, Z.H. Review on Electricity Market Towards High Proportion of Renewable Energy. Proc. CSEE 2018, 38, 663–674. [Google Scholar]
  4. Zhao, X.G.; Zuo, Y.; Wang, H.; Wang, Z. How can the cost and effectiveness of renewable portfolio standards be coordinated? Incentive mechanism design from the coevolution perspective. Renew. Sustain. Energy Rev. 2022, 158, 112096. [Google Scholar]
  5. Tan, Q.L.; Ding, Y.H.; Zheng, J.; Dai, M.; Zhang, Y.M. The effects of carbon emissions trading and renewable portfolio standards on the integrated wind-photovoltaic-thermal power-dispatching system: Real case studies in China. Energy 2021, 222, 119927. [Google Scholar] [CrossRef]
  6. Jordaan, S.M.; Park, J.Y.; Rangarajan, S. Innovation in intermittent electricity and stationary energy storage in the United States and Canada: A review. Renew. Sustain. Energy Rev. 2022, 158, 112149. [Google Scholar] [CrossRef]
  7. Zhao, X.G.; Liang, J.; Ren, L.Z.; Zhang, Y.Z.; Xu, J.Y. Top-Level Institutional Design for Energy Low-Carbon Transition: Renewable Portfolio Standards. Power Syst. Technol. 2018, 42, 1164–1169. [Google Scholar]
  8. Zhang, L.B.; Chen, C.Q.; Wang, Q.W.; Zhou, D.Q. The impact of feed-in tariff reduction and renewable portfolio standard on the development of distributed photovoltaic generation in China. Energy 2021, 232, 120933. [Google Scholar] [CrossRef]
  9. Chen, C.; Zhu, Y.; Zeng, X.T.; Huang, G.H.; Li, Y.P. Analyzing the carbon mitigation potential of tradable green certificates based on a TGC-FFSRO model: A case study in the Beijing-Tianjin-Hebei region, China. Sci. Total Environ. 2018, 630, 469–486. [Google Scholar] [CrossRef]
  10. Chen, X.L.; Wang, X.L.; Lyu, J.H.; Zhang, H.; Zhu, Z.Y.; Wang, Y.F. Optimal Operation Model of Two-level Electricity Market Under the Responsibility of Renewable Energy Consumption. J. Glob. Energy Interconnect. 2020, 3, 430–440. [Google Scholar]
  11. Dai, T.; Qiao, W. Finding Equilibria in the Pool-Based Electricity Market with Strategic Wind Power Producers and Network Constraints. IEEE Trans. Power Syst. 2017, 32, 389–399. [Google Scholar] [CrossRef]
  12. Song, X.H.; Han, J.J.; Zhang, L.; Zhao, C.P.; Wang, P.; Liu, X.Y.; Li, Q.C. Impacts of renewable portfolio standards on multi-market coupling trading of renewable energy in China: A scenario-based system dynamics model. Energy Policy 2021, 159, 112647. [Google Scholar] [CrossRef]
  13. Guo, H.Y.; Chen, Q.X.; Xia, Q.; Kang, C.Q. Modeling Strategic Behaviors of Renewable Energy with Joint Consideration on Energy and Tradable Green Certificate Markets. IEEE Trans. Power. Syst. 2020, 35, 1898–1910. [Google Scholar] [CrossRef]
  14. Fang, Y.J.; Wei, W.; Mei, S.W. How dynamic renewable portfolio standards impact the diffusion of renewable energy in China? A networked evolutionary game analysis. Renew Energy. 2022, 193, 778–788. [Google Scholar] [CrossRef]
  15. Chen, S.; Wei, Z.N.; Sun, G.Q.; Zhou, Y.Z. Strategic Investment in Power and Heat Markets: A Nash-Cournot Equilibrium Model. IEEE Trans. Industr. Inform. 2022, 18, 6057–6067. [Google Scholar] [CrossRef]
  16. Xiao, Y.P.; Wang, X.F.; Wang, X.L.; Dang, C.; Lu, M. Behavior analysis of wind power producer in electricity market. Appl. Energy 2016, 171, 325–335. [Google Scholar] [CrossRef]
  17. Xiao, Y.P.; Wang, X.F.; Wang, X.L.; Dang, C.; Lu, M. The Effect of Prosumer Duality on Power Market: Evidence from the Cournot Model. IEEE Trans. Power. Syst. 2023, 38, 692–701. [Google Scholar]
  18. Sun, G.Q.; Wang, R.; Chen, S.; Wu, C.; Wei, Z.N.; Zang, H.X. Nash-Cournot power market model with a high penetration of prosumers: A distributionally robust optimization approach. J. Clean. Prod. 2022, 353, 131565. [Google Scholar] [CrossRef]
  19. Yuan, G.L.; Liu, P.D.; Jia, X.C.; Dong, J.F.; Fang, F. Economic optimal scheduling considering tradable green certificate system. Acta Energiae Solaris Sinica. 2021, 42, 139–146. [Google Scholar]
  20. Li, L.; Tan, Z.F.; Zhang, E.Y. Research on market power in the implementation of renewable portfolio standard. Power Syst. Prot. Control 2014, 42, 106–112. [Google Scholar]
  21. Lu, Z.L.; Sun, S.J.; Tang, Z.Q.; Wei, Q. Optimal scheduling of plus and minus spinning reserve in microgrid based on sequence operation theory. Power Syst. Prot. Control 2017, 45, 100–109. [Google Scholar]
  22. Shao, L.Z.; Liu, R.H.; Wang, H.B.; Liu, Y.F.; Ye, L.; Yao, J.G. A method for cost allocation of reserve based on conditional value at risk. Power Syst. Prot. Control 2018, 46, 23–30. [Google Scholar]
  23. Xiao, Y.; Xie, J.; Liu, R.P.; Li, Y.H. A new calculation method of reserve capacity considering wind power forecasting error. Power Syst. Prot. Control 2019, 47, 78–85. [Google Scholar]
  24. Zhou, Y.J.; Hua, Q.S.; Liu, P.; Sun, L. Multi-objective optimal droop control of solid oxide fuel cell based integrated energy system. Int. J. Hydrog. Energy 2023, 48, 11382–11389. [Google Scholar] [CrossRef]
  25. Li, C.T.; Xu, C.B.; Li, X.M. A multi-criteria decision-making framework for site selection of distributed PV power stations along high-speed railway. J. Clean. Prod. 2020, 277, 124086. [Google Scholar] [CrossRef]
  26. Li, Z.M.; Xu, Y.; Fang, S.D.; Wang, Y.; Zheng, X.D. Multiobjective Coordinated Energy Dispatch and Voyage Scheduling for a Multienergy Ship Microgrid. IEEE Trans. Appl. Ind. 2020, 56, 989–999. [Google Scholar] [CrossRef]
Figure 1. Green certificate transaction mode.
Processes 11 03008 g001
Figure 2. Overall solution framework.
Processes 11 03008 g002
Figure 3. The model-solving process using the NSGA-II algorithm.
Processes 11 03008 g003
Figure 4. Pareto solution distribution when the quota ratio ranges from 0.1 to 0.6.
Processes 11 03008 g004
Figure 5. The impact of quota changes on the power generation of every power generator.
Processes 11 03008 g005
Figure 6. The impact of quota changes on the actual number of trading certificates and the number of tradable certificates in the market.
Processes 11 03008 g006
Figure 7. The impact of quota changes on electricity market transaction prices and green certificate market transaction prices.
Processes 11 03008 g007
Figure 8. The impact of renewable energy forecast errors on the power generation of G1 when the quota ratio ranges from 0.1 to 0.6.
Processes 11 03008 g008
Figure 9. The impact of renewable energy forecast errors on the power generation of G5 and when the quota ratio ranges from 0.1 to 0.6.
Processes 11 03008 g009
Figure 10. G1 revenue of the generator in the iteration process when the quota ratio is 0.2.
Processes 11 03008 g010
Figure 11. Distribution of Pareto solution sets obtained by different algorithms.
Processes 11 03008 g011
Table 1. Parameter settings.
ParameterG1G2G3G4G5G6
qmax280 MW310 MW320 MW330 MW300 MW350 MW
qmin30 MW30 MW30 MW30 MW100 MW100 MW
a0.0820.0760.0730.061--
b25.26523.58823.09723.971--
c96.395.195.394.9--
Table 2. Optimal compromise solutions for multi-objective optimization problems.
Quota RatioThermal Power Generators Alliance Revenue/$Renewable Energy Generators Alliance Revenue/$Priority Membership
10%29,932.927927.110.835
20%25,822.2213,092.610.865
30%18,942.5520,016.520.834
40%10,682.5930,898.270.872
50%8779.8734,858.330.872
60%7957.8036,142.830.828
Table 3. The impact of quota changes on the Lerner index of G1 and G5.
Quota Ratio10%20%30%40%50%60%
G10.4920.5290.5510.5990.6100.673
G50.2930.5280.6790.7640.8130.866
Table 4. The impact of the forecast accuracy of renewable energy on the Lerner index of G1 and G5 when the quota ratio ranges from 0.1 to 0.6.
Quota Ratio10%20%30%40%50%60%
G10.10.4620.5040.5210.5390.5500.586
0.150.4890.5120.5320.5650.5820.604
0.20.4920.5290.5510.5990.6100.673
G50.10.2450.4210.5960.6330.6350.709
0.150.2620.4440.6310.6990.7100.795
0.20.2930.5280.6790.7640.8130.866
Disclaimer/Publisher’s Note: The statements, opinions and data contained in all publications are solely those of the individual author(s) and contributor(s) and not of MDPI and/or the editor(s). MDPI and/or the editor(s) disclaim responsibility for any injury to people or property resulting from any ideas, methods, instructions or products referred to in the content.

