Article

Real-World Pipe-Out Emissions from Gasoline Direct Injection Passenger Cars

School of Mechanical Engineering, Beijing Institute of Technology, Beijing 100081, China
*
Author to whom correspondence should be addressed.
Processes 2023, 11(1), 66; https://doi.org/10.3390/pr11010066
Submission received: 1 December 2022 / Revised: 20 December 2022 / Accepted: 24 December 2022 / Published: 27 December 2022
(This article belongs to the Section Energy Systems)

Abstract

:
The analysis of real-world emissions is necessary to reduce the emissions of vehicles during on-road driving. In this paper, the matrix of gasoline direct injection passenger cars is applied to analyze the real-world emissions. The results show that high acceleration and high speed conditions are major conditions for the particulate number emissions, and the particulate number emissions are positively correlated with torque and throttle opening. The catalyst temperature and saturation are important factors that affect nitrogen oxide emission. The nitrogen oxide emissions of low speed and low torque conditions cannot be ignored in real-world driving. The carbon dioxide emissions are positively correlated with acceleration, torque and throttle opening. Once the vehicles are in the acceleration condition, the carbon dioxide emissions increase rapidly. The vehicles with higher average emission factors are more susceptible to driving behaviors, and the differences in the emission factors are more obvious, leading to an increase in the difficulty of emission control.

1. Introduction

In recent years, there has been a growing focus on air pollution, including particulate matter (PM) and gaseous emissions [1]. PM is one of the main causes for smog, and gaseous pollutants such as carbon monoxide (CO), hydrocarbons (HC) and nitrogen oxides (NOx) seriously endanger human health [2]. Additionally, carbon dioxide (CO2) emissions contribute to global warming and rising sea levels, which threaten the human living environment [3]. Exhaust emissions from on-road vehicles are the main factor behind the mentioned types of air pollution [4,5]. Strict emission regulations and testing procedures are legislated to reduce exhaust emissions [6].
The gasoline direct injection (GDI) vehicles are favored by commuters because of their high thermal efficiency and power density [7]. GDI vehicles accounted for more than two thirds of new cars in the European market [8]. However, the NOx and particulate number (PN) emissions are higher than in Port Fuel Injection (PFI) vehicles. Rich fuel-air mixtures in local regions and the wet wall phenomenon in the combustion chamber are conducive to PN formation; in addition, a high combustion temperature and high oxygen concentration lead to NOx emissions [9]. It is demonstrated that [10] cold start and transient operations account for a large proportion of the PN emissions of GDI vehicles. It is reported that the PN emissions of GDI vehicles are one order of magnitude higher than in PFI vehicles and diesel vehicles equipped with a diesel particulate filter (DPF) [11]. Most of the particles emitted by GDI vehicles are smaller than 100 nm, which can easily penetrate into the human respiratory system [12]. Therefore, the PN emissions of GDI vehicles should be paid much more attention [13]. Regarding NOx emissions, cold start and warm-up events are the main sources in on-road vehicles because of the low efficiency in NOx removal of the after-treatment system.
The type approval emissions of regulated gaseous pollutants (CO, HC, NOx) in Euro 6 regulations are at a lower level, and particle emissions in both mass and number are also limited for GDI vehicles. Currently, the CO2 emissions of on-road vehicles are also regulated [14]. On-road vehicles are tested under the type approval cycles, such as the NEDC (New European Driving Cycle) and WLTC (Worldwide Light-duty Test Cycle), to ensure their low exhaust emissions [15]. In order to meet the requirements of emission regulations, a three-way catalytic converter (TWC) and gasoline particulate filter (GPF) are used to reduce HC, CO, NOx and PN emissions from GDI vehicles [16]. The percentage reduction in PN emissions from GDI vehicles is 60–90% by GPF [17], and the PN emissions of GDI vehicles with GPF are reported to be lower than 9.5 × 10¹¹ #/km under specific conditions [18]. However, the complexity of real-world driving conditions, such as the driving behavior, road type, traffic conditions, etc., lead to real-world driving emissions being much higher than the type approval emissions [19].
Driving behavior refers to the driving conditions induced by the driver habits, such as acceleration, vehicle speed, start-stop events, and gearshift strategies [20]. Driving behaviors in real-world conditions are complex [21], and aggressive driving behavior can lead to a sharp increase in NOx, CO2 and PN emissions. Gao et al. [22] reported that the NOx emissions of GDI vehicles were more sensitive to acceleration than speed; meanwhile, more NOx was emitted at low speed and high acceleration conditions. Huang et al. [23] found that aggressive driving behavior significantly increased the NOx (from 22 mg/km to 27 mg/km), PN (from 1.2 × 10¹¹ #/km to 2.7 × 10¹¹ #/km) and CO2 emissions (from 177.1 g/km to 215.2 g/km) of GDI vehicles on urban roads; in the meantime, the emission factors on urban roads were higher than on rural roads, which were followed by those of motorways. Yang et al. [24] concluded that the PN emissions of GDI vehicles were increased significantly by frequent acceleration events, and the peak PN concentration reached up to 4.0 × 10⁷ #/cm3. Kontes et al. [25] also pointed out that the PN emissions of GDI vehicles accounted for the largest proportion over urban roads. Momenimovahed [26] found that the increase in the traction power of GDI vehicles promoted an increase in PN emissions in real-world driving. The start-stop events are also important factors of the exhaust emissions [27]. Wang et al. [28] demonstrated that GDI vehicles emitted large amounts of NOx during the warm-up period, which reached 85.39% of the total NOx emission. Chen et al. [29] indicated that the particle emissions of GDI vehicles accounted for more than 50% of the total particle emissions in the NEDC driving cycle under cold start conditions. Myung et al. [30] revealed that driving modes lead to differences in the CO2 and PN emissions of GDI vehicles in real-world driving.
In summary, the exhaust emissions of GDI vehicles in real-world driving have been widely investigated. However, there are few studies on the relationships between exhaust emissions and engine-vehicle related parameters being reported for GDI vehicles under real-world driving conditions, because the changes in engine-vehicle-related parameters are manifestations of the driving behavior. In addition, the effect of the differences between drivers is rarely explored. In this paper, the matrix of sixteen drivers and three different types of GDI vehicles is tested in real-world driving, and the influence of driver behavior on NOx, CO2 and PN emissions is analyzed. In addition, the emission factors of each vehicle are analyzed to discuss the difference between drivers. This paper provides evidence for the control of real-world exhaust emissions.

2. Experimental Section

In this work, three GDI vehicles were used to perform the real-world emission test in China. The specifications of the three GDI vehicles are shown in Table 1. The emission standards for the Golf, Peugeot-2008 and Focus are Euro-6a, Euro-6d and Euro-6c respectively. The type approval emissions of the Golf are authorized under the NEDC, and the Peugeot and Focus are under the WLTC. The Peugeot was equipped with a GPF in order to meet the PN requirements of regulations. Due to the protection of the experimental data, the vehicle specifications in tables are replaced by similar types, while the test results are unchanged. It does not have any impact on the analysis.
In this study, three GDI vehicles were tested for emissions on real-world roads, and the test route included rural roads, urban roads, and motorways, corresponding to approximately 77%, 16%, and 7% of the total distance, which can reflect the differences between real roads. Sixteen drivers are included in the real-driving test. Each driver finished two tests along the given route with each vehicle. This means that each driver totally contributed six tests. In real-world driving, a state-of-the-art particle, PEMS (AVL M.O.V.E PEMS), and a gas PEMS were used to measure the instantaneous PN, NOx, and CO2 emissions from the three GDI vehicles recorded in the test, and the test scheme is shown in Figure 1. Finally, the relationships between driving behavior, vehicle operating parameters and real-world road emissions are analyzed. In order to avoid the impacts of high-volatility organic compounds and water vapor on particle monitoring, the petrol vehicles were fully warmed up and the system was calibrated before the test. For all the test events, no congestion was observed. The time of all test events was similar to ensure the similarity of the traffic conditions.

3. Results and Discussions

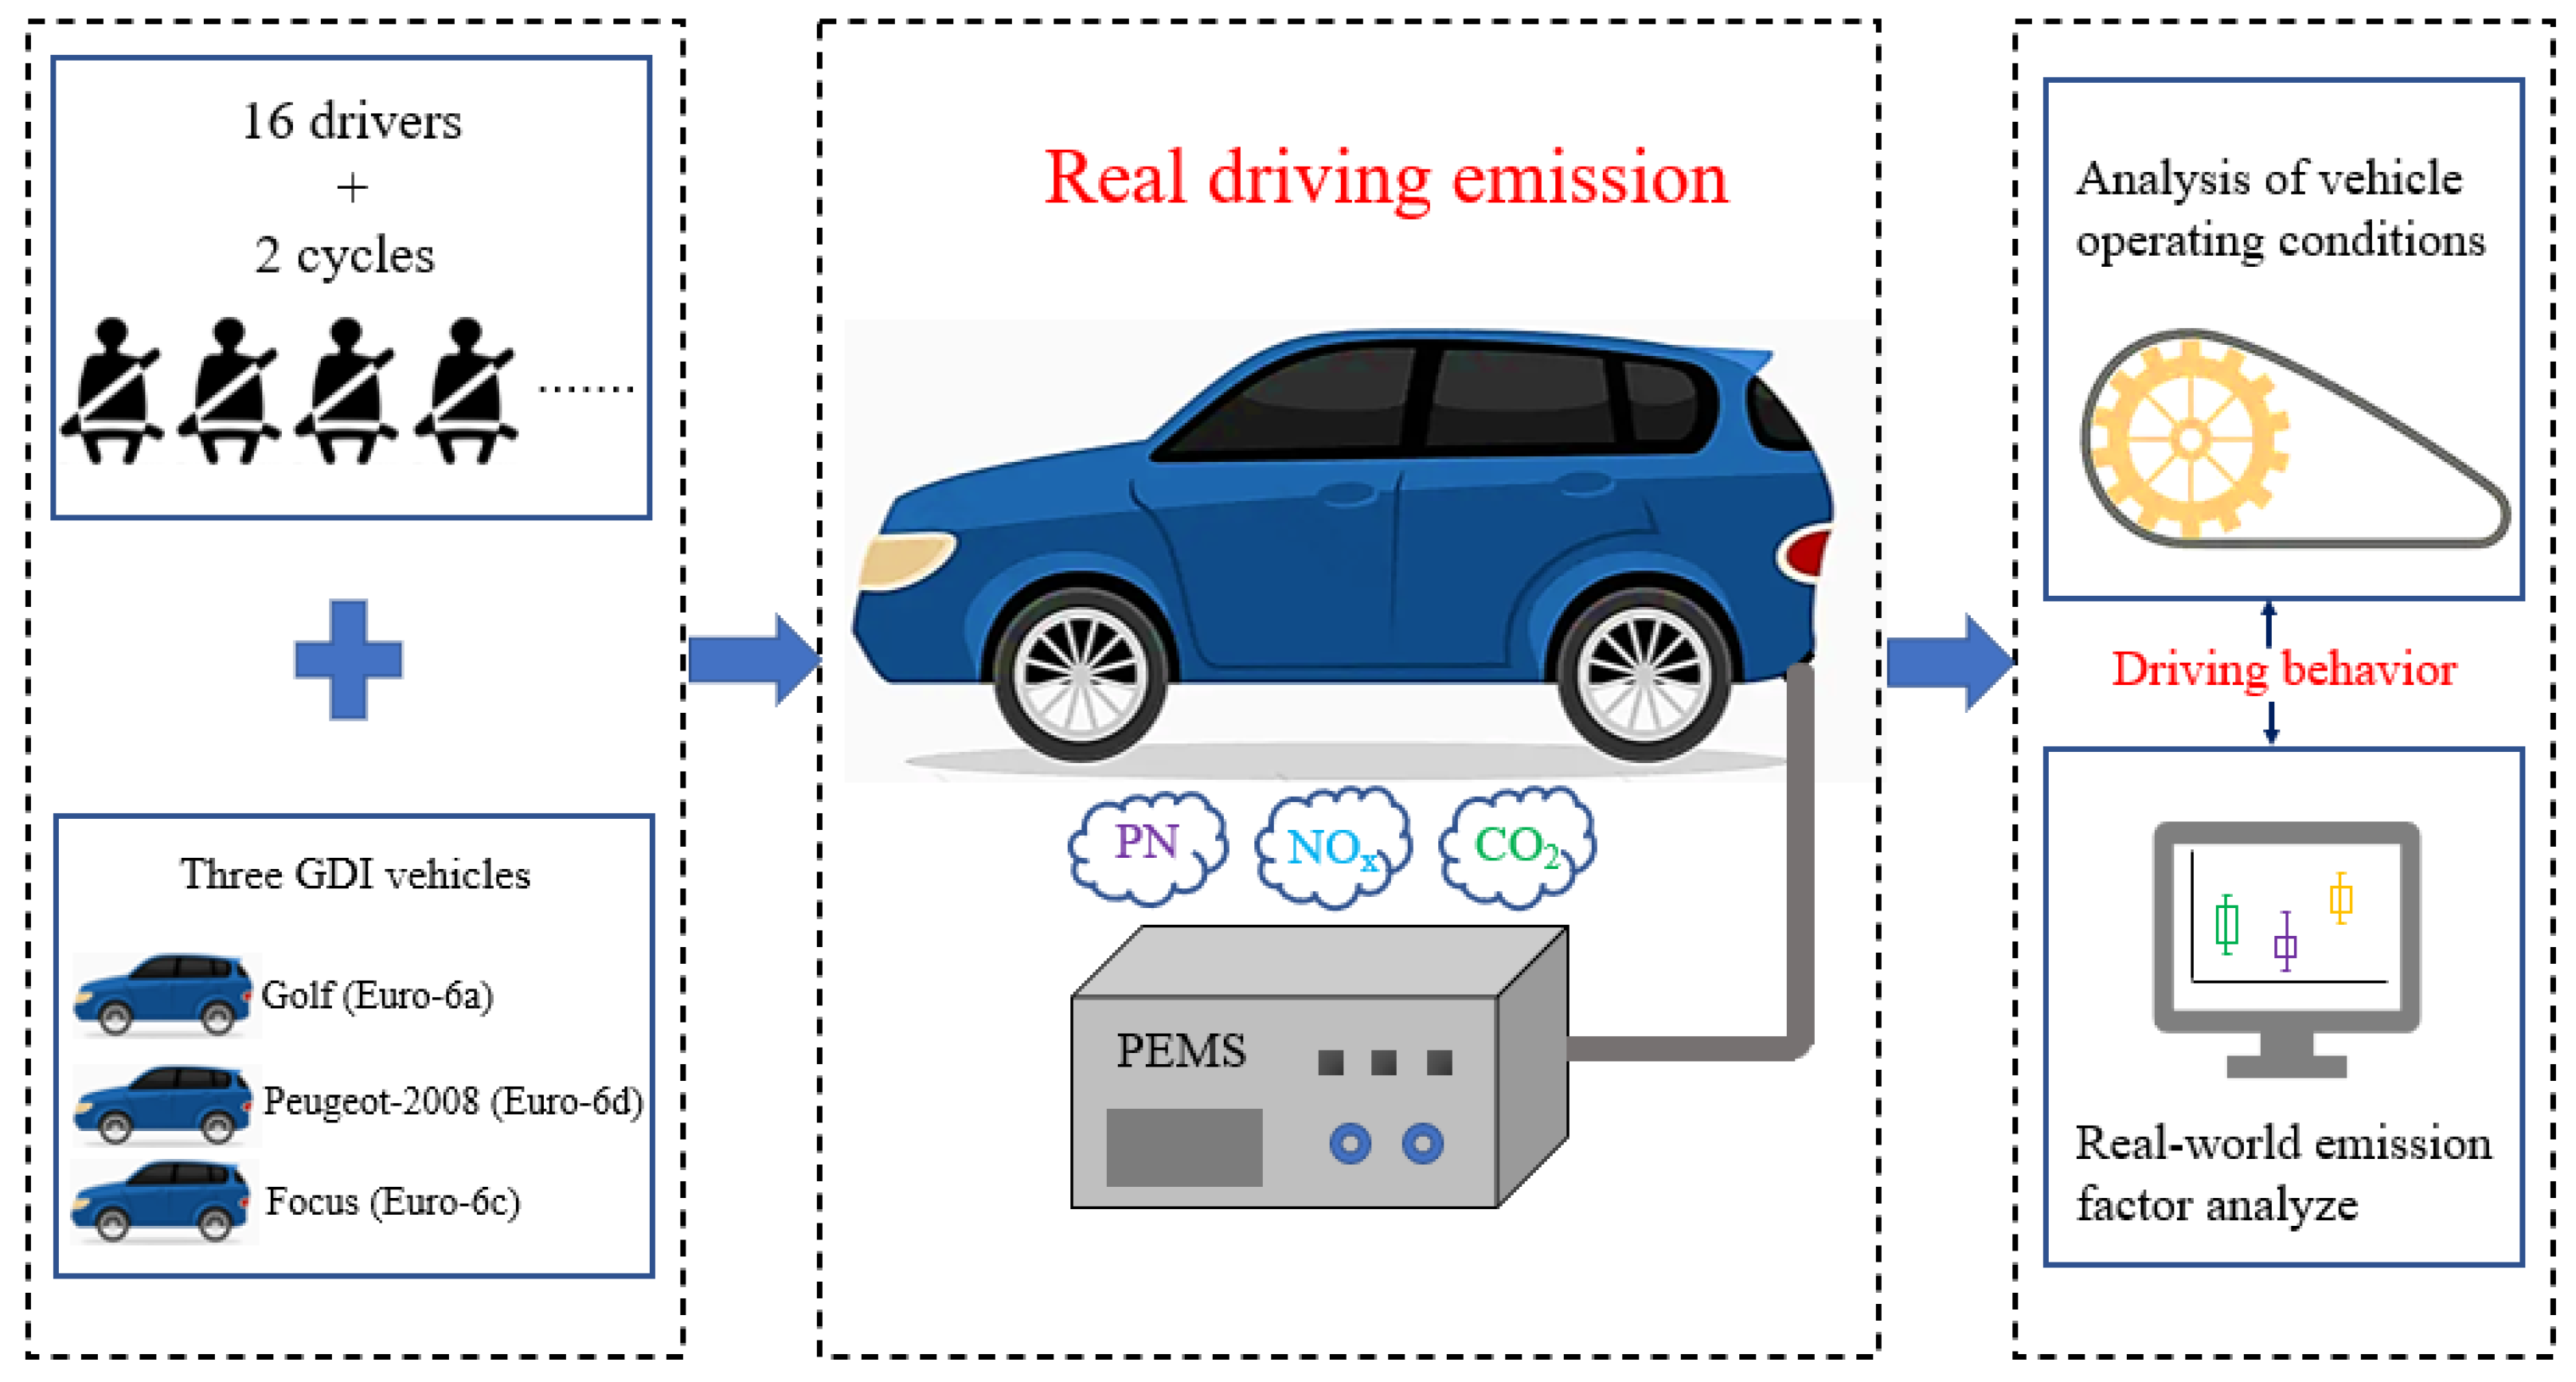
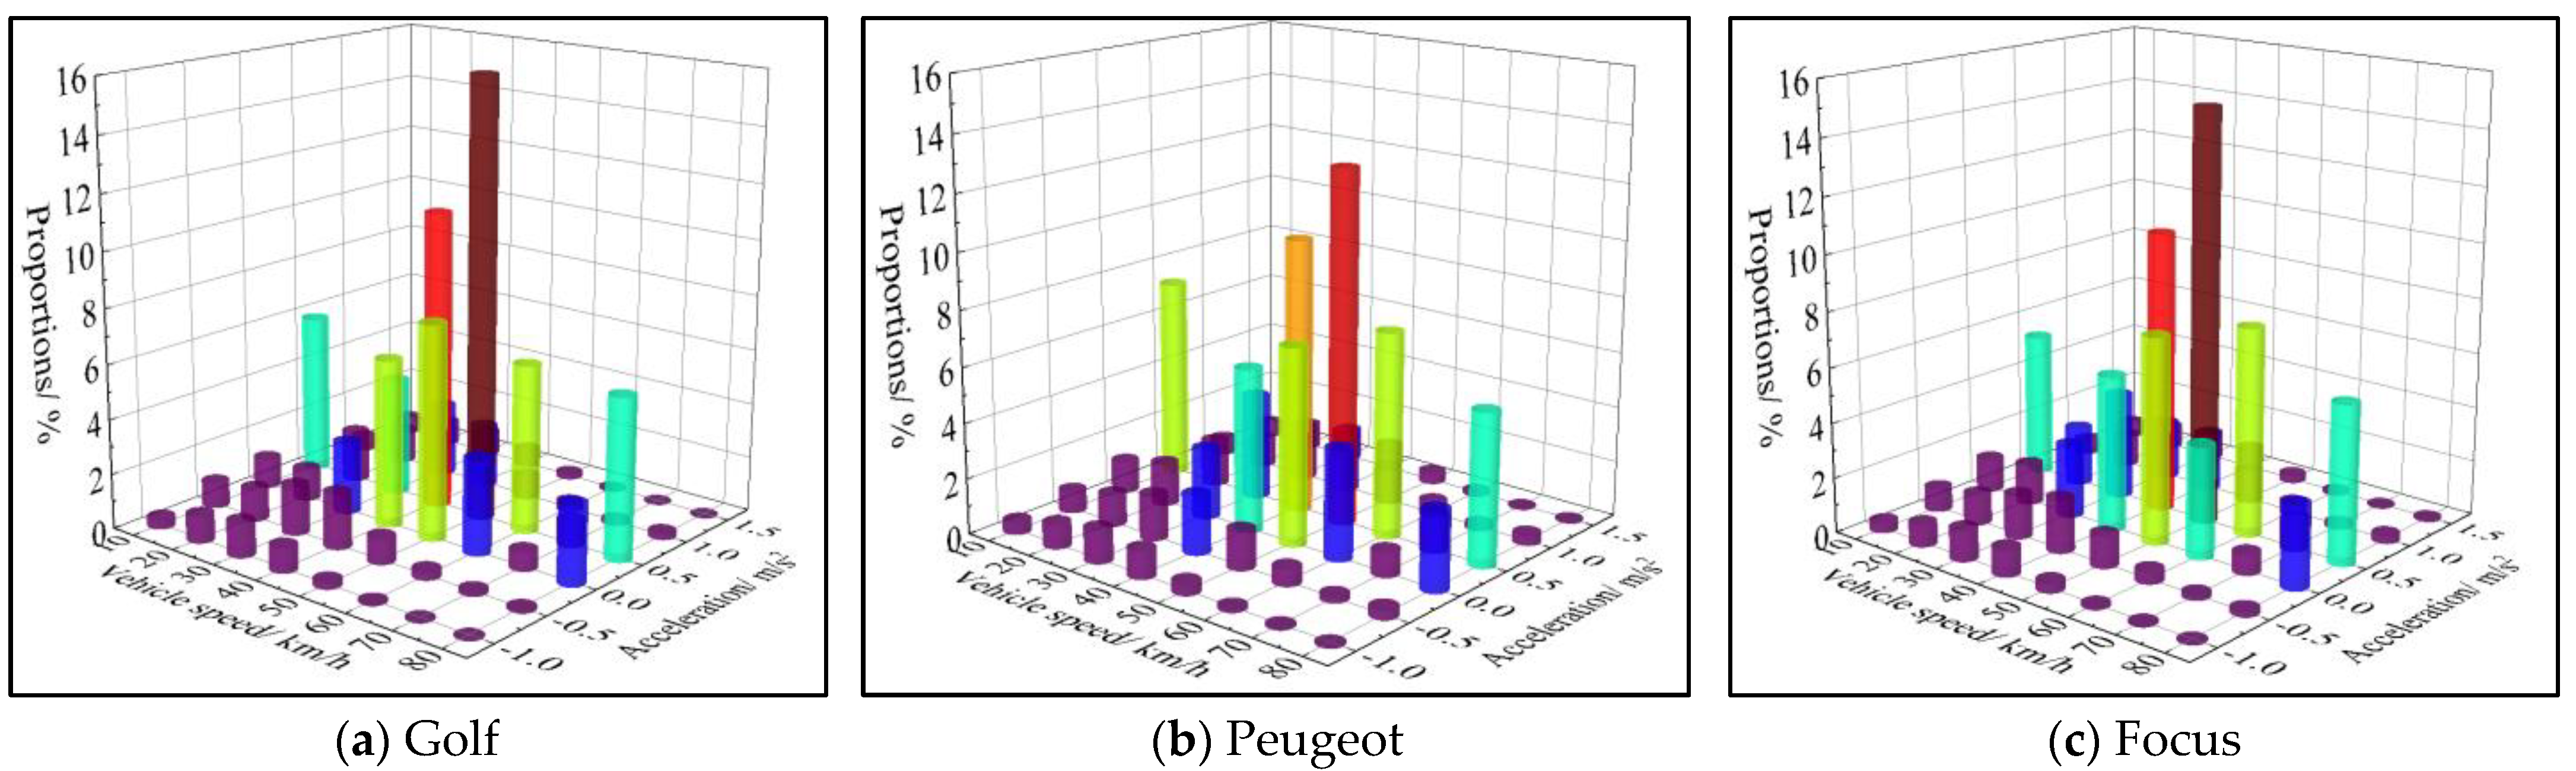
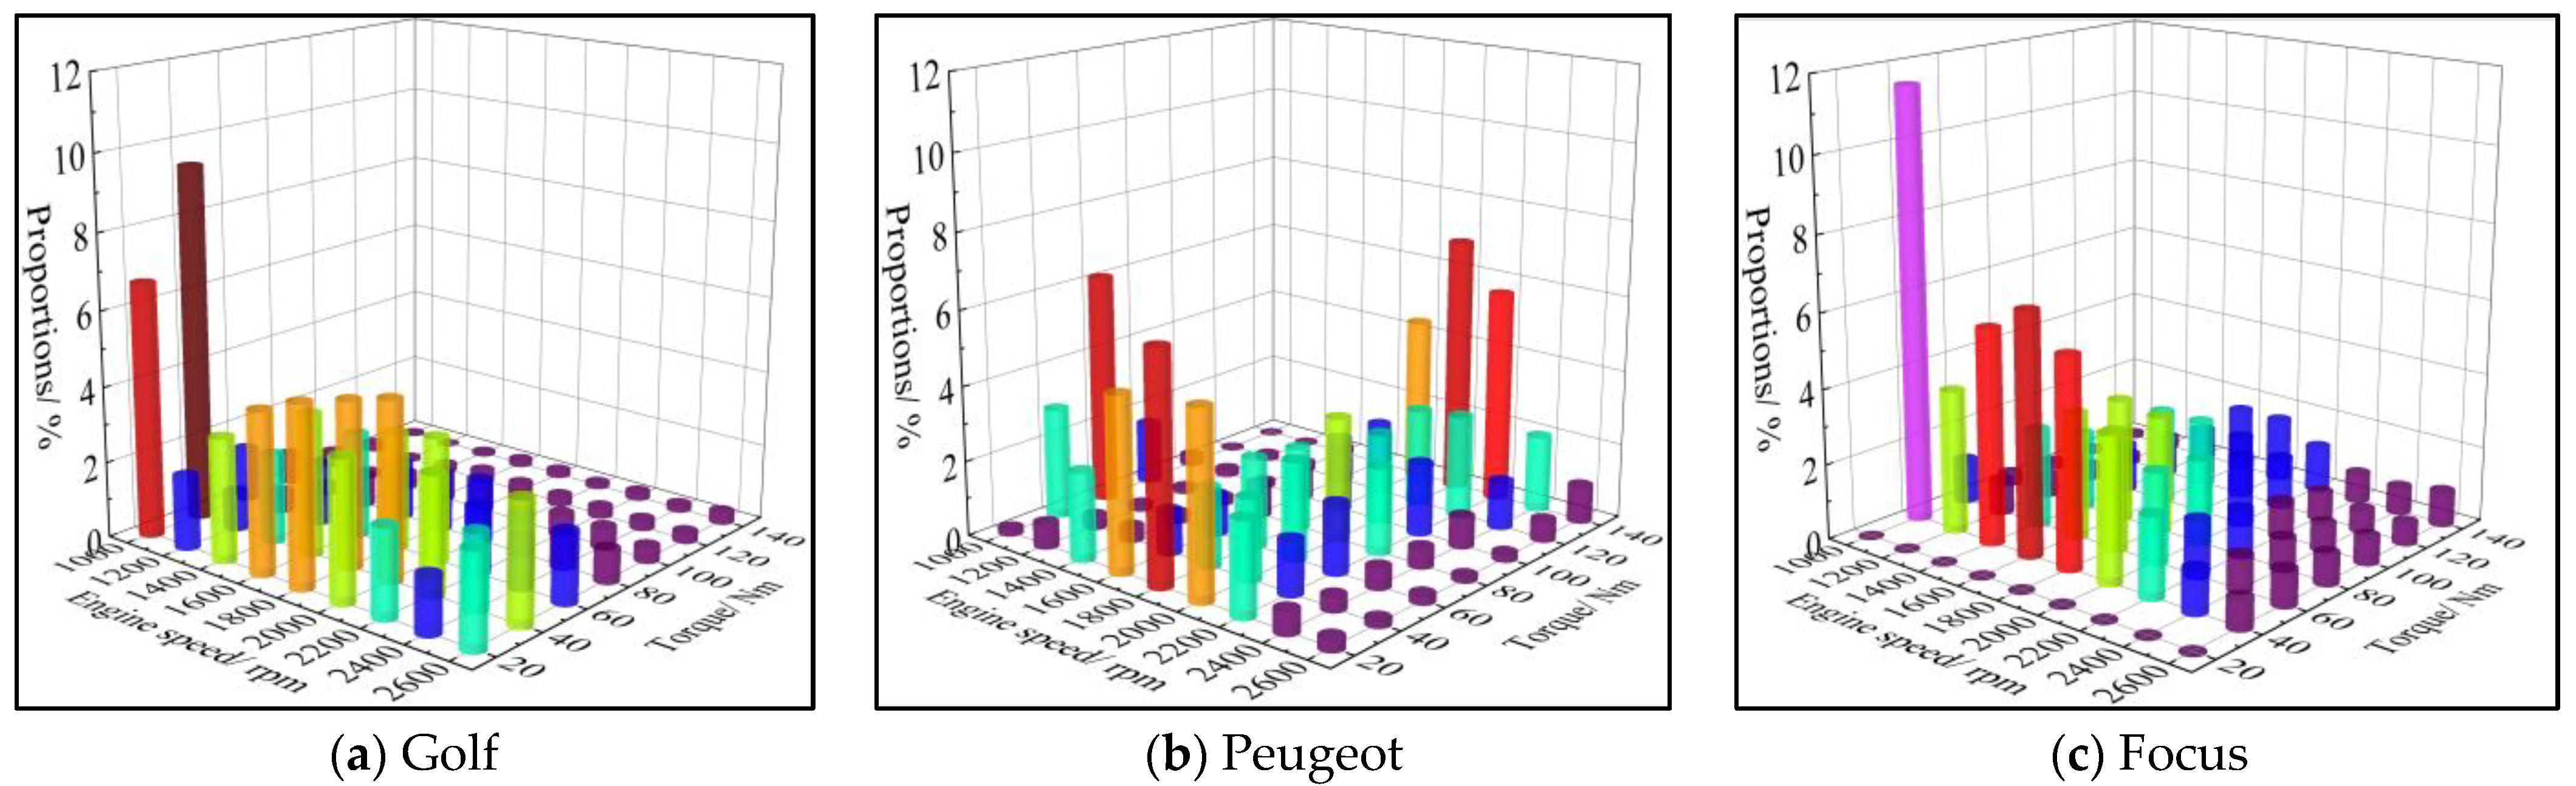
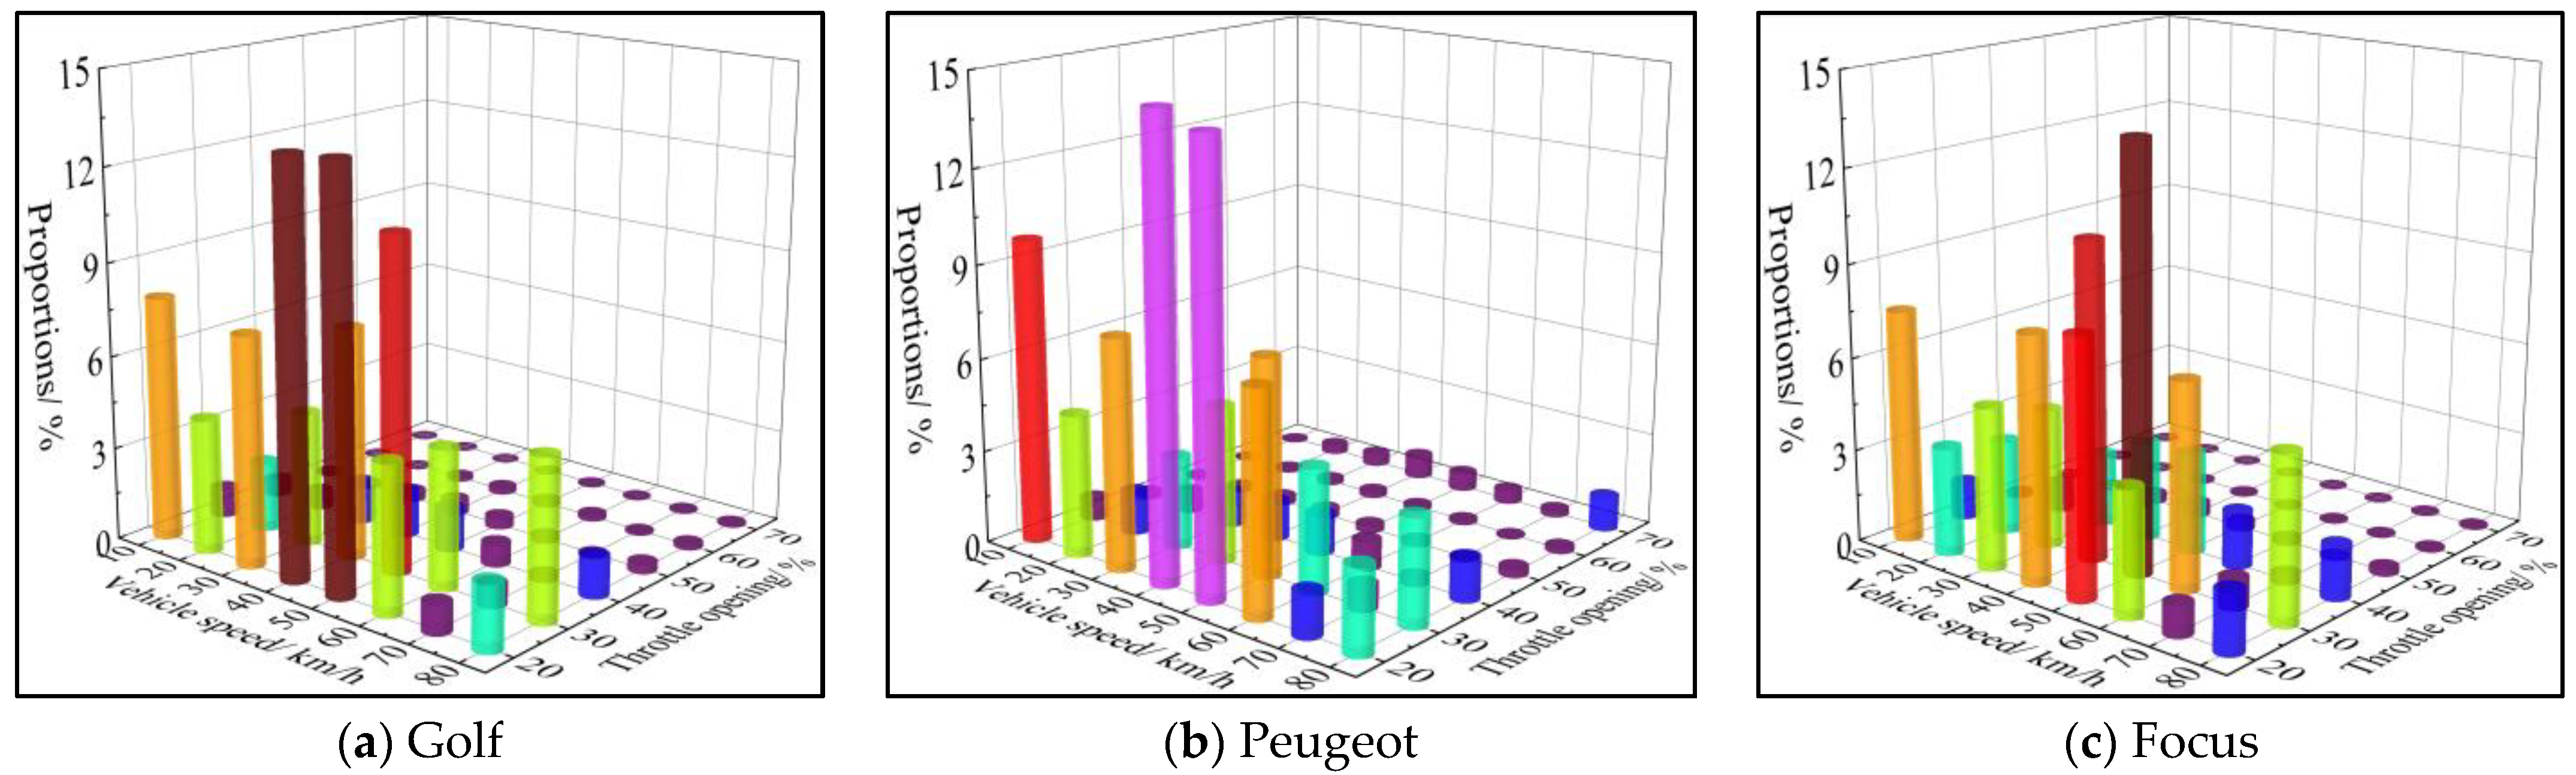
3.1. Real-World Operations of Three GDI Vehicles

In order to investigate the driving behaviors in different GDI vehicles, the operating parameter distributions of real driving conditions are presented in this part. Figure 2 shows the operation distribution vs. vehicle speed and acceleration of the three vehicles. The results show that all the vehicles have similar distributions in velocity and acceleration. Because rural roads accounted for 77% of the total test distance, most of the operating points of the three vehicles range from 30–80 km/h, with an acceleration distribution of 0–0.5 m/s2. The operating conditions of 50 km/h and 0.5 m/s2 account for the largest proportion. The speed of 10 km/h and acceleration of 0.5 m/s2 account for approximately 6% of the whole journey.
The distributions of the operating conditions as the effects of the engine speed and torque are significantly different among the three vehicles, as shown in Figure 3. Shahariar et al. [31] pointed out that the speed and torque distributions are also different for various driving styles, and aggressive driving styles led to high proportions of low speed and large torque. The figure indicates that the engine speed and torque distributions change significantly due to gear-shifted strategies and vehicle specifications. The engine speed and torque of the Golf are approximately evenly distributed among 1000–2600 rpm and 20–80 Nm; however, the engine speeds of the Peugeot are in the range of 1600–2200 rpm and 20–140 Nm. The Focus’s speed and torque are distributed between 1000–2600 rpm and 40–140 Nm, and the small torque condition (40 Nm) accounts for a large proportion.
Figure 4 shows the operation distribution vs. vehicle speed and throttle opening of the three vehicles during the test. For the three vehicles, the distributions of speed and throttle opening are similar. The operations of the three vehicles are mainly concentrated in the speed range of 10–80 km/h and throttle opening range of 20–40%, with the largest proportions occurring at the speed range of 40–50 km/h. In addition, three vehicles also account for a large proportion of low speed and small throttle opening conditions, such as 10 km/h speed and 20% throttle opening.

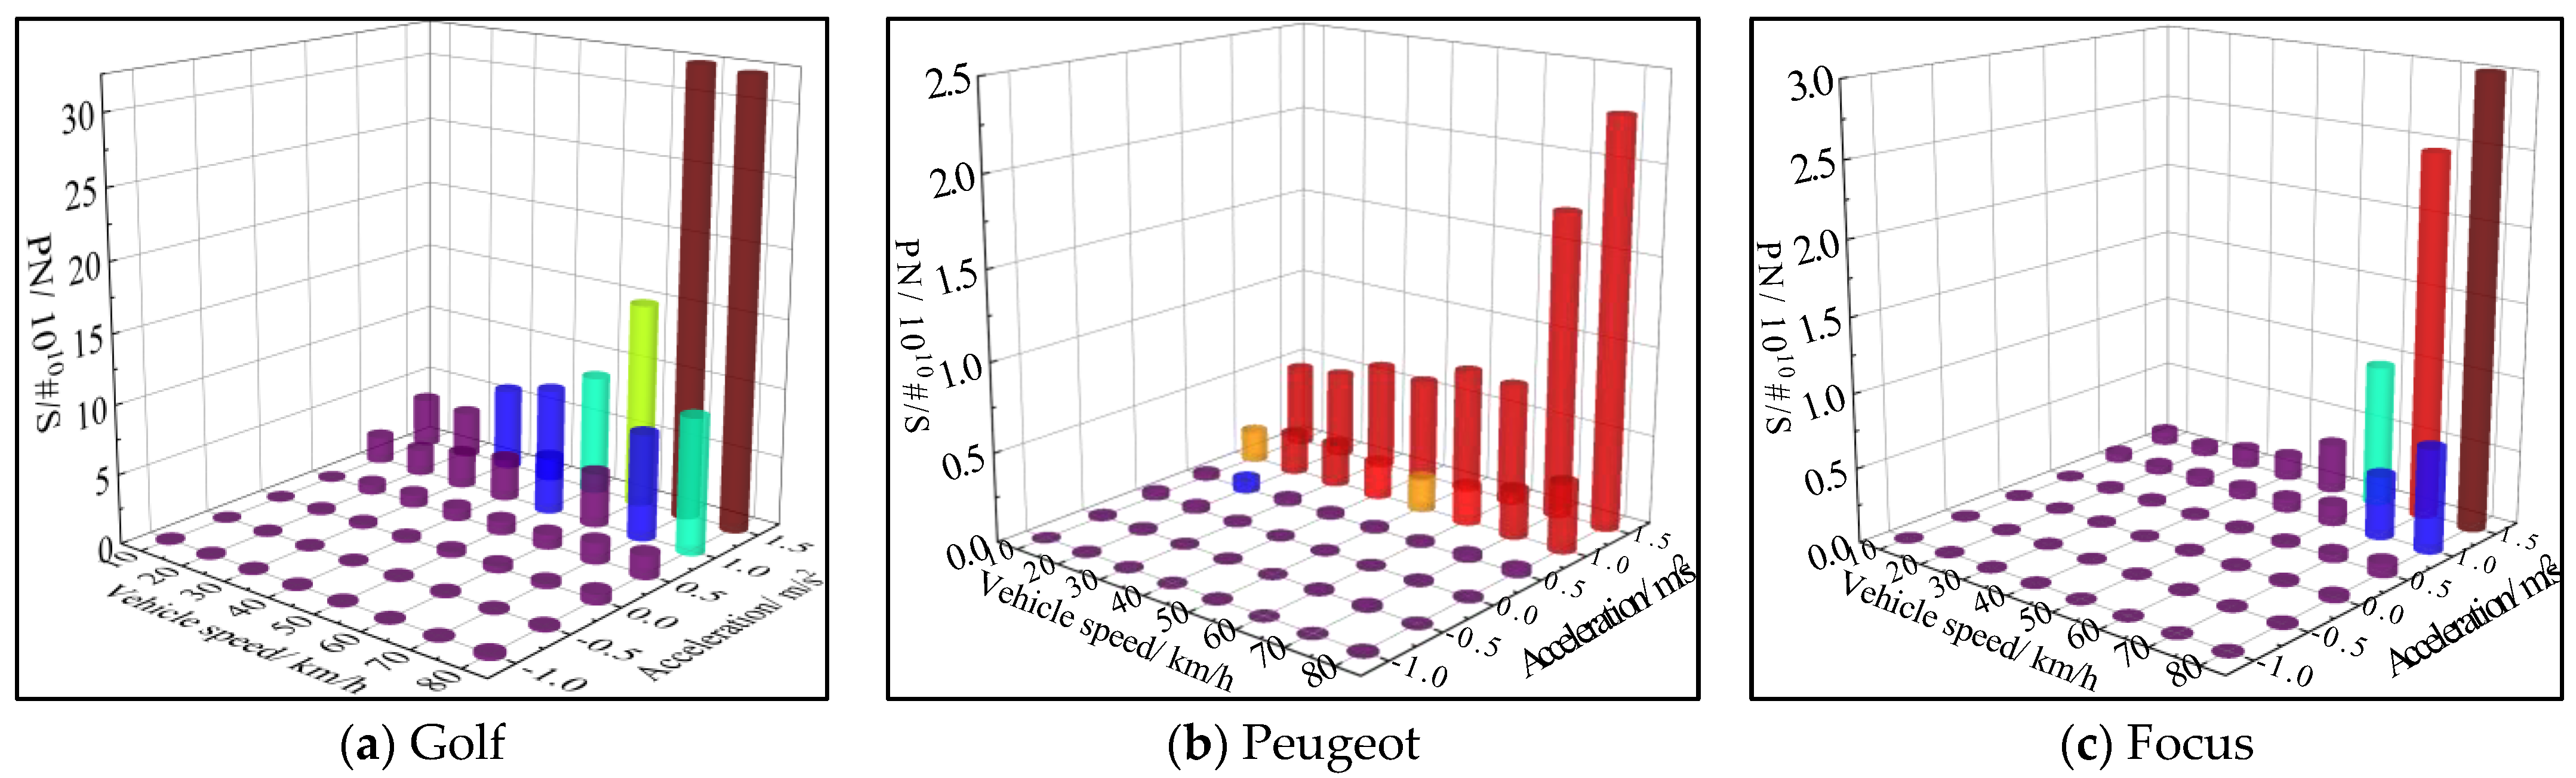
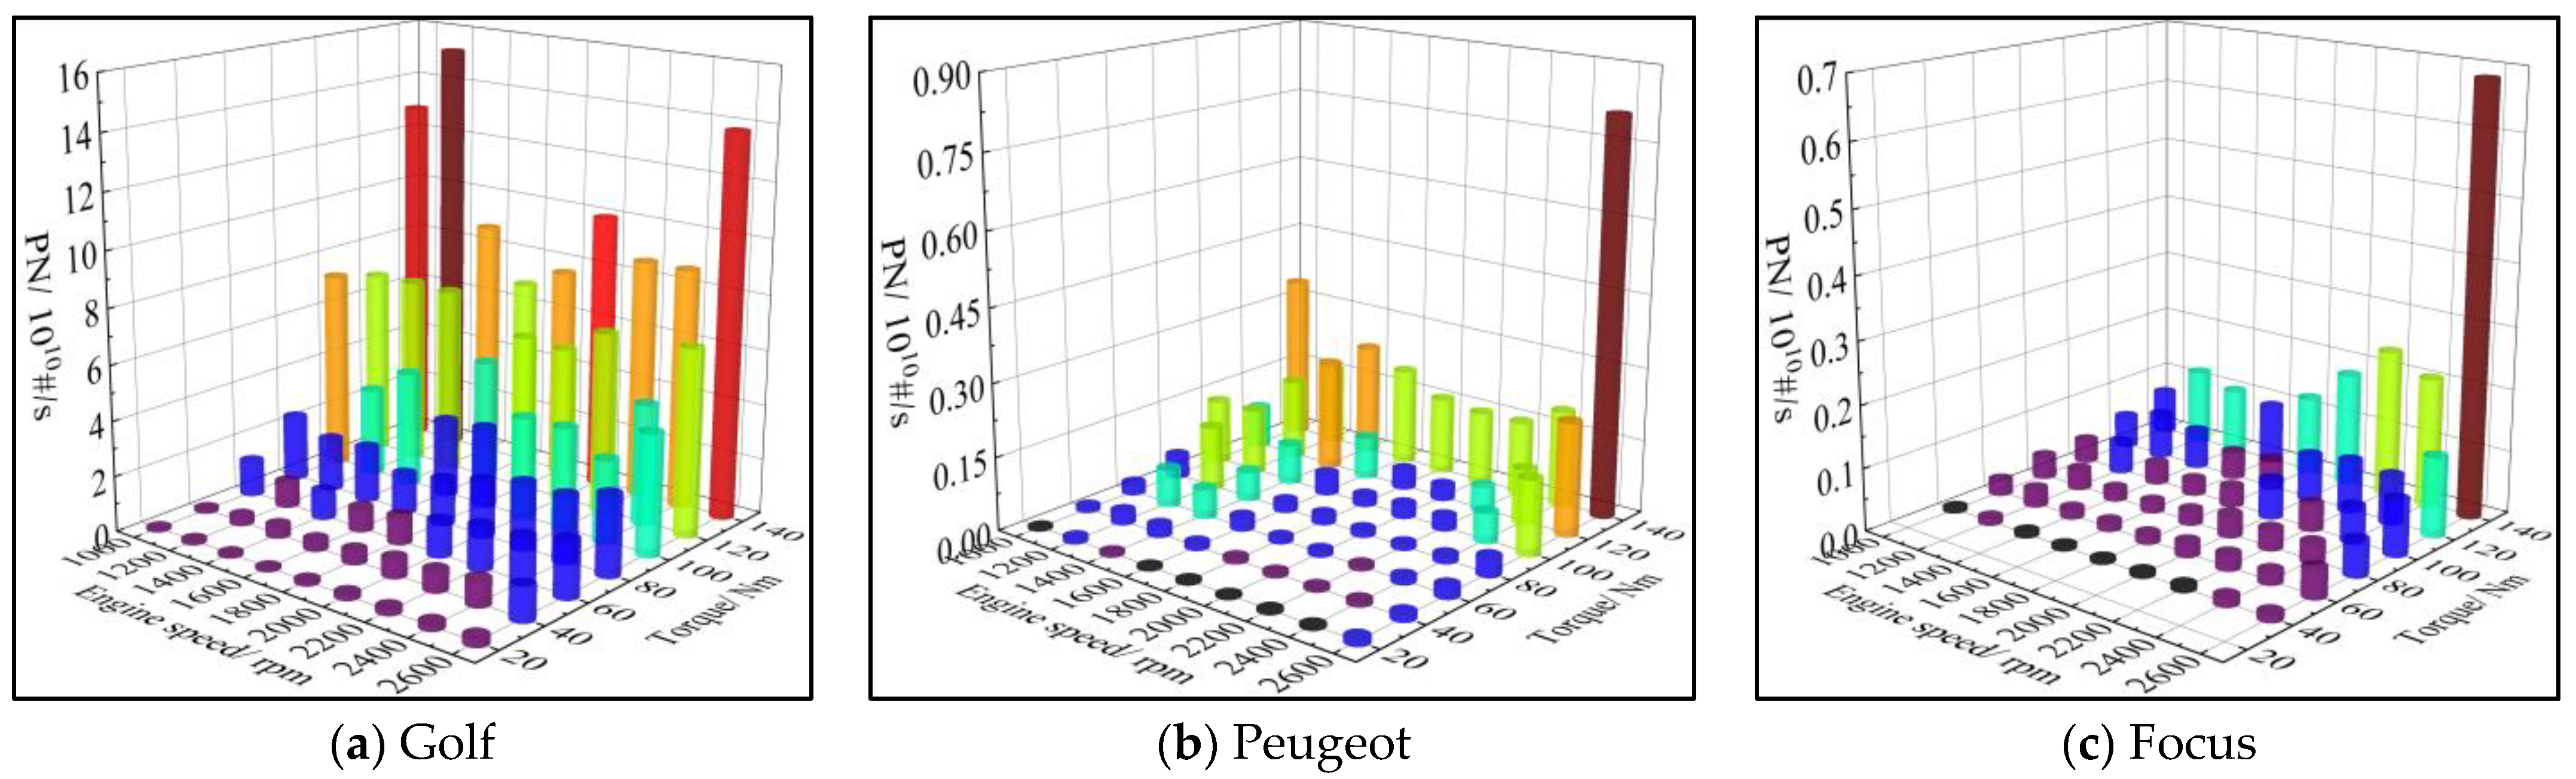
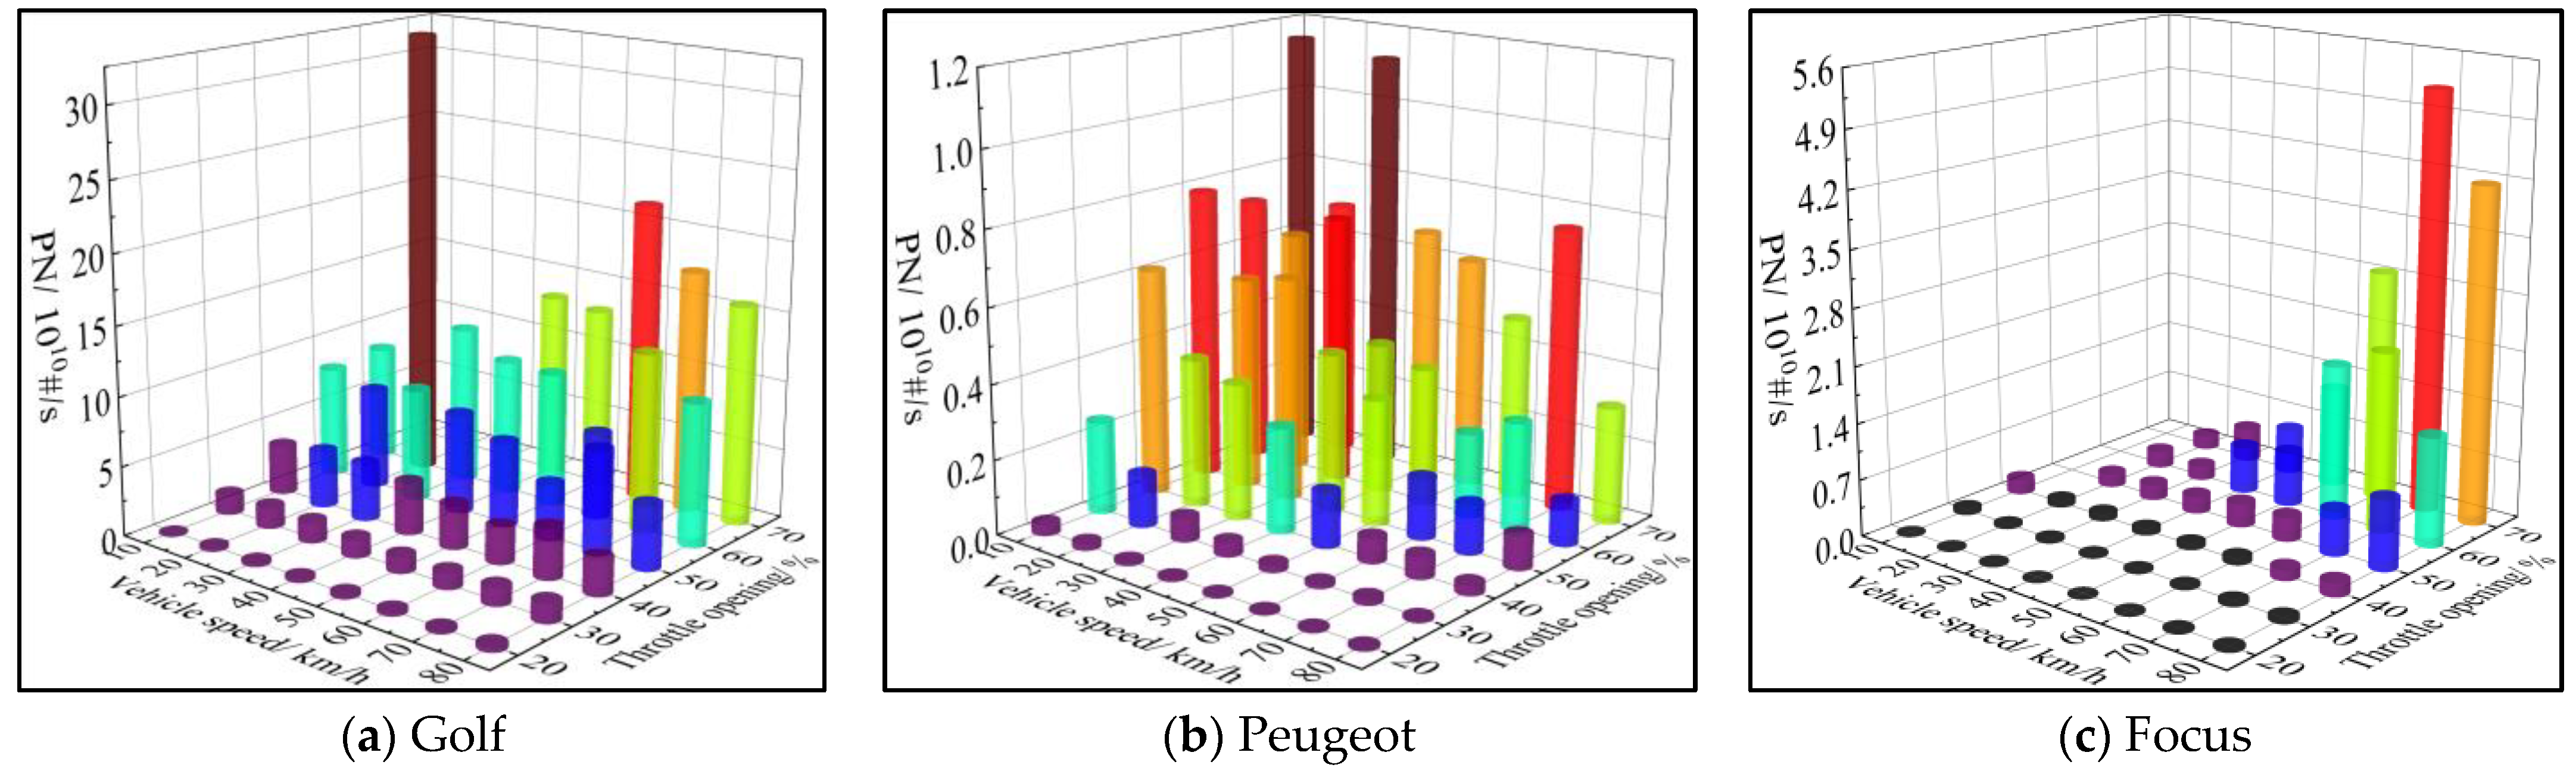
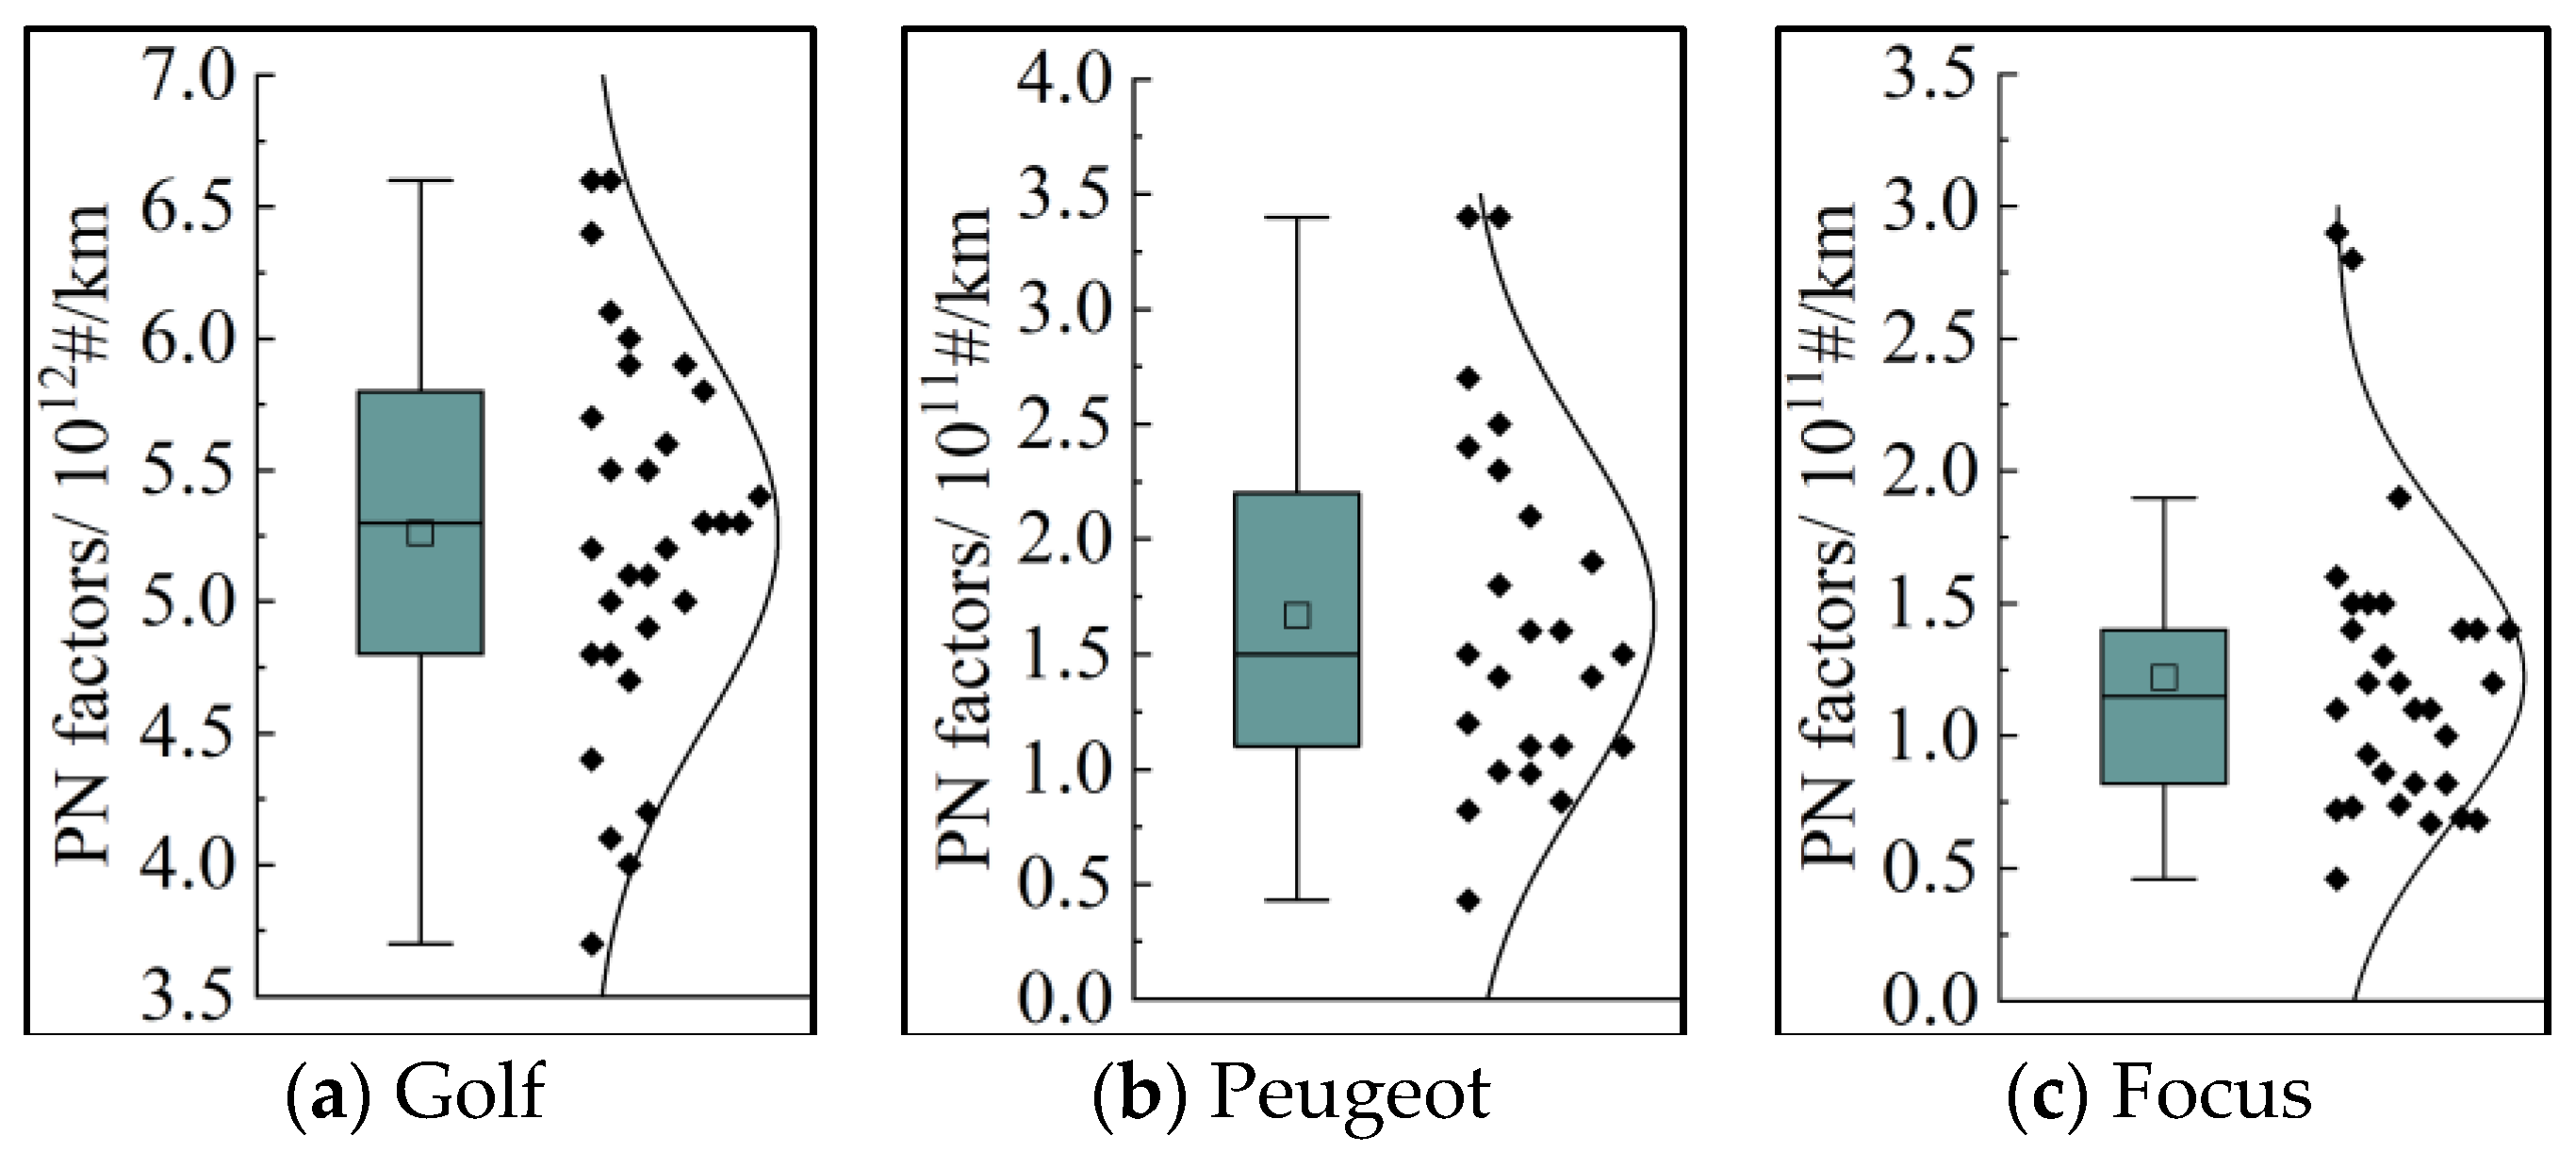
3.2. Real-World PN Emission Rate Distributions

In order to study the effect of driving behavior on real-world PN, NOx and CO2 emissions, and analyze the differences between different GDI vehicles, the changes in average instantaneous emission rates with the driving conditions were calculated. Figure 5 shows the PN emission rate vs. vehicle speed and acceleration of three vehicles during the real-world test. The results from Kontse et al. [32] showed that the PN emissions of non-GPF GDI vehicles (Euro 6b) exceeded 1.6 times of the emission limit under the cold-start RDE-compliant route. In this research, the vehicles were fully warmed up before the emission test. The average peak PN emission rate of the Golf is 10 times higher than the Peugeot, and the peak PN emission rate exceeds 30 × 1010 #/s. This is mainly caused by the fact that the Golf lacks a GPF. In addition, the type approval emissions of the Golf are Euro-6a compliant, and the type approval test cycle is NEDC, where the driving behaviors are more gentle than in the WLTC cycle [33], resulting in higher PN emissions for the Golf under real-world driving. The peak PN emission rates for the Focus do not present much difference from the Peugeot, as both passenger cars meet the Euro 6c standard’s PN emission limits.
The average instantaneous PN emission rates of three vehicles increase with the speed and acceleration. The PN emission rates reach peak values when the vehicles operate in the range of 70–80 km/h and with an acceleration of 1.5 m/s2. This means that high acceleration and speed conditions are acute events of the PN emissions of GDI vehicles. Under such operating conditions, excessive fuel injection leads to a less even mixture in the combustion chambers, resulting in large amounts of PN emissions [34]. Pirjola et al. [35] investigated the PN emissions of turbocharged GDI passenger cars and concluded that the PN emissions were higher under the acceleration and steady-state driving conditions than during deceleration. From Figure 2, although the proportions of the acceleration of 1.0–1.5 m/s2 of the three GDI vehicles are low, the PN emissions are higher. This means that acceleration significantly affects PN emissions. The driver should avoid using excessive acceleration in real-world driving, especially at high speeds.
The influence of engine speed and torque on PN emission rates is shown in Figure 6. The PN emission distributions of the three GDI vehicles when affected by torque and speed are similar. The PN emission rates of the three vehicles increase with torque. The high PN emission rates mainly occur under high torque conditions. For engine speed, high PN emissions are concentrated in low speed (<1400 rpm) and high speed (>2000 rpm) conditions. Fuel combustion is more complete at a medium engine speed, so the PN emissions are lower, which has been verified on the bench test [36]. Increasing the engine speed under high torque condition can increase the PN emissions, and the PN emission rates reach the peak values at the engine speed of 2600 rpm and torque of 140 Nm. From Figure 3, the three vehicles have different proportions under high speed and high torque conditions, which lead to higher real-world emissions. Under high torque conditions, GDI engines spark in advance, producing more unburned fuel vapor and carbon particles [37]. He et al. [38] studied the effects of gasoline direct injection engine operating parameters on particle number emissions, and also found that the PN emission rates increased with an increase in traction power. The Golf was tested over the NEDC, where the driving conditions are much gentler, making it easier to meet the emission limits in regulations, so the Golf only shows a high PN emission rate (15.2 × 10¹⁰ #/s) at the engine speed of 1000 rpm and torque of 140 Nm.
Figure 7 shows the distribution diagram of the PN emission rates vs. the vehicle speed and throttle opening of three vehicles. The PN emission rates of the three vehicles are sensitive to throttle opening, and the PN emissions gradually increase with throttle opening, especially when the throttle opening is larger than 50%. Under high speed and high throttle opening conditions, the PN emissions reach the peak value, which corresponds to Figure 4. Higher acceleration leads to high throttle opening and high speed, resulting in the increase in PN emissions. When the vehicle is under the acceleration condition, it needs more oil to burn to provide power, so the throttle opening should increase accordingly, which leads to the increase in speed. The local rich mixture and wet wall phenomenon are the major reasons for this, and the local enrichment of the mixture and wet wall are worsened with throttle opening. In addition, too high of a throttle opening under low speed conditions (10 km/h, 70%) significantly increases PN emissions. However, the Focus shows lower PN emissions at low speed and high throttle opening conditions, because the Focus has a larger engine size and higher compression ratio, such that the fuel can burn more fully at low speed conditions, reducing PN generation.

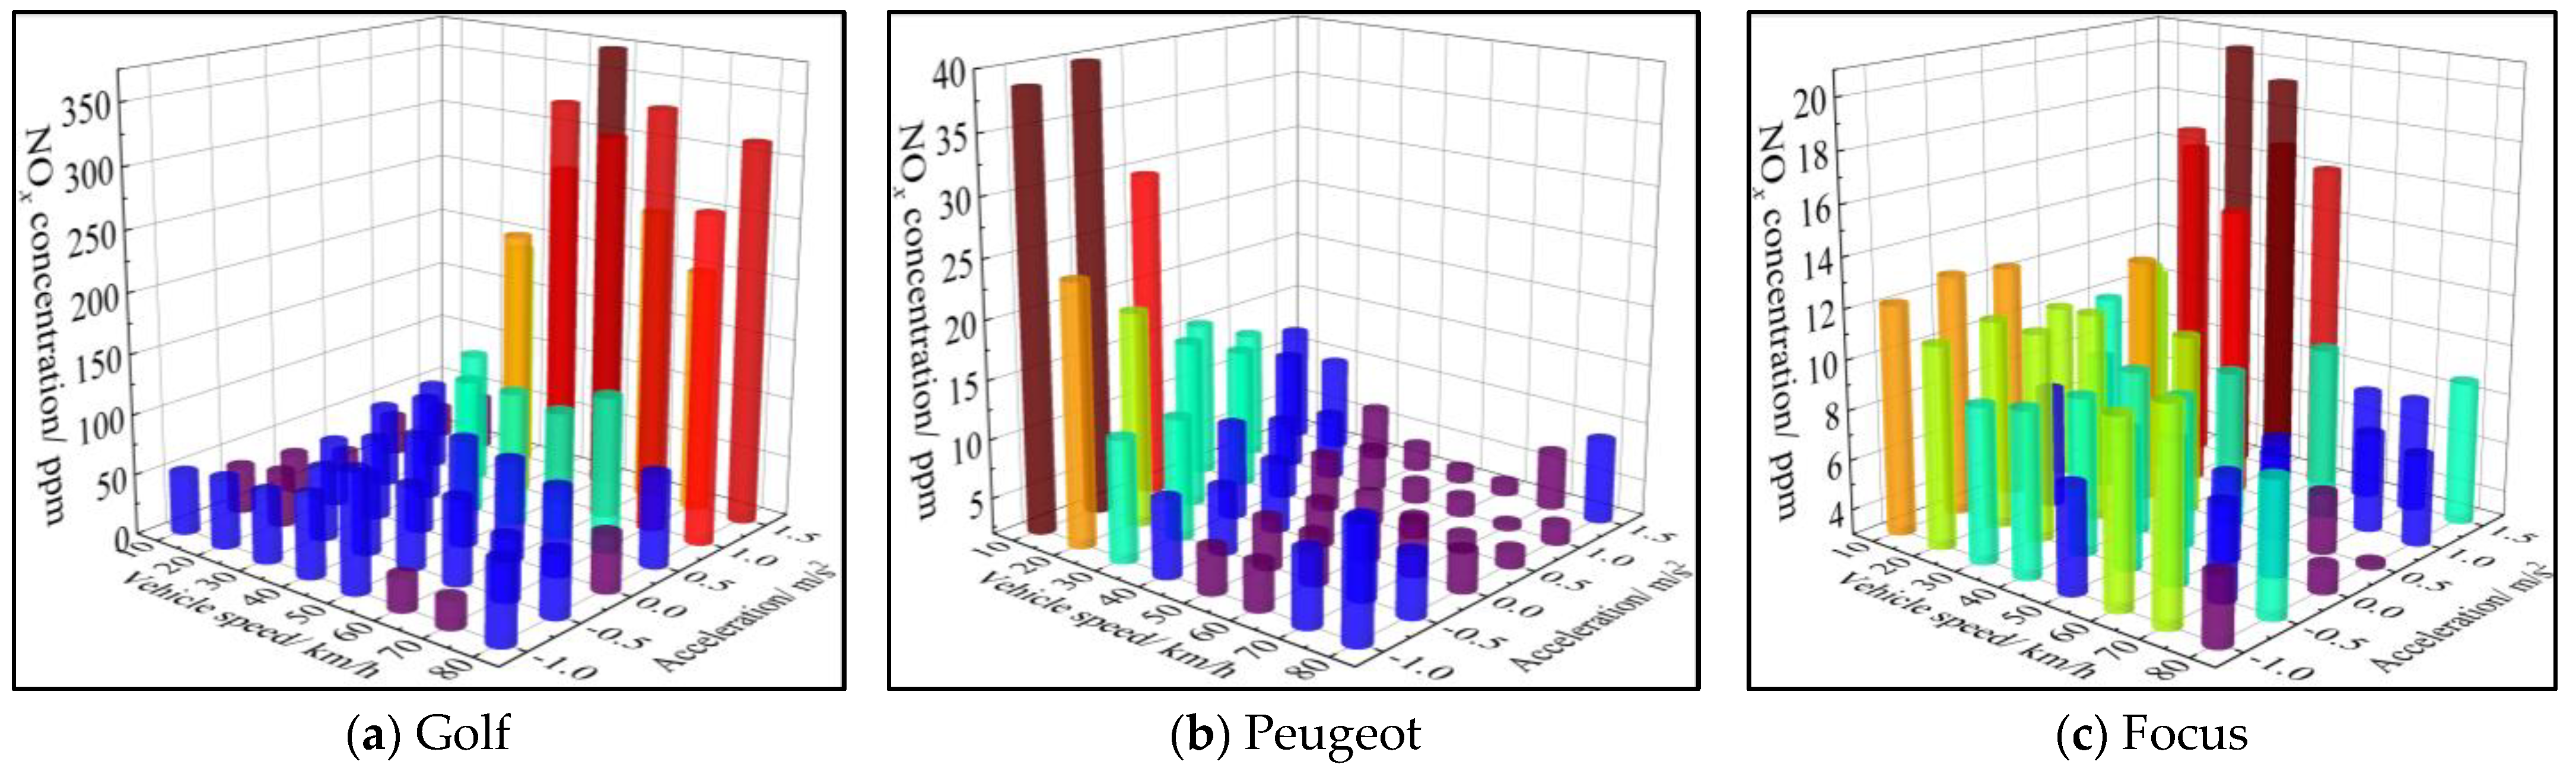
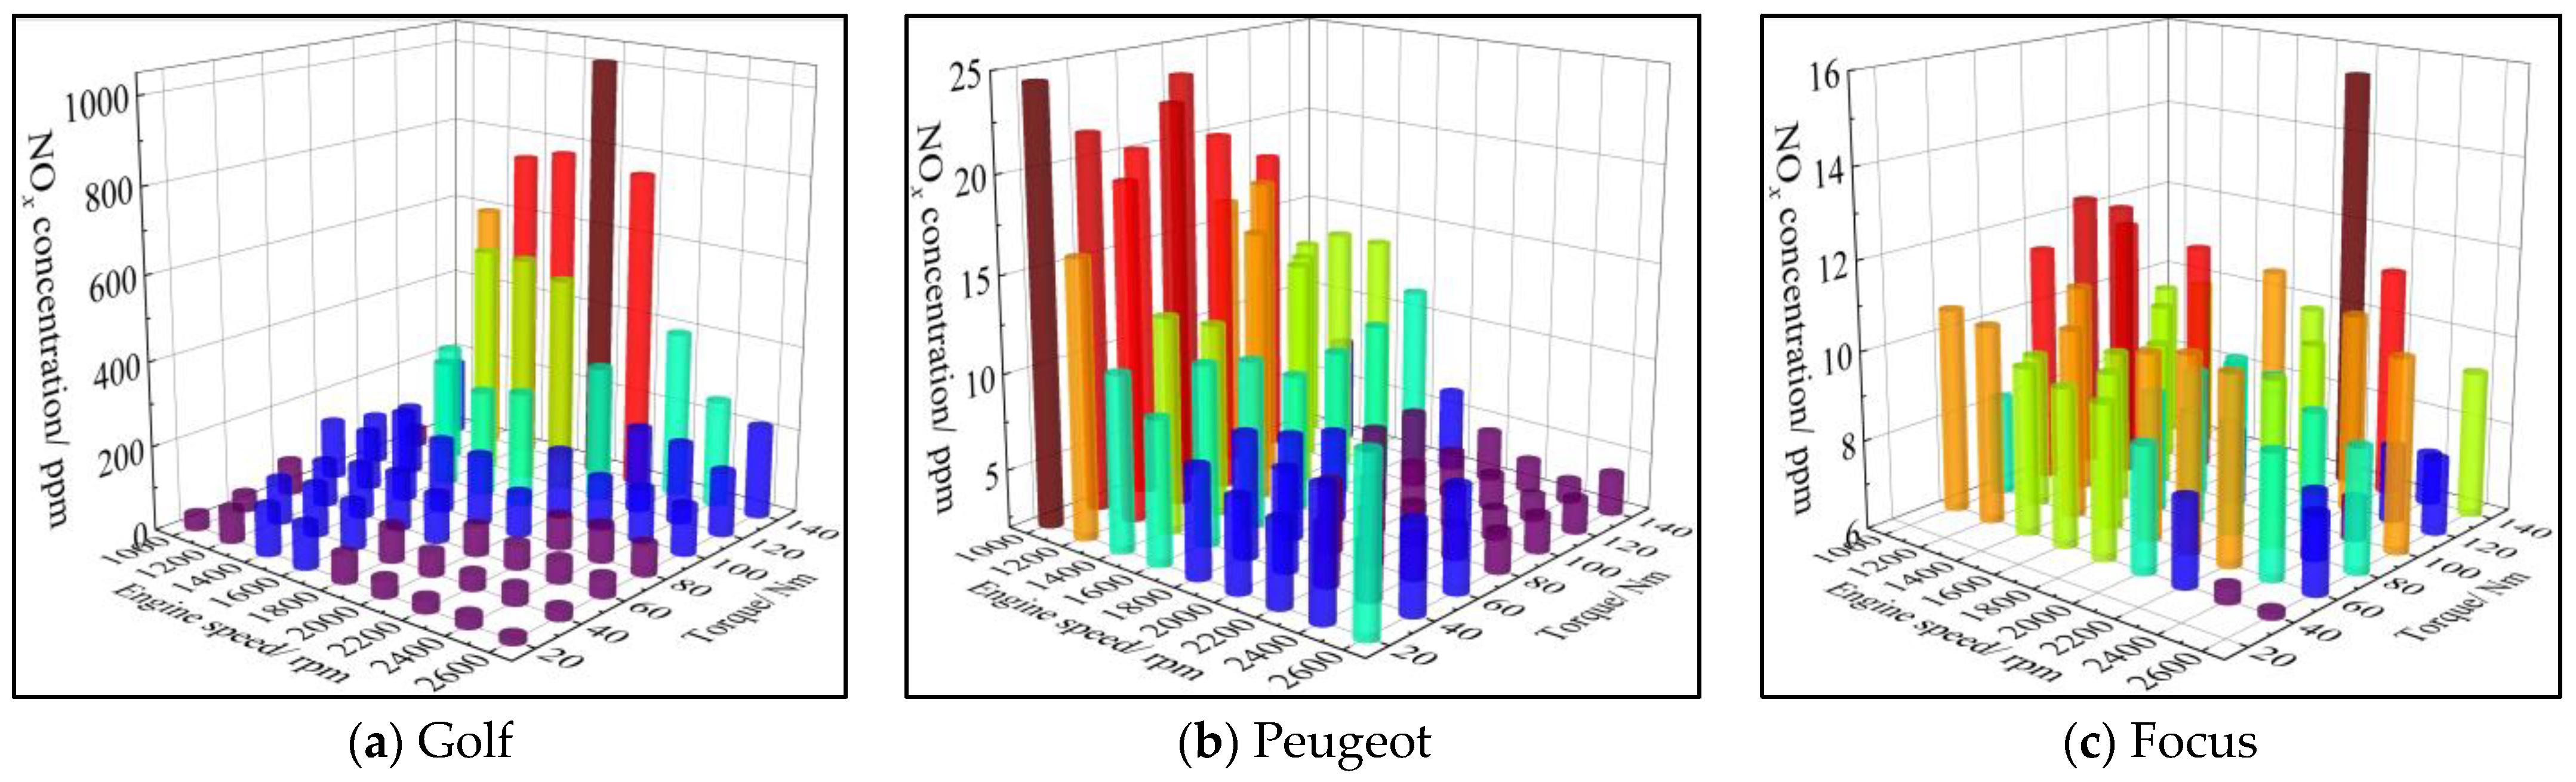
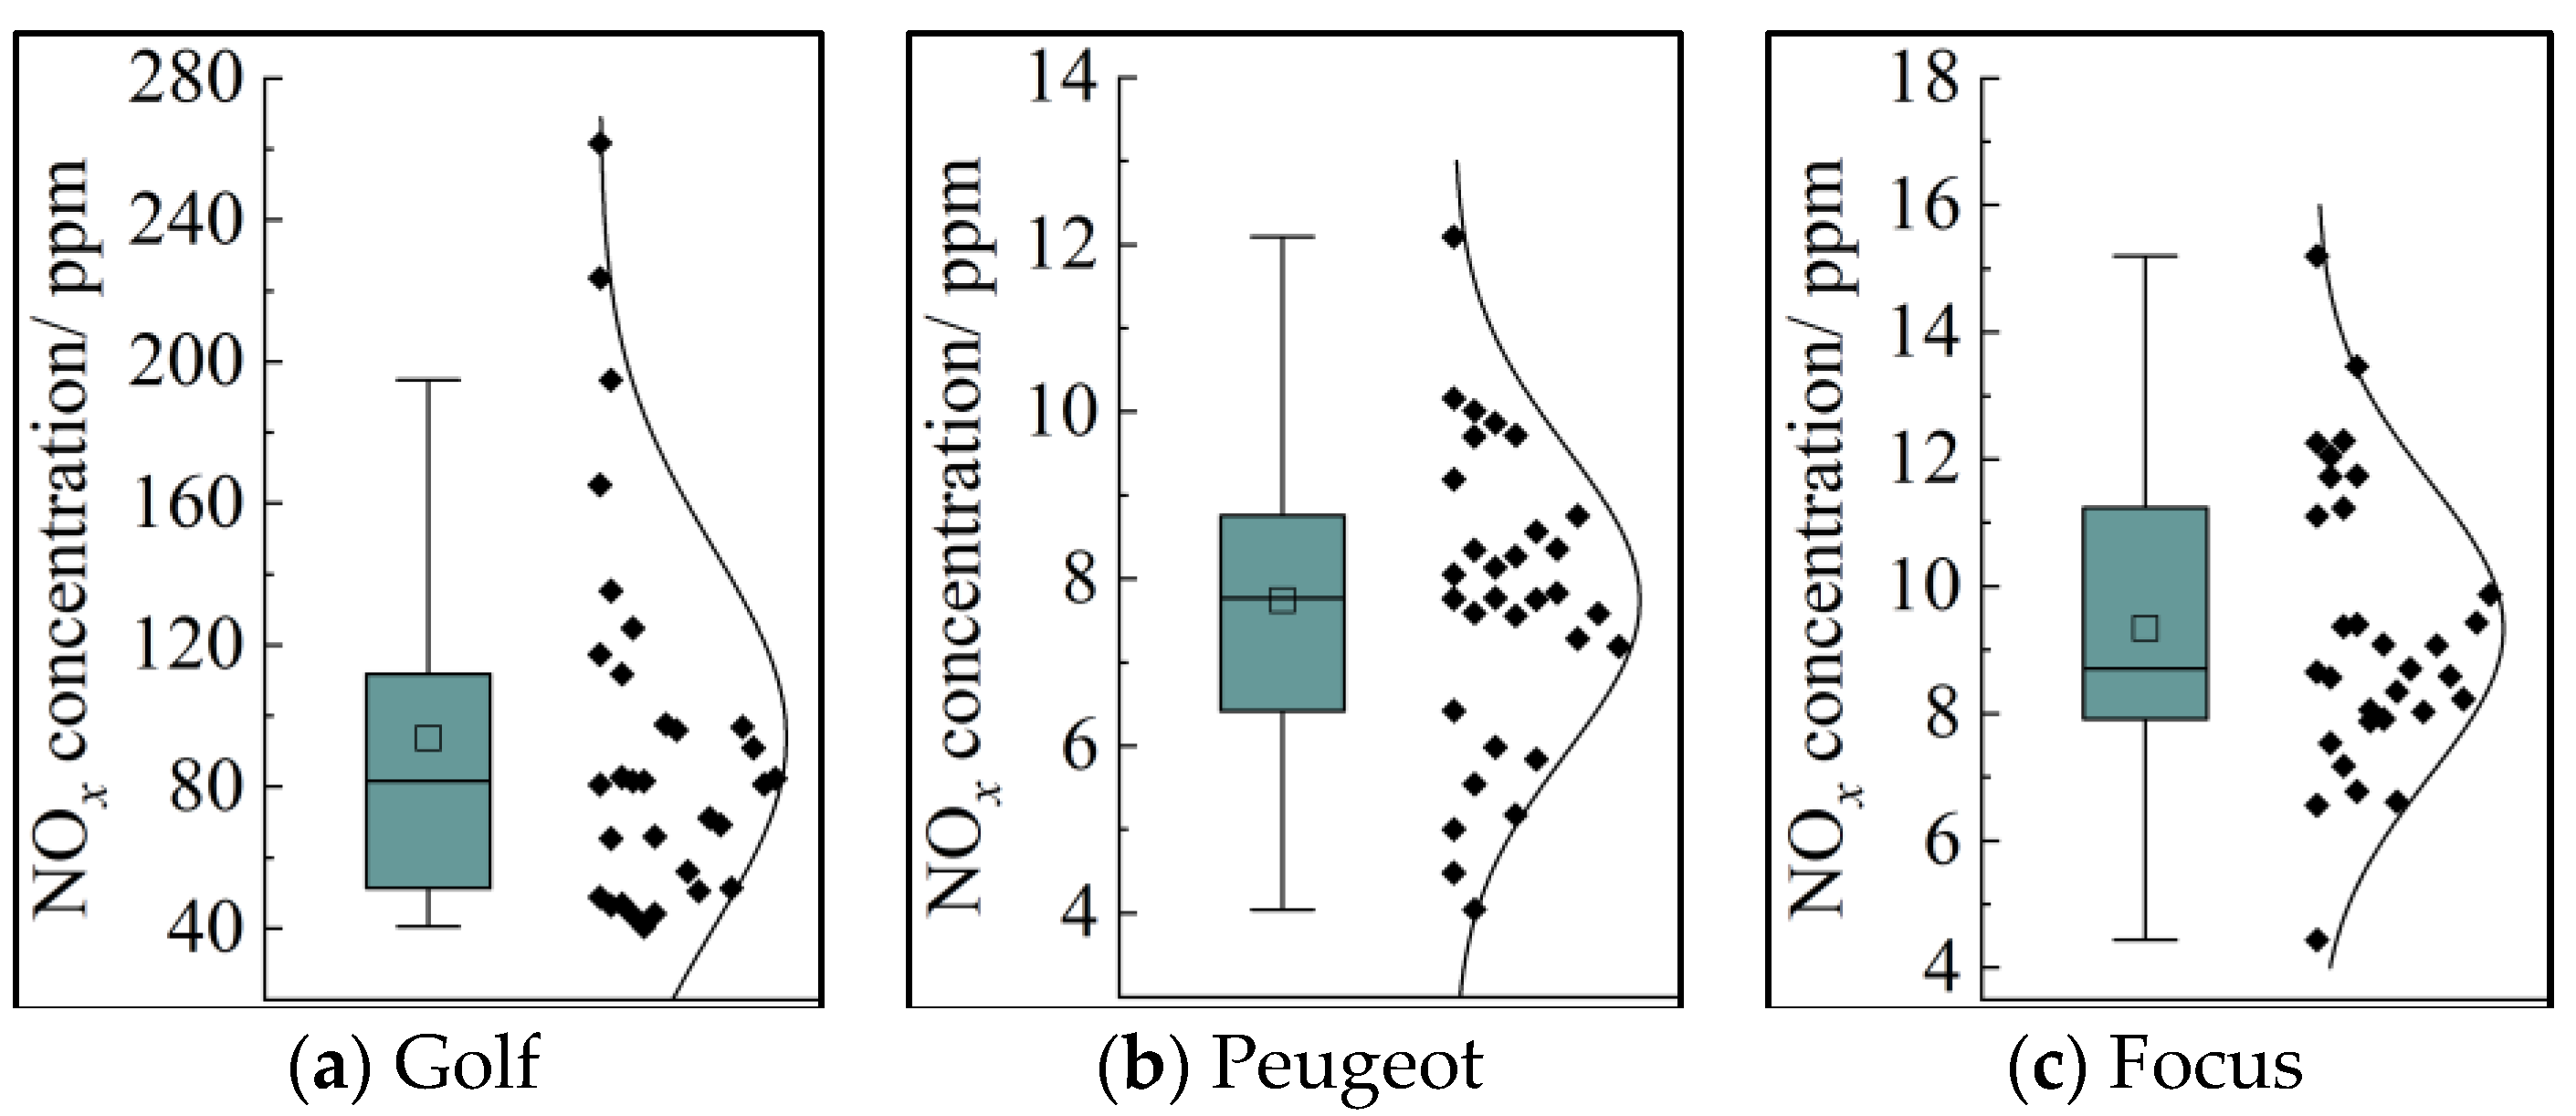
3.3. Real-World NOx Concentration Distributions

Figure 8 shows the distribution diagram of the NOx concentration vs. vehicle speed and acceleration of the three vehicles. Statistically, the Golf has a higher NOx concentration, with a maximum concentration reaching 360 ppm. On the other hand, the Peugeot and Focus have NOx emissions lower than 40 ppm. Ricardo et al. [5] indicated that the vehicles on the NEDC test cycle emitted more NOx than the vehicles on the WLTC test cycle. The NOx concentrations of Peugeot are below 10 ppm when the vehicle speed is higher than 40 km. In this paper, the NOx concentration of GDI vehicles tended to be high at the low speed conditions. This is caused by a drop in the exhaust temperature, which results in a reduction of the catalytic efficiency of TWC [39]. From Figure 2, the low speed conditions of the three vehicles account for large proportions, so the NOx emissions of low speed conditions cannot be ignored. Regarding the Golf, the peak NOx concentration is under the conditions of high speed and high acceleration. Aggressive driving of the Golf has more impact on its NOx emissions than those of the Peugeot and Focus due to more NOx formations and saturation of TWC catalyst [39].
The influence of engine speed and torque on NOx concentration is shown in Figure 9. When the engine speed is lower than 1800 r/min, more NOx emissions of GDI vehicles can be generated, which is related to a lower catalyst temperature. Similarly, three vehicles account for a large proportion at low engine speed in Figure 3. From bench test, high torque conditions lead to increase the cylinder temperature and produce more NOx, resulting in catalyst saturation and the peak of NOx emission [9]. Lou et al. [40] revealed that gasoline vehicles are more likely to exceed the TWC ability of NOx reduction, further generating peak NOx emissions at high load conditions. O’Driscoll et al. [41] also pointed out that the greater power demand of GDI vehicles leads higher NOx concentration, which agrees with the authors’ results in this section.
Figure 10 shows the distribution diagram of NOx concentration distribution vs. vehicle speed and throttle opening of three vehicles. Similar to Figure 8, the low speed conditions of GDI vehicles cause higher NOx emissions. In addition, high throttle opening also result in higher NOx emissions, especially for the Golf. In this condition, excessive fuel injection leads to an increase in the combustion temperature of the cylinder, and produces NOx emission; meanwhile, the catalyst tends to be saturated.

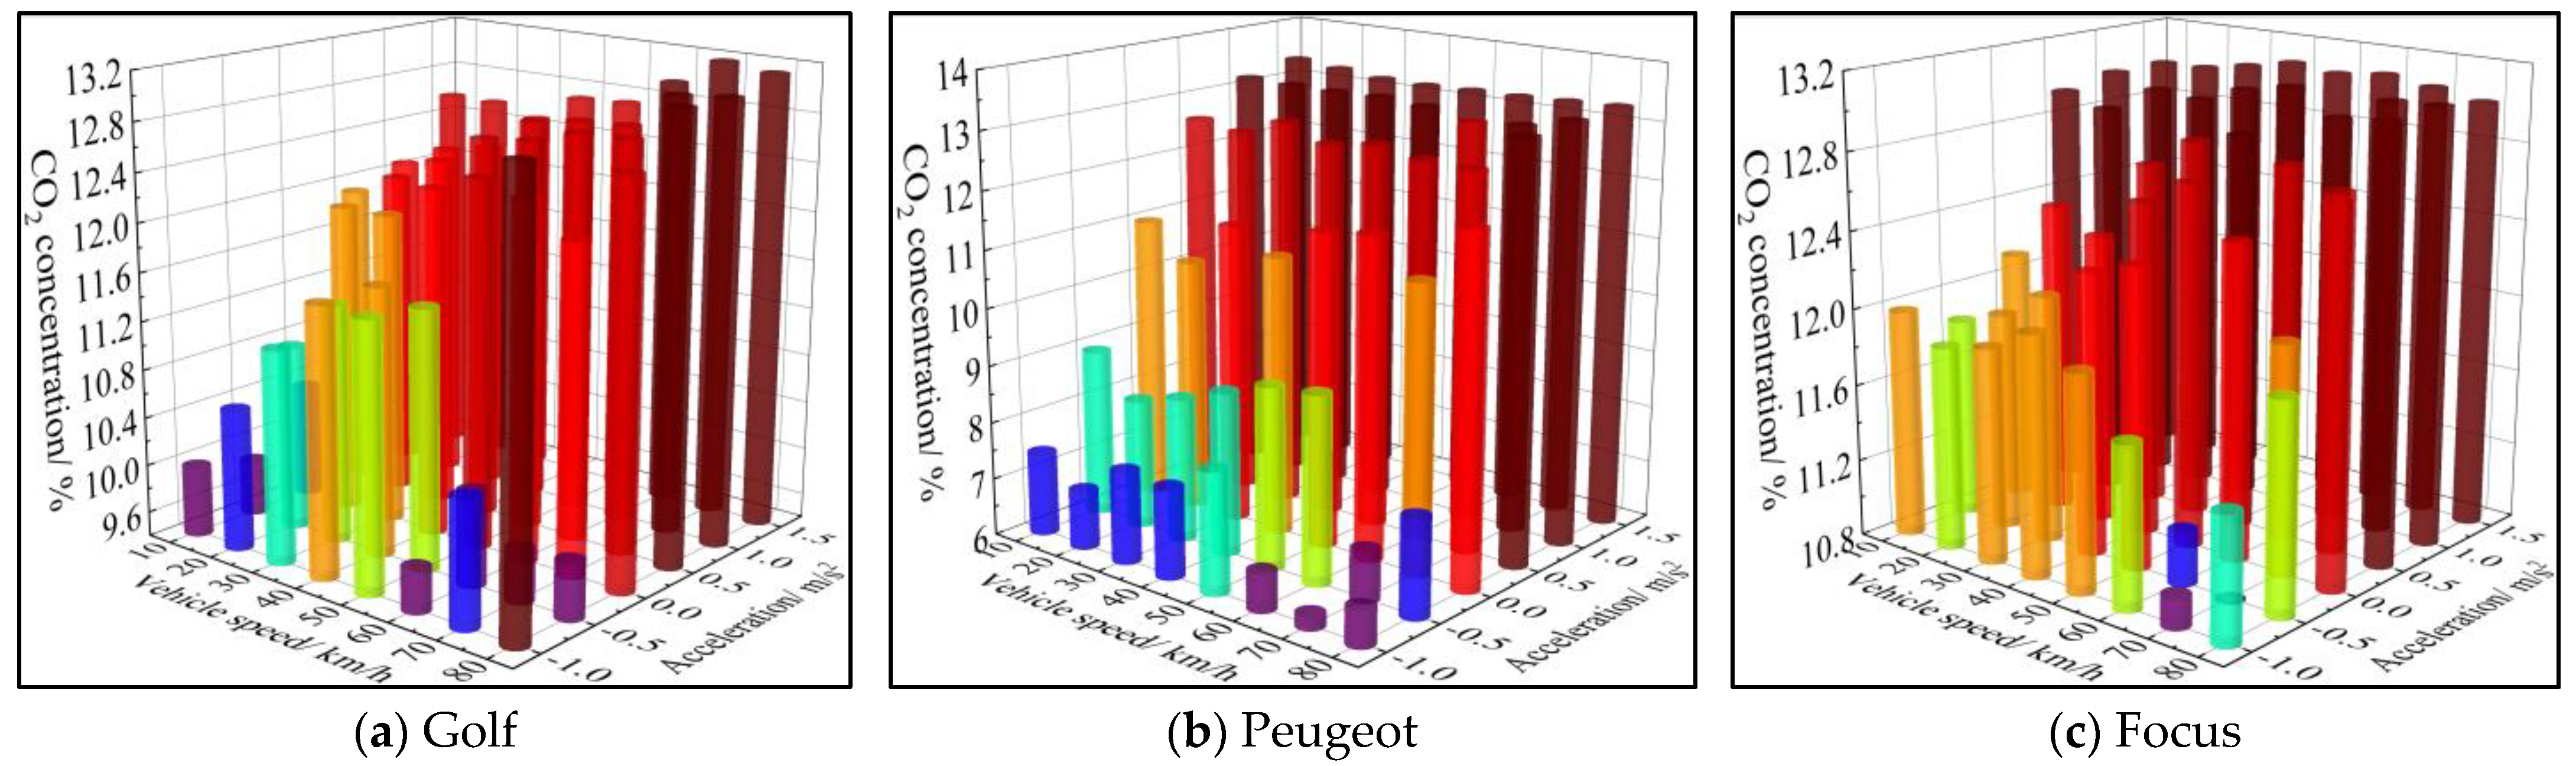
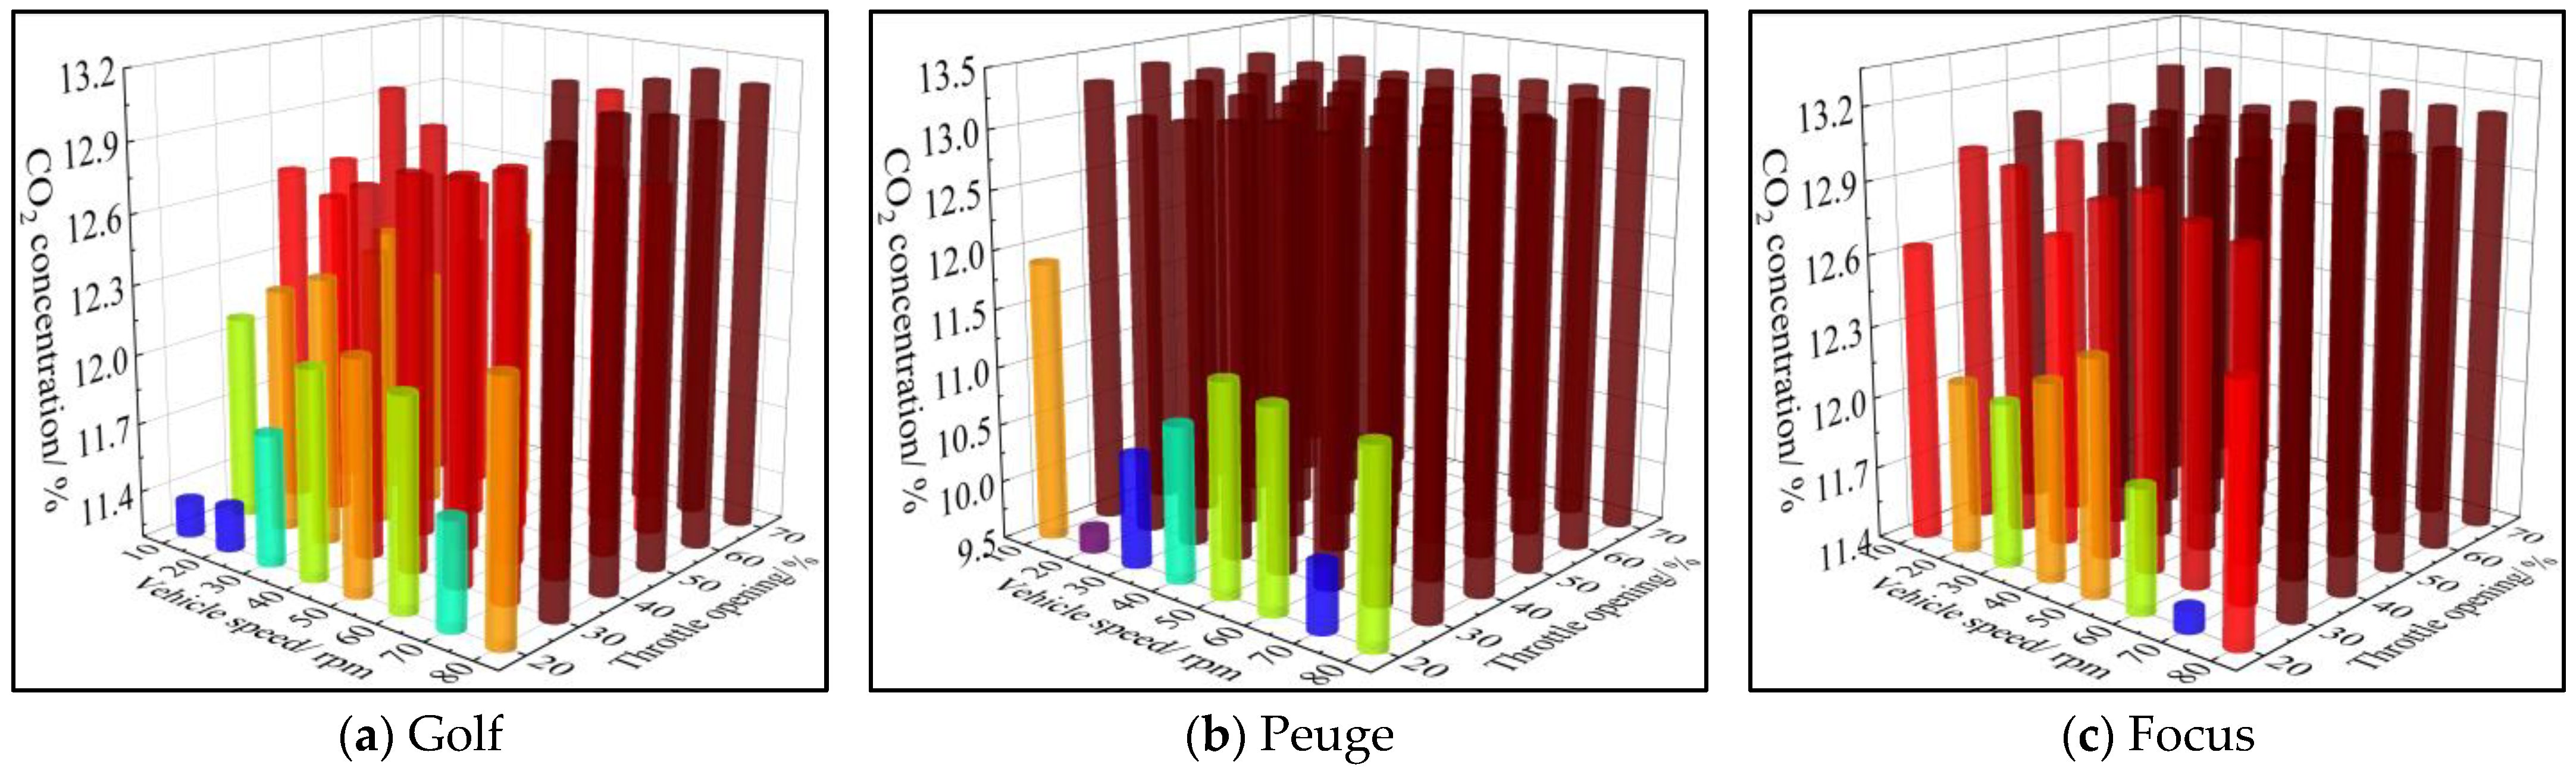
3.4. Real-World CO2 Emission Rate Distributions

Figure 11 shows the distribution diagram of CO2 concentration vs. vehicle speed and acceleration of three vehicles. The GDI vehicles are reported to have lower CO2 emissions than PFI vehicles due to their higher thermal efficiency [42]. However, the peak CO2 emissions of the three GDI vehicles are all higher than 13% in this study. Because there is no limit of CO2 emissions, the CO2 emission distributions of the three vehicles are similar. The CO2 emissions of three vehicles are more sensitive to acceleration. Once the vehicles under the acceleration conditions, the CO2 emissions increase rapidly. From Figure 2, the three vehicles have large proportions under the 0.5 m/s2 acceleration condition, which will increase the real-world CO2 emissions. In the deceleration process, the CO2 emissions are quite low because of the small quantity of fuel delivery. Additionally, more fuel is burned at high acceleration conditions, resulting in higher CO2 emissions. Higher acceleration leads to more CO due to the less complete combustion of the fuel in GDI vehicles. Due to the function of TWC, it is widely accepted that it is easier to oxidize CO to CO2 [43], and CO emission is not the focus of the investigation.
The effect of engine speed and torque on CO2 concentration is shown in Figure 12. Compared with the engine speed, the CO2 emissions of the three GDI vehicles are more sensitive to torque. When the torque is higher than 20 Nm, the CO2 emission increases sharply. Under such conditions, more fuel is delivered into combustion chamber of gasoline engines, result in more CO, which is confirmed in the bench test [44]. Small torque operation may be a good option for GDI vehicles to reduce CO2 emissions, being consistent with the conditions of small acceleration.
Figure 13 shows the distribution diagram of CO2 concentration vs. vehicle speed and throttle opening of three vehicles. Throttle opening has a highly positive correlation with CO2 emissions. The CO2 emissions of GDI vehicles rapidly increase to peak values when the throttle opening is larger than 30%. The increase of throttle opening is accompanied by the increase of fuel injection, leading to the generation of more CO; meantime, the CO concentrations are high at high speed conditions, and the catalyst is fully warmed up. It can catalyze the oxidation of more CO into CO2.

3.5. Real-World Emission Factors

In this section, the emission factors of GDI vehicles during the whole real-world driving process are analyzed to explore the differences between vehicles. In addition, the effect of different drivers is also analyzed. Figure 14 shows the average PN emission factors of three vehicles, and the explanations of the bars and lines in box plots are presented in the work [45]. Suarez-Bertoa et al. [5] revealed that PFI vehicles have the highest PN emission factor (2 × 10¹² #/km) in real-world driving; however, the PN emission factor of GDI vehicles with GPF is the lowest (1 × 10¹⁰–2 × 10¹⁰ #/km). In this paper, the average PN emission of the Golf is the highest, being up to 5.27 × 10¹² #/km due to the lack of DPF and less strict test approval cycle. The Focus, with a stricter PN emission standard, has the lowest average PN emission (1.24 × 10¹¹ #/km), which is 0.32 × 10¹¹ #/km lower than that of the Peugeot equipped with a GPF. The vehicles with higher PN emissions are more susceptible to the difference between drivers. The highest PN emission value of the Golf is 6.7 × 10¹² #/km, but the lowest emission is only 3.4 × 10¹² #/km.
Figure 15 shows the average NOx emission factor of the three vehicles. Gao et al. [22] concluded that the NOx emission factor of GDI vehicles was lower than diesel vehicles, and the emission factors of two GDI vehicles were about 0.010 g/km. In this paper, the average NOx emission of the Golf is the highest (approximately 92 ppm), and the difference between drivers is the most significant (160 ppm), which is similar to that of PN emission, the higher the average NOx concentration, the more susceptible to drivers. The Peugeot and Focus have low average NOx emission factors, with the value of 7.8 ppm and 8.6 ppm, respectively.
Figure 16 shows the average CO2 concentration of the three vehicles. The average CO2 concentration of the three GDI vehicles have minor difference, being approximately 12%; additionally, the variability in drivers is similar. The overall air-fuel mixture is the same for the three vehicles for the purpose of TWC performance. The difference in CO2 emissions among the three vehicles is mainly caused by the driving variability. The focus has the highest average CO2 concentration (12.67%); however, the Peugeot has the lowest average value (11.87%).

4. Conclusions

In this paper, sixteen drivers and three GDI vehicles with vehicle technique and aftertreatment were tested in real-world driving, and the variability of the relationships between driving behaviors and emissions are analyzed. In addition, the emission factors are analyzed statistically to discuss the emission variations by drivers. The following conclusions are obtained:
(1) High acceleration and high speed conditions are major conditions for the PN emissions of GDI vehicles, and PN emissions are significantly increased when the acceleration is higher than 1.0 m/s2. The PN emission rates reach peak values when the vehicles operate in the range of 70–80 km/h and with an acceleration of 1.5 m/s2. The PN emission rates of the three vehicles increase with torque and throttle opening.
(2) The NOx emission distributions of different GDI vehicles are slightly different, and the NOx emissions under the speed of 40 km/h cannot be ignored. The catalyst temperature and catalyst saturation are important factors affecting NOx emission. In addition, high torque and high throttle opening conditions also lead to higher NOx emissions.
(3) Due to the lack of limit of CO2 emissions, the peak CO2 emissions of GDI vehicles all exceed 13% in real-world driving. The CO2 emissions are positively correlated with acceleration, torque and throttle opening. Once the vehicles under the acceleration conditions, the CO2 emissions increase rapidly, which make it difficult to control real-world CO2 emissions.
(4) GDI vehicle with lower emission standards and less test cycle has worse real-world emission performance. The operating parameter variations of the three vehicles caused by drivers are low. However, the GDI vehicles with higher average emissions are more easily affected by drivers over real-world driving, which is a hindrance to effective exhaust emission control.

Author Contributions

J.G. and J.H.: Formal analysis, Investigation, Methodology, Resources, Validation, Visualization, Writing—original draft, Writing—review & editing. Y.W. and C.M.: Conceptualization, Funding acquisition, Methodology, Project administration, Resources, Software, Supervision, Visualization, Writing—review & editing. C.Y.: Investigation, Writing review & editing. All authors have read and agreed to the published version of the manuscript.

Funding

This research was funded by Beijing Institute of Technology Research Fund Program for Young Scholars (XSQD-202203001), the Fundamental Research Funds for the Central Universities, CHD (300102222509, 300102222104) and National Natural Science Foundation of China (Grant No. 51736001).

Data Availability Statement

Data available on request due to restrictions privacy. The data presented in this study are available on request from the corresponding author.

Conflicts of Interest

The authors declare no conflict of interest.

Abbreviations

COcarbon monoxide
CO2carbon dioxide
DPFdiesel particulate filter
ECEuropean Commission
GDIgasoline direct injection
GPFgasoline particulate filter
HChydrocarbon
NEDCNew European Driving Cycle
NOxnitrogen oxides
PEMSportable emission measurement system
PFIport fuel injection
PMparticulate matter
PNparticulate number
RDEreal driving emissions
WLTCWorldwide Light-duty Test Cycle
TWCthree-way catalytic converter

References

  1. Shi, Y.; Lu, Y.; Cai, Y.; He, Y.; Zhou, Y.; Fang, J. Evolution of particulate matter deposited in the DPF channel during low-temperature regeneration by non-thermal plasma. Fuel 2022, 318, 123552. [Google Scholar] [CrossRef]
  2. Huang, J.; Meng, Z.; Peng, Y.; Yang, Y.; Jiang, Q.; Wang, W.; Chen, Z. Investigation on gas and particle emission characterization of carbon black oxidation process promoted by catalyst/ash. Chem. Eng. J. 2022, 437, 135015. [Google Scholar] [CrossRef]
  3. López-Pacheco, I.Y.; Rodas-Zuluaga, L.I.; Fuentes-Tristan, S.; Castillo-Zacarías, C.; Sosa-Hernández, J.E.; Barceló, D.; Iqbal, H.M.N.; Parra-Saldívar, R. Phycocapture of CO2 as an option to reduce greenhouse gases in cities: Carbon sinks in urban spaces. J. CO2 Util. 2021, 53, 101704. [Google Scholar] [CrossRef]
  4. Wang, X.; Gao, J.; Chen, Z.; Chen, H.; Zhao, Y.; Huang, Y.; Chen, Z. Evaluation of hydrous ethanol as a fuel for internal combustion engines: A review. Renew. Energy 2022, 194, 504–525. [Google Scholar] [CrossRef]
  5. Suarez-Bertoa, R.; Valverde, V.; Clairotte, M.; Pavlovic, J.; Giechaskiel, B.; Franco, V.; Kregar, Z.; Astorga, C. On-road emissions of passenger cars beyond the boundary conditions of the real-driving emissions test. Environ. Res. 2019, 176, 108572. [Google Scholar] [CrossRef] [PubMed]
  6. Olabi, A.G.; Maizak, D.; Wilberforce, T. Review of the regulations and techniques to eliminate toxic emissions from diesel engine cars. Sci. Total Environ. 2020, 748, 141249. [Google Scholar] [CrossRef]
  7. Ma, X.; Xu, H.; Jiang, C.; Shuai, S. Ultra-high speed imaging and OH-LIF study of DMF and MF combustion in a DISI optical engine. Appl. Energy 2014, 122, 247–260. [Google Scholar] [CrossRef]
  8. Zhang, M.; Ge, Y.; Wang, X.; Tan, J.; Hao, L.; Xu, H. Particulate emissions from direct-injection and combined-injection vehicles fueled with gasoline/ethanol match-blends—Effects of ethanol and aromatic compositions. Fuel 2021, 302, 121010. [Google Scholar] [CrossRef]
  9. Salib, G.; Saleh, R.; Zhao, Y.; Presto, A.A.; Lamb, A.T.; Frodin, B.; Sardar, S.; Maldonado, H.; Maddox, C.; May, A.A. Comparison of Gasoline Direct-Injection (GDI) and Port Fuel Injection (PFI) Vehicle Emissions: Emission Certification Standards, Cold-Start, Secondary Organic Aerosol Formation Potential, and Potential Climate Impacts. Environ. Sci. Technol. 2017, 51, 6542–6552. [Google Scholar] [CrossRef]
  10. Baêta, J.G.C.; Pontoppidan, M.; Silva, T.R.V. Exploring the limits of a down-sized ethanol direct injection spark ignited engine in different configurations in order to replace high-displacement gasoline engines. Energy Convers. Manag. 2015, 105, 858–871. [Google Scholar] [CrossRef]
  11. Fcpl, A.; Rs, A.; Dr, B.; Agjl, C.; Sa, C.; Jwgt, C.; Vsc, D.; Jc, D.; Rfc, D.; Aa, E. The effect of fuel composition on particulate emissions from a highly boosted GDI engine—An evaluation of three particulate indices. Fuel 2019, 252, 598–611. [Google Scholar]
  12. Karavalakis, G.; Short, D.; Vu, D.; Villela, M.; Asa-Awuku, A.; Durbin, T.D. Evaluating the regulated emissions, air toxics, ultrafine particles, and black carbon from SI-PFI and SI-DI vehicles operating on different ethanol and iso-butanol blends. Fuel 2014, 128, 410–421. [Google Scholar] [CrossRef] [Green Version]
  13. Maricq, M.M.; Szente, J.J.; Jahr, K. The Impact of Ethanol Fuel Blends on PM Emissions from a Light-Duty GDI Vehicle. Aerosol Sci. Technol. 2012, 46, 576–583. [Google Scholar] [CrossRef]
  14. Zerboni, A.; Rossi, T.; Bengalli, R.; Catelani, T.; Rizzi, C.; Priola, M.; Casadei, S.; Mantecca, P. Diesel exhaust particulate emissions and in vitro toxicity from Euro 3 and Euro 6 vehicles. Environ. Pollut. 2022, 297, 118767. [Google Scholar] [CrossRef]
  15. Sileghem, L.; Bosteels, D.; May, J.; Favre, C.; Verhelst, S. Analysis of vehicle emission measurements on the new WLTC, the NEDC and the CADC. Transp. Res. Part D Transp. Environ. 2014, 32, 70–85. [Google Scholar] [CrossRef] [Green Version]
  16. Hunicz, J.; Medina, A. Experimental study on detailed emissions speciation of an HCCI engine equipped with a three-way catalytic converter. Energy 2016, 117, 388–397. [Google Scholar] [CrossRef]
  17. Yang, J.; Roth, P.; Durbin, T.D.; Johnson, K.C.; Cocker, D.R.; Asa-Awuku, A.; Brezny, R.; Geller, M.; Karavalakis, G. Gasoline Particulate Filters as an Effective Tool to Reduce Particulate and PAH Emissions from GDI Vehicles A Case Study with Two GDI Vehicles. Environ. Sci. Technol. 2018, 52, 3275–3284. [Google Scholar] [CrossRef]
  18. Myung, C.L.; Kim, J.; Jang, W.; Jin, D.; Park, S.; Lee, J. Nanoparticle Filtration Characteristics of Advanced Metal Foam Media for a Spark Ignition Direct Injection Engine in Steady Engine Operating Conditions and Vehicle Test Modes. Energies 2015, 8, 1865–1881. [Google Scholar] [CrossRef] [Green Version]
  19. Wang, Y.; Yin, H.; Wang, J.; Hao, C.; Xu, X.; Wang, Y.; Yang, Z.; Hao, L.; Tan, J.; Wang, X.; et al. China 6 moving average window method for real driving emission evaluation: Challenges, causes, and impacts. J. Environ. Manag. 2022, 319, 115737. [Google Scholar] [CrossRef]
  20. Oglieve, C.J.; Mohammadpour, M.; Rahnejat, H. Optimisation of the vehicle transmission and the gear-shifting strategy for the minimum fuel consumption and the minimum nitrogen oxide emissions. Proc. Inst. Mech. Eng. Part D J. Automob. Eng. 2017, 231, 883–899. [Google Scholar] [CrossRef] [Green Version]
  21. Pathak, S.K.; Sood, V.; Singh, Y.; Channiwala, S.A. Real world vehicle emissions: Their correlation with driving parameters. Transp. Res. Part D 2016, 44, 157–176. [Google Scholar] [CrossRef]
  22. Gao, J.; Wang, Y.; Chen, H.; Laurikko, J.; Liu, Y.; Pellikka, A.P.; Li, Y. Variations of significant contribution regions of NOx and PN emissions for passenger cars in the real-world driving. J. Hazard. Mater. 2022, 424, 127590. [Google Scholar] [CrossRef] [PubMed]
  23. Huang, R.; Ni, J.; Cheng, Z.; Wang, Q.; Shi, X.; Yao, X. Assessing the effects of ethanol additive and driving behaviors on fuel economy, particle number, and gaseous emissions of a GDI vehicle under real driving conditions. Fuel 2021, 306, 121642. [Google Scholar] [CrossRef]
  24. Yang, Z.; Ge, Y.; Thomas, D.; Wang, X.; Su, S.; Li, H.; He, H. Real driving particle number (PN) emissions from China-6 compliant PFI and GDI hybrid electrical vehicles. Atmos. Environ. 2019, 199, 70–79. [Google Scholar] [CrossRef]
  25. Ko, J.; Kim, K.; Chung, W.; Myung, C.-L.; Park, S. Characteristics of on-road particle number (PN) emissions from a GDI vehicle depending on a catalytic stripper (CS) and a metal-foam gasoline particulate filter (GPF). Fuel 2019, 238, 363–374. [Google Scholar] [CrossRef]
  26. Momenimovahed, A.; Handford, D.; Checkel, M.D.; Olfert, J.S. Particle number emission factors and volatile fraction of particles emitted from on-road gasoline direct injection passenger vehicles. Atmos. Environ. 2015, 102, 105–111. [Google Scholar] [CrossRef]
  27. Chen, L.; Stone, R. Measurement of Enthalpies of Vaporization of Isooctane and Ethanol Blends and Their Effects on PM Emissions from a GDI Engine. Energy Fuels 2011, 25, 1254–1259. [Google Scholar] [CrossRef]
  28. Wang, Y.; Hao, C.; Ge, Y.; Hao, L.; Tan, J.; Wang, X.; Zhang, P.; Wang, Y.; Tian, W.; Lin, Z.; et al. Fuel consumption and emission performance from light-duty conventional/hybrid-electric vehicles over different cycles and real driving tests. Fuel 2020, 278, 118340. [Google Scholar] [CrossRef]
  29. Chen, L.; Liang, Z.; Zhang, X.; Shuai, S. Characterizing particulate matter emissions from GDI and PFI vehicles under transient and cold start conditions. Fuel 2017, 189, 131–140. [Google Scholar] [CrossRef]
  30. Myung, C.-L.; Choi, K.; Cho, J.; Kim, K.; Baek, S.; Lim, Y.; Park, S. Evaluation of regulated, particulate, and BTEX emissions inventories from a gasoline direct injection passenger car with various ethanol blended fuels under urban and rural driving cycles in Korea. Fuel 2020, 262, 116406. [Google Scholar] [CrossRef]
  31. Shahariar, G.M.H.; Bodisco, T.A.; Zare, A.; Sajjad, M.; Jahirul, M.I.; Chu Van, T.; Bartlett, H.; Ristovski, Z.; Brown, R.J. Impact of driving style and traffic condition on emissions and fuel consumption during real-world transient operation. Fuel 2022, 319, 123874. [Google Scholar] [CrossRef]
  32. Kontses, A.; Triantafyllopoulos, G.; Ntziachristos, L.; Samaras, Z. Particle number (PN) emissions from gasoline, diesel, LPG, CNG and hybrid-electric light-duty vehicles under real-world driving conditions. Atmos. Environ. 2020, 222, 117126. [Google Scholar] [CrossRef]
  33. Karagöz, Y. Analysis of the impact of gasoline, biogas and biogas + hydrogen fuels on emissions and vehicle performance in the WLTC and NEDC. Int. J. Hydrogen Energy 2019, 44, 31621–31632. [Google Scholar] [CrossRef]
  34. Yinhui, W.; Rong, Z.; Yanhong, Q.; Jianfei, P.; Mengren, L.; Jianrong, L.; Yusheng, W.; Min, H.; Shijin, S. The impact of fuel compositions on the particulate emissions of direct injection gasoline engine. Fuel 2016, 166, 543–552. [Google Scholar] [CrossRef]
  35. Pirjola, L.; Karjalainen, P.; Heikkila, J.; Saari, S.; Tzamkiozis, T.; Ntziachristos, L.; Kulmala, K.; Keskinen, J.; Ronkko, T. Effects of fresh lubricant oils on particle emissions emitted by a modern gasoline direct injection passenger car. Environ. Sci. Technol. 2015, 49, 3644–3652. [Google Scholar] [CrossRef]
  36. Mohsin, R.; Chen, L.; Felix, L.; Ding, S. A Review of Particulate Number (PN) Emissions from Gasoline Direct Injection (GDI) Engines and Their Control Techniques. Energies 2018, 11, 1417. [Google Scholar]
  37. Leone, T.G.; Anderson, J.E.; Davis, R.S.; Iqbal, A.; Reese, R.A.; Shelby, M.H.; Studzinski, W.M. The Effect of Compression Ratio, Fuel Octane Rating, and Ethanol Content on Spark-Ignition Engine Efficiency. Environ. Sci. Technol. 2015, 49, 10778–10789. [Google Scholar] [CrossRef]
  38. He, X.; Ratcliff, M.A.; Zigler, B.T. Effects of Gasoline Direct Injection Engine Operating Parameters on Particle Number Emissions. Energy Fuels 2012, 26, 2014–2027. [Google Scholar] [CrossRef]
  39. Hu, R.; Zhang, F.; Peng, Z.; Pei, Y. The NOx emission characteristics of gasoline vehicles during transient driving cycles. Transp. Res. Part D Transp. Environ. 2022, 109, 103386. [Google Scholar] [CrossRef]
  40. Lou, D.; Ren, Y.; Li, X.; Zhang, Y.; Sun, X. Effect of Operating Conditions and TWC Parameters on Emissions Characteristics of a Stoichiometric Natural Gas Engine. Energies 2020, 13, 4905. [Google Scholar] [CrossRef]
  41. O’Driscoll, R.; Stettler, M.E.J.; Molden, N.; Oxley, T.; ApSimon, H.M. Real world CO2 and NOx emissions from 149 Euro 5 and 6 diesel, gasoline and hybrid passenger cars. Sci. Total Environ. 2018, 621, 282–290. [Google Scholar] [CrossRef] [PubMed]
  42. Myung, C.-L.; Kim, J.; Choi, K.; Hwang, I.G.; Park, S. Comparative study of engine control strategies for particulate emissions from direct injection light-duty vehicle fueled with gasoline and liquid phase liquefied petroleum gas (LPG). Fuel 2012, 94, 348–355. [Google Scholar] [CrossRef]
  43. Chu, M.; Brimblecombe, P.; Wei, P.; Liu, C.-H.; Du, X.; Sun, Y.; Yam, Y.S.; Ning, Z. Kerbside NOx and CO concentrations and emission factors of vehicles on a busy road. Atmos. Environ. 2022, 271, 118878. [Google Scholar] [CrossRef]
  44. Wang, Y.; Zhao, H.; Yin, H.; Yang, Z.; Hao, L.; Tan, J.; Wang, X.; Zhang, M.; Li, J.; Lyu, L.; et al. Quantitative study of vehicle CO2 emission at various temperatures and road loads. Fuel 2022, 320, 123911. [Google Scholar] [CrossRef]
  45. Xu, J.; Tu, R.; Wang, A.; Zhai, Z.; Hatzopoulou, M. Generation of spikes in ultrafine particle emissions from a gasoline direct injection vehicle during on-road emission tests. Environ. Pollut. 2020, 267, 115695. [Google Scholar] [CrossRef] [PubMed]
Figure 1. Test scheme.
Processes 11 00066 g001
Figure 2. Operation distribution vs. vehicle speed and acceleration.
Processes 11 00066 g002
Figure 3. Operation distribution vs. engine speed and torque.
Processes 11 00066 g003
Figure 4. Operation distribution vs. vehicle speed and throttle opening.
Processes 11 00066 g004
Figure 5. PN emission rates vs. vehicle speed and acceleration.
Processes 11 00066 g005
Figure 6. PN emission rates vs. engine speed and torque.
Processes 11 00066 g006
Figure 7. PN emission rates vs. vehicle speed and throttle opening.
Processes 11 00066 g007
Figure 8. NOx concentration vs. vehicle speed and acceleration.
Processes 11 00066 g008
Figure 9. NOx concentration vs. engine speed and torque.
Processes 11 00066 g009
Figure 10. NOx concentration vs. vehicle speed and throttle opening.
Processes 11 00066 g010
Figure 11. CO2 concentration vs. vehicle speed and acceleration.
Processes 11 00066 g011
Figure 12. CO2 concentration vs. engine speed and torque.
Processes 11 00066 g012
Figure 13. CO2 concentration vs. vehicle speed and throttle opening.
Processes 11 00066 g013
Figure 14. Average PN emission.
Processes 11 00066 g014
Figure 15. Average NOx concentration.
Processes 11 00066 g015
Figure 16. Average CO2 concentration.
Processes 11 00066 g016
Table 1. Specifications of the three GDI vehicles.
Car MakerVolks WagenwerkPeugeotFord
ModelGolfPeugeot-2008Focus
Manufacture year201520192017
Fuel deliveryDirect injectionDirect injectionDirect injection
AspirationTurbochargedTurbochargedTurbocharged
Engine size/L1.01.21.5
Max. power/kW89.7110132.4
After-treatmentGaseousTWCTWCTWC
ParticlesN.A.GPFN.A.
Emission standardsEuro-6aEuro-6dEuro-6c
Gear number (type)5 (M)5 (A)6 (M)
Type approval cycleNEDCWLTCWLTC
Type approval NOx (mg/km)4017.534.1
Type approval PN (1011 #/km)N.A.4.21.08
Type approval CO2 (g/km)99153115
Disclaimer/Publisher’s Note: The statements, opinions and data contained in all publications are solely those of the individual author(s) and contributor(s) and not of MDPI and/or the editor(s). MDPI and/or the editor(s) disclaim responsibility for any injury to people or property resulting from any ideas, methods, instructions or products referred to in the content.

