
Productivity Improvement Using Simulated Value Stream Mapping: A Case Study of the Truck Manufacturing Industry

Abstract
:1. Introduction
2. Literature Review
3. Materials and Methods
3.1. Materials
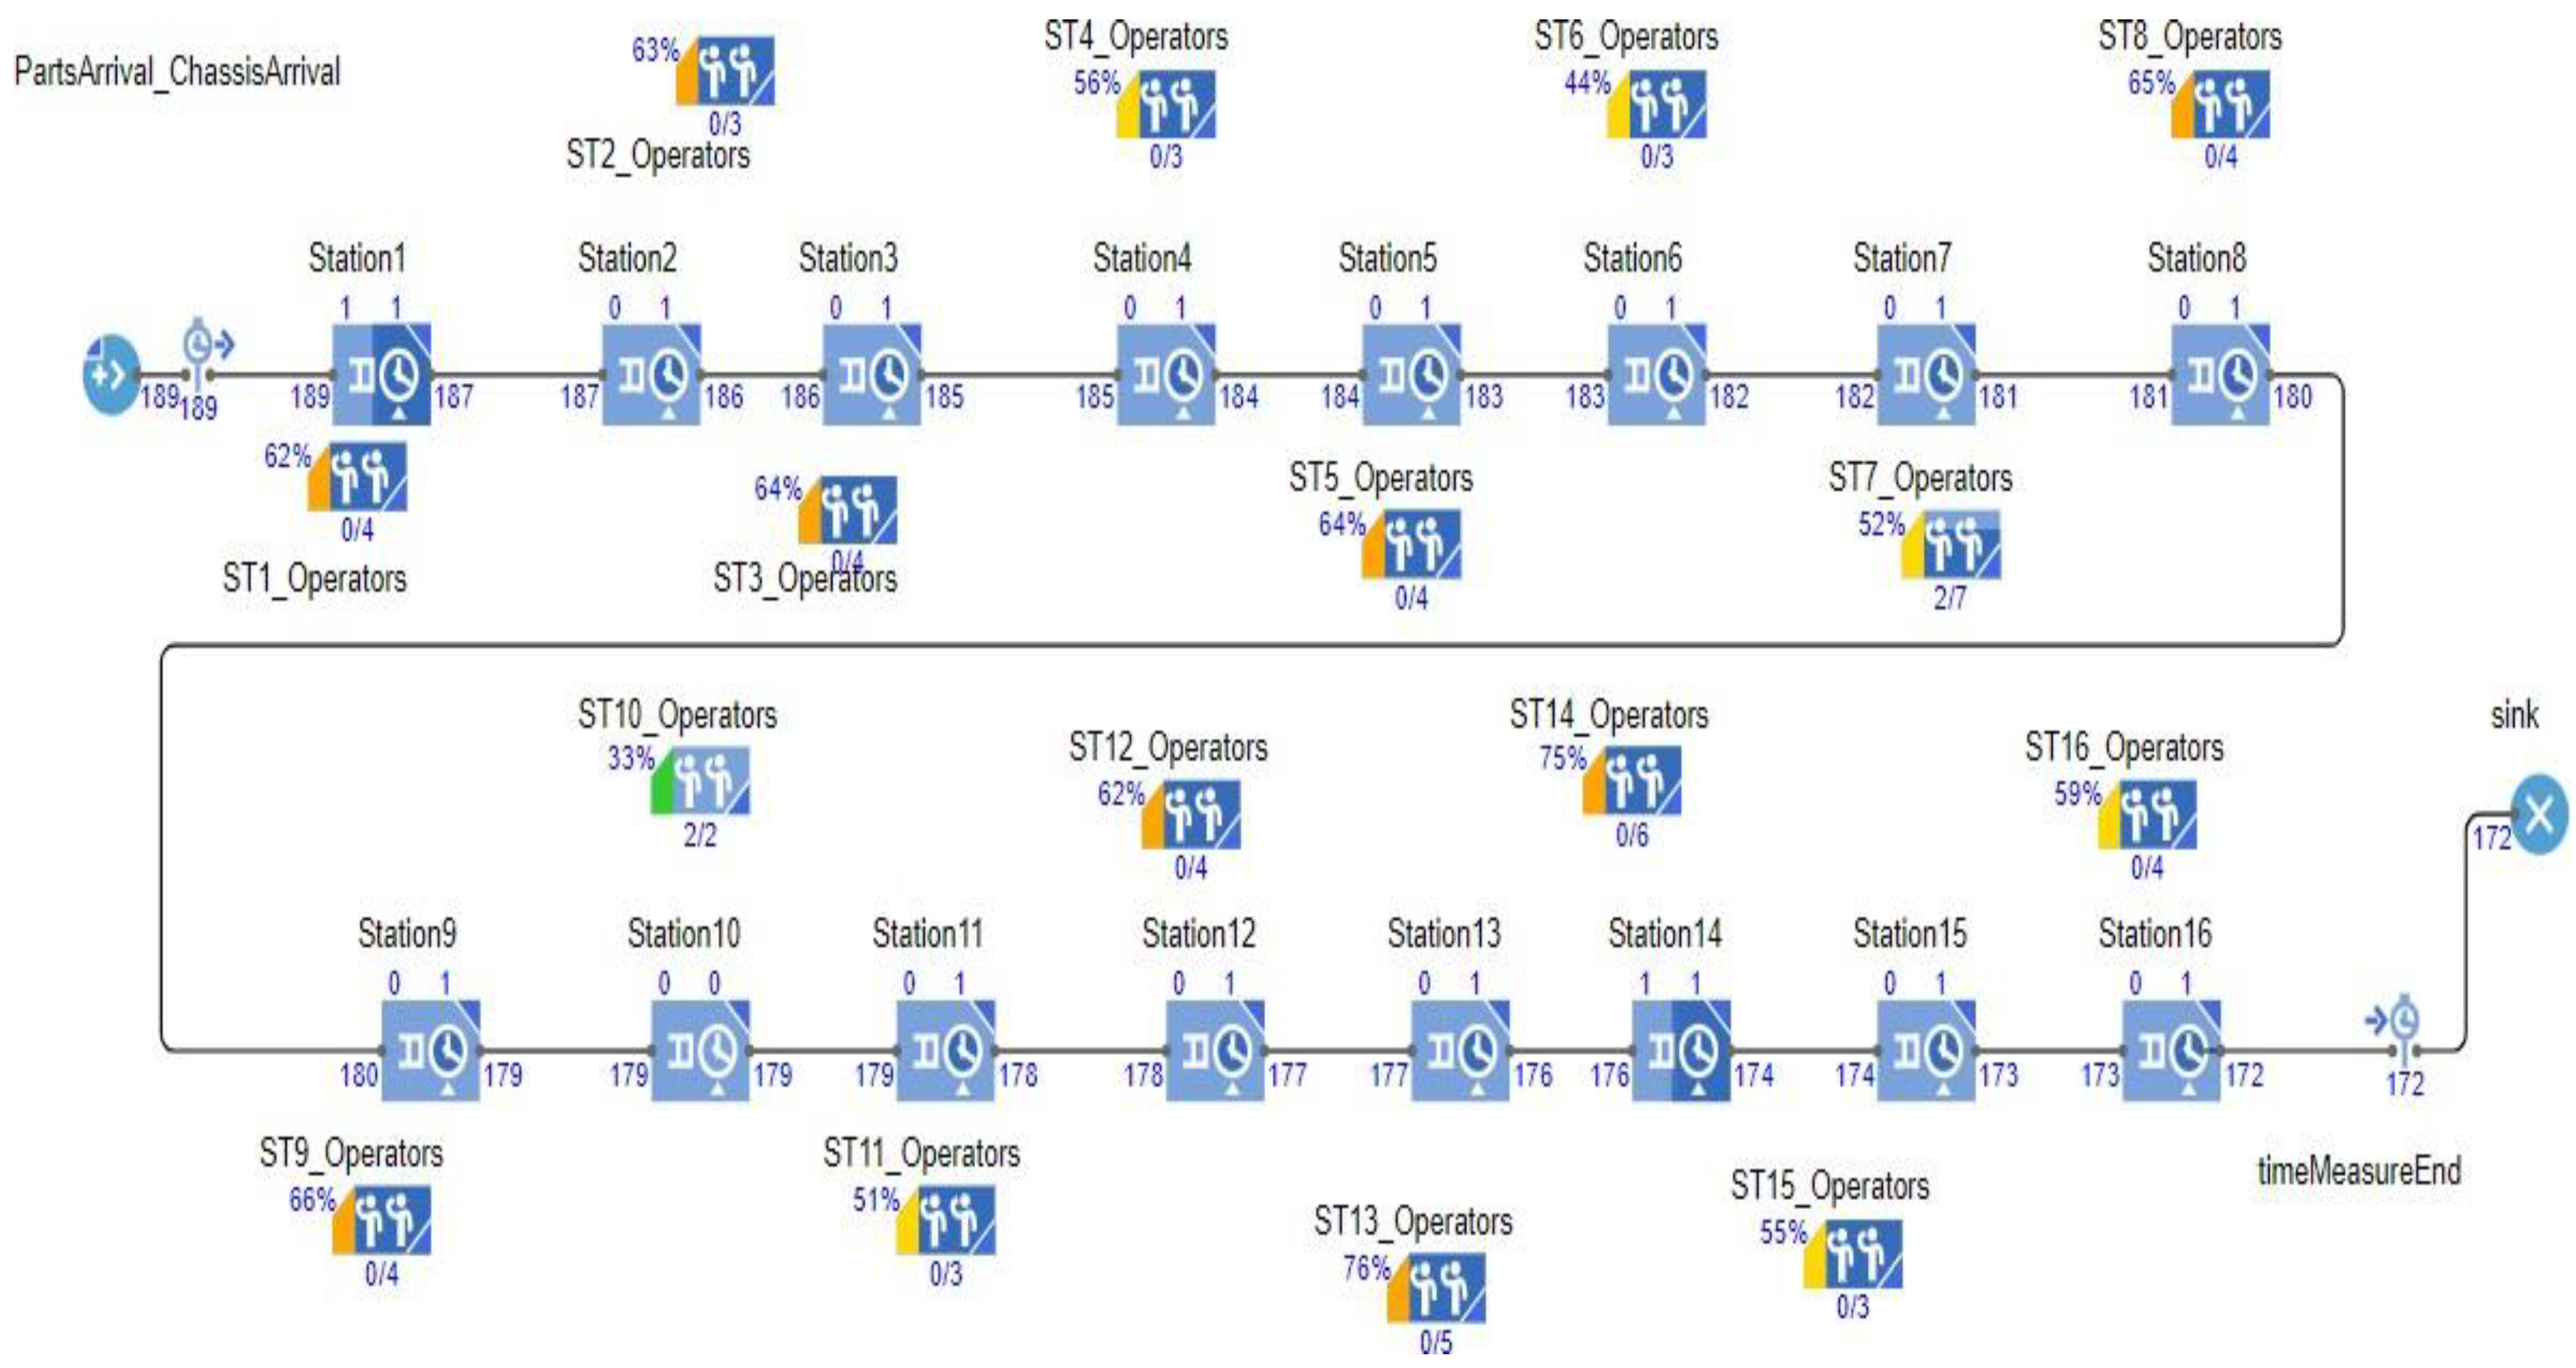
Current State VSM
3.2. Methods
Distribution Factor to the Assembly Line
4. Results
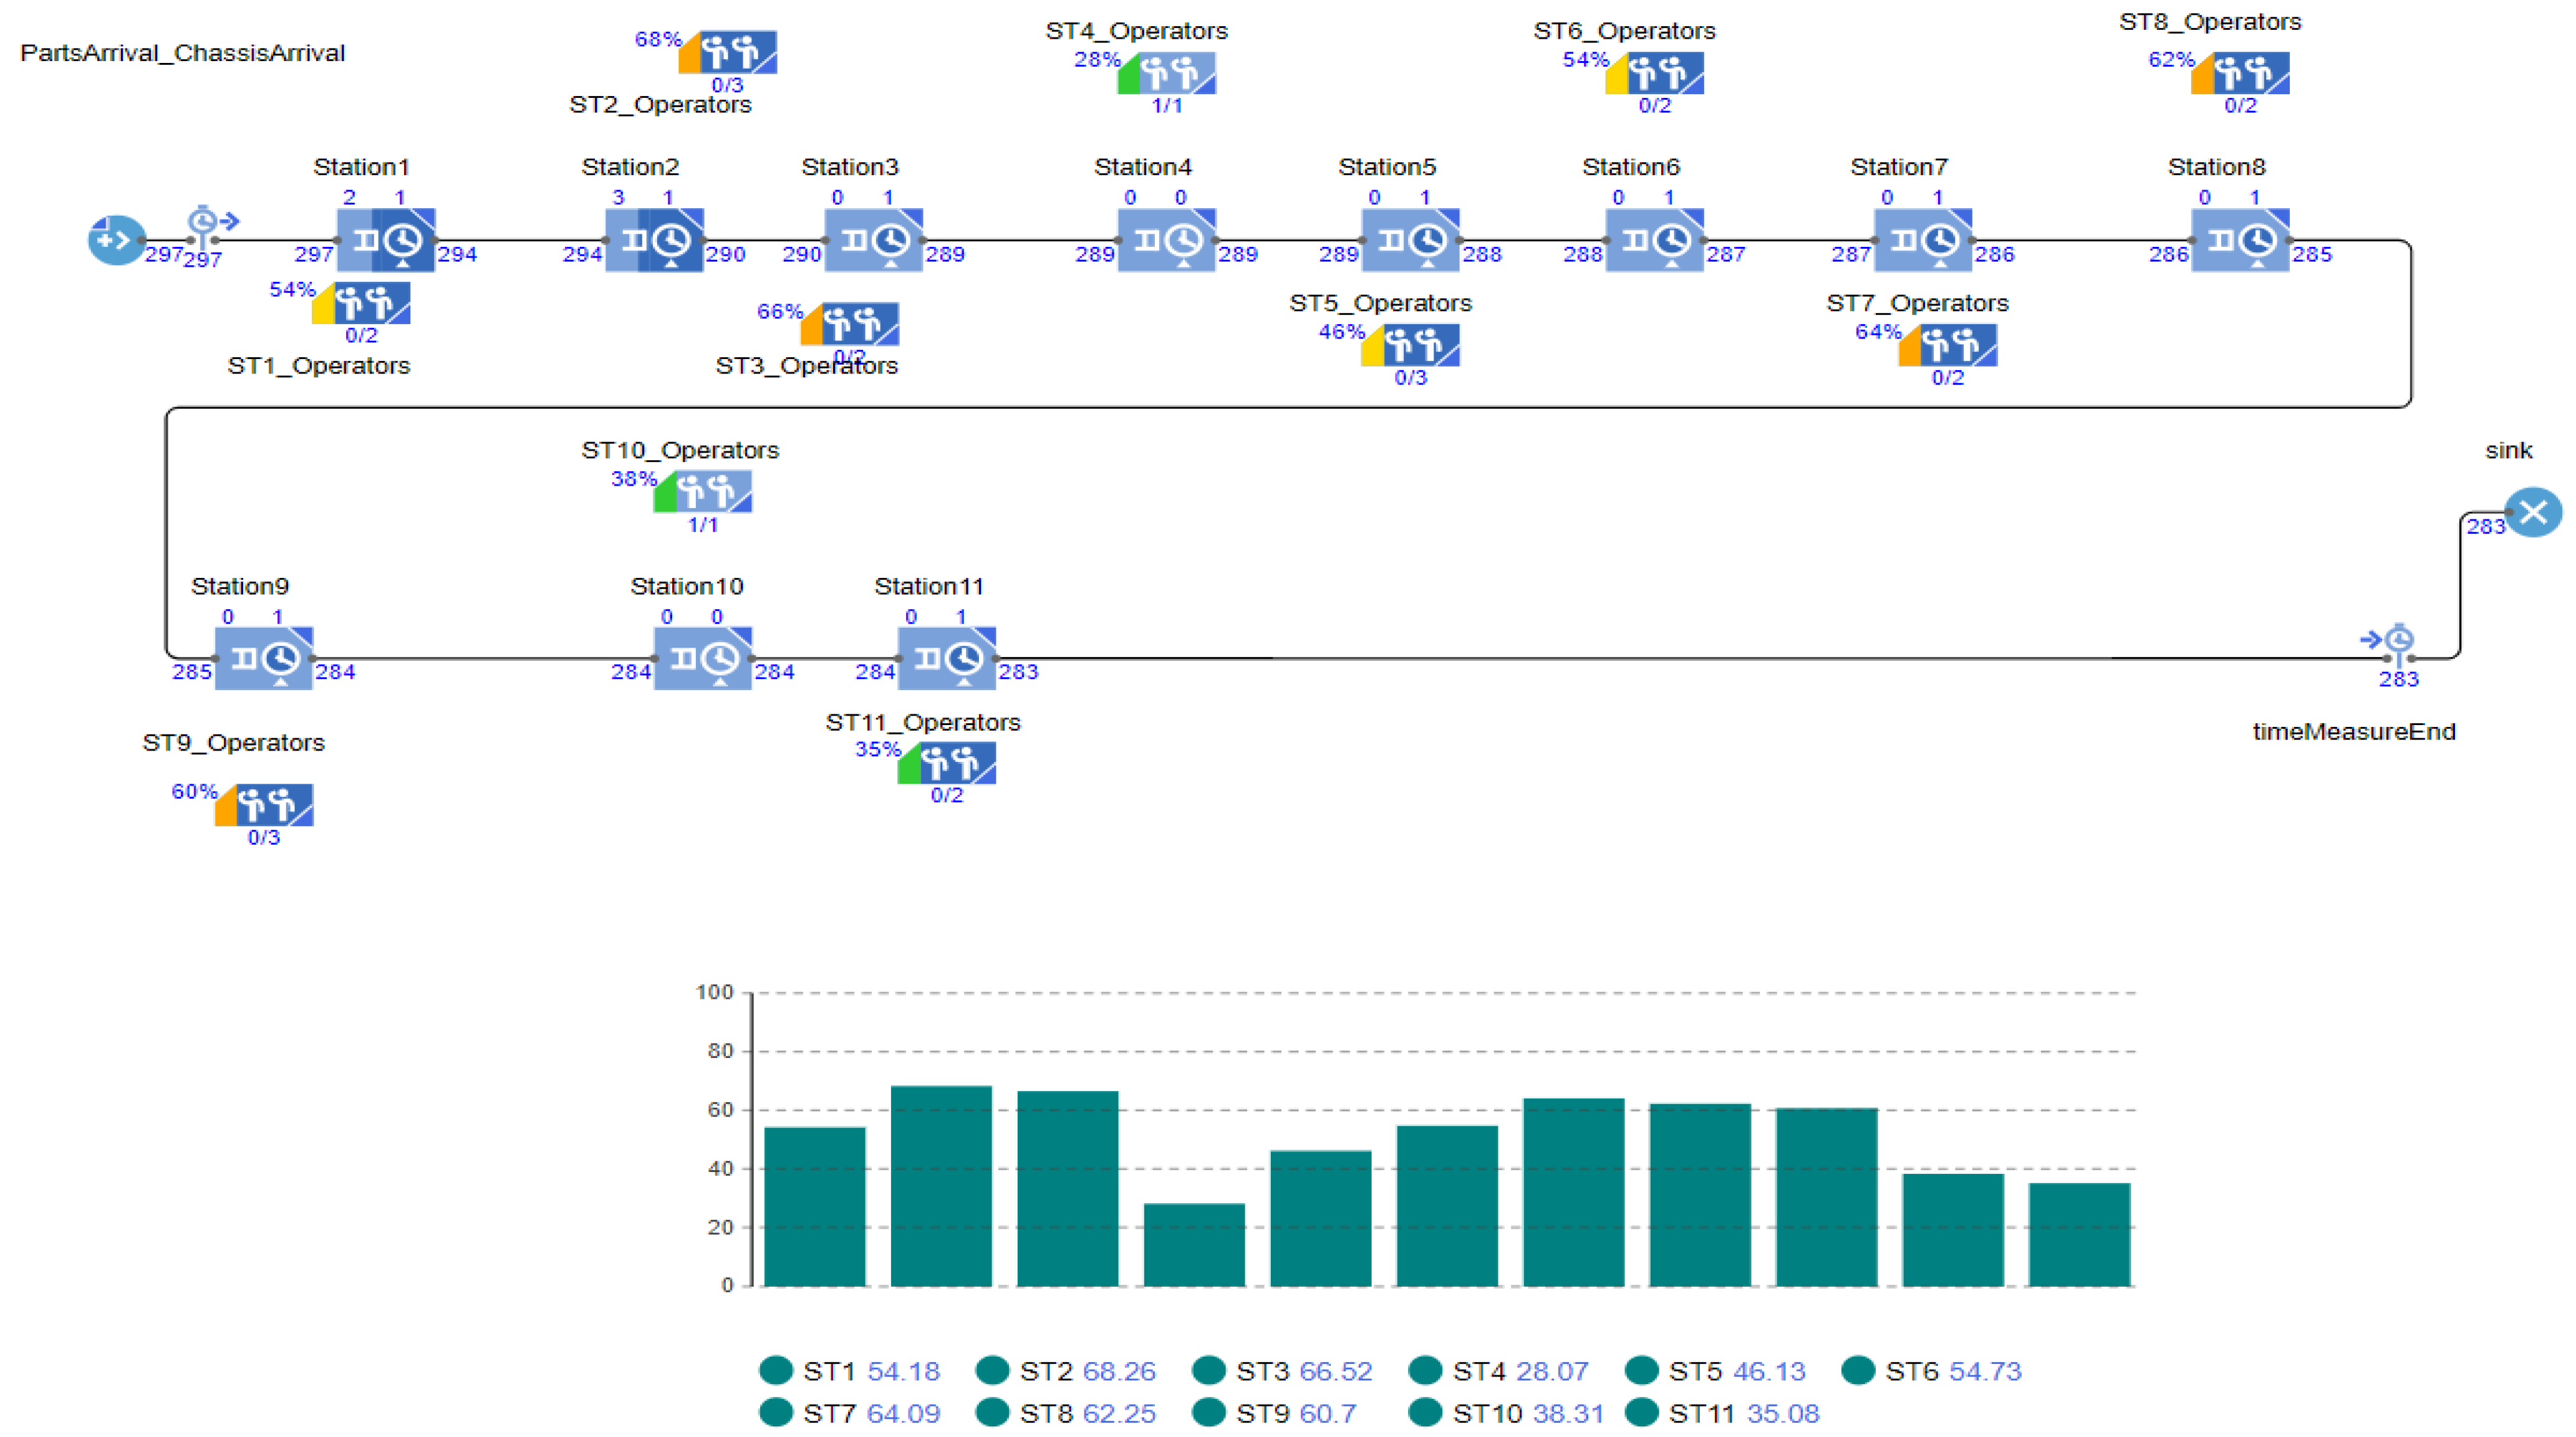
4.1. Future State VSM—Effective Production Process to Improve Productivity
4.2. Effective Application of Lean Manufacturing in the Automotive Industry
5. Systematic Analysis of the Production System
5.1. Productivity Improvement through SVSM
5.2. Results of Productivity Improvement through SVSM
5.3. Material Handling Support to Improve Productivity
6. Conclusions
Author Contributions
Funding
Data Availability Statement
Acknowledgments
Conflicts of Interest
References
- Dierkes, S.; Siepelmeyer, D. Production and cost theory-based material flow cost accounting. J. Clean Prod. 2019, 235, 483–492. [Google Scholar] [CrossRef]
- Sharma, D. Application of Value Stream Mapping in Papad Manufacturing. Int. J. Res. Appl. Sci. Eng. Technol. 2018, 6, 874–878. [Google Scholar] [CrossRef]
- Azemi, F.; Luji, R.; Šimunovi, G.; Tokody, D. Selection the Basic Lean Manufacturing Techniques in Developing the Model for Industry 4.0 in Kosovo Manufacturing Industry. Proceedings 2020, 63, 3062. [Google Scholar] [CrossRef]
- Al-Akel, K.; Marian, L.O. proceedings The Lean Six Sigma Algorithm-A Pathway for Decreasing the Continuous Improvement Projects Failure Rate. Proceedings 2020, 63, 47. [Google Scholar] [CrossRef]
- Colim, A.R.; Morgado, P.; Carneiro, N.; Costa, C.; Faria, N.; Sousa, L.; Rocha, A.; Arezes, P. Lean Manufacturing and Ergonomics Integration: Defining Productivity and Wellbeing Indicators in a Human–Robot Workstation. Sustainability 2021, 13, 1931. [Google Scholar] [CrossRef]
- Parv, L.; Deaky, B.; Nasulea, M.D.; Oancea, G. Agent-Based Simulation of Value Flow in an Industrial Production. Process 2019, 7, 82. [Google Scholar] [CrossRef]
- Venugopal, P.V.; Sigma, L.S.; Micro, T. Ranking of the seven wastes (Muda) for Lean Six Sigma Implementation in Indian SMEs. Int. J. Appl. Eng. Res. 2019, 14, 1269–1274. [Google Scholar]
- Shou, W.; Wang, J.; Wu, P.; Wang, X.; Chong, H.Y. A cross-sector review on the use of value stream mapping. Int. J. Prod. Res. 2017, 55, 3906–3928. [Google Scholar] [CrossRef]
- Seth, D.; Seth, N.; Dhariwal, P. Application of value stream mapping (VSM) for lean and cycle time reduction in complex production environments: A case study. Prod. Plan. Control. 2017, 28. [Google Scholar] [CrossRef]
- Sobuj, K.M.M.R.; Rahman, C.M.L. (Vsm) Technique Application in a Selected Garments Factory of Bangladesh. Int. J. Eng. Res. Gen. Sci. 2015, 3, 998–1007. [Google Scholar]
- Lugert, A.; Völker, K.; Winkler, H. Dynamization of Value Stream Management by technical and managerial approach. Procedia CIRP 2018, 72, 701–706. [Google Scholar] [CrossRef]
- Bhatwadekar, S.; Ghodawat, S. Value Stream Mapping: Simulation Approach; International Journal of Emerging Technologies and Applications in Engineering, Technology and Sciences (IJ-ETA-ETS), KITRC Kalol-382721; Gujarat, India, 2015; pp. 38–43. ISSN 0974-3588. [Google Scholar]
- De Souza, L.B.; Tortorella, G.L.; Cauchick-miguel, P.A.; Nascimento, D. Application of Value Stream Mapping and Monte Carlo Simulation in a University Hospital. In Proceedings of the International Conference on Industrial Engineering and Operations Management, Paris, France, 26–27 July 2018; IEOM Society International: Southfield, MI, USA; pp. 596–606. [Google Scholar]
- Kotturu, C.M.V.V.; Mahanty, B. Determinants of SME integration into global value chains: Evidence from Indian automotive component manufacturing industry. J. Adv. Manag. Res. 2017, 14, 313–331. [Google Scholar] [CrossRef]
- Antosz, K.; Stadnicka, D. Lean Philosophy Implementation in SMEs—Study Results. Procedia Eng. 2017, 182, 25–32. [Google Scholar] [CrossRef]
- Matthews, R.L.; MacCarthy, B.; Braziotis, L.C. Organisational learning in SMEs: A process improvement perspective. Int. J. Oper. Prod. Manag. 2017, 37, 970–1006. [Google Scholar] [CrossRef]
- Zeng, W.; Baafi, E.; Walker, D. A simulation model to study bunching effect of a truck-shovel system. Int. J. Min. Reclam. Environ. 2019, 33, 102–117. [Google Scholar] [CrossRef]
- Antonelli, D.; Litwin, P.; Stadnicka, D. Multiple System Dynamics and Discrete Event Simulation for manufacturing system performance evaluation. Procedia CIRP 2018, 78, 178–183. [Google Scholar] [CrossRef]
- Frazzon, E.M.; Albrecht, A.; Pires, M.; Israel, E.; Kück, M.; Freitag, M. Hybrid approach for the integrated scheduling of production and transport processes along supply chains. Int. J. Prod. Res. 2018, 56, 2019–2035. [Google Scholar] [CrossRef]
- Li, H.; Yang, H.; Yang, B.; Zhu, C.; Yin, S. Modelling and simulation of energy consumption of ceramic production chains with mixed flows using hybrid petri nets. Int. J. Prod. Res. 2018, 56, 3007–3024. [Google Scholar] [CrossRef]
- Nikolakis, N.; Alexopoulos, K.; Xanthakis, E.; Chryssolouris, G. The digital twin implementation for linking the virtual representation of human-based production tasks to their physical counterpart in the factory-floor. Int. J. Comput. Integr. Manuf. 2019, 32, 1–12. [Google Scholar] [CrossRef]
- Liu, Q.; Yang, H.; Xin, Y. Applying value stream mapping in an unbalanced production line: A case study of a Chinese food processing enterprise. Qual. Eng. 2019, 32, 111–123. [Google Scholar] [CrossRef]
- Sayid mia, M.A. Implementation of Lean Manufacturing Tools in Footwear Industry of Bangladesh. Asp. Min. Miner. Sci. 2018, 1, 1–9. [Google Scholar] [CrossRef]
- Kammer Christensen, M.; Janardhanan, M.N.; Nielsen, P. Heuristics for solving a multi-model robotic assembly line balancing problem. Prod. Manuf. Res. 2017, 5, 410–424. [Google Scholar] [CrossRef] [Green Version]
- Agarwal, D.; Katiyar, A. Value Stream Mapping: Literature Review and Implementation for An Assembly Line. Int. J. Eng. Sci. Invent. 2018, 7, 60–66. [Google Scholar]
- Kovács, G.; Kot, S. Facility layout redesign for efficiency improvement and cost reduction. J. Appl. Math. Comput. Mech. 2017, 16, 63–74. [Google Scholar] [CrossRef]
- Quan, Y.; Alfnes, E.; Brekken, H.G.; Eide, M.M. A Simulation Enhanced VSM Approach for High-Mix Manufacturing Environment. In Proceedings of the 6th International Workshop of Advanced Manufacturing and Automation; Advances in Economics, Business and Management Research; Atlantis Press: Iwama, Japan, 2016; pp. 103–106. [Google Scholar] [CrossRef]
- Chen, Z.; He, Y.; Zhao, Y.; Han, X.; He, Z.; Xu, Y.; Zhang, A. Mission reliability evaluation based on operational quality data for multistate manufacturing systems. Int. J. Prod. Res. 2019, 57, 1840–1856. [Google Scholar] [CrossRef]
- Gu, C.; He, Y.; Han, X. A Novel Approach for Mission Reliability Modeling of Manufacturing System Based on the State Change of Machines and Materials. Procedia CIRP 2016, 57, 286–291. [Google Scholar] [CrossRef]
- Sabadka, D.; Molnar, V.; Fedorko, G.; Jachowicz, T. Optimization of Production Processes Using the Yamazumi Method. Adv. Sci. Technol. Res. J. 2017, 11, 175–182. [Google Scholar] [CrossRef]
- Adeodu, A.; Kanakana-Katumba, M.G.; Rendani, M. Implementation of lean six sigma for production process optimization in a paper production company. J. Ind. Eng. Manag. 2021, 14, 661–680. [Google Scholar] [CrossRef]


| Station | Process | No. of Op | FKI | NVA | VA | PO2 | NVA | VA | JU3 | NVA | VA |
|---|---|---|---|---|---|---|---|---|---|---|---|
| 1 | CA | 4 | 28 | 10.08 | 17.92 | 30 | 10.8 | 19.2 | 24 | 8.64 | 15.36 |
| 2 | PE | 3 | 27 | 12.15 | 14.85 | 23 | 10.35 | 12.65 | 28 | 12.6 | 15.4 |
| 3 | FS | 4 | 27 | 10.8 | 16.2 | 32 | 12.8 | 19.2 | 37 | 14.8 | 22.2 |
| 4 | ROU | 3 | 27 | 11.34 | 15.66 | 23 | 9.66 | 13.34 | 30 | 12.6 | 17.4 |
| 5 | R&F | 4 | 36 | 13.32 | 22.68 | 25 | 9.25 | 15.74 | 31 | 11.47 | 19.53 |
| 6 | ASS | 3 | 24 | 10.56 | 13.44 | 18 | 7.92 | 10.08 | 23 | 10.12 | 12.88 |
| 7 | ASL | 5 | 39 | 14.04 | 24.96 | 32 | 11.52 | 20.48 | 31 | 11.16 | 19.84 |
| 8 | CM | 4 | 34 | 15.64 | 18.36 | 32 | 14.72 | 17.28 | 29 | 13.34 | 15.66 |
| 9 | CP | 4 | 30 | 15 | 15 | 34 | 17 | 17 | 34 | 17 | 17 |
| 10 | DS | 2 | 12 | 9.12 | 2.88 | 12 | 9.12 | 2.88 | 12 | 9.12 | 2.88 |
| 11 | EAS | 3 | 27 | 10.26 | 16.74 | 29 | 11.02 | 17.98 | 18 | 6.84 | 11.6 |
| 12 | CAB | 4 | 46 | 14.26 | 31.74 | 22 | 6.82 | 15.18 | 33 | 10.23 | 22.77 |
| 13 | FF | 5 | 41 | 9.43 | 31.57 | 41 | 9.43 | 31.49 | 41 | 9.43 | 31.57 |
| 14 | BHB | 6 | 27 | 7.02 | 19.98 | 67 | 17.42 | 49.58 | 47 | 12.22 | 34.78 |
| 15 | PFV | 3 | 31 | 17.05 | 13.95 | 21 | 11.55 | 9.45 | 24 | 13.2 | 10.8 |
| 16 | VFQ | 4 | 30 | 6.3 | 23.7 | 30 | 6.3 | 23.7 | 30 | 6.3 | 23.7 |
| Schedule Target | Available Time (min) | TAKT Time (min) |
|---|---|---|
| Daily | 9 | 48.3 |
| Weekly | 45 | 48.3 |
| Monthly | 180 | 48.3 |
| Mixed Models | Total Cycle Time (Minutes) | Total Throughput/Day | Monthly Throughput | Monthly Target |
|---|---|---|---|---|
| FKI | 486 | 8.05 | 161 | 180 |
| PO2 | 471 | 8.3 | 166 | 180 |
| JU3 | 472 | 8.29 | 165.8 | 180 |
Publisher’s Note: MDPI stays neutral with regard to jurisdictional claims in published maps and institutional affiliations. |
© 2022 by the authors. Licensee MDPI, Basel, Switzerland. This article is an open access article distributed under the terms and conditions of the Creative Commons Attribution (CC BY) license (https://creativecommons.org/licenses/by/4.0/).
Share and Cite
Poswa, F.; Adenuga, O.T.; Mpofu, K. Productivity Improvement Using Simulated Value Stream Mapping: A Case Study of the Truck Manufacturing Industry. Processes 2022, 10, 1884. https://doi.org/10.3390/pr10091884
Poswa F, Adenuga OT, Mpofu K. Productivity Improvement Using Simulated Value Stream Mapping: A Case Study of the Truck Manufacturing Industry. Processes. 2022; 10(9):1884. https://doi.org/10.3390/pr10091884
Chicago/Turabian StylePoswa, Fikile, Olukorede Tijani Adenuga, and Khumbulani Mpofu. 2022. "Productivity Improvement Using Simulated Value Stream Mapping: A Case Study of the Truck Manufacturing Industry" Processes 10, no. 9: 1884. https://doi.org/10.3390/pr10091884