Article

Gas Flow and Ablation of 122 mm Supersonic Rocket Nozzle Investigated by Conjugate Heat Transfer Analysis

by
Jatuporn Thongsri
1,*,
Kamonwan Srathonghuam
1 and
Adulyasak Boonpan
2
1
College of Advanced Manufacturing Innovation, King Mongkut’s Institute of Technology Ladkrabang, Bangkok 10520, Thailand
2
Propulsion System Division, Defence Technology Institute, Pak Kret, Nonthaburi 11120, Thailand
*
Author to whom correspondence should be addressed.
Processes 2022, 10(9), 1823; https://doi.org/10.3390/pr10091823
Submission received: 1 August 2022 / Revised: 25 August 2022 / Accepted: 5 September 2022 / Published: 9 September 2022
(This article belongs to the Special Issue Advanced Combustion and Combustion Diagnostic Techniques)

Abstract

:
The propellant gas flow of a supersonic rocket in inappropriate operating conditions can cause excessive ablation inside a nozzle. In this research, conjugate heat transfer analysis (CHTA), consisting of computational fluid dynamics (CFD) and finite element analysis (FEA), was applied to investigate the gas flow and ablation of a 122 mm nozzle as a case study in the transient state, based on actual operating conditions. First, the nozzle was tested in a static experiment. Then, the experimental results were employed for CHTA settings and validation. Next, after completing the CFD calculation, the results revealed that the nozzle’s gas flow, temperature, pressure, Mach number, shock, etc. were consistent with theoretical results. Finally, using the CFD results as loads, the FEA results showed the equivalent von Mises stress (σv), which was consistent with the ablation results from the experiment, as expected. The more the σv, the greater the ablation. Both σv and ablation were high near the throat and decreased further away. In addition, increasing the insulators’ thickness reduced σv, leading to ablation reduction. The research findings contribute to an understanding of ablation and the methodology of employing CHTA to improve the design of 122 mm and other nozzles with reduced ablation for higher efficacy.

1. Introduction

When a supersonic rocket operates, its movement is caused by thrust, occurring from the reaction of propellant combustion. A rocket’s propellant can be divided into three main categories, solid-propellant, liquid-propellant, and hybrid-propellant rockets. A solid-propellant rocket is commonly employed for the military because of its uncomplicated operating system and condition, higher operational stability, more extended lifetime usage, and it is cheaper than other rocket propellants; however, it also causes excessive ablation. Since the supersonic rocket requires propellant combustion, generating very high temperature and pressure, the nozzle is an essential component that must be designed to achieve high efficacy in a mission. However, if one supposes that it is designed and developed in a way that is inconsistent with the mission, in this case, it will lead to improper gas flow behavior and heat transfer, resulting in excessive ablation and low mission performance.
The 122 mm rocket is used in many countries. Currently, Thailand is one of the countries that have deployed rockets of this size for many missions due to their high performance and suitability for more prolonged-range battles compared to cannons. For this type of rocket, if the range is more than 40 km, Thai manufacturer-designed thermal insulation inside the nozzle will degrade from excessive ablation, since its insulation is subjected to a large amount of heat and a long operational time, leading to decreased efficiency. Therefore, developing this type of nozzle that exhibits less ablation is a problem that needs to be addressed urgently. Since the development of the supersonic rocket nozzle involves armament-related knowledge, it is of great commercial importance and is, therefore, difficult to disclose in academia. It only partially exists if it is revealed and reported in academic articles. It is not yet complete and cannot apply to solve the problem of excessive ablation in the 122 mm nozzle of the authors’ interest. Therefore, if Thai researchers have accurate knowledge and methodology for solving the mentioned problem, our country will reduce dependence on foreign technology, save the budget for importing the nozzle and will make high-performance rockets for sustainable missions. Figure 1 illustrates samples of the 122 mm supersonic rocket nozzle (a) before and (b) after the mission. The nozzle, after a long-range mission, exhibits excessive ablation. In (b), the nozzle was damaged, shown by the black color, due to excessive ablation that the thermal insulation inside could not resist until the outermost aluminum layer was burned and ablated to a charcoal layer.
This article aims to solve the excessive ablation in a problematic nozzle, a 122 supersonic rocket nozzle, and find a potential tool, including a suitable methodology, for developing the nozzle. A literature review found that solving this problem required an understanding and knowledge of the problematic nozzle’s gas flow behavior and ablation. Examples of research studies on the mentioned subject are reported as follows.
For the gas flow study, computational fluid dynamics (CFD) was used to investigate the gas flow behavior of various nozzles’ shapes. These studies showed that the nozzles’ shapes and operating conditions affected the gas flow, resonance, shock wave, temperature, pressure, etc., impacting the nozzles’ performances [1,2,3,4,5,6,7]. For the ablation study, there were several methods for studying the ablation of nozzles that can be classified at least into two groups, experiments [8,9] and simulations [10,11,12,13]. In addition, these include example-based experiments, for example Sae-ngow et al. [8] who experimented with ablation in a supersonic rocket nozzle in static. They reported that a silica phenolic composite was more suitable as a thermal insulator than rubber insulator composite as it exhibited less ablation under the same operating condition. Hui et al. [9] also experimented with a de Laval nozzle. They confirmed that the ablation depends on the nozzle’s design and gas flow behavior and also reported that the maximum ablation was in the throat. The experiment was time-consuming and costly, despite the reliable results, so many researchers focused on the second group using computer simulation. For example, Cross and Boyd [10] employed a Fortran program called SENKIN to calculate the ablation that occurred in the HIPPO nozzle. In their report, the ablation could be calculated from equations and constants related to chemical reactions known as “species.” The limitation of this research was that researchers needed to know the Fortran language, a large number of species, and an understanding of the chemical reactions that take place in the combustion chamber for accurate calculation results. To avoid the mentioned limitation, they later presented an ablation calculation using a research protocol that included the LEMANS solver and material response, combined with an algorithm designed and used exclusively by their research group, which yielded credible ablation results [11]. However, the limitation of this research was that it was difficult for external researchers to develop it further because the research methodology and code employed were not disclosed. The next widely popular method was the use of CFD commercial software. The major advantage of this method is that users can easily apply it to many applications [12]. From the author’s experience, an essential limitation of this method is the restriction on material properties to study ablation in solids due to gas flow. For example, the CFD software has a few material types and does not support nonlinear structural materials. If used, it requires added external codes to achieve precise results. Therefore, with a large number of materials, it is more challenging to use and complex. Therefore, it can be suitably applied for the simple shape of the nozzle with less structural material with linearity material. The last method involves coupling between the CFD and finite element analysis (FEA) called “conjugate heat transfer analysis (CHTA)” [11,12,13,14,15]. This method CFD was used to calculate gas flow in the fluid domain. The CFD results were forwarded as loads to investigate heat transfer in the solid domain using the FEA, resulting in the ablation at the end for analysis. Generally, the FEA software has highlighted many material types to choose from automatically from a software library, supports nonlinearity materials without added external codes, and easily customizes the structural properties. Accordingly, the FEA helps the CHTA to be more suitable than the CFD in investigating the ablation. Significantly, the crucial advantage of the CHTA is the production of accurate results using less computational resources than using the CFD only under the same conditions. Moreover, the CHTA is also suitable for simulation in complex nozzle shapes consisting of many structural material types and large sizes by displaying more variables than the CFD, such as heat flux, stress, strain, equivalent stress, equivalent strain, etc., in structural materials to facilitate ablation analysis. ANSYS fluent and ANSYS structural analysis are samples of the CFD and FEA coupling software successfully applied in academics and industry, supporting the CHTA. The literature review above emphasizes the various methods’ advantages and limitations in developing the supersonic rocket nozzle. In brief, the above-mentioned method in developing a supersonic rocket is complicated and unsuitable for application to the current supersonic rockets. Including the authors’ expertise and experience, we concluded that the last method, the CHTA, is suitable for this research.
In this article, the gas flow and ablation of a 122 mm supersonic rocket nozzle were investigated based on an actual mission in the military using the CHTA. First, the nozzle was in a static experiment to collect essential data for simulation and validation. Then, the CFD was used to determine the gas flow of the nozzle. Next, the CFD results were validated with the theory and forwarded to the FEA to study heat transfer in the nozzle surface. Finally, the FEA results were compared with the experimental results to analyze the ablation. This article reports practical research. The experiment involves a practical methodology, the CHTA settings are used to investigate the ablation for developing a 122 mm supersonic rocket nozzle, and the ablation behavior results from the actual experiment of this type of nozzle are reported.

2. Conjugate Heat Transfer Analysis (CHTA)

The CHTA is a type of heat transfer analysis between the conduction in a solid domain and convection in a fluid domain. Therefore, this chapter discusses related theories used in the CHTA, consisting of the CFD, FEA, rocket thrust equations, and equivalent von Mises stress.

2.1. CFD

By solving the conservation and turbulence equations, we can investigate the gas flow in a fluid domain. The conservation equations are conservation of mass (Equation (1)), momentum (Equation (2)), and energy (Equation (3)) [16].
ρ t + ( ρ v ) = 0
t ( ρ v ) + ( ρ v v ) = p + ( τ ¯ ¯ ) + ρ g + F
x i ( v ( ρ E + p ) ) = x i ( κ e f f T x i )
where v is a velocity vector, ρ is the fluid density, p is the fluid pressure, F is the external force, g is gravitation, τ ¯ ¯ is the stress tensor, κ e f f is the effective conductivity, and E is the total energy.
This research employed the shear stress transport (SST) k-ω turbulence model, since it is reliable and widely applied in both academics and industry [16,17,18,19,20]. The SST k-ω can be written as follows:
t ( ρ k ) + x i ( ρ k u i ) = x j [ ( μ + μ t σ k 3 ) k x j ] + P k 0.09 ρ k ω
t ( ρ ω ) + x i ( ρ ω u i ) = x j [ ( μ + μ t σ ω 3 ) ω x j ] + 1.71 ( 1 F 1 ) ρ ω k x j ω x j + α 3 ω k P k β 3 ρ ω 2
where μt is the eddy viscosity, Pk is the shear production of turbulence, ω is the specific dissipation rate, and k is the turbulent kinetic energy. F1 is a blending function, α3, β3, σk3, and σω3 are coefficients of the SST k-ω turbulence model, while ui, uj, and uk are Cartesian velocities.

2.2. FEA

The heat transfer in a solid domain can be investigated by solving Equation (6) [21].
[ C ] { T ˙ } + [ K ] { T } = { Q }
where [C] is the capacitance matrix and [K] is the thermal stiffness matrix. Both [C] and [K] include the conduction, convection, and radiation terms. {T} is the nodal vector temperature, T ˙ is the change in nodal vector temperature; {Q} is the thermal vector load.
In this research, the convection due to an external nozzle surface exposed to the surroundings was not considered, since the combustion occurred over a short time.

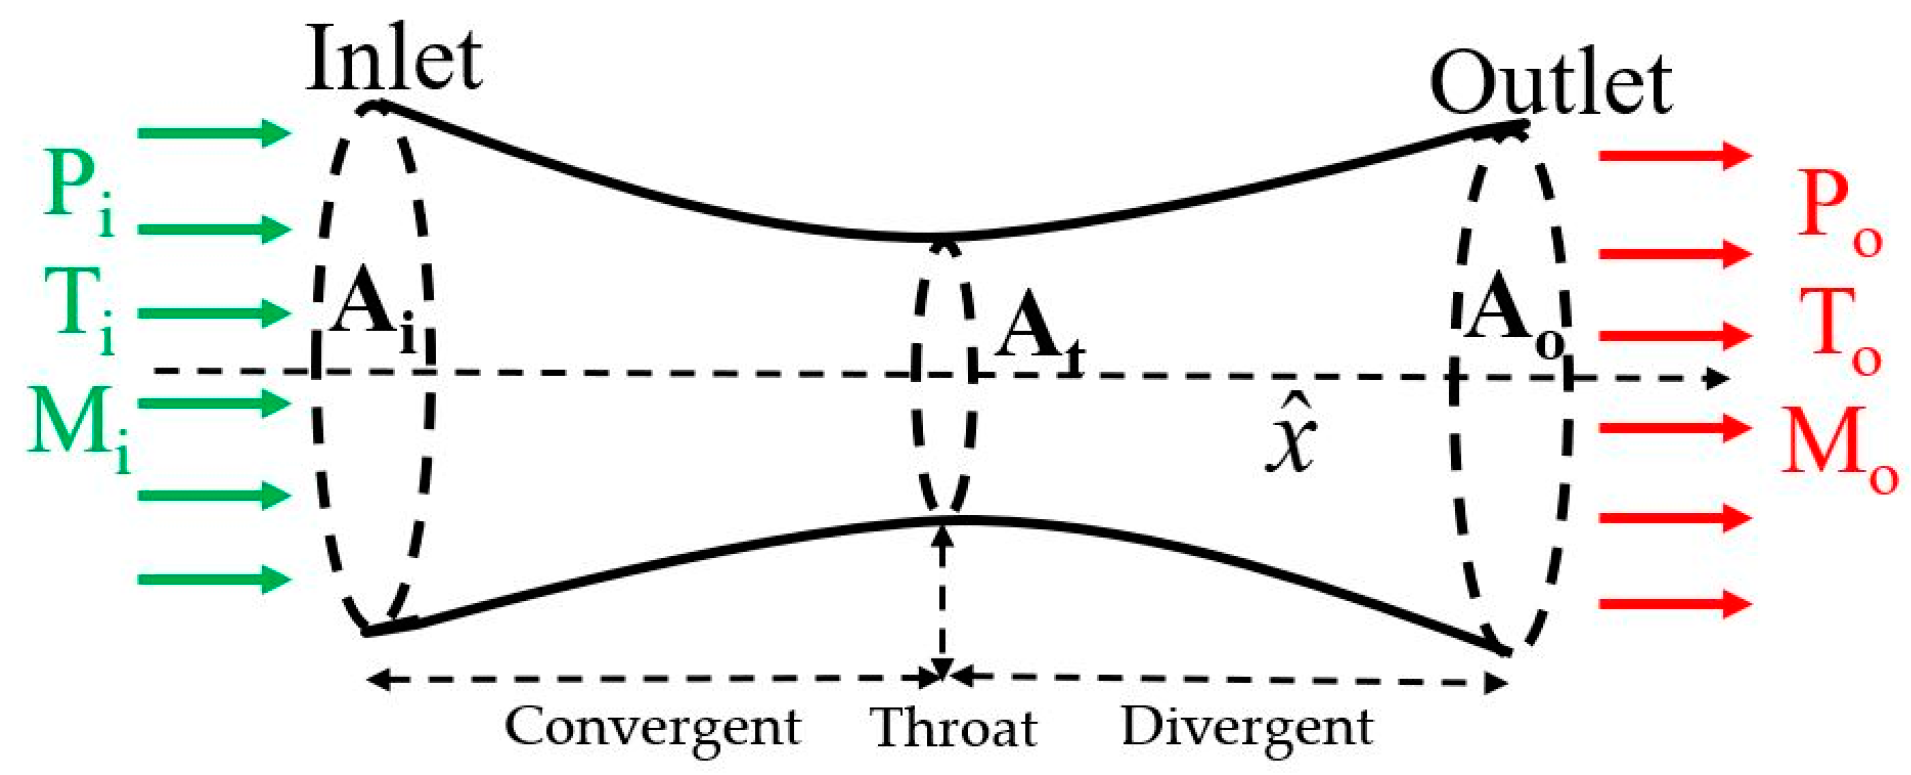
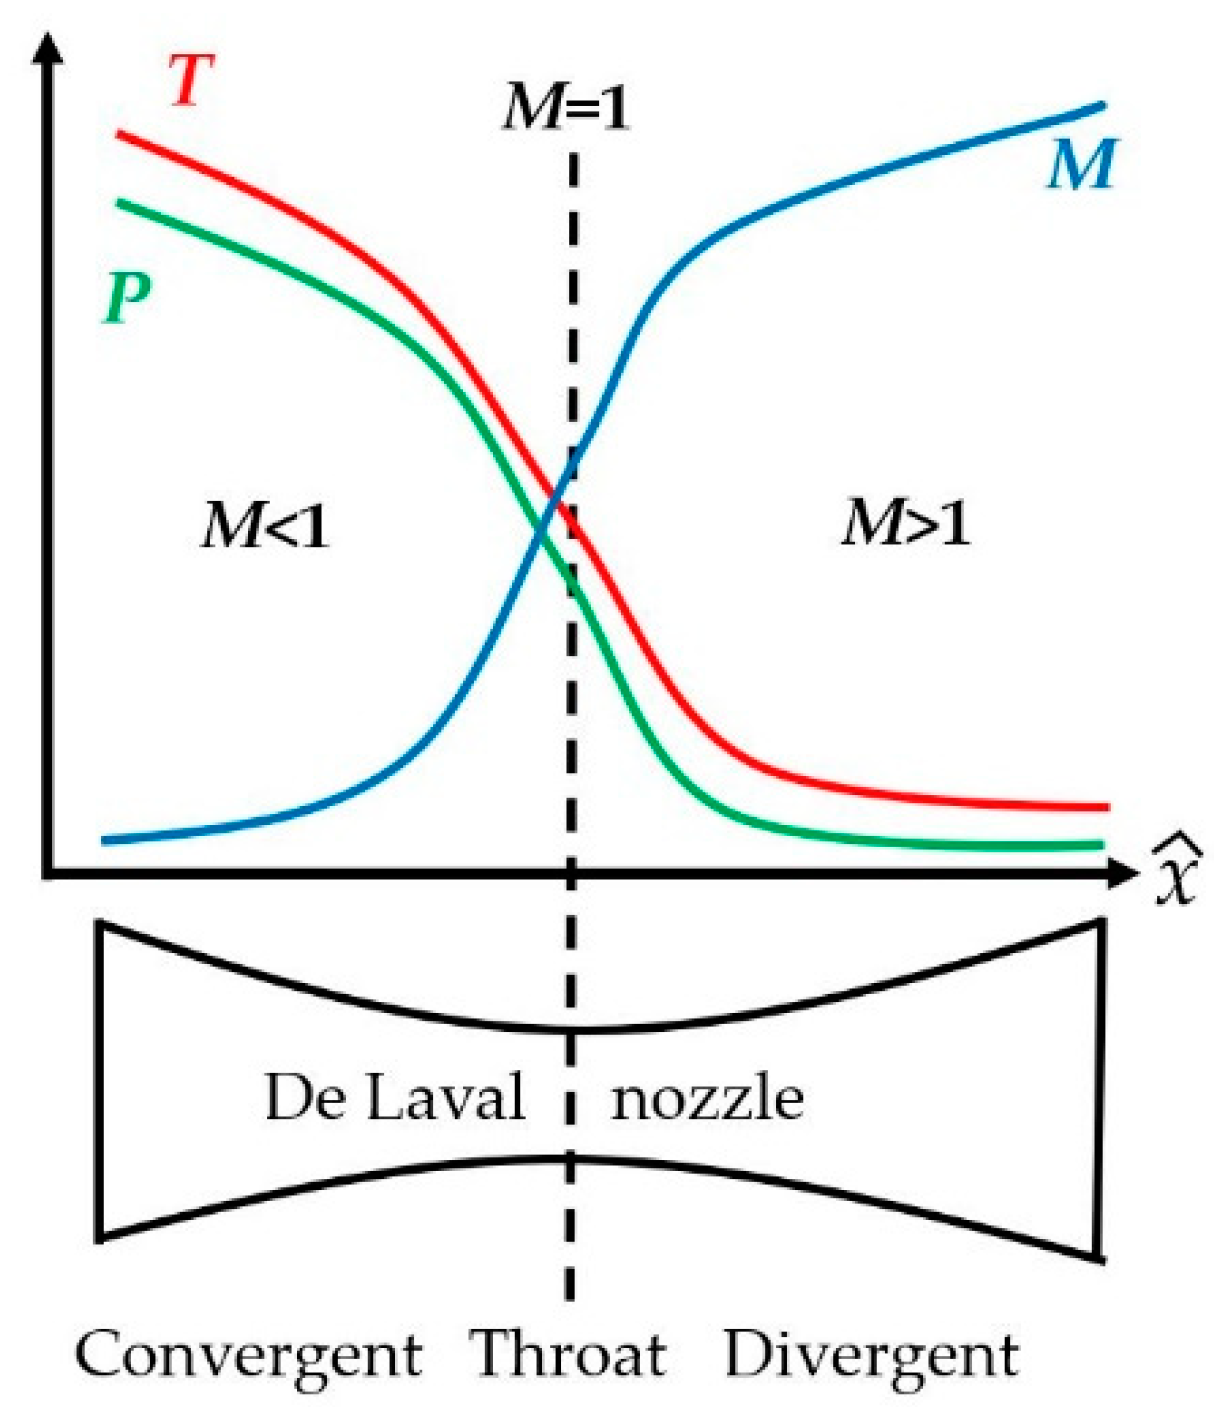
2.3. Rocket Thrust Equations in a De Laval Nozzle

A de Laval nozzle was employed as a case study in this research. It is also known as a convergent-divergent nozzle. This name was called by its shape, with the narrowest area called the throat, located between the convergent and divergent zones. The convergent zone provides the gas velocity in subsonic conditions, while the throat and divergent zones yield those in sonic and supersonic conditions, respectively. This type of nozzle is generally used as an introductory case study to learn the basics for further development into a more complex nozzle shape [22,23,24]. To study the gas flow behavior, the gas property requires a hypothesis that the gas is an ideal, isentropic state with a compressible and constant flow rate. When the rocket is on a mission, the nozzle can be considered to have a temperature (T), pressure (P), and Mach number (M) that correspond to the cross-section area (A) of the nozzle, as shown in Figure 2.
From Figure 2, the relationship between the mentioned gas properties and variables called rocket thrust equations can be expressed based on the isentropic flow principles given by Equations (7)–(9) [25].
T i T o = ( 1 + γ 1 2 M i ) 1
P i P o = ( 1 + γ 1 2 M i ) γ γ 1
A i A t = ( γ + 1 2 ) γ + 1 2 ( γ 1 ) ( 1 + γ 1 2 M x 2 ) γ + 1 2 ( γ 1 ) M x
where γ is the specific heat ratio. The subscripts i and o stand for inlet and outlet, respectively, while x is a position on the central line on the x-axis. M is the Mach number.
Equation (7) was used to help define the simulation settings, while Equations (8) and (9) were employed to validate the gas flow simulation results, which are discussed again in Section 4.
Based on Equations (7)–(9) and Figure 2, the P, T, and M are estimated in terms of the position x for all three zones and then shown in Figure 3. The P and T decrease from left to right, but M increases from left to right. In addition, the M is subsonic in the convergent zone, sonic in the throat, and supersonic in the divergent zone. This figure will help in the gas flow analysis and the CHTA verification in Section 4, which includes the results and discussion.

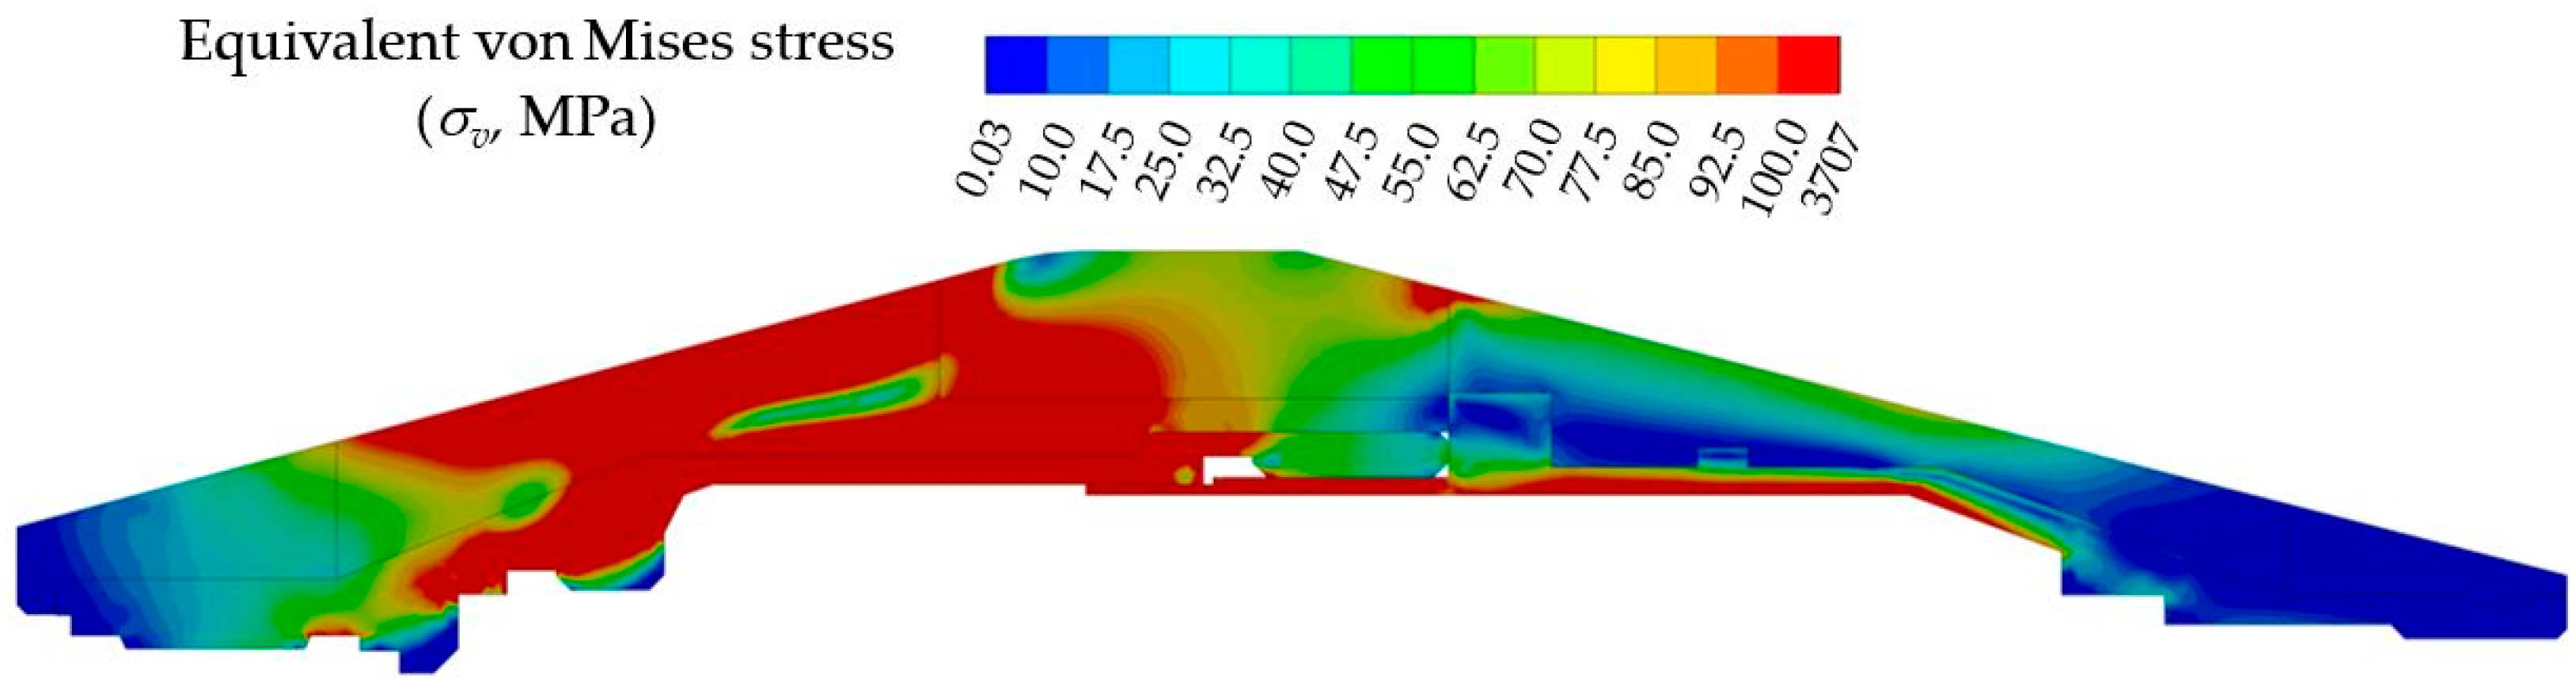
2.4. Equivalent Von Mises Stress
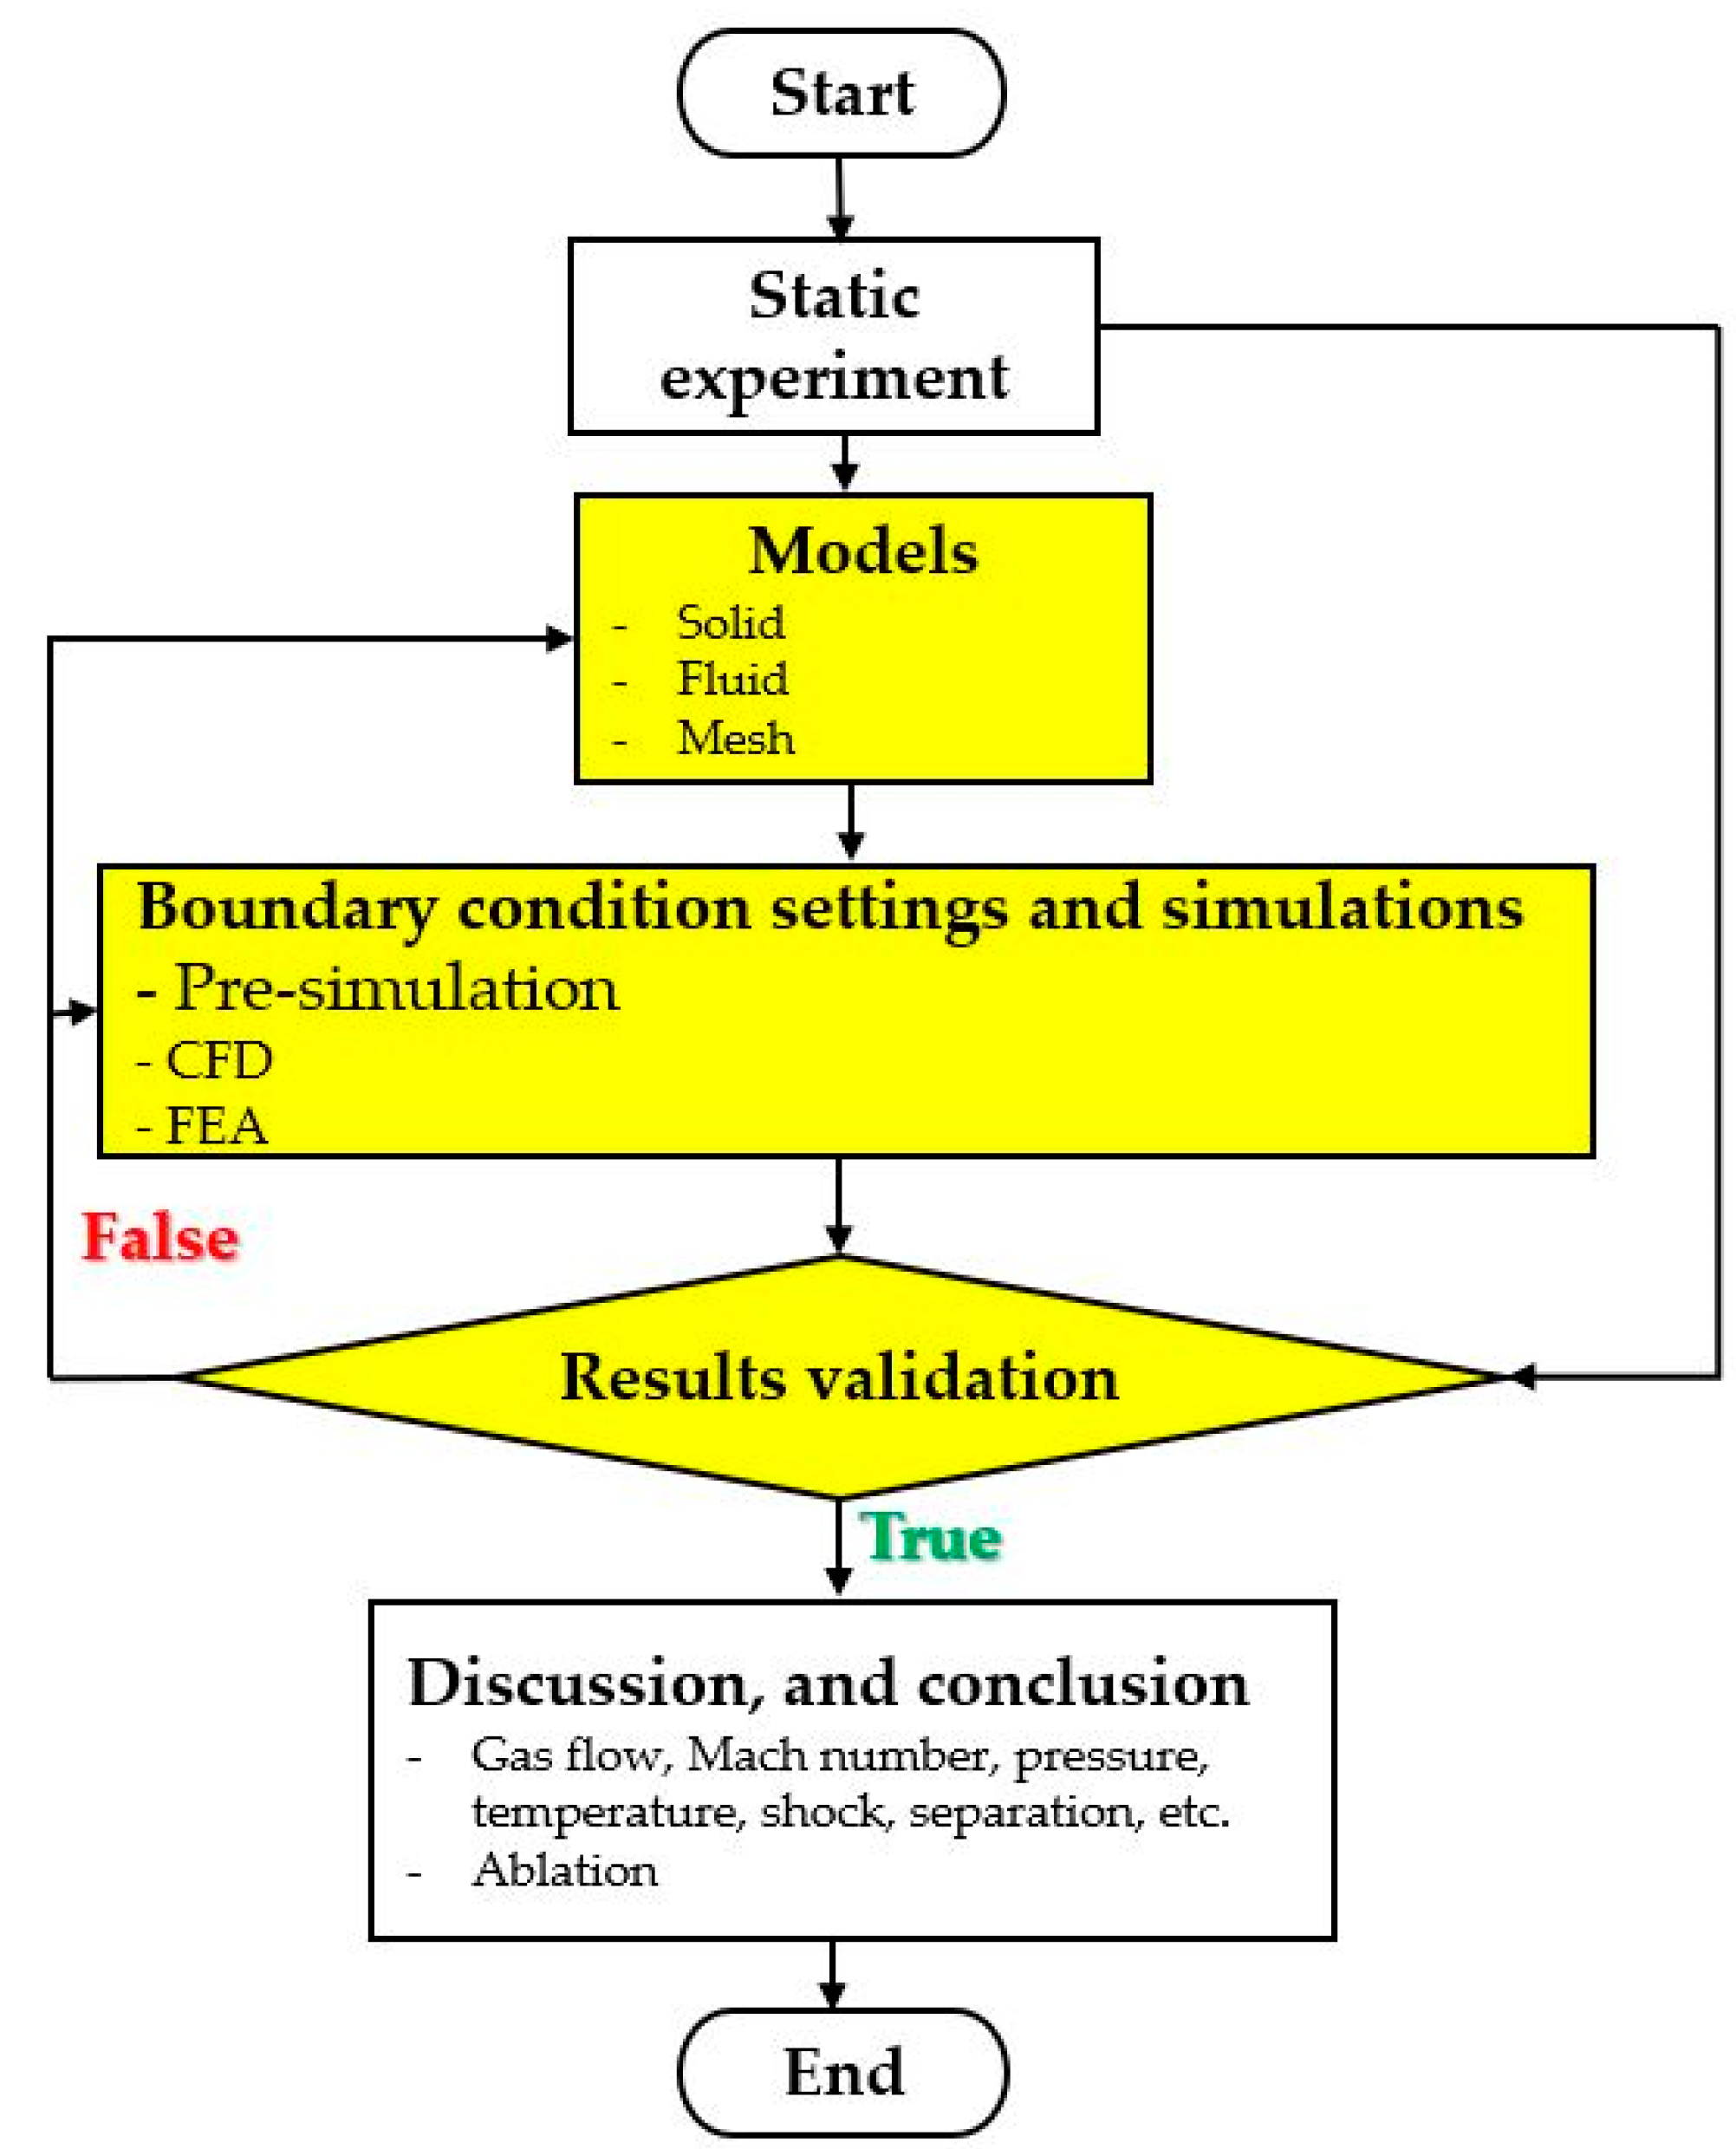
There are many variables derived from the CHTA results, but the most exciting and relevant to this research is the equivalent von Mises stress (σv), which is given by [26].
σ v = ( σ x x σ y y ) 2 + ( σ y y σ z z ) 2 + ( σ z z σ x x ) 2 + 6 ( σ x y 2 + σ y z 2 + σ z x 2 ) 2
where σ is the stress and the subscripts x, y and z stand for each component in a Cartesian coordinate.
The advantage of σv is that it can be used to present the stress resulting from all nine components by a single scalar indicator. Generally, the stress defined in nine components, xx, yy, zz, xy, yx, xz, zx, yz, and zy, must be presented to each component simultaneously. For example, the σxy presents the stress in the 2D xy component, while σxz is for the xz component. Therefore, if the loads are taken from many sources, accurate results require more stress reports from many components. Normally, the σv is employed to interpret the results in the structural and fatigue analysis of materials [26]. However, it will be used for ablation analysis purposes in this research. Since the stress is generated by pressure and thermal loads and may come from the other applied source if applicable, the σv is more appropriate than the other CHTA variables. No research has been conducted before using the σv for this purpose.

3. Methodology

The research methodology of this research is shown in Figure 4. Significantly, the yellow boxes indicate the CHTA simulation.

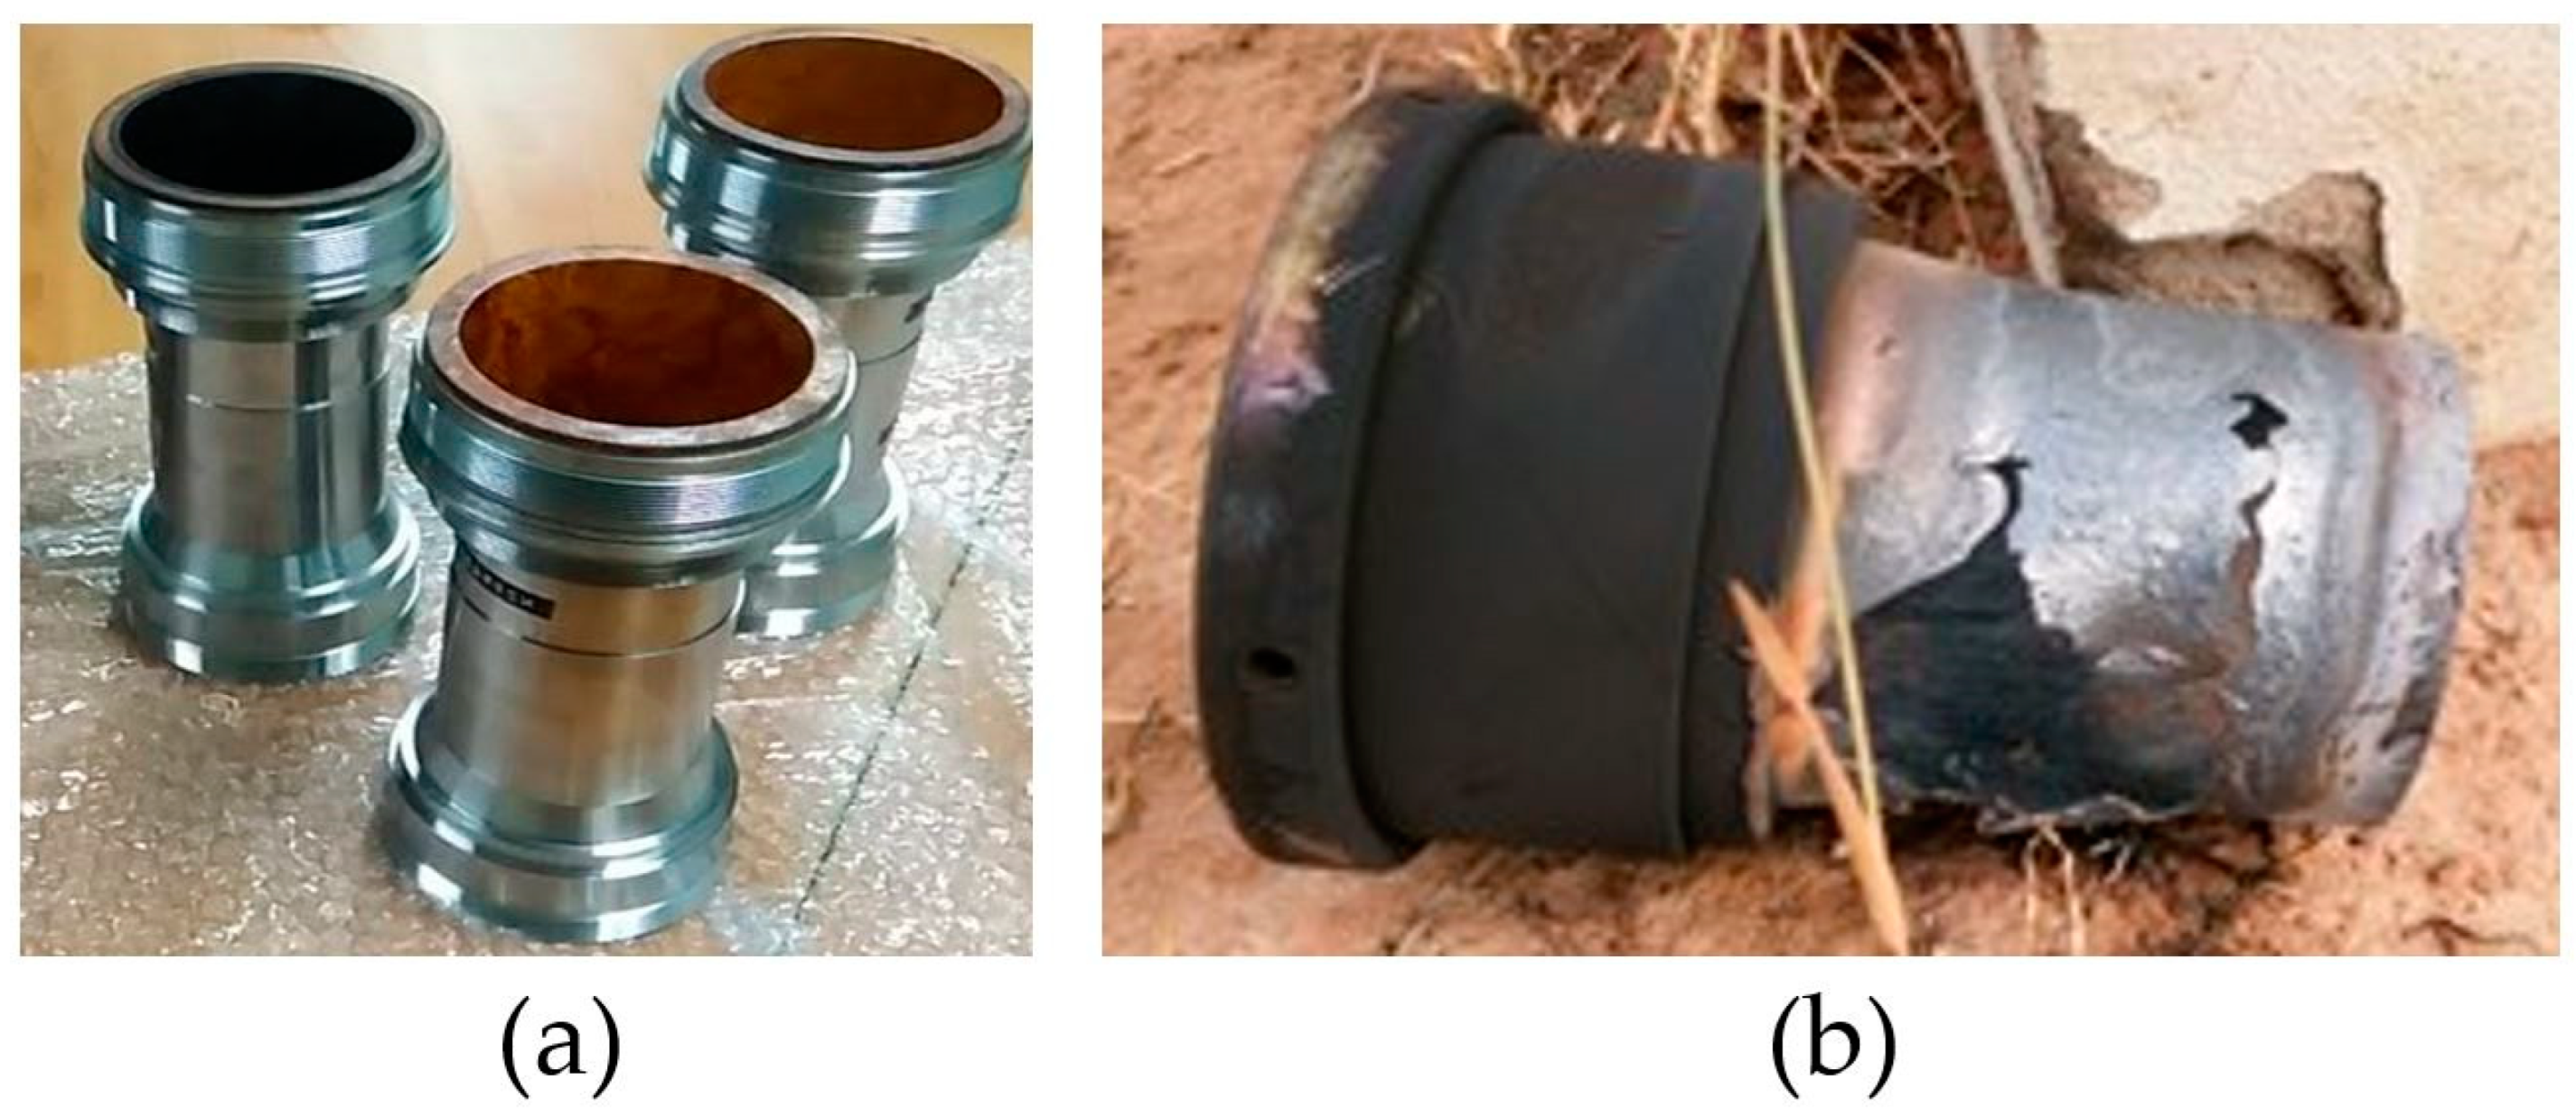
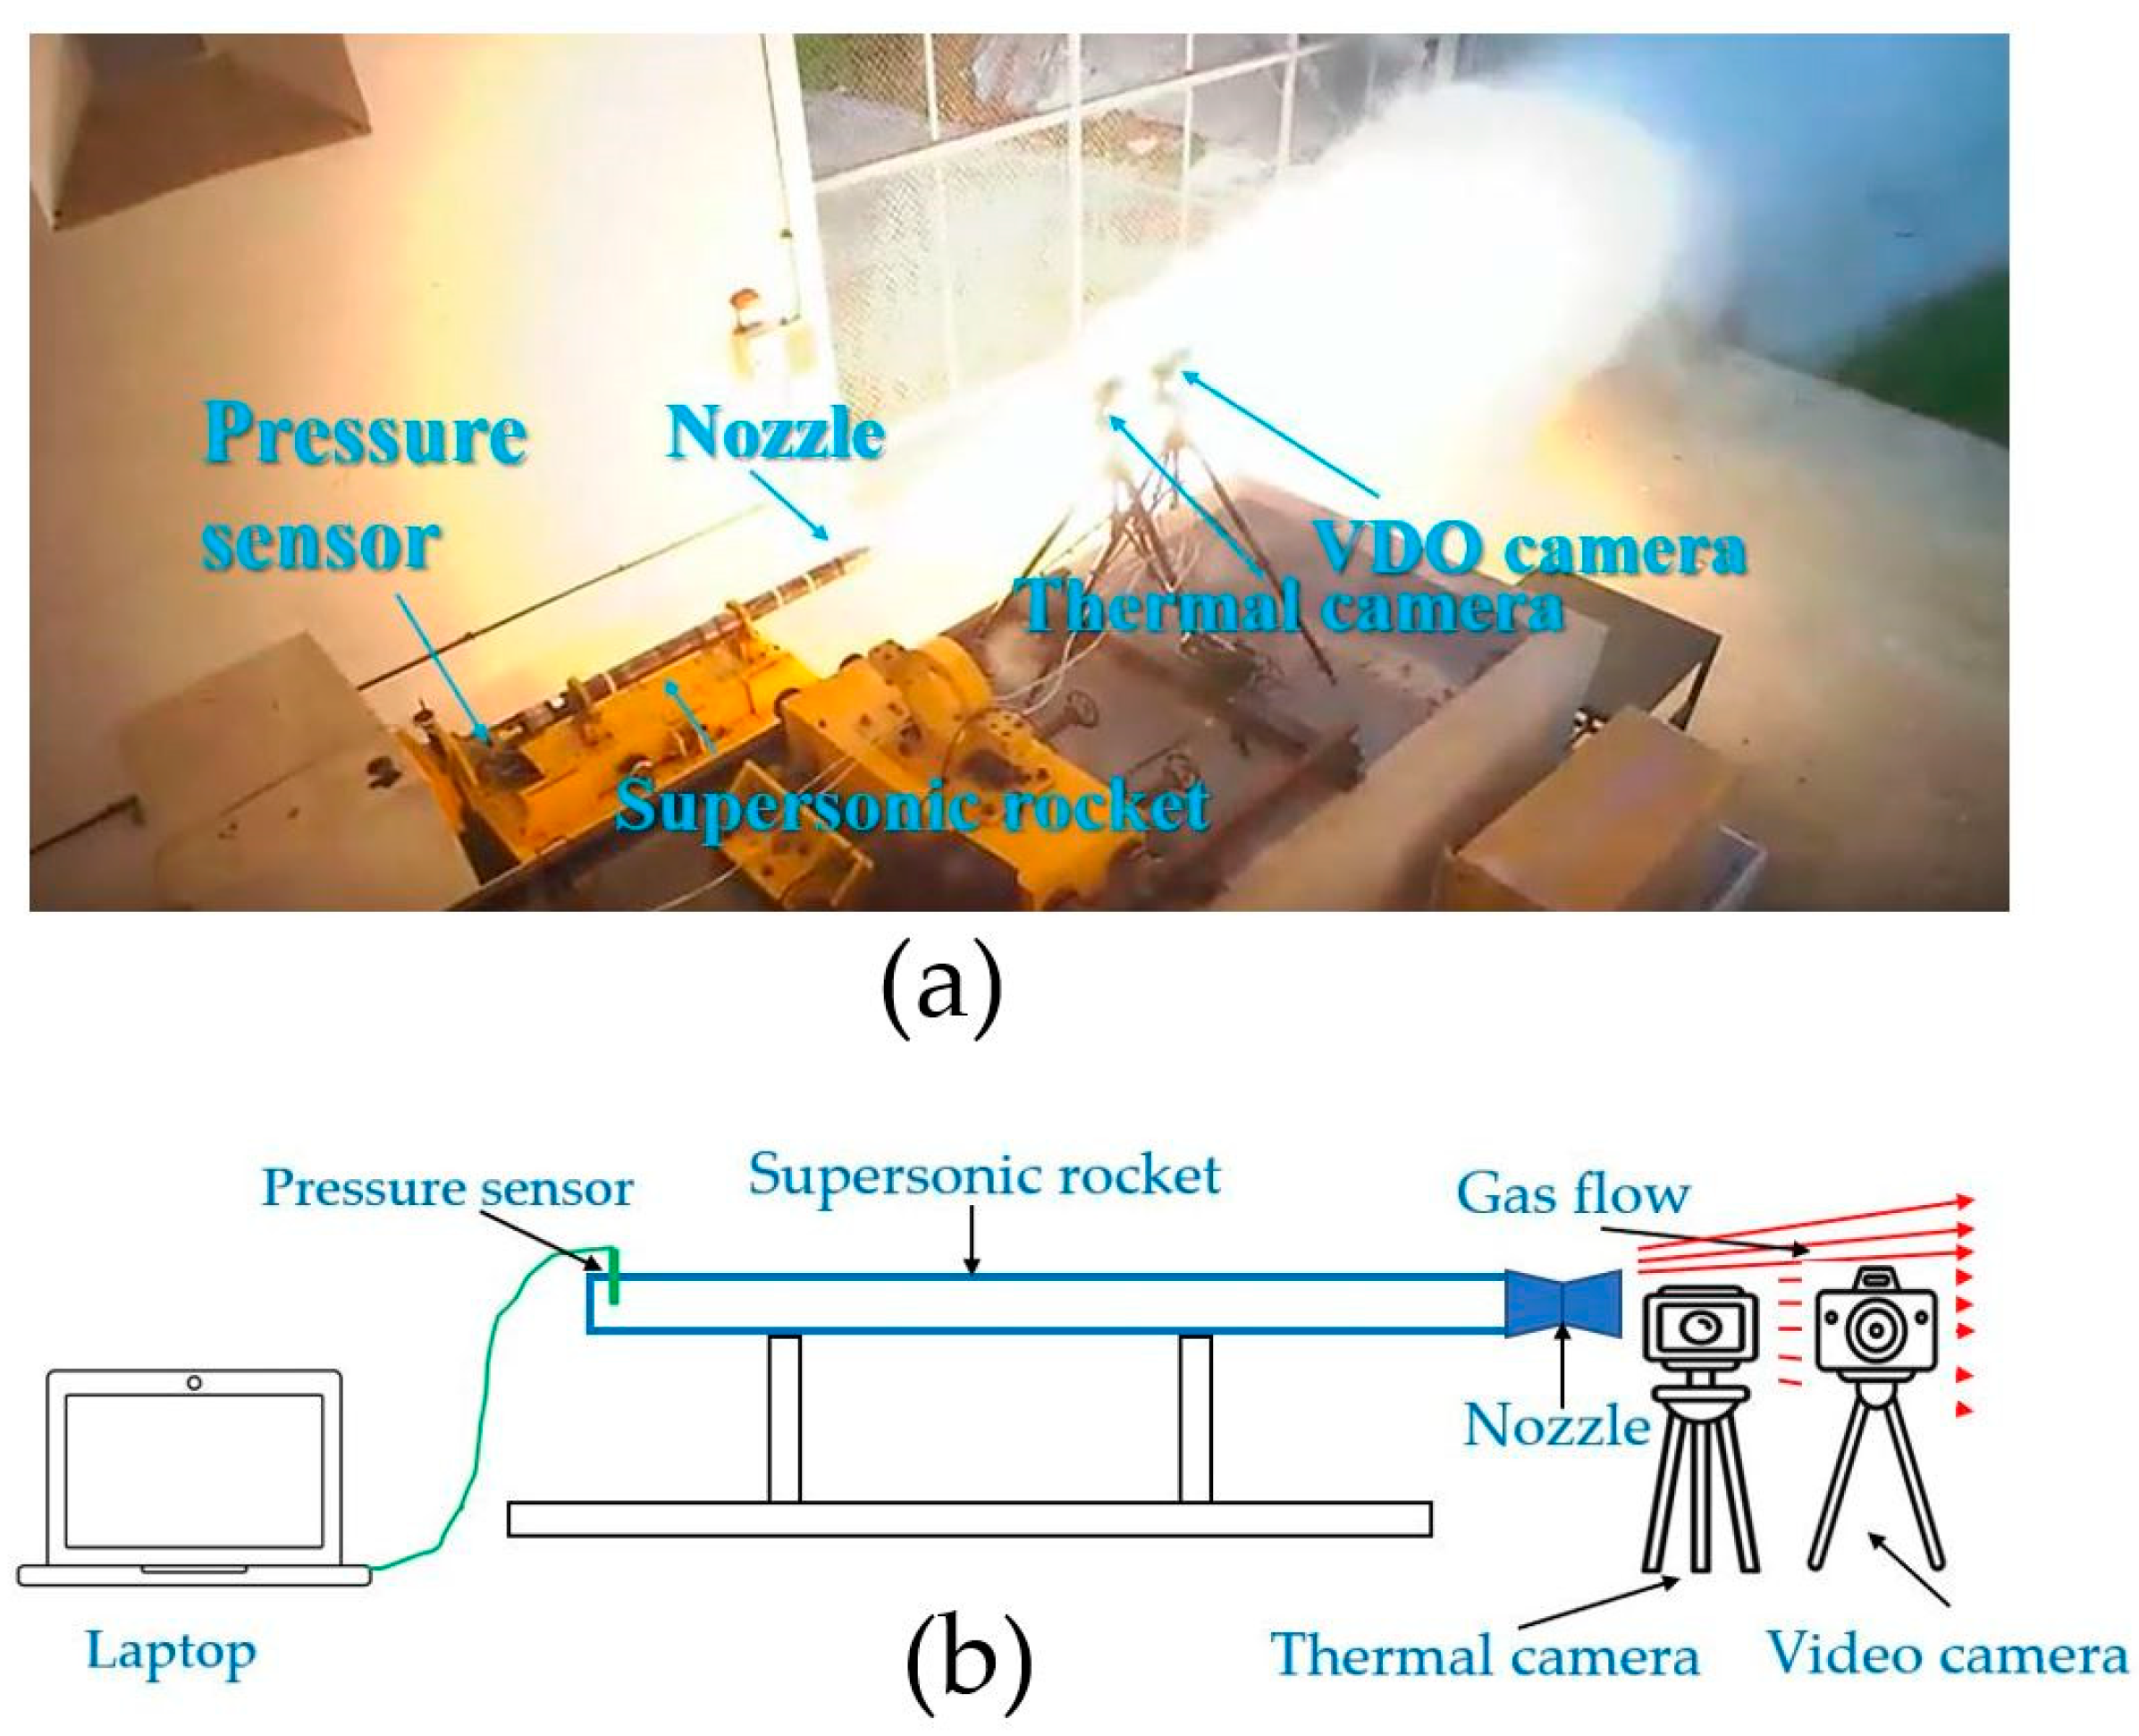
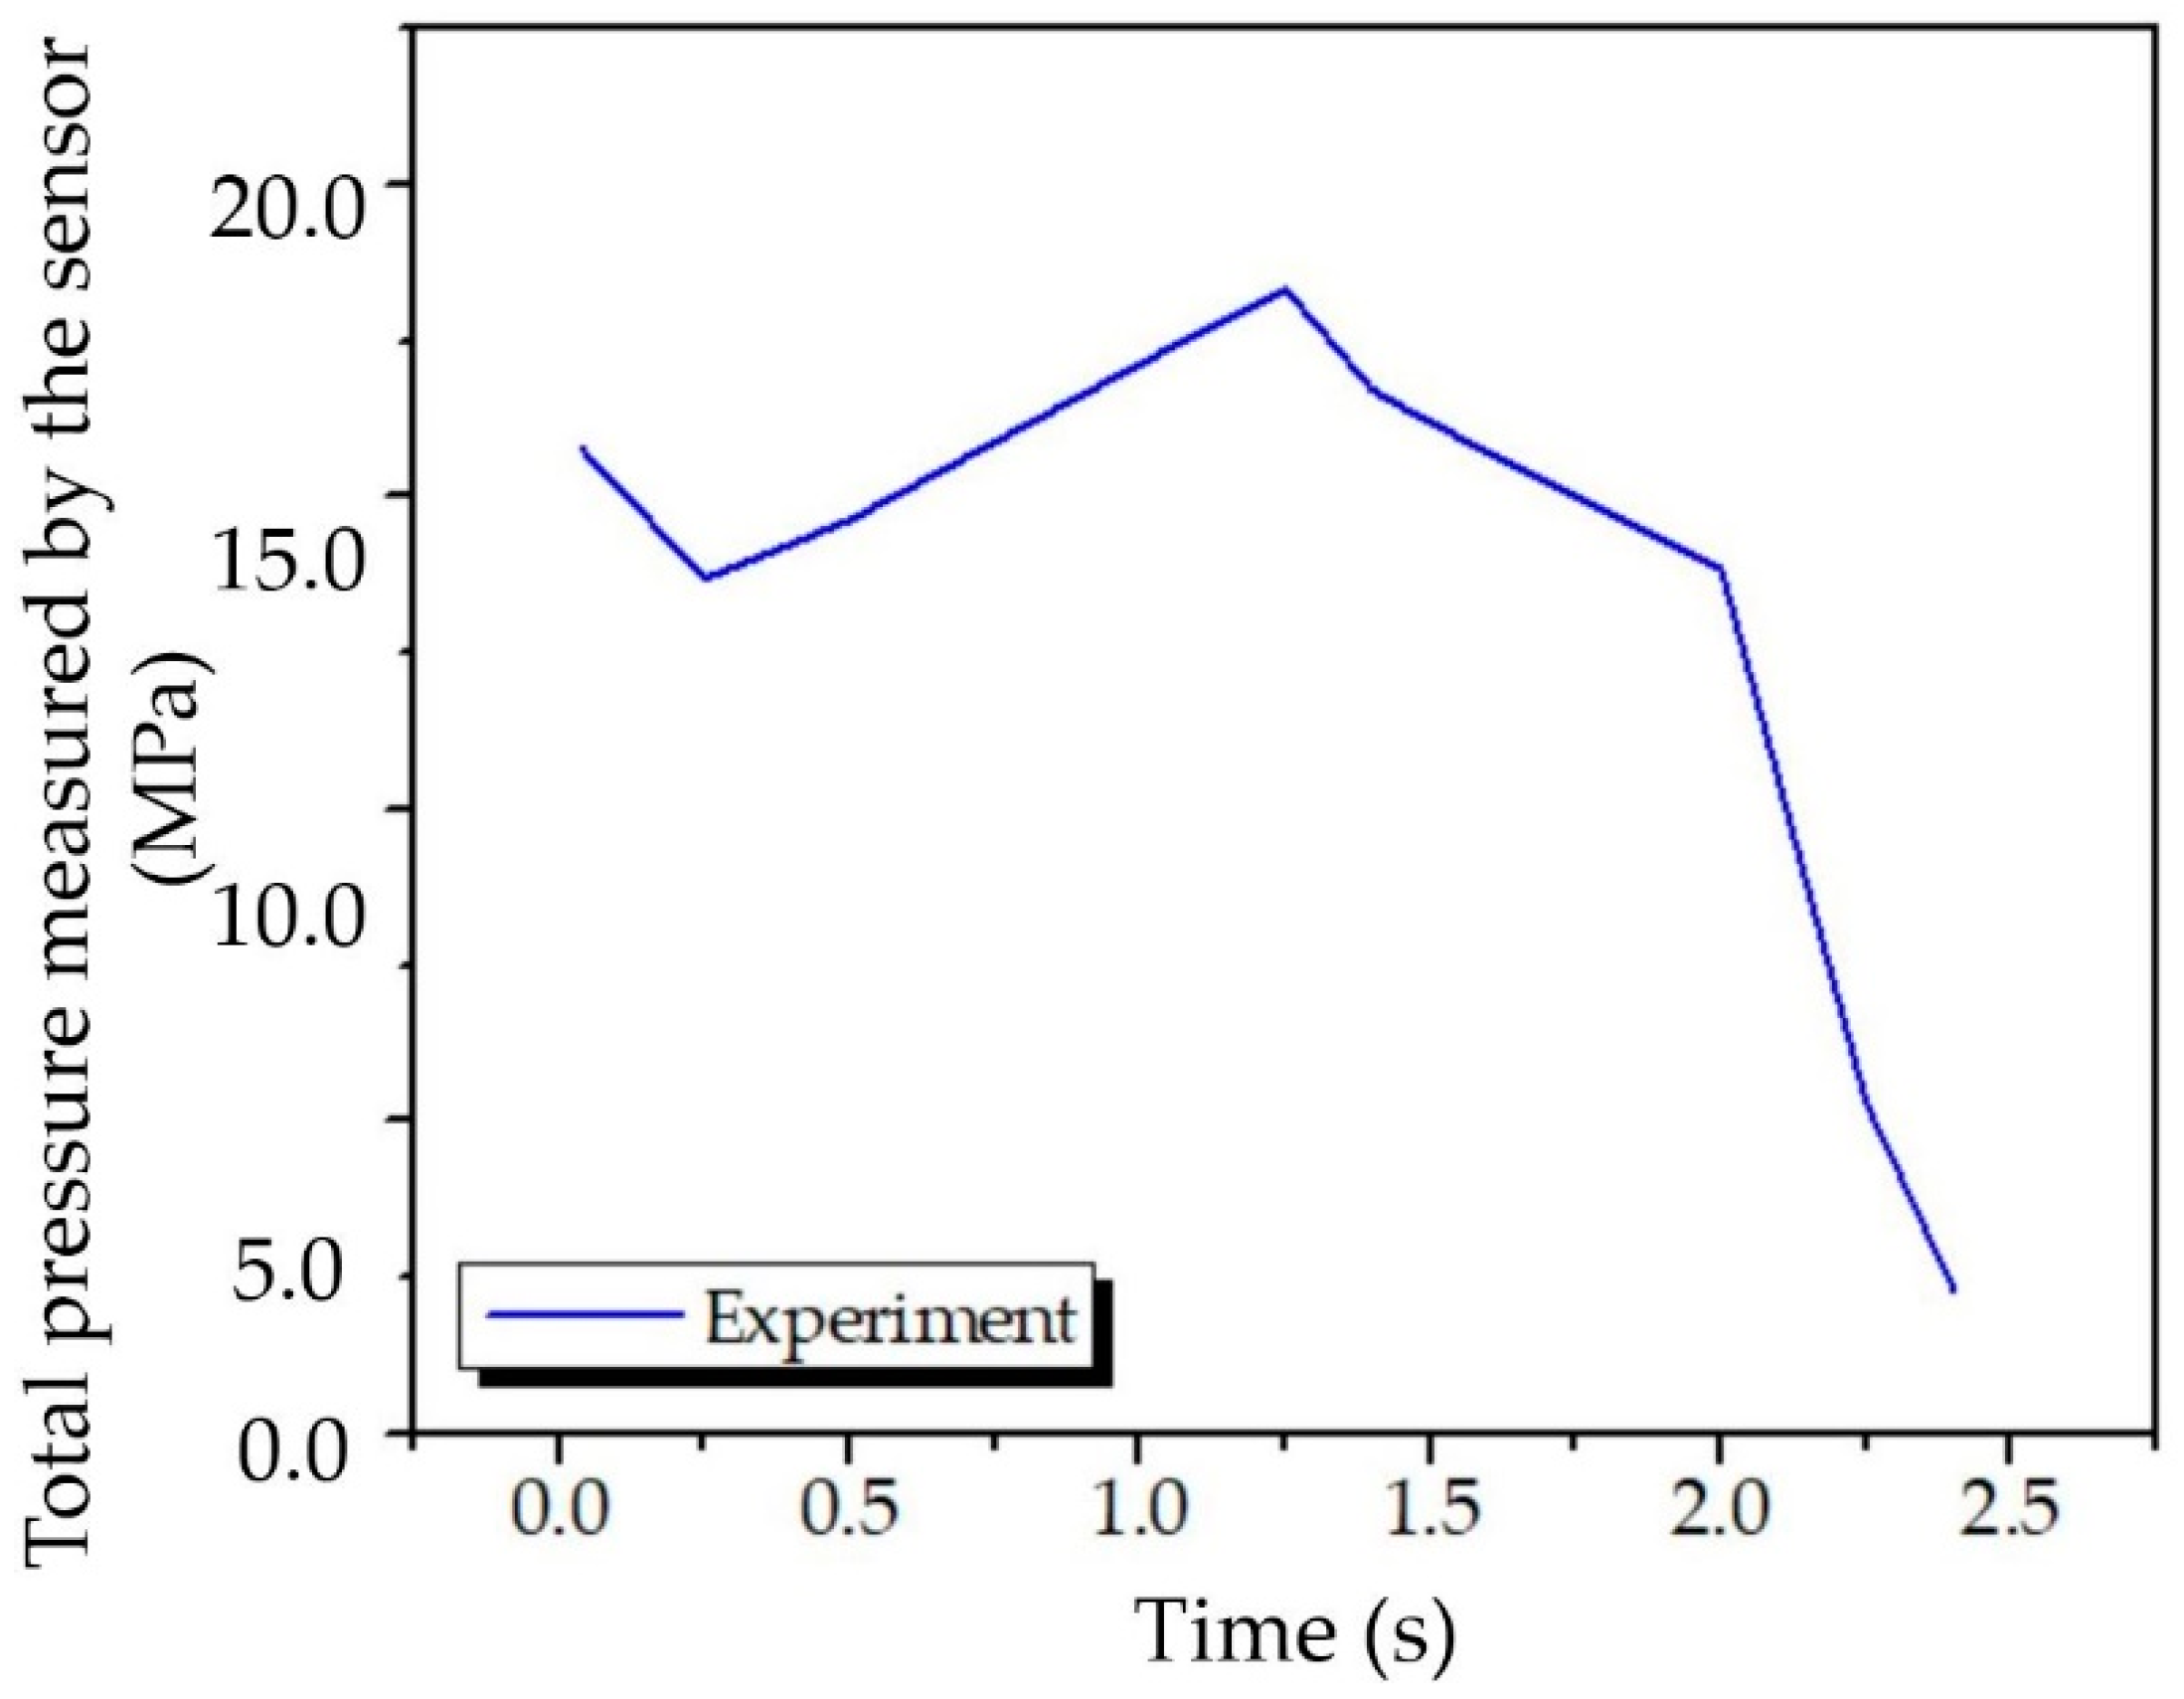
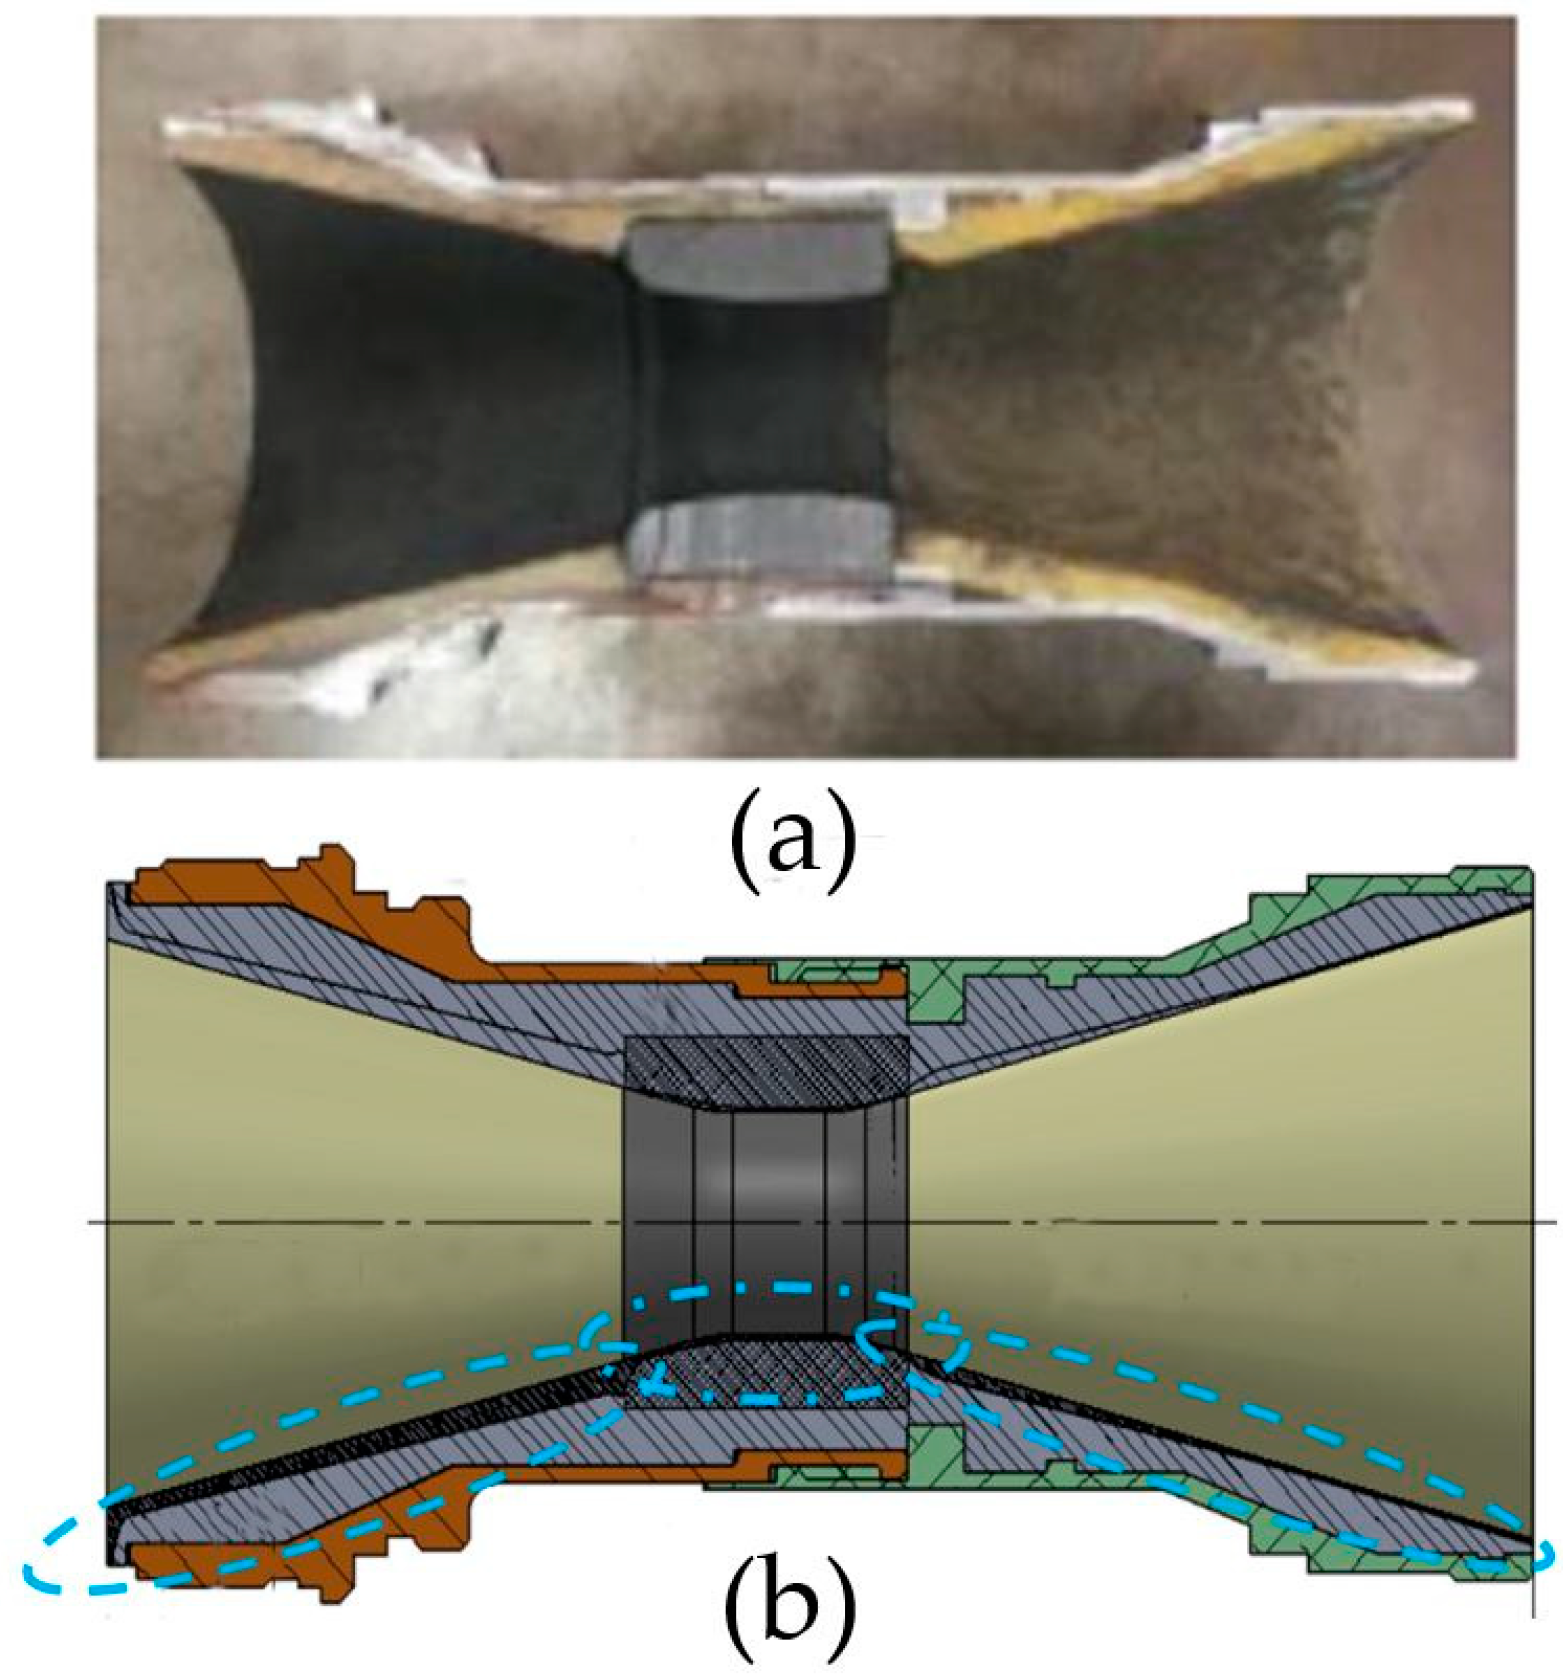
3.1. Static Experiment
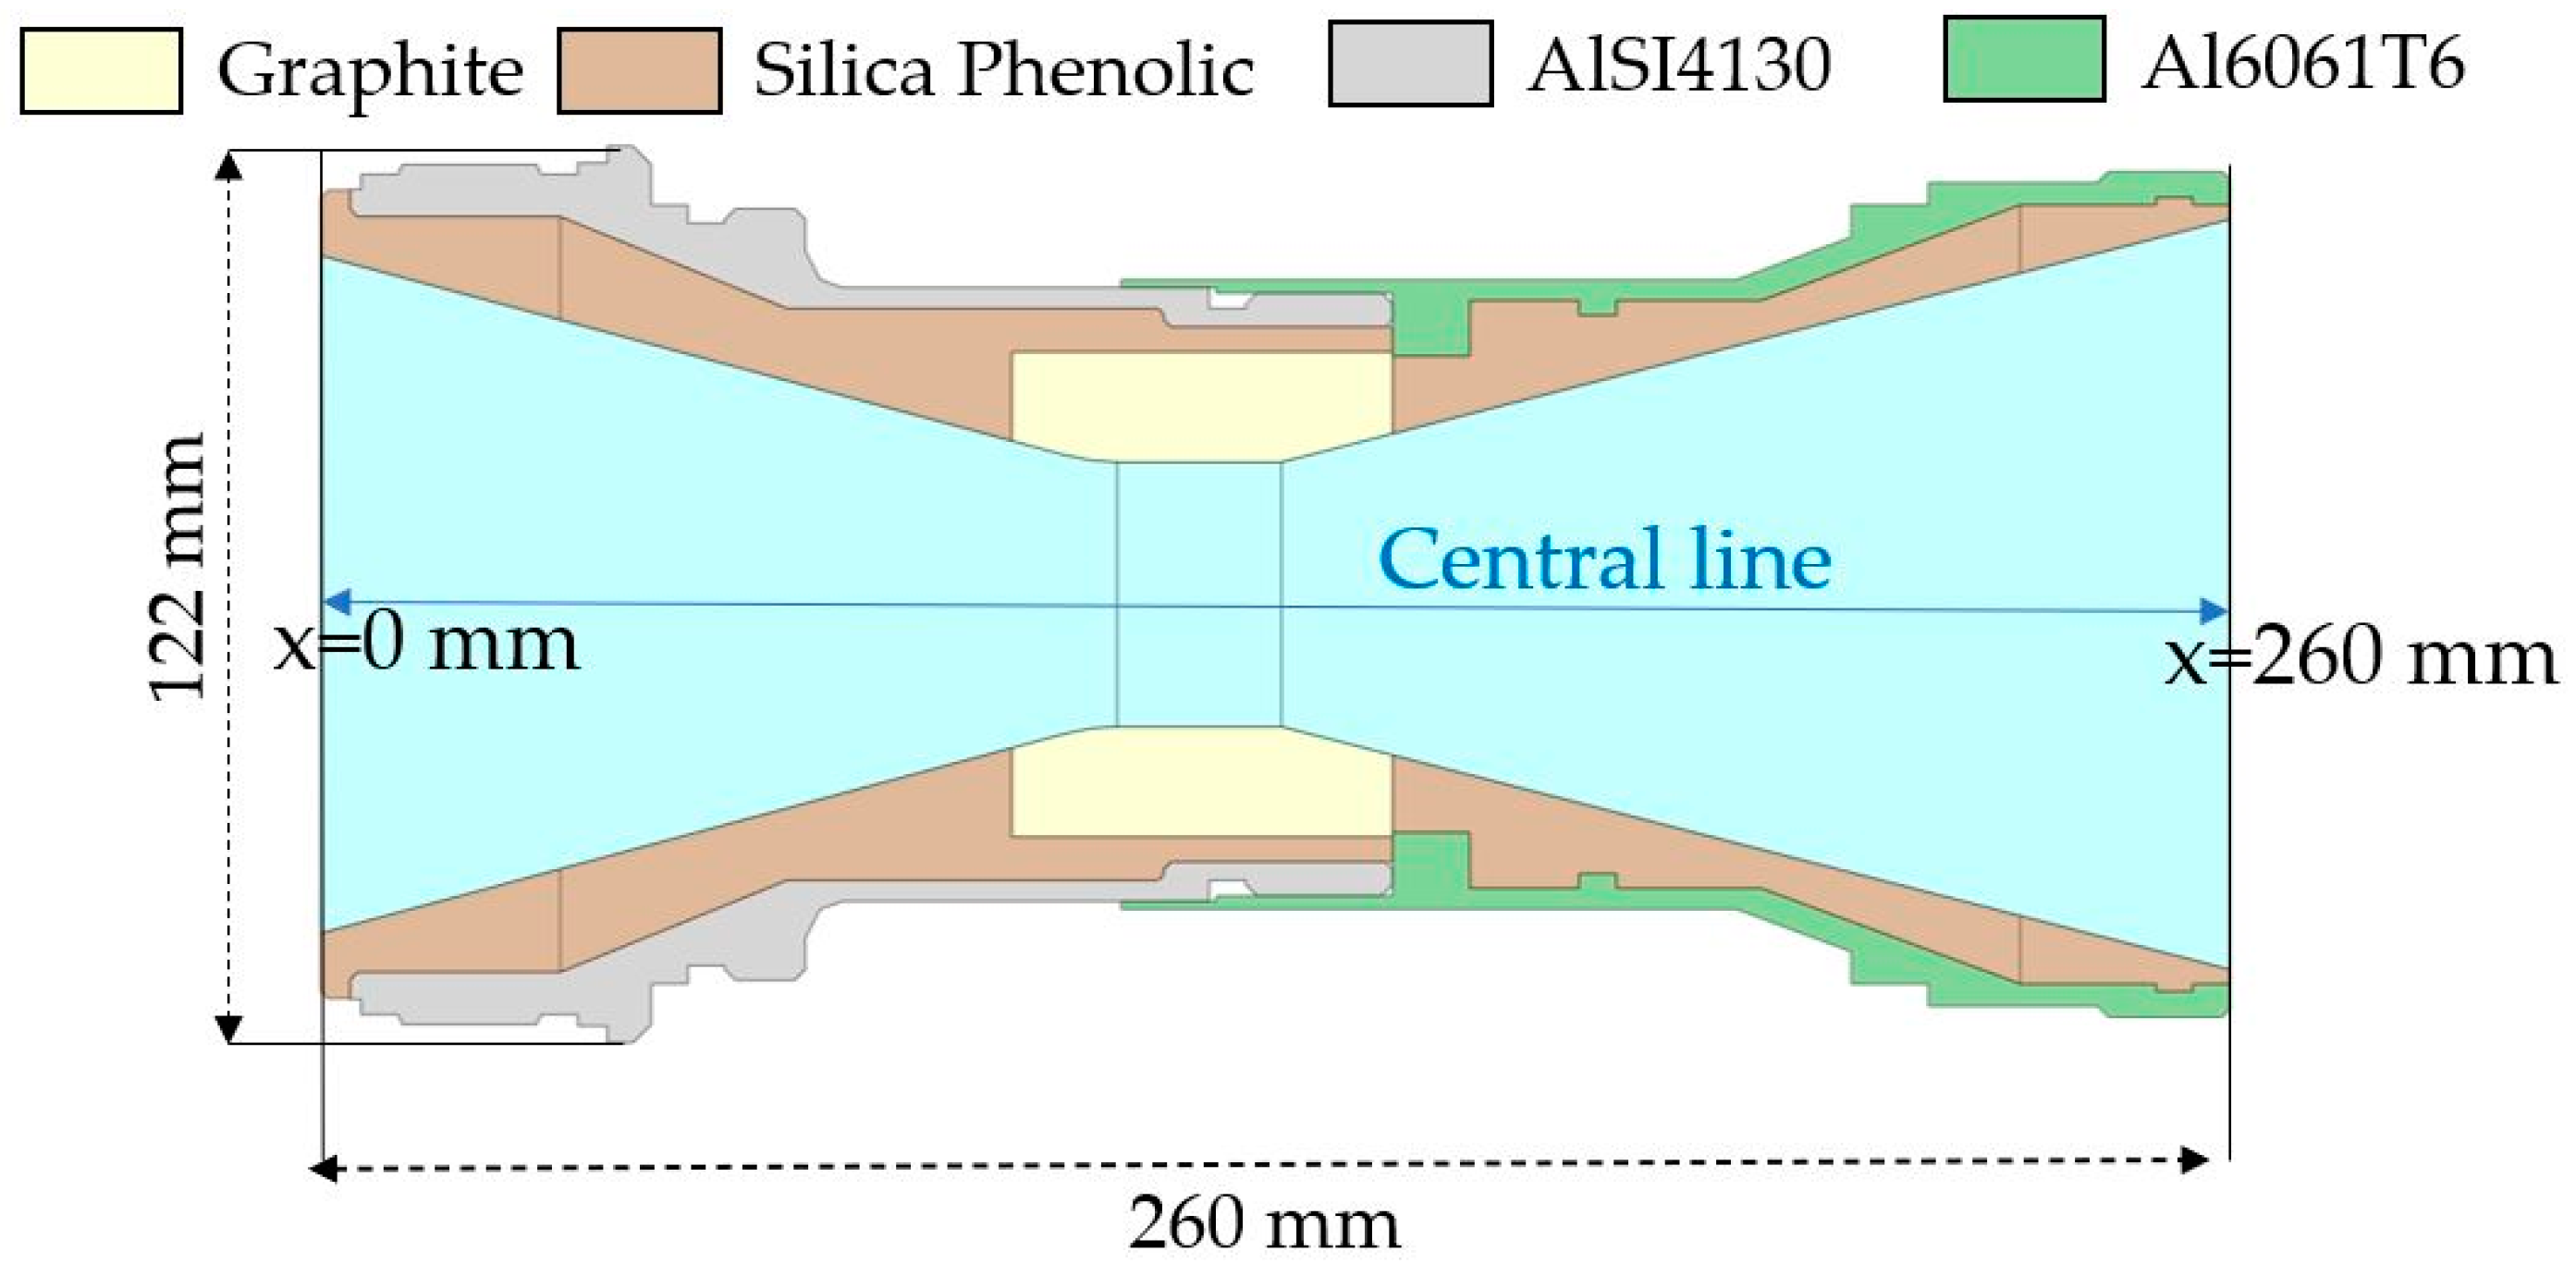
The static experiment of the 122 mm supersonic rocket was set based on the actual operating conditions. Figure 5 shows the static experiment, including (a) the actual image and (b) the setup diagram. The supersonic rocket was fixed on a gripping platform. The front of the rocket was drilled into to create a small hole to insert a sensor for measuring the pressure. Video and thermal cameras were installed near its tail to capture the gas flow and temperature released from the nozzle. All devices recorded data in a transient state of combustion time, from start to finish, about 2.4 s. Finally, all recorded data were analyzed in the laboratory for the experimental results, for example, total pressure, temperature, gas flow behavior, ablation, a gas chemical compound, etc. The experimental results were employed to set the boundary conditions in the CHTA and validate the CHTA results later.
In the experiment, after the start-up of the supersonic rocket, all the devices started working simultaneously. Then, the sensor measured the pressure and transferred the data to the laptop to set the pressure inlet in the boundary condition later on. At the same time, the thermal camera located near the nozzle captured the temperature of the released gas, while the video camera recorded the gas flow behavior released from the nozzle. All the results from the cameras were used for the boundary setting, pre-simulation, and validation by comparing them with the CFD gas flow results outside the nozzle to confirm the CHTA credibility. Moreover, the gas released was collected to be tested in the chemical laboratory to find the mixing fluid and quantity. For an example of the chemical results, the gas from combustion was a mixture consisting of 51 gas compounds, with the first 5 listed in the following descending order: H2, CO, HCl, H2O, and Al2O3. Accordingly, the fluid in the setting of boundary conditions was defined as H2, which is reported in the next section.
Figure 6 displays the total pressure against time measured by a sensor in the experiment depicted in Figure 5. The total pressure leads to the thrust, then an area between the thrust and time in the graph is the propellant’s energy. Since the propellant weight varies with energy, the more energy, the higher the range of missions; the manufacturer uses this graph to optimize the propellant weight to suit the military missions. This explanation is a supersonic rocket nozzle design concept, which the manufacturer must test and must have sufficient accurate data to achieve a high-performance mission. In addition, this research makes this graph more valuable as a pressure inlet condition for simulation.

3.2. Models

The actual nozzle in Figure 1 was used as a prototype to create a solid model in 2D. Figure 7 shows the 2D solid model of the nozzle showing shape, materials, and dimensions. In addition, 122 mm is the diameter, while 260 mm is the total nozzle length. Its inside is hollow. The full dimensions could not be reported due to manufacturer confidentiality. The solid domain consists of graphite, silica phenolic, aluminum SI4130, and aluminum 6061T6. Graphite and silica phenolic act as the thermal insulation, while aluminum acts as a solid outer structure. In addition, the central line starting from 0 mm to 260 mm was marked for the validation of results, which is discussed further in Section 4.
Then, the complete model of the nozzle was created by adding an enclosure to the solid model in Figure 7. The added enclosure function as a fluid domain in the CFD simulation captures the gas flow behavior inside and outside the nozzle. Next, the complete model underwent the meshing process to make the mesh model. Figure 8 presents the mesh model. As observed in the blue color, the enclosure is added. The other colors are the solid materials defined as solid domains. After completing a mesh independent analysis process, a suitable mesh model ready for the CHTA simulation had a rectangle size of 2 mm, 757,340 nodes, and 106,226 elements. Significantly, a band of black color in the small picture on the left represents the inflation layers in the fluid domain adjacent to the solid model. The inflation layers consist of 60 layers of rectangular mesh, with the first size layer of 3 nm calculated using y+ of 1, with the gradient increasing to 2 mm at the last layer. The setting of inflation mesh allows for a more accurate one-way simulation, transferring results from the fluid to solid domains. In addition, the small picture on the right shows an enlarged area in the fluid domain to reveal the detail of the rectangular mesh type. Due to the symmetry of the nozzle, the suitable mesh model was only half created for the CHTA. Accordingly, using the inflation layers and mesh independent analysis, the authors were confident that the suitable mesh model would provide reliable simulation results.

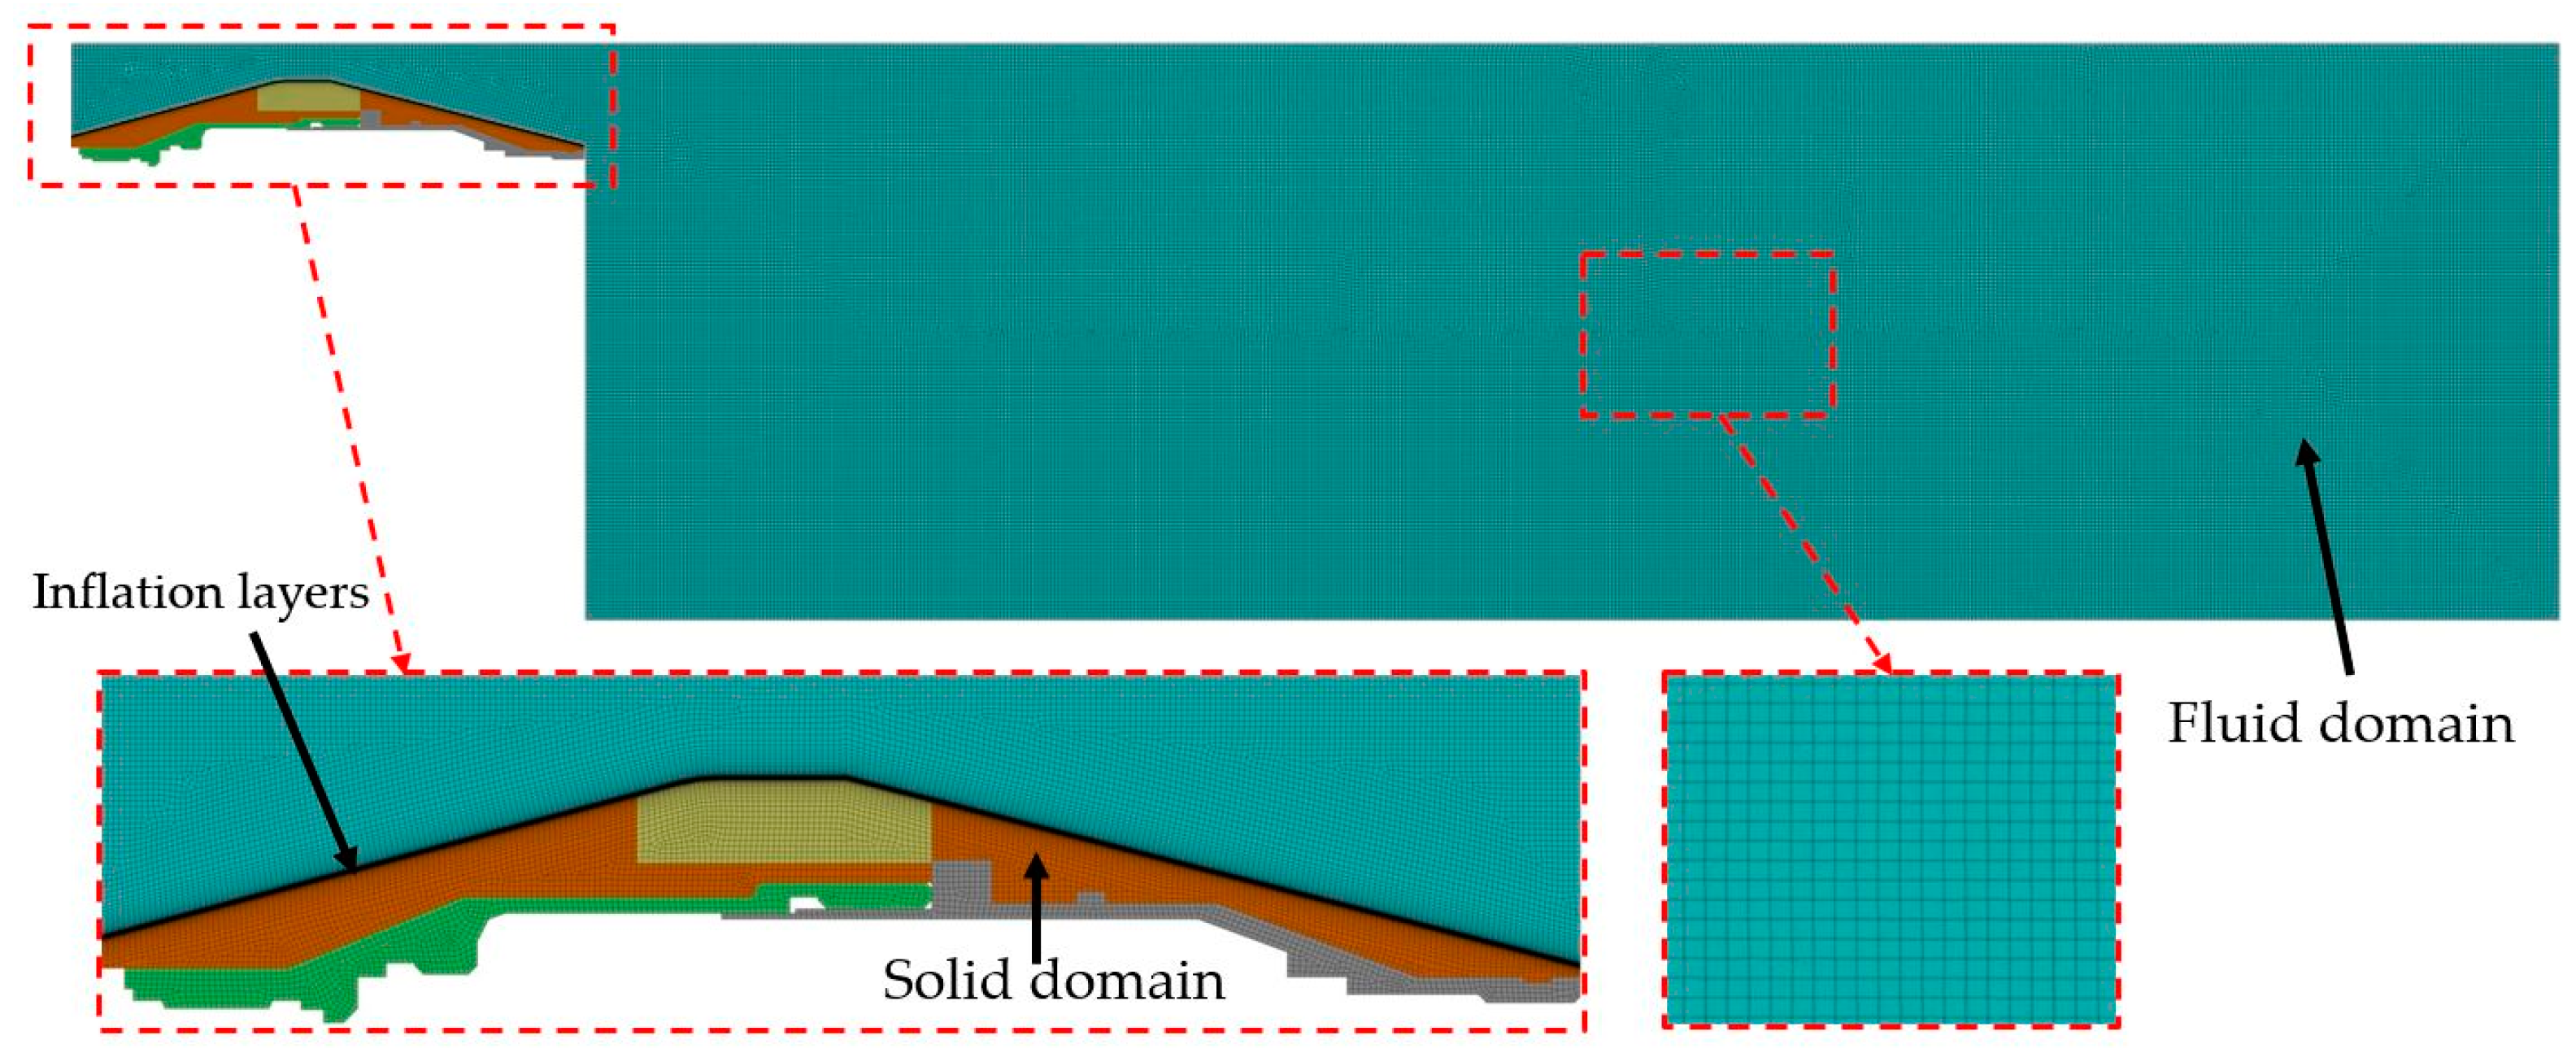
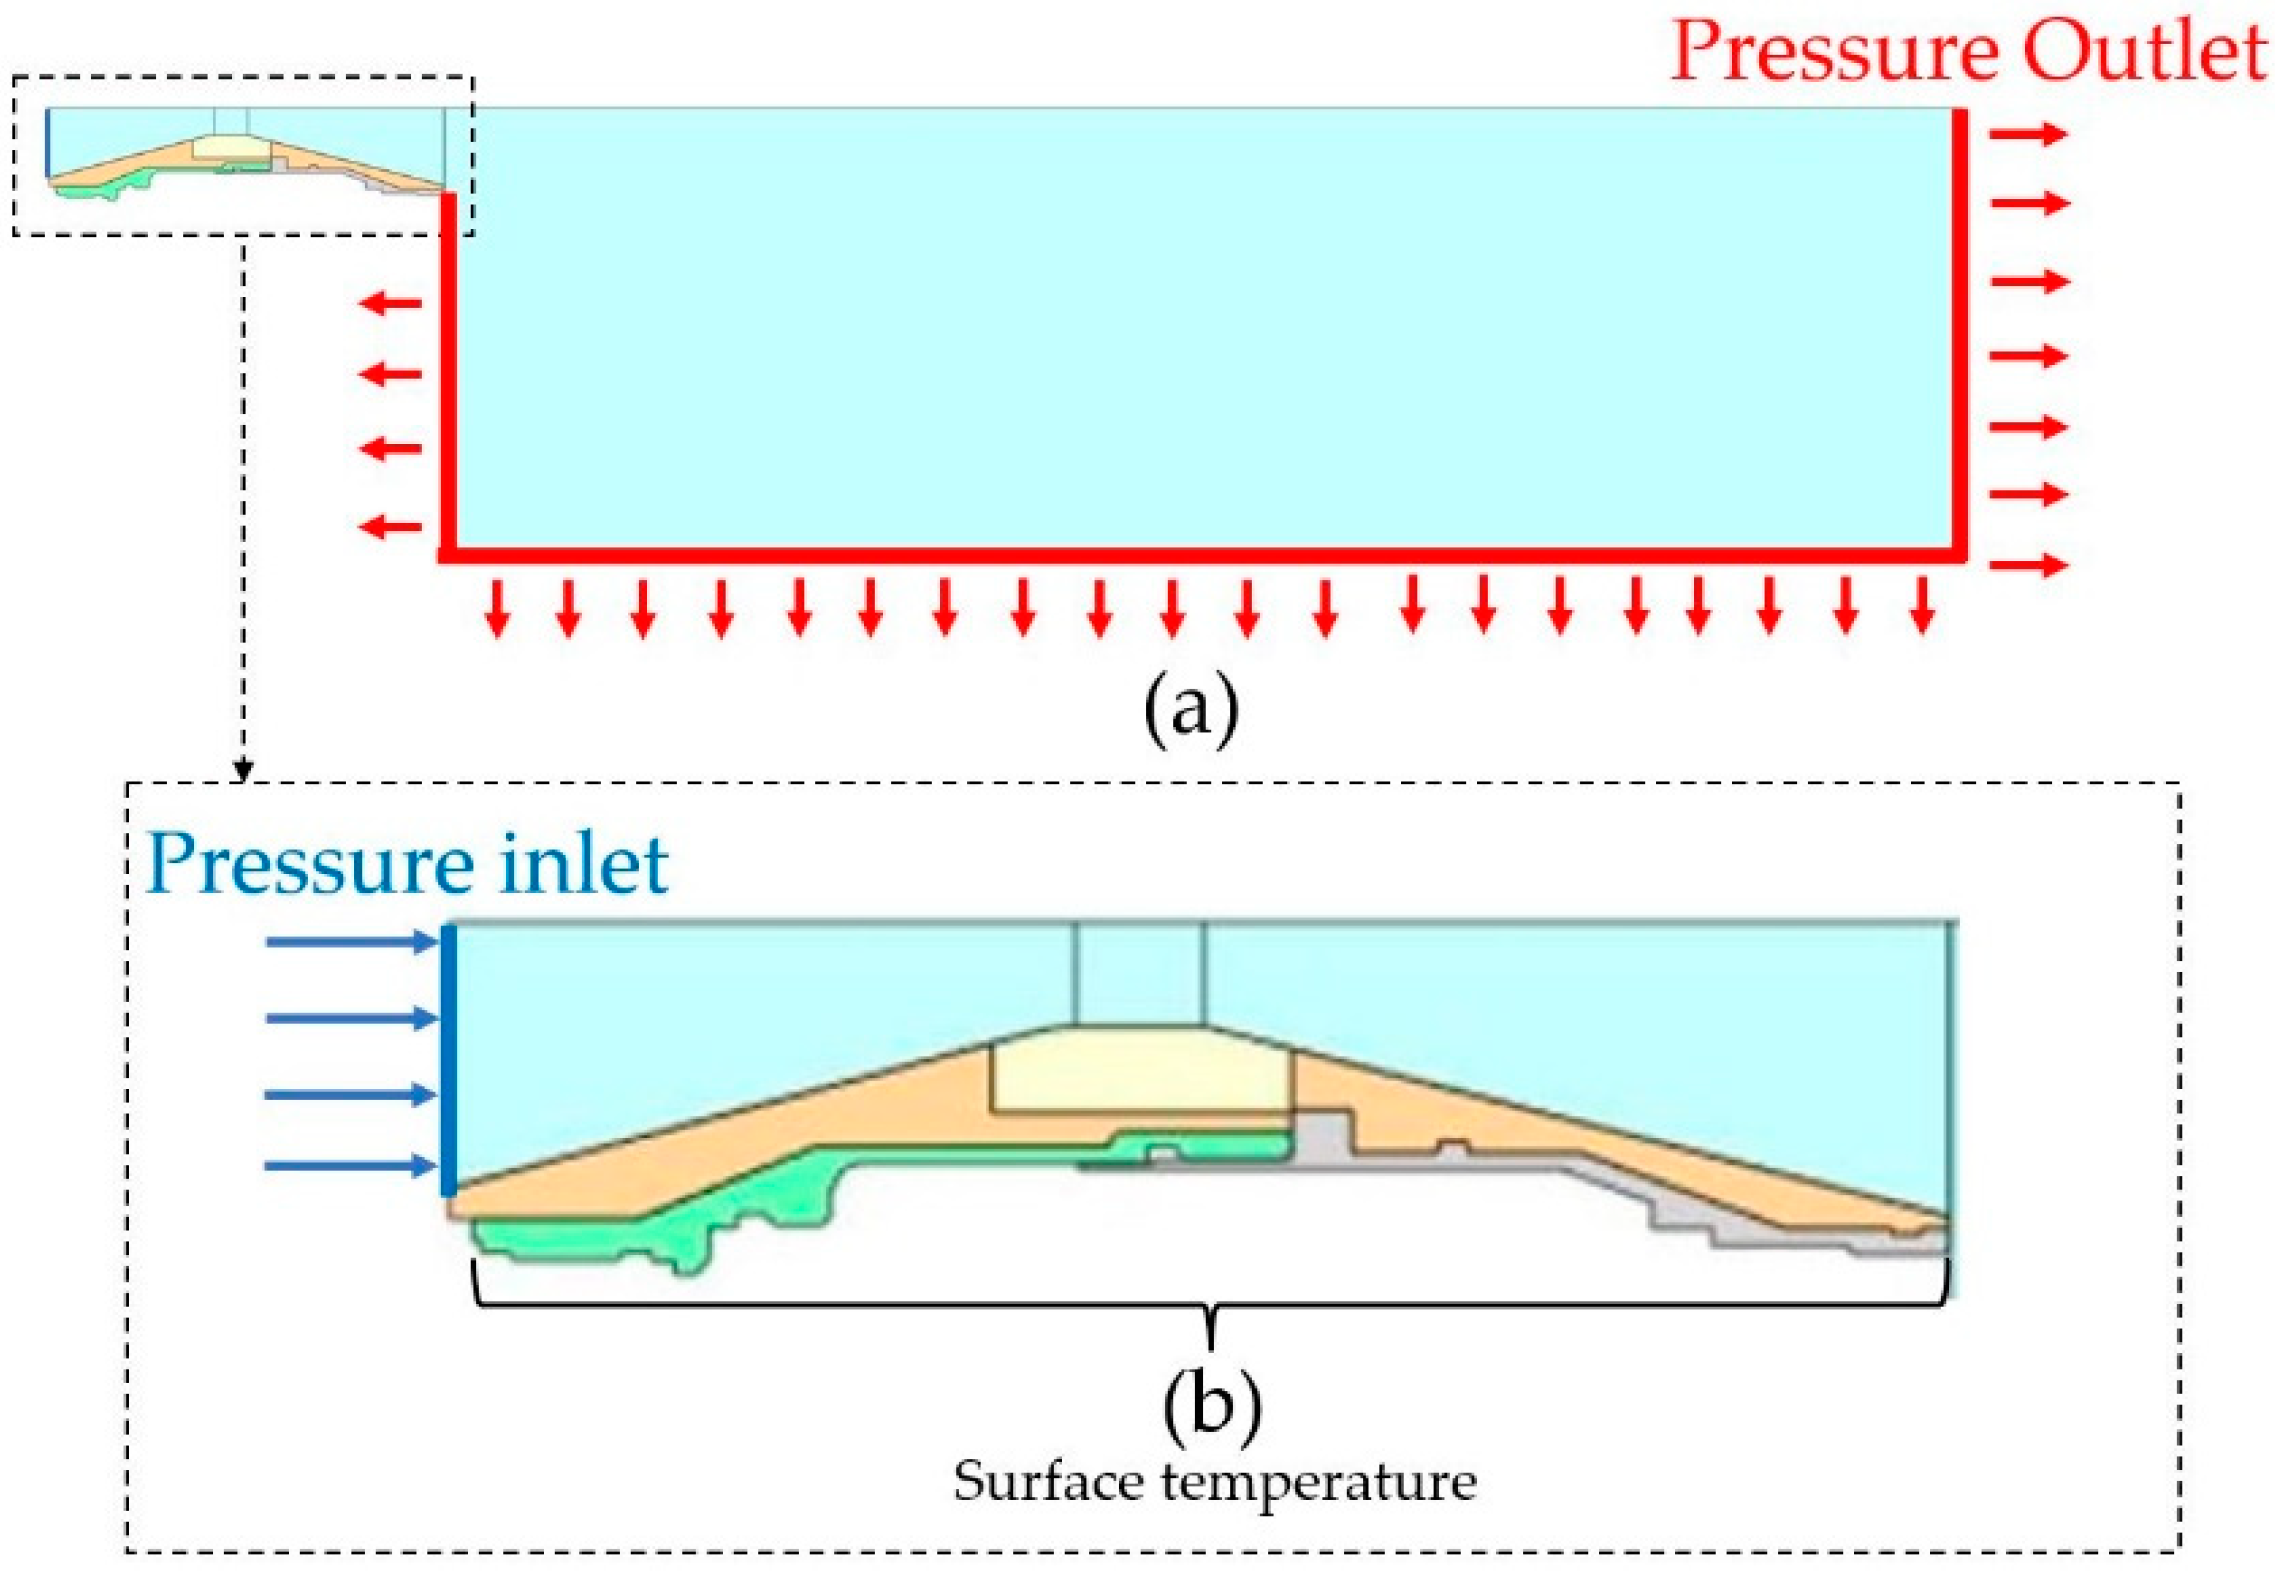
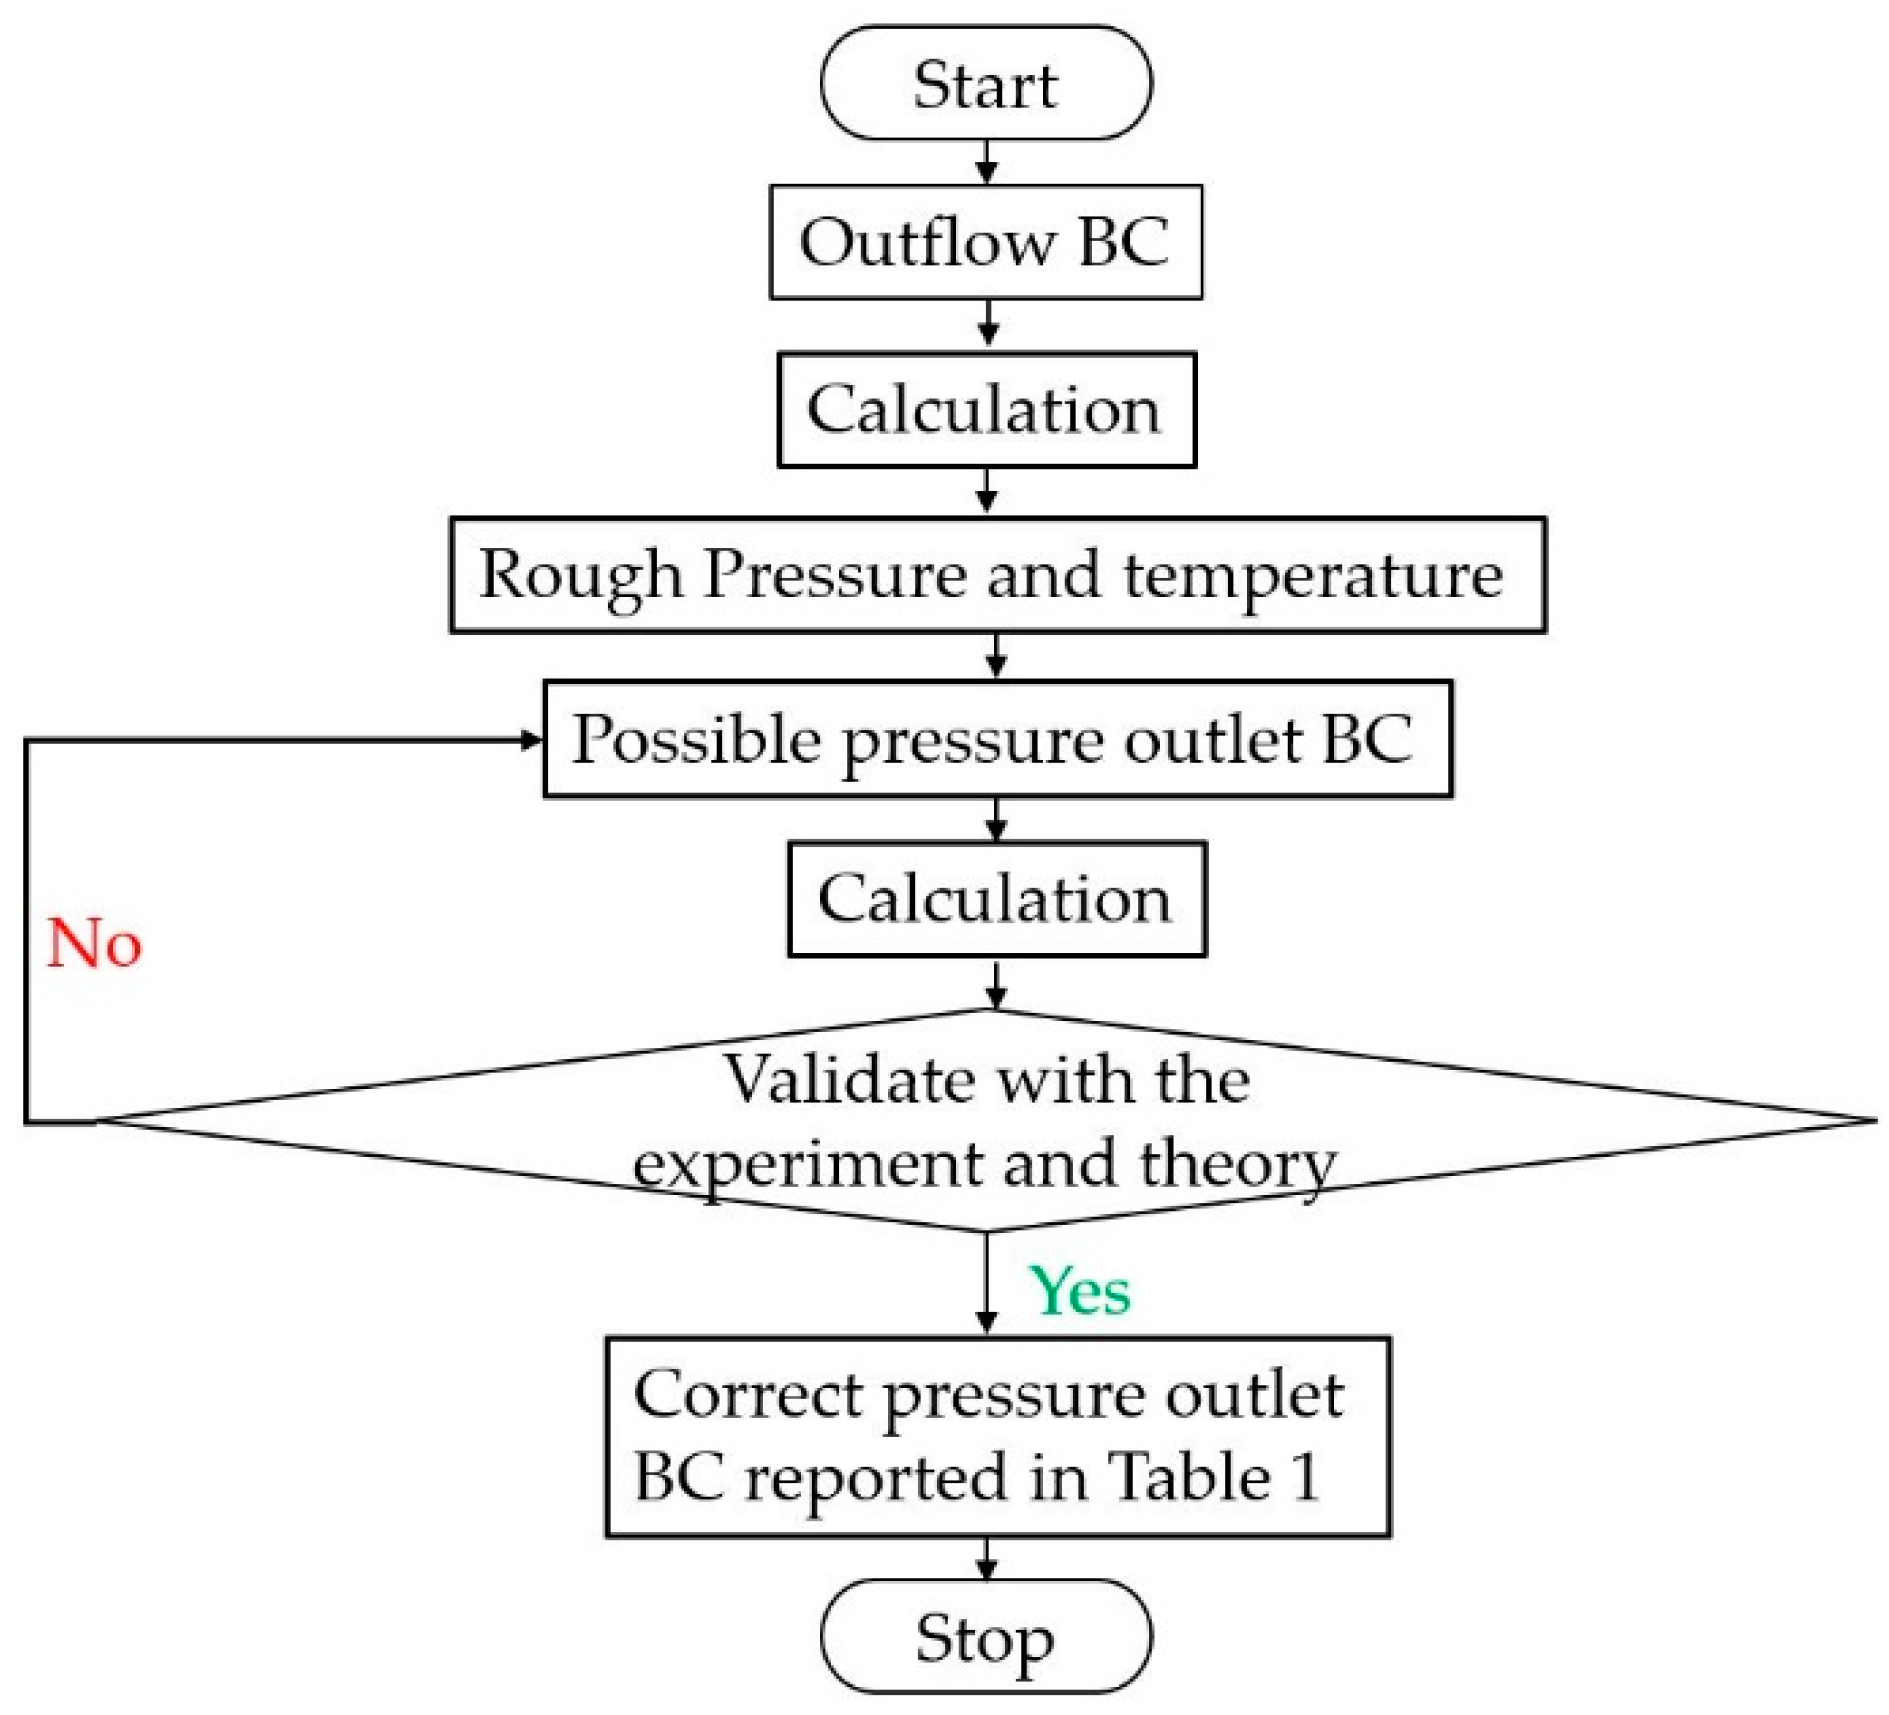
3.3. Boundary Conditions and Simulations

The boundary conditions include the CFD and the FEA settings in the transient state. For example, Figure 9 shows the boundary conditions settings for (a) an overview and (b) an enlarged picture, specifically in the nozzle presented in a dash line box. The pressure outlet setting showed the gas flow behavior outside the nozzle in (a), while (b) revealed inside the nozzle.
In CFD, ANSYS Fluent was used for the simulation. The fluid was assumed to be ideal gas air with a specific heat ratio (γ) of 1.4 and a Sutherland viscosity. The inlet was controlled by a user-defined function (UDF), coded by the authors according to the total pressure, Mach number, and total temperature from the experimental results and theory mentioned in Section 3.1. The fluid density was defined as the ideal gas following [3,6], since it is a supersonic rocket nozzle with M < 5. For the hypersonic level with M > 5, the ideal gas was not governed because the gas was ionized. It must be noted that the software requires an inlet temperature and M settings, but the experiment did not have the related sensors in the inlet position. Therefore, the temperature of the released gas measured at the nozzle outlet by a thermal imager was used as To, as shown in Figure 2, and was then calculated back to Ti using Equation (7). It was calculated that the Ti was 3364.40 K. For an inlet M = 0.234, Equation (9) was employed, since we know the exact shape of the nozzle. In addition, the pressure and temperature settings at the outlet were defined based on the experiment and pre-simulation technique reported in next section. The simulation results were calculated every 0.01 s from the start to a time of 2.4 s following the combustion time, so the computer calculated and displayed the results for 2400 time steps, 20 iterations per time step. In addition, other CFD settings are reported in Table 1, while the others used the default setting.
Moreover, the pressure outlet’s boundary condition (BC) came from a pre-simulation technique. First, the outlet BC at the enclosure in Figure 9 was set as an outflow of 1, one of the BCs in Fluent software. The outflow of 1 means all gas flows from the outlet in that position. In this step, the results reported rough pressures and temperatures in all domains. Then, the rough results at the outlet BC were probed and employed as a possible pressure outlet BC to calculate the simulation results again. The simulation results in this step have higher accuracy than the previous step using outflow. Next, the simulation, pressure, and temperature results were compared with the experimental results captured from both cameras and total pressure at the nozzle outlet (Po) from theory calculated by Equation (8) to check the accuracy. The pre-simulation process was repeated until the possible pressure outlet BC provided the simulation results with high accuracy, corresponding to the experimental results and theory. Finally, the correct pressure outlet BC was used as the actual pressure outlet BC and is shown in Table 1, alongside the gauge pressures and temperature. Figure 10 reports the pre-simulation technique to find the correct pressure outlet BC at the enclosure.
In FEA, ANSYS structural analysis was employed for the simulation. The FEA setting was easier to use than the CFD setting. Since it is a one-way simulation, the CFD results were forwarded to the FEA simulation as loads in the transient state. Again, the surface temperature at the nozzle surface was 333.15 K, which was assigned following the experimental results. Table 2 reports the FEA settings. All the properties were provided by the nozzle’s manufacturer settings for the materials observed in Figure 7.
After completing the CFD and FEA boundary condition settings, the software would calculate and then display the numerical results as shade colors for easy data analysis. Finally, the CHTA results, for example, flow behavior and temperature fluctuation in a transient state released from the nozzle were compared to the experimental results captured from both cameras. In addition, the Mach number and total pressure inside the nozzle were validated with the thrust equations in Section 2.3. Then, the simulation process was repeated to revise the models and the boundary conditions if they were inaccurate.

4. Results and Discussion

This section is divided into gas flow and ablation results. In fact, the simulation results can display the transient state from 0–2.4 s, but a specific time at 1.2 s was considered in this article for a more straightforward analysis and discussion. The authors confirmed that using the time at 1.2 s, at which the nozzle had the maximum total pressure from the combustion for analysis, did not alter the conclusions.

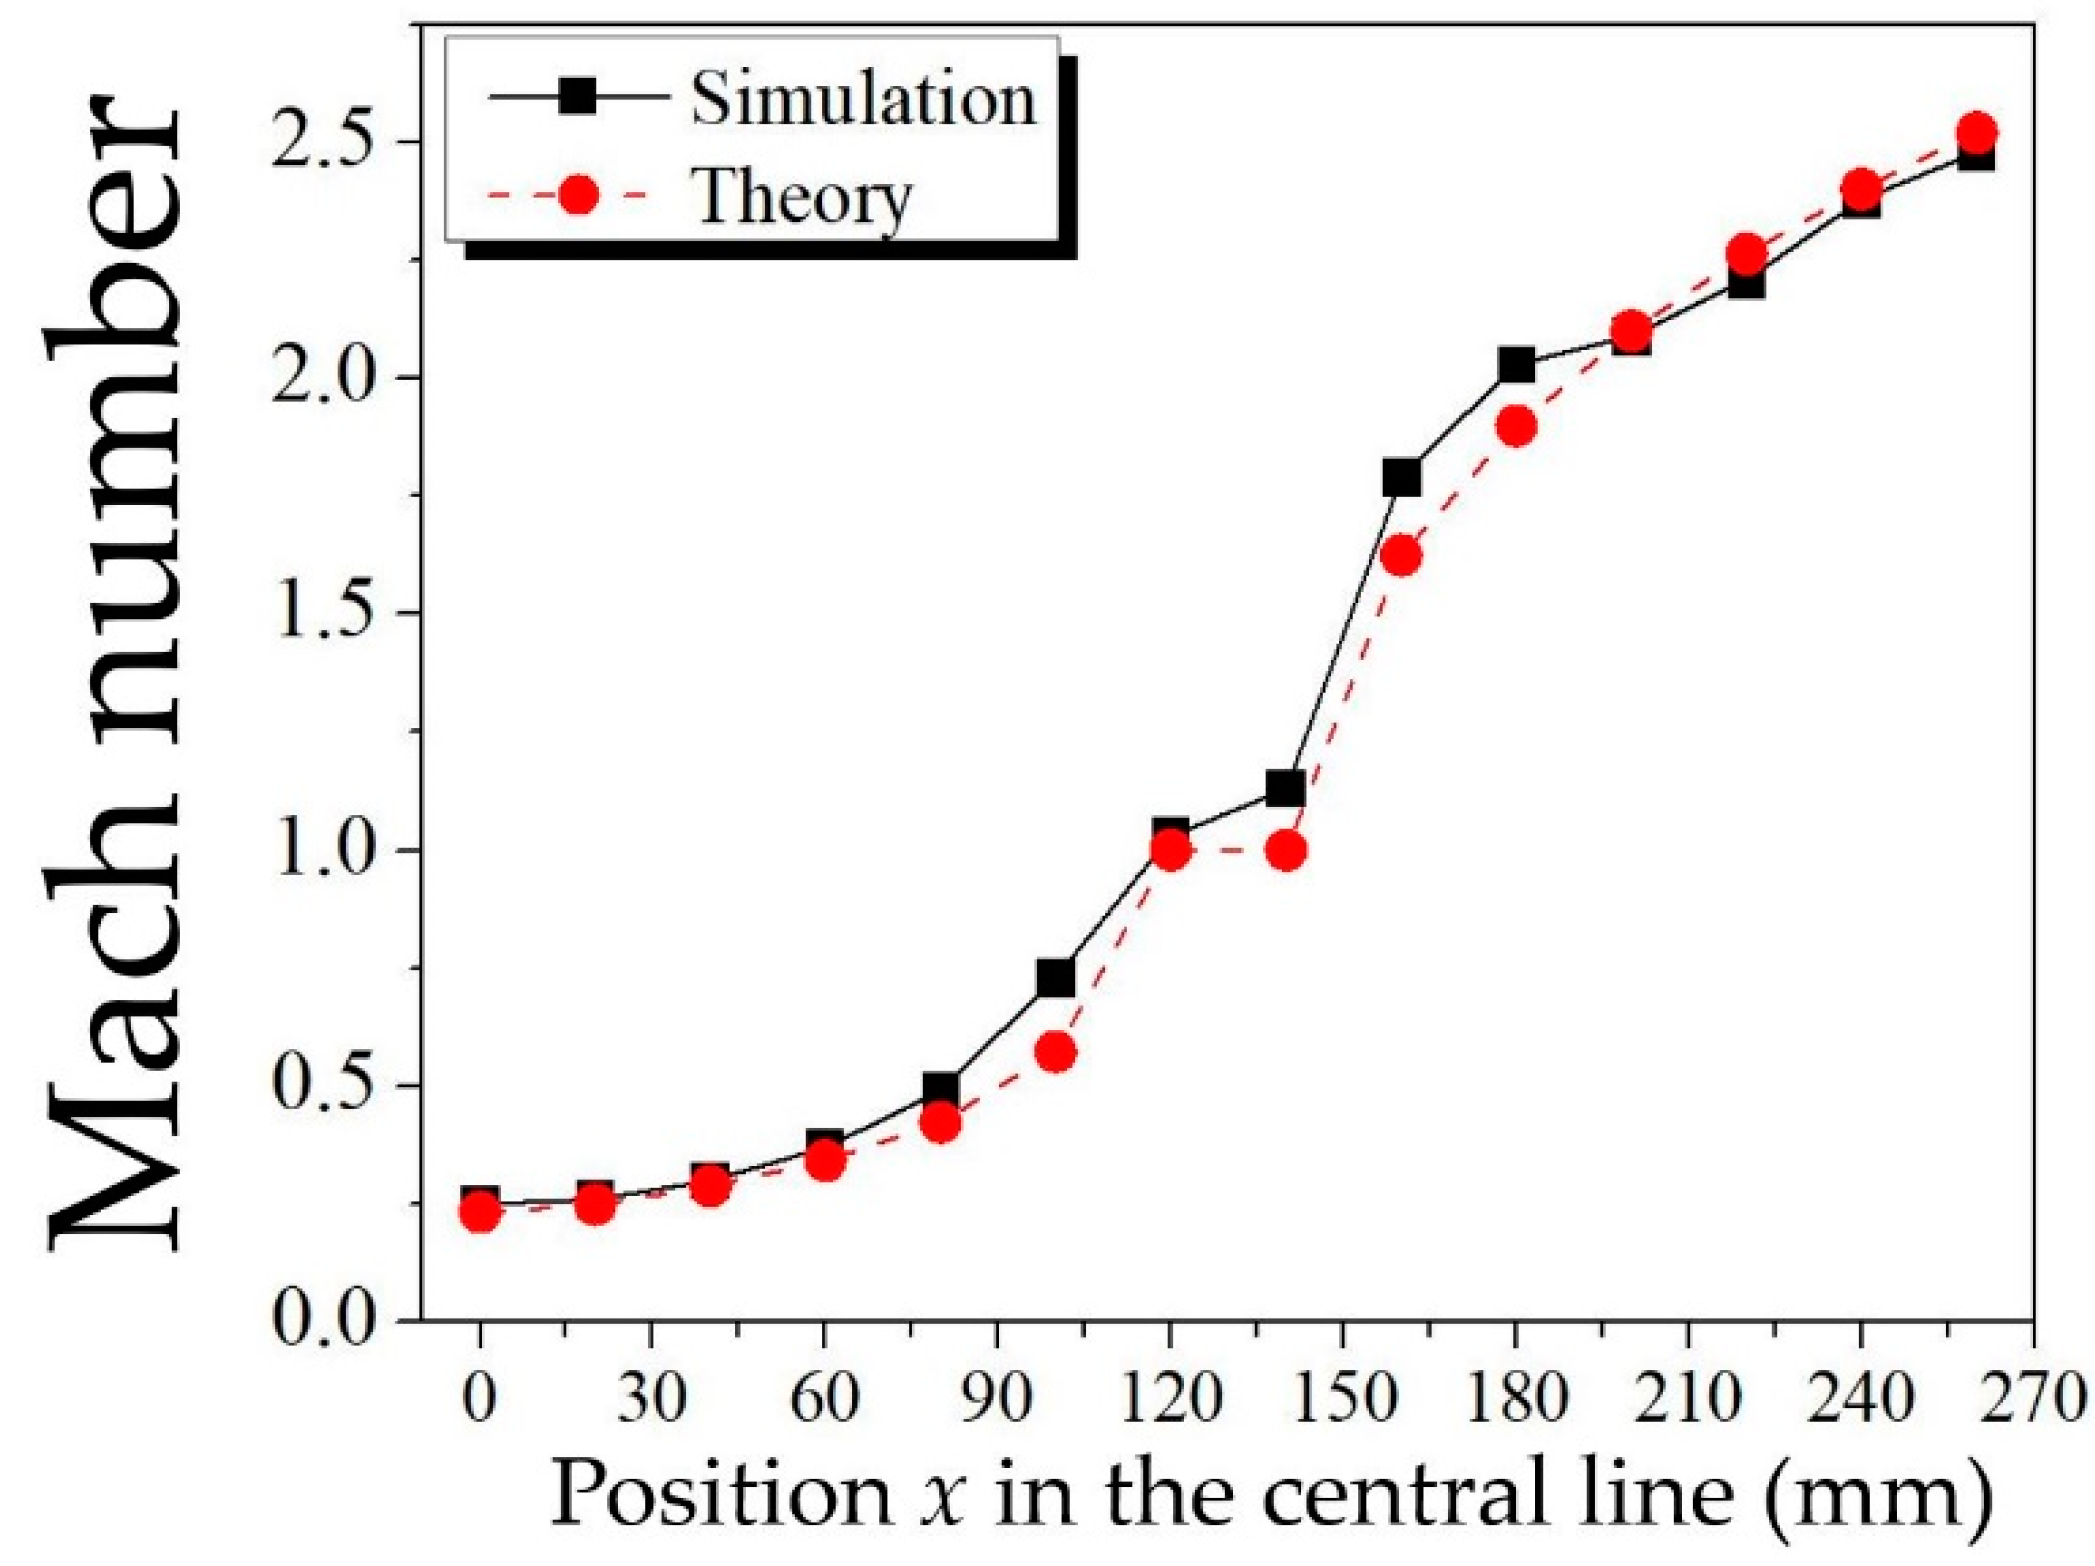
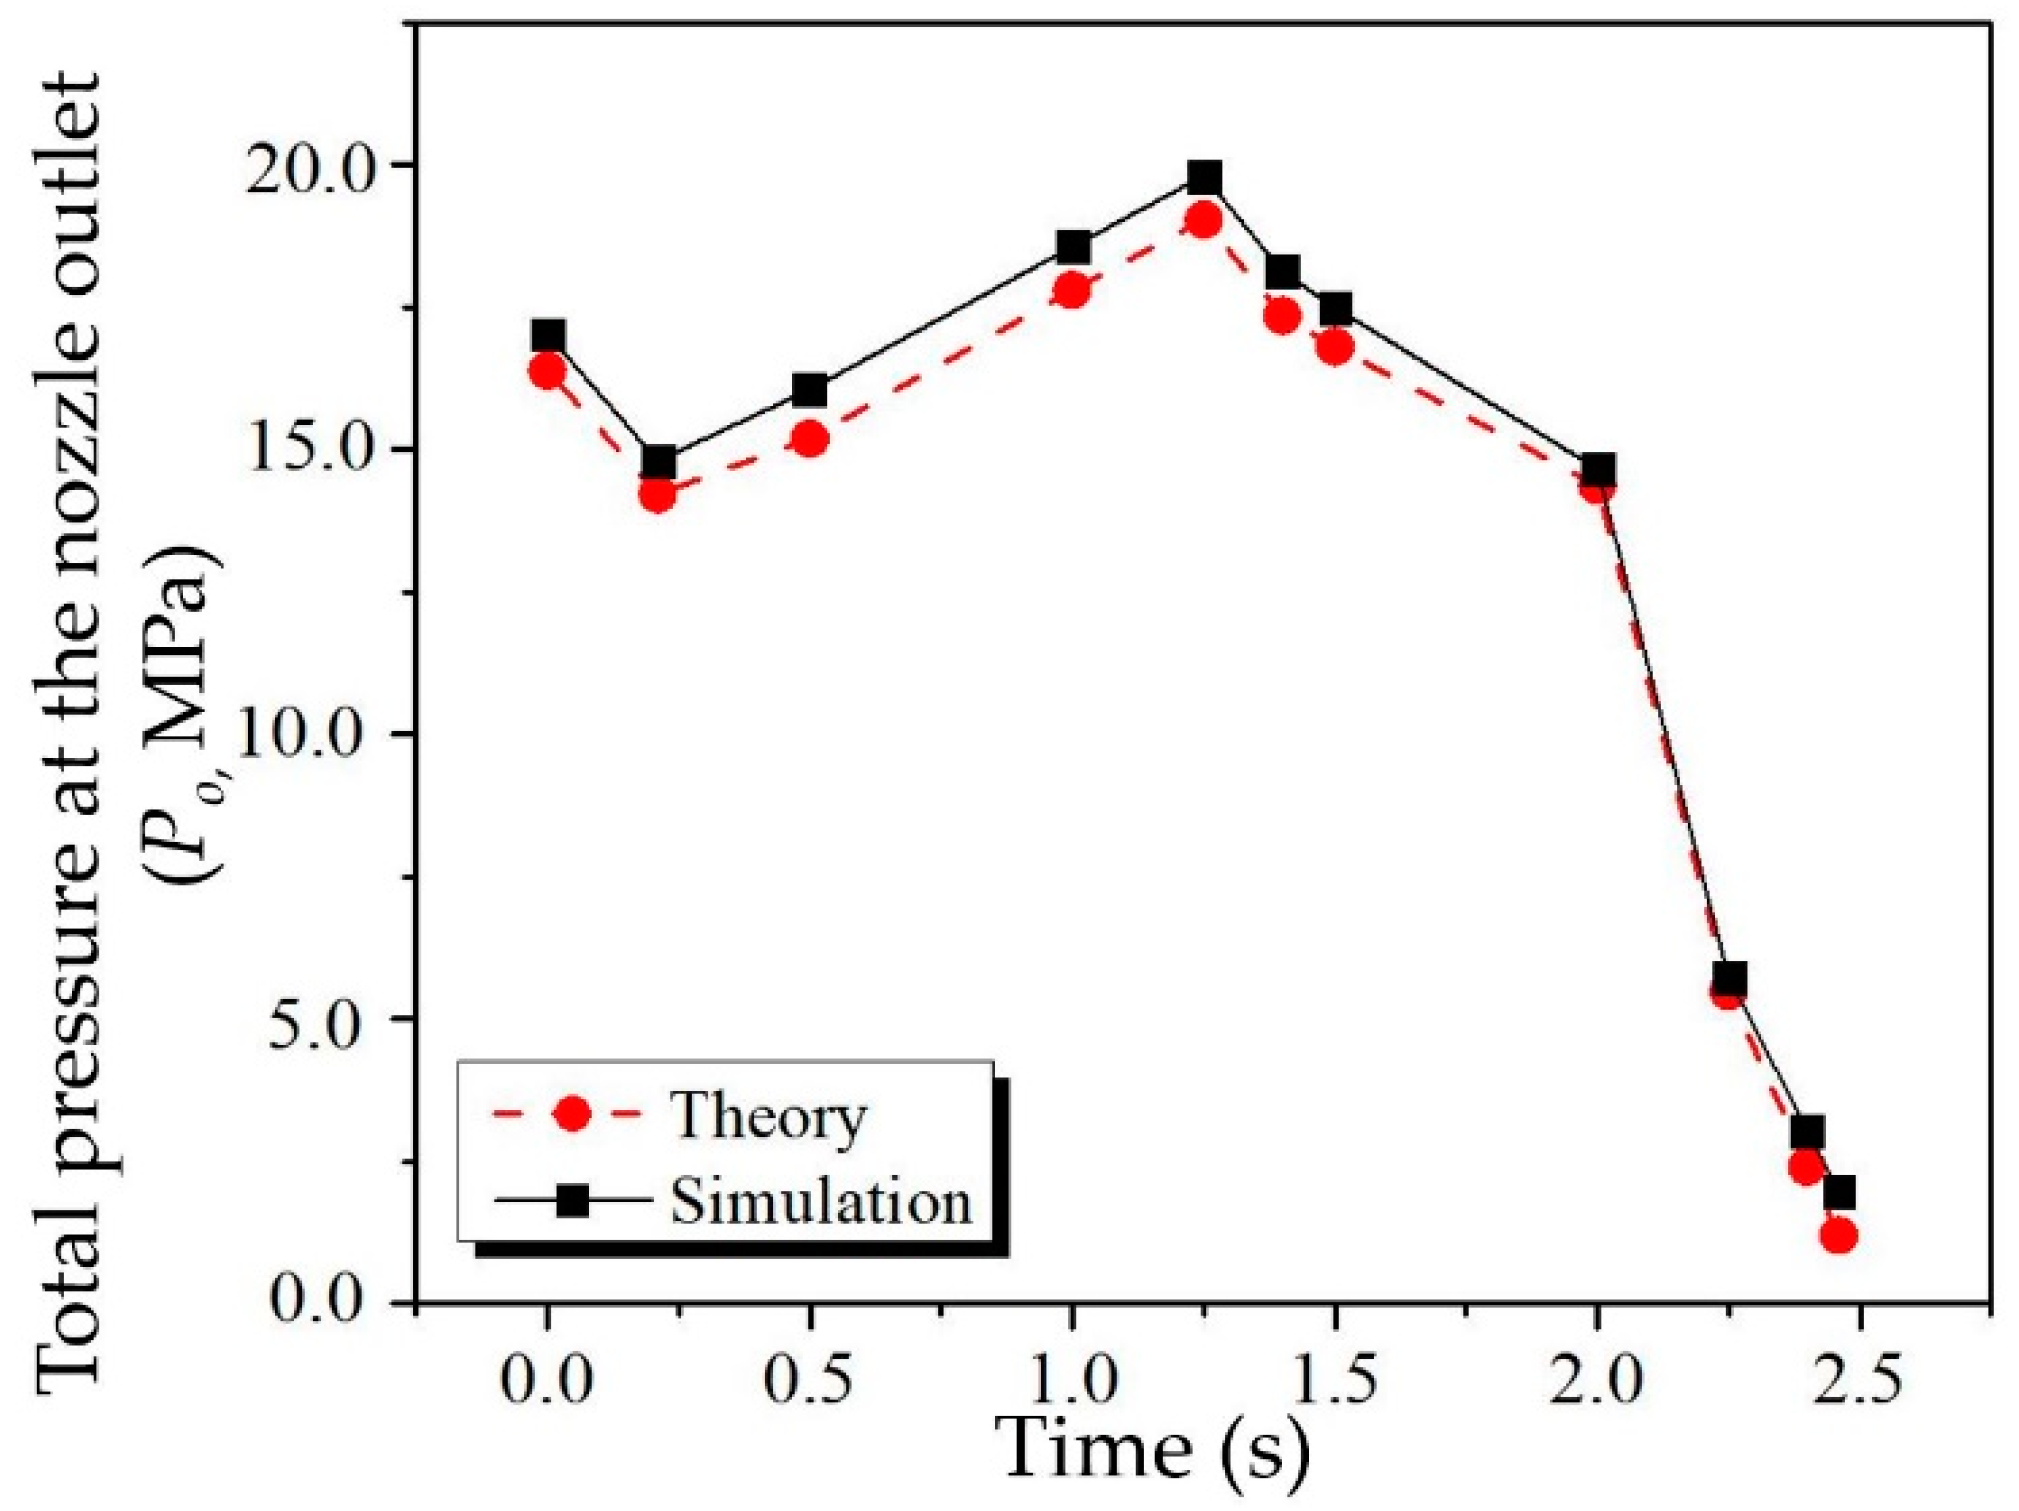
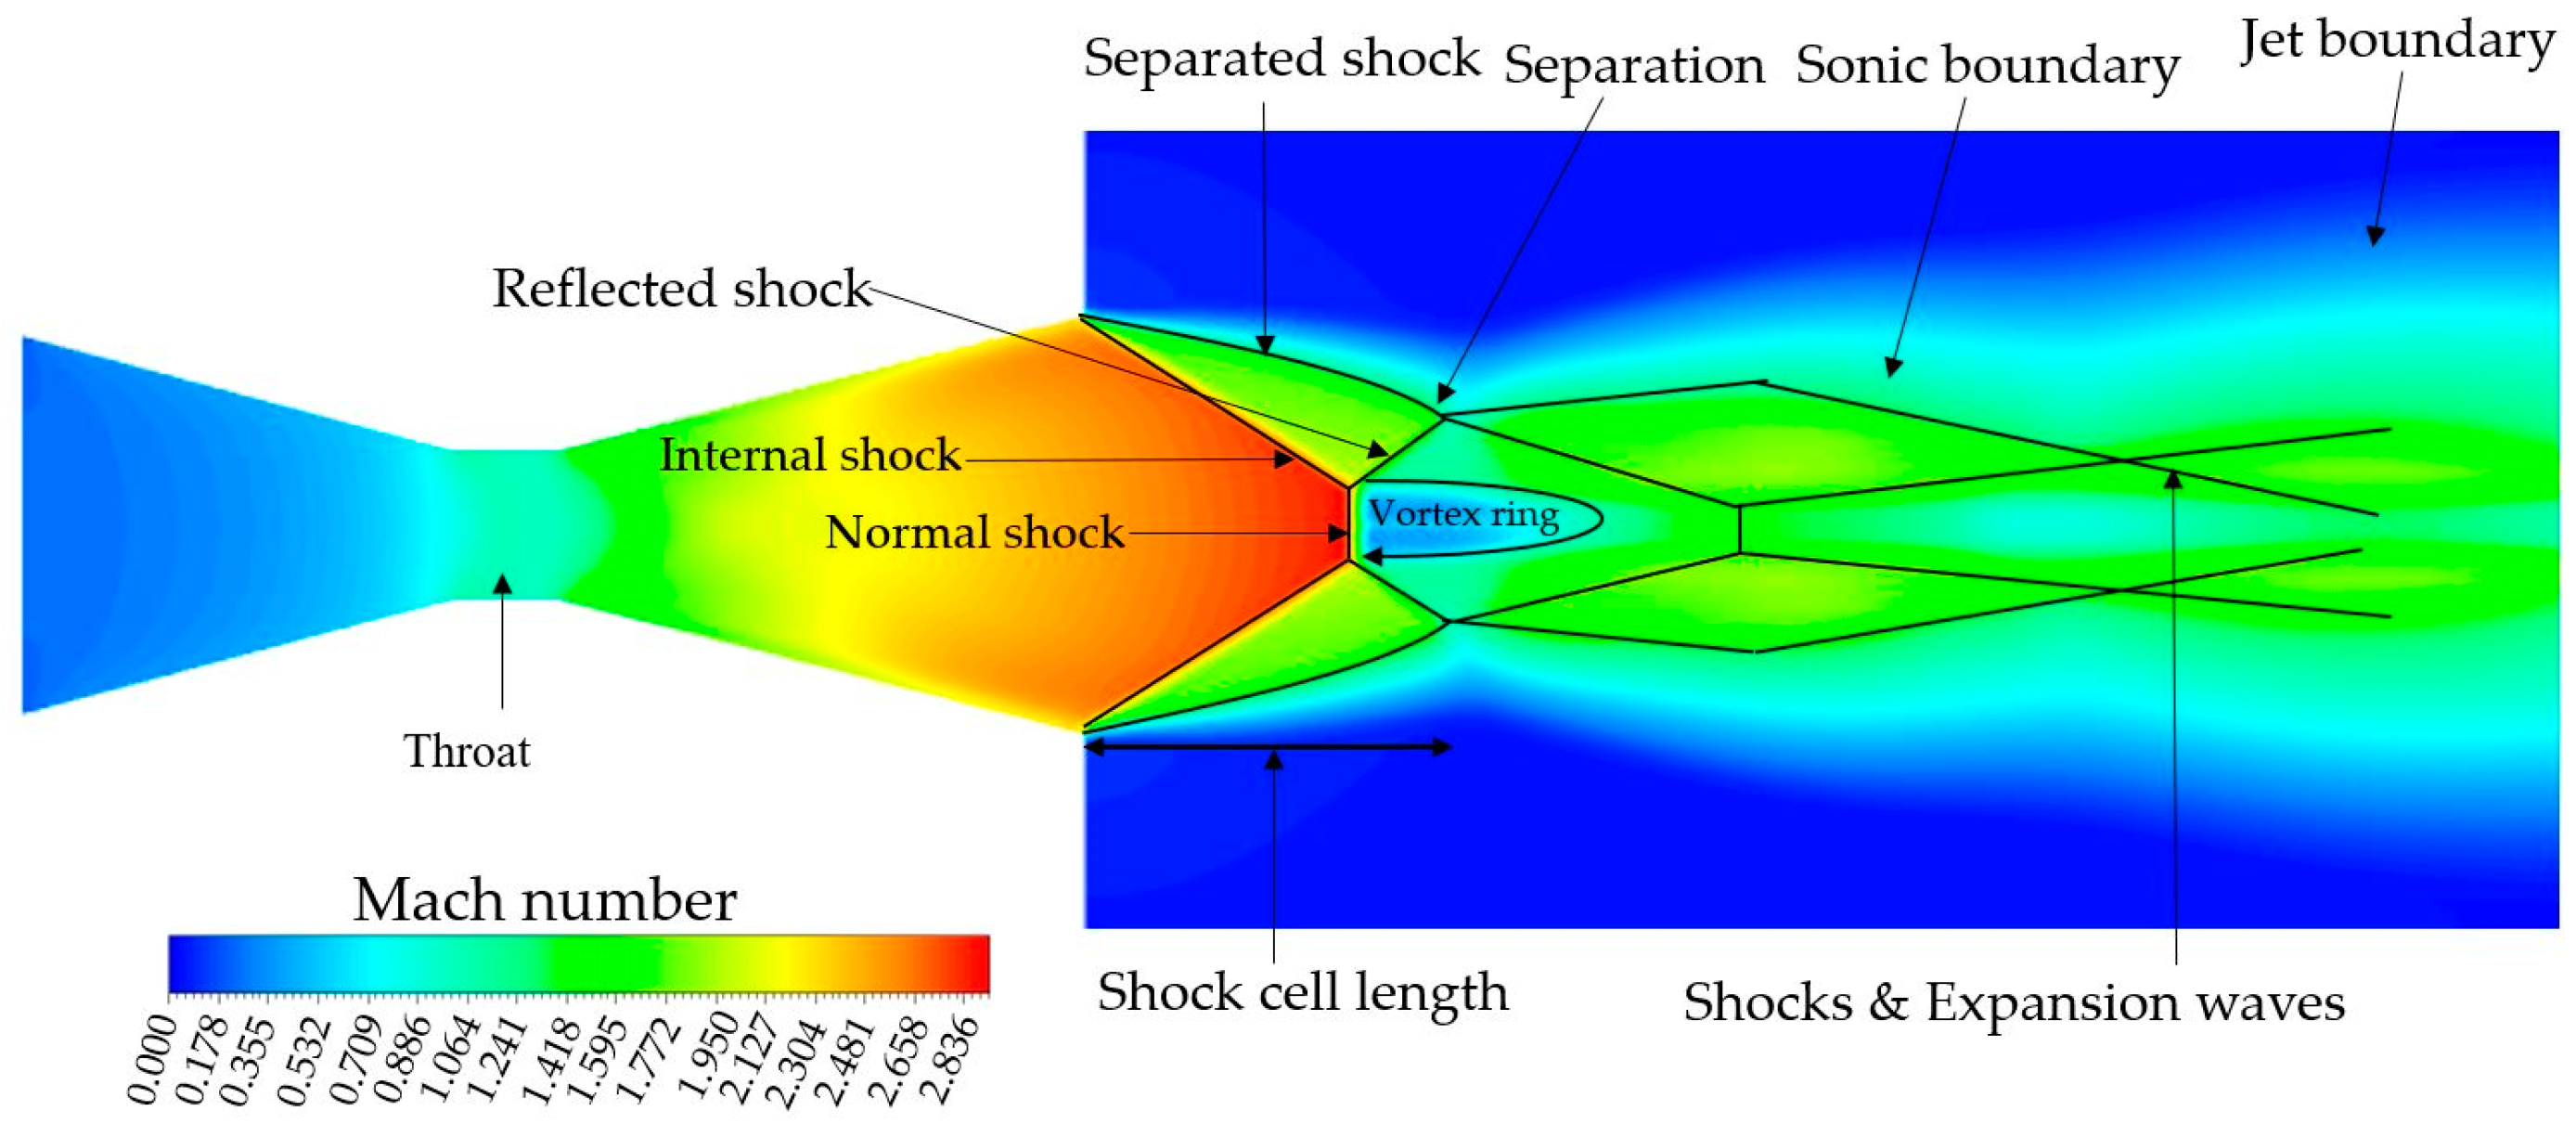
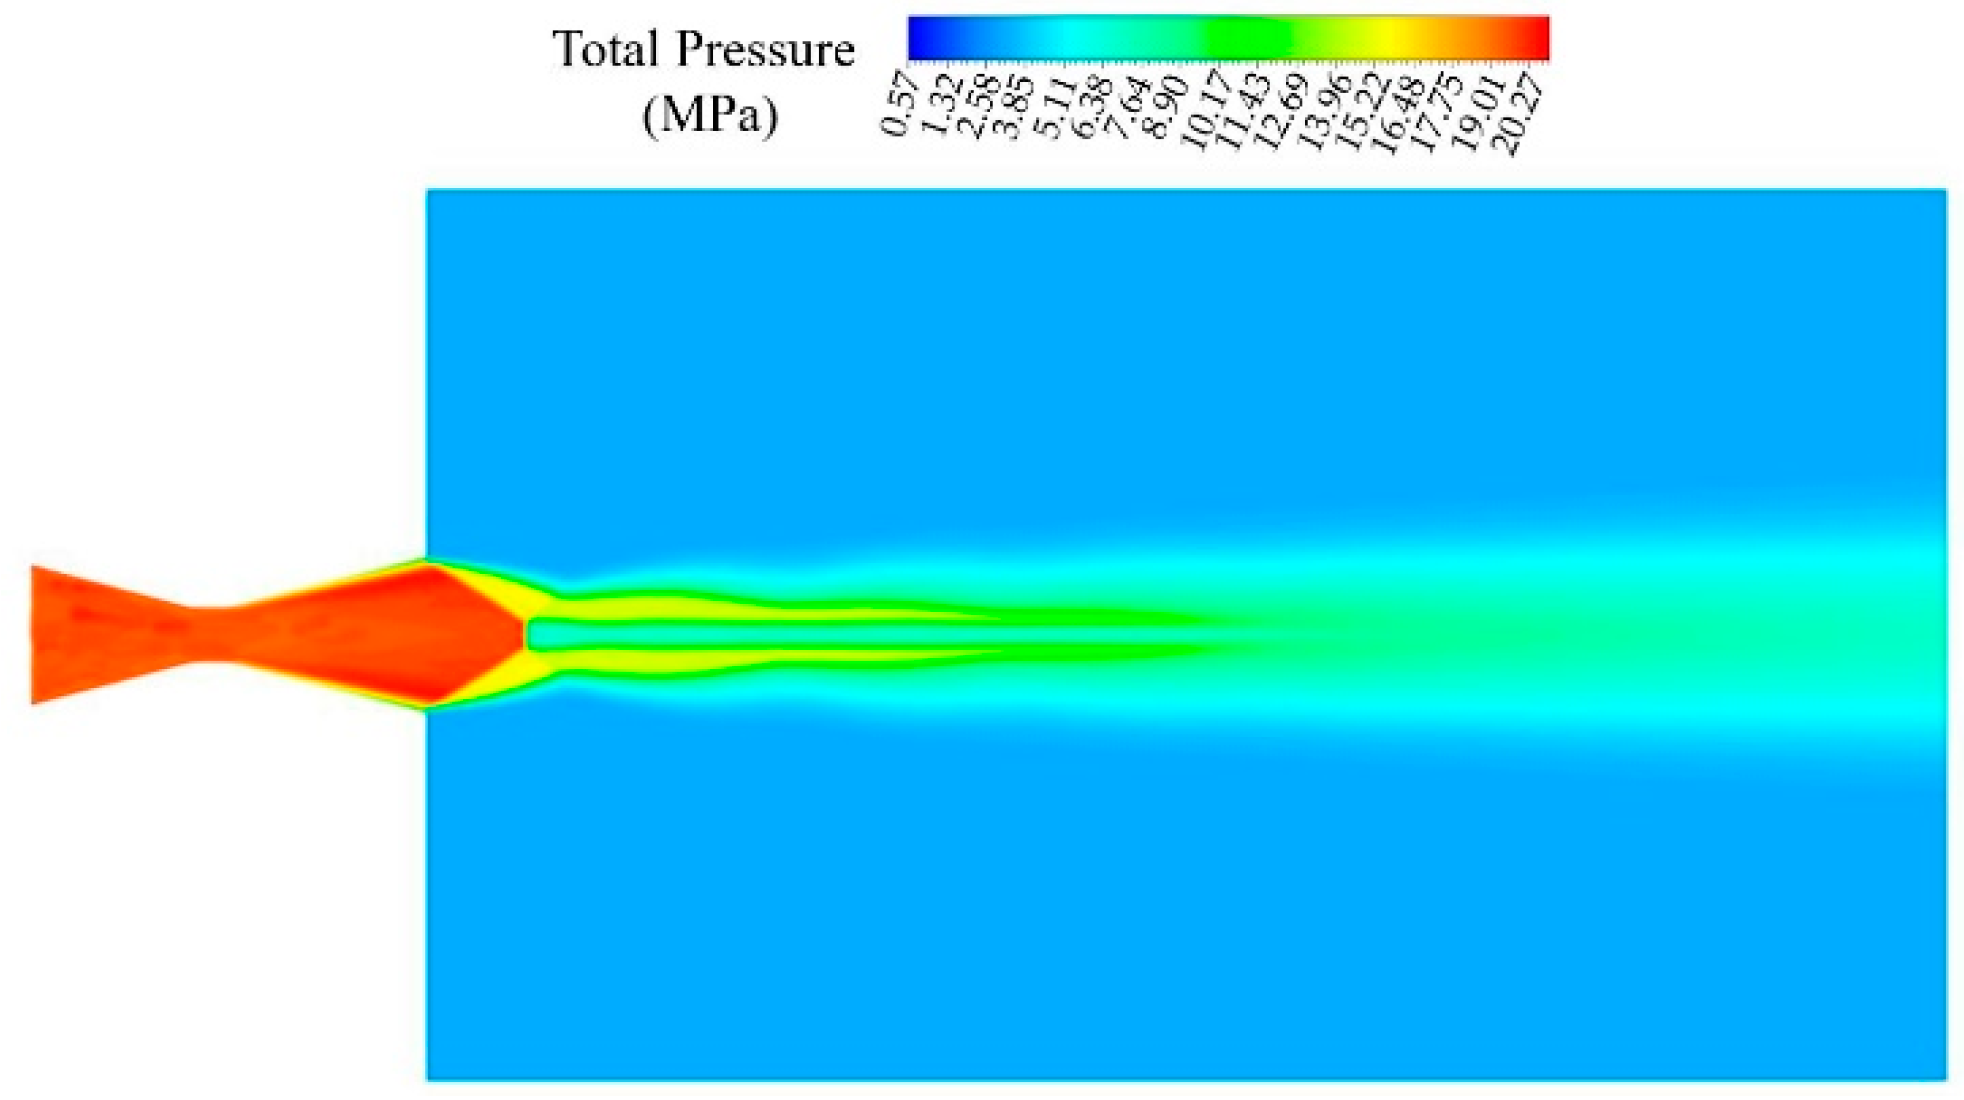
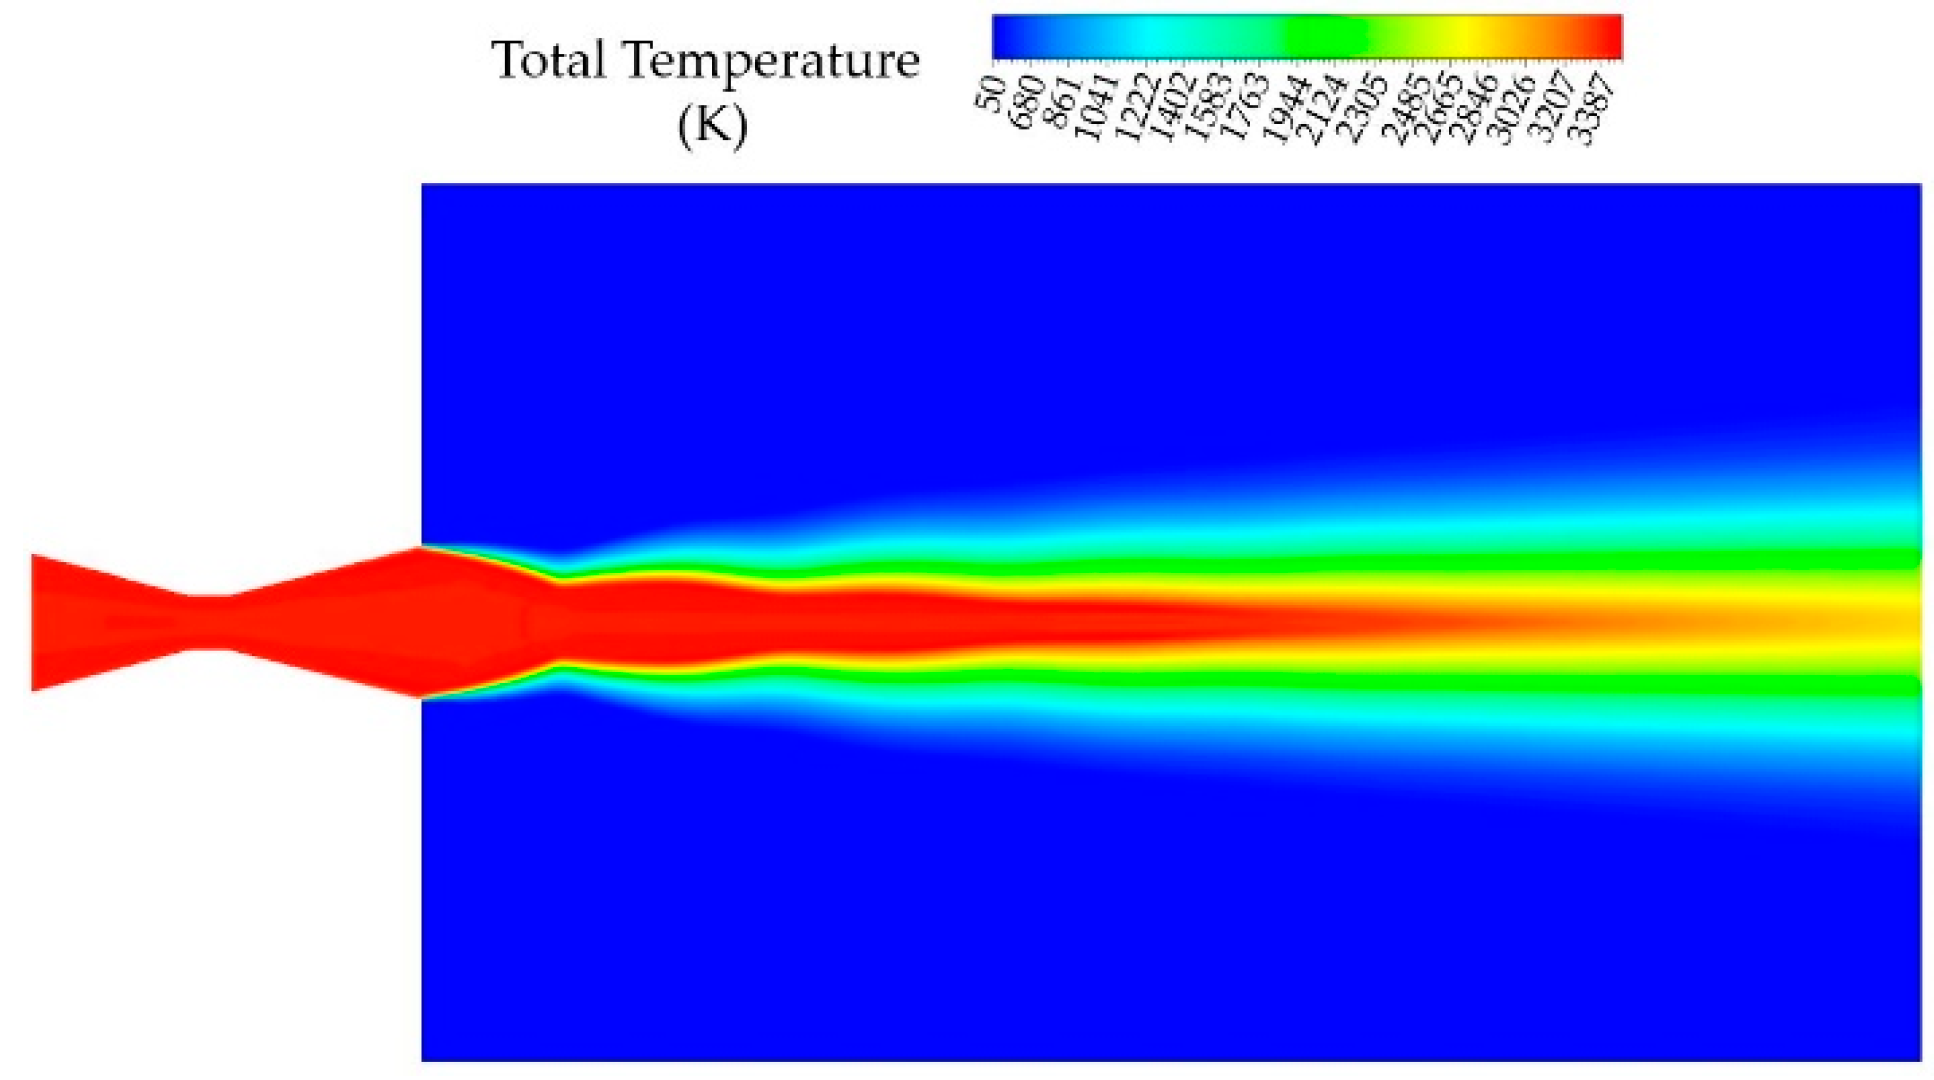
4.1. Gas Flow Behavior
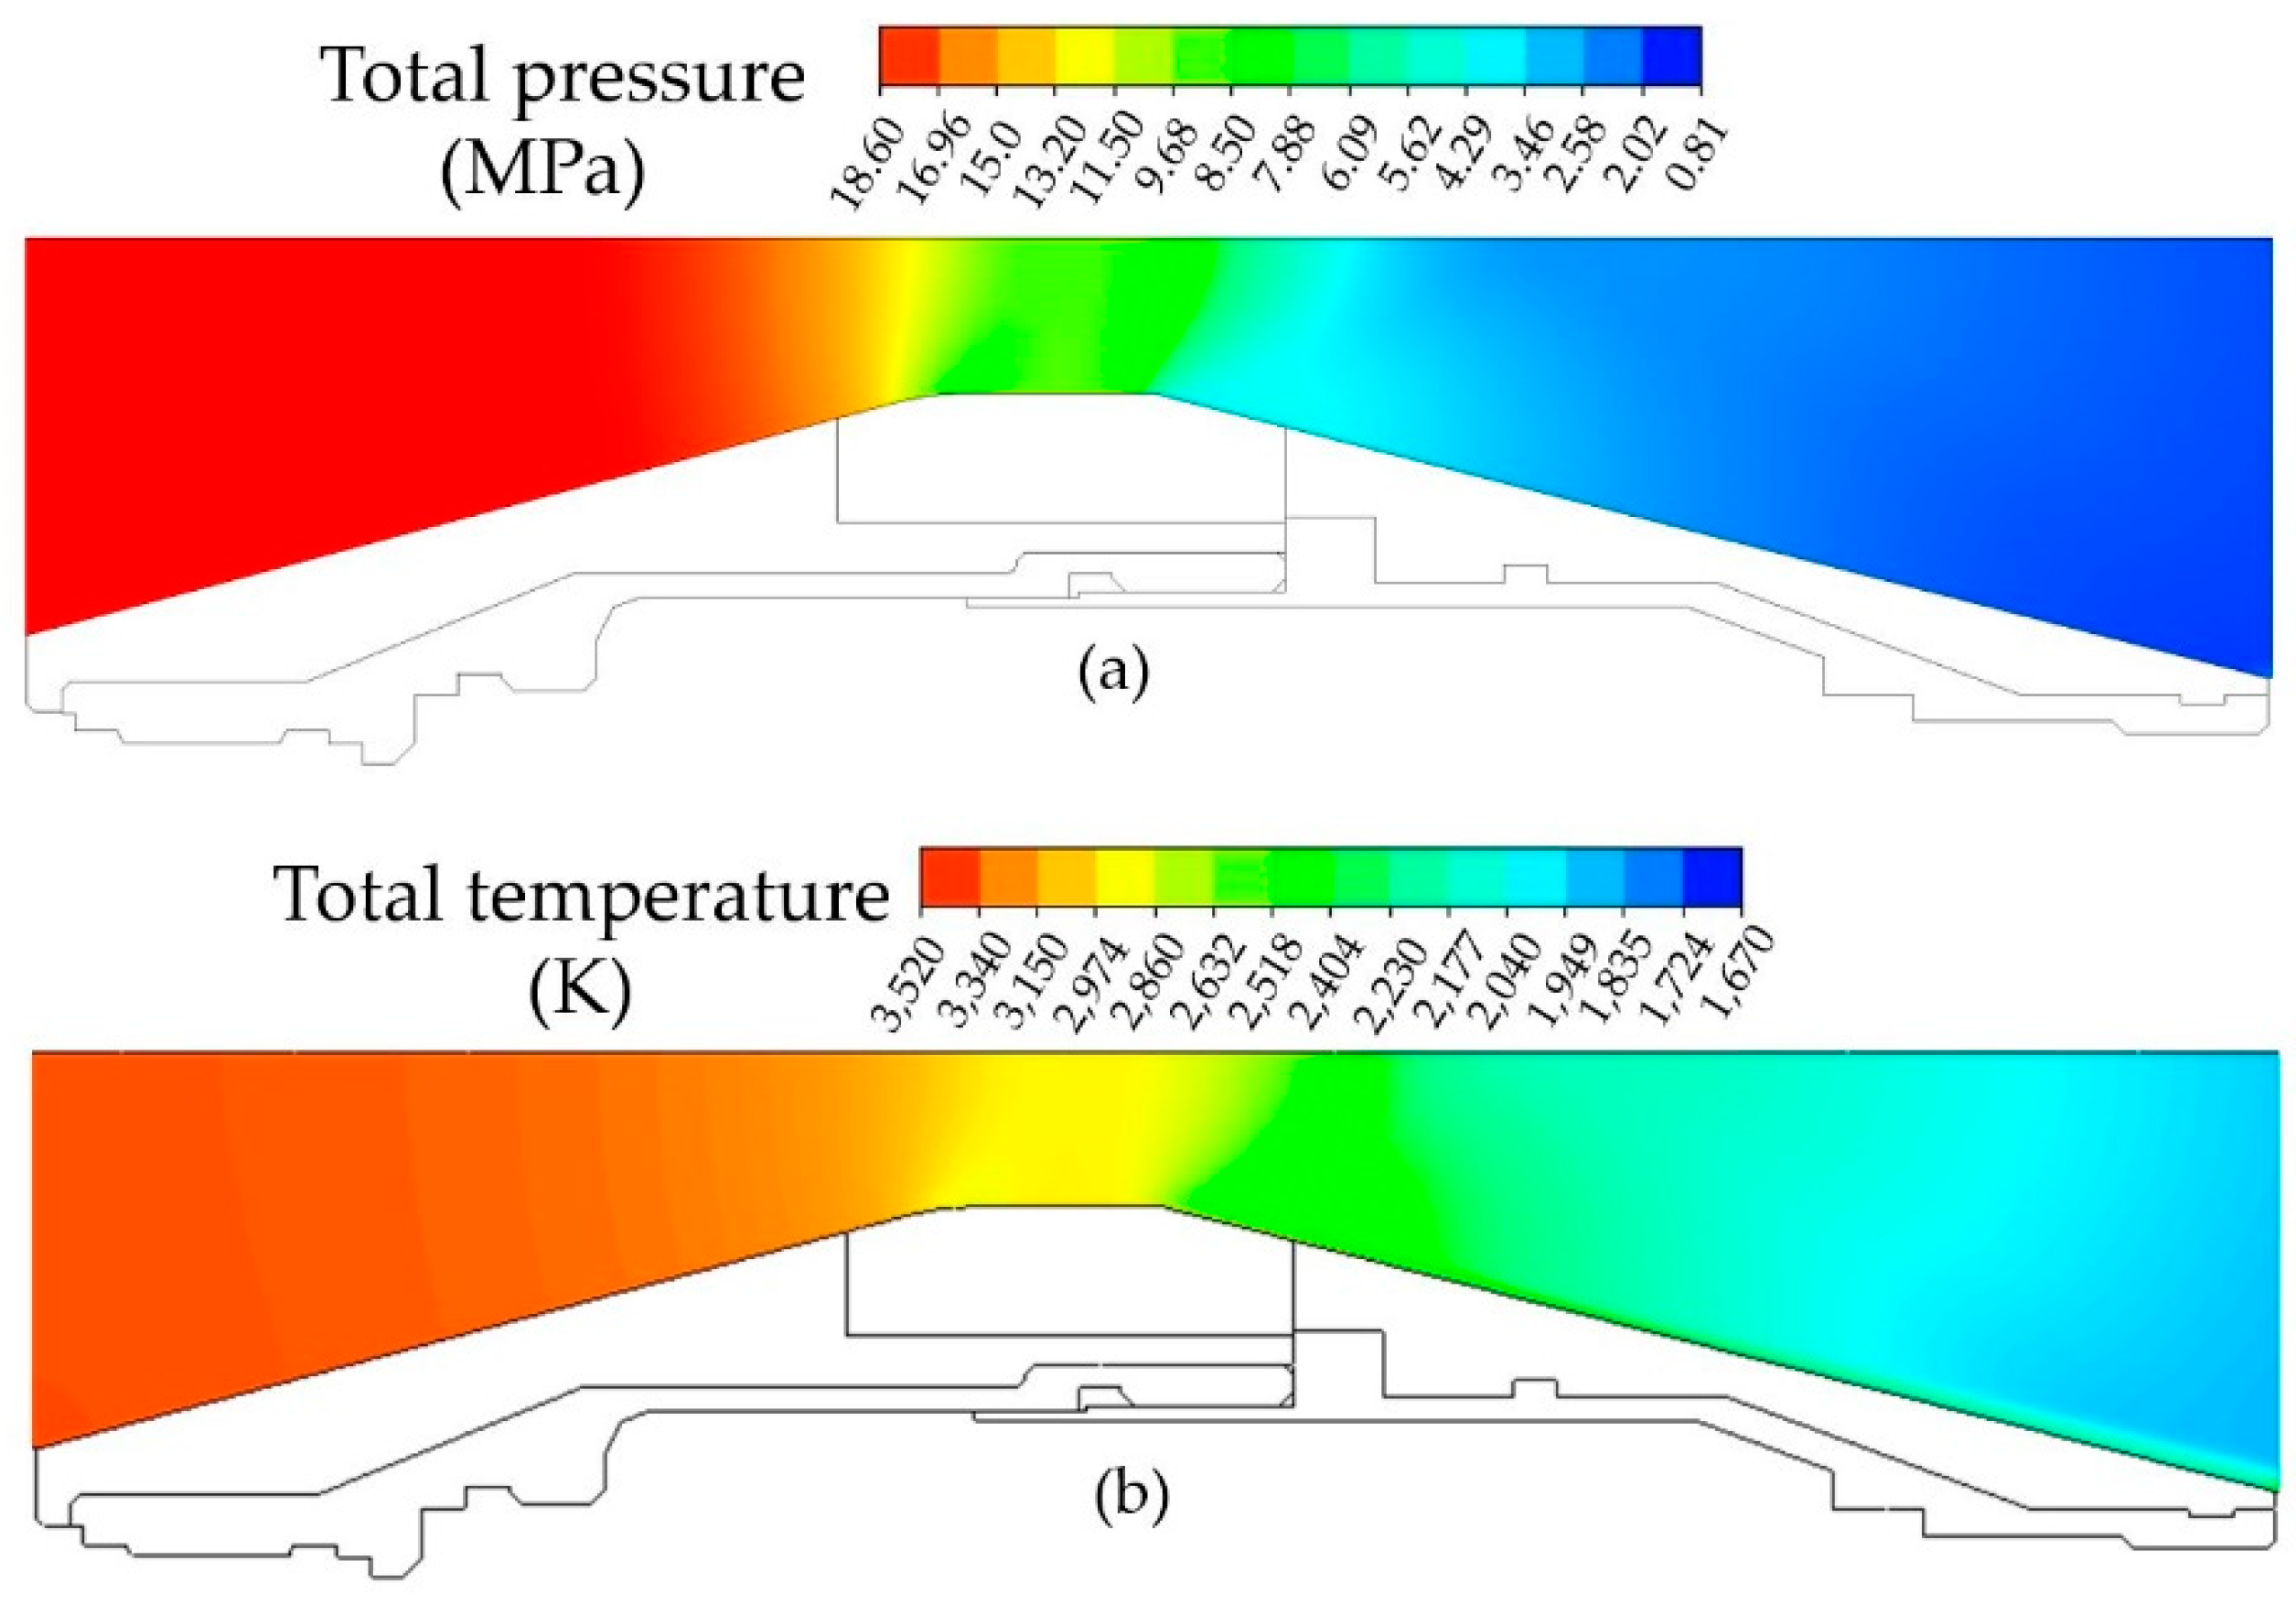
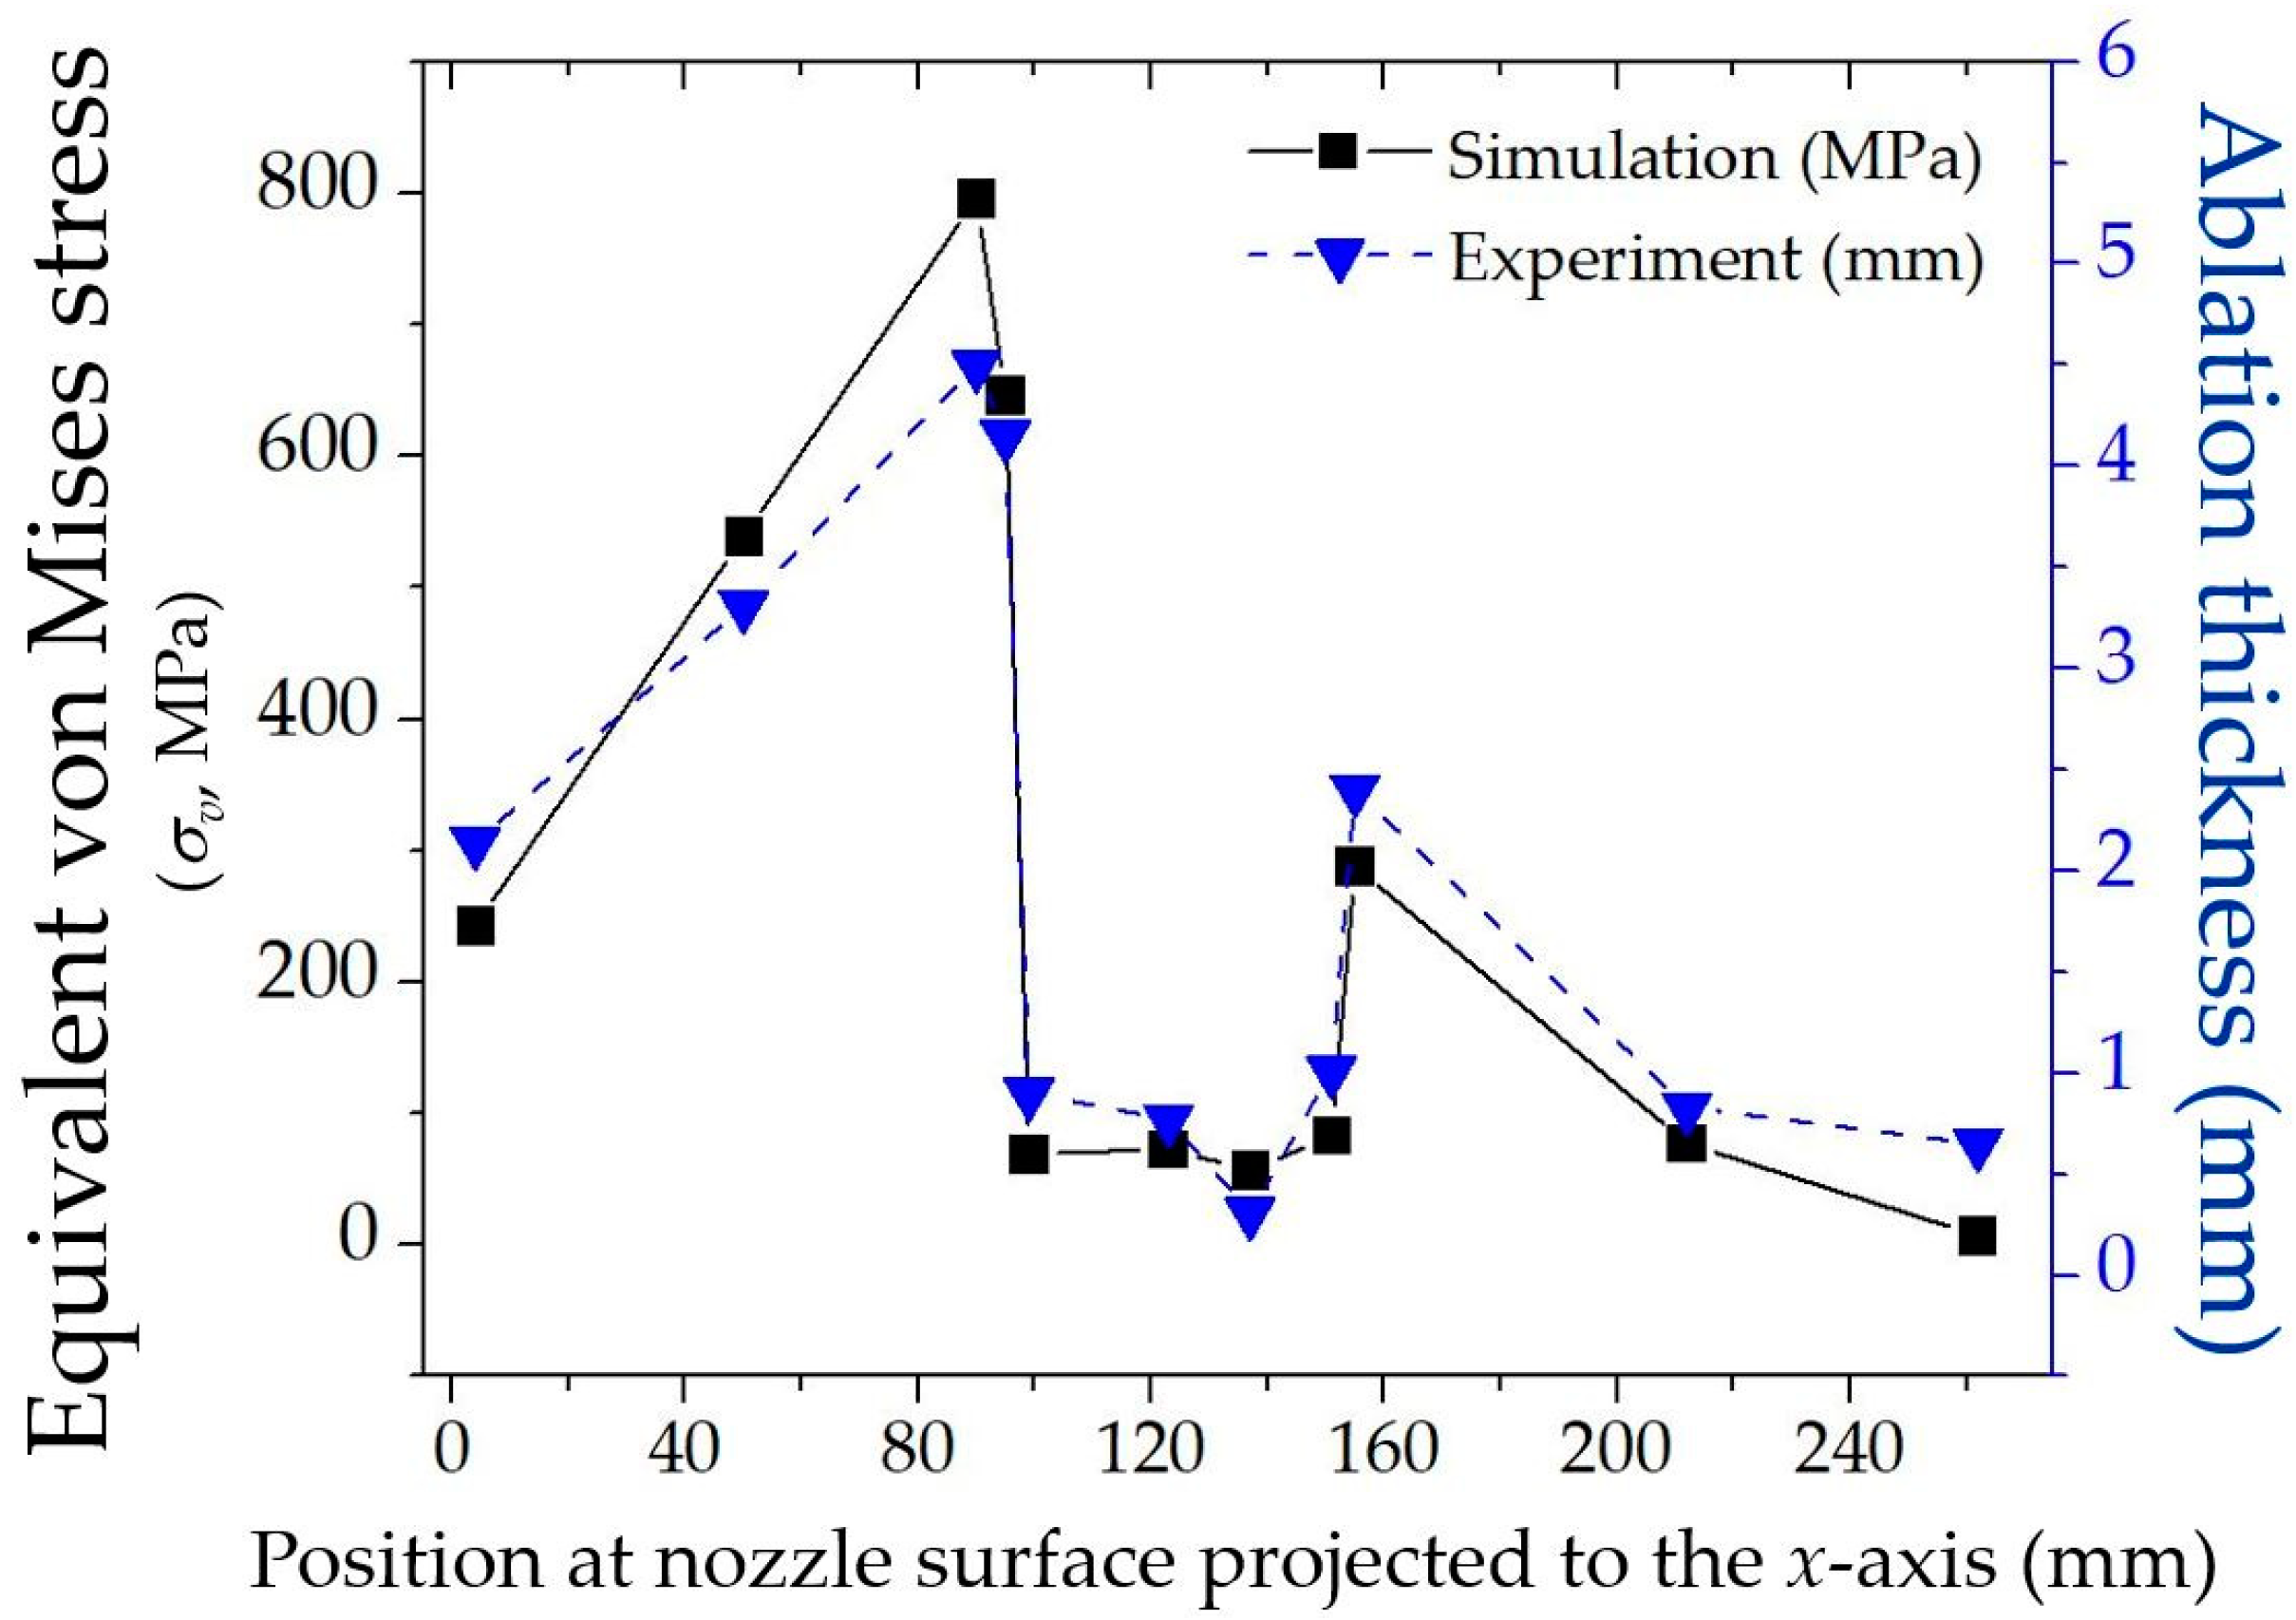
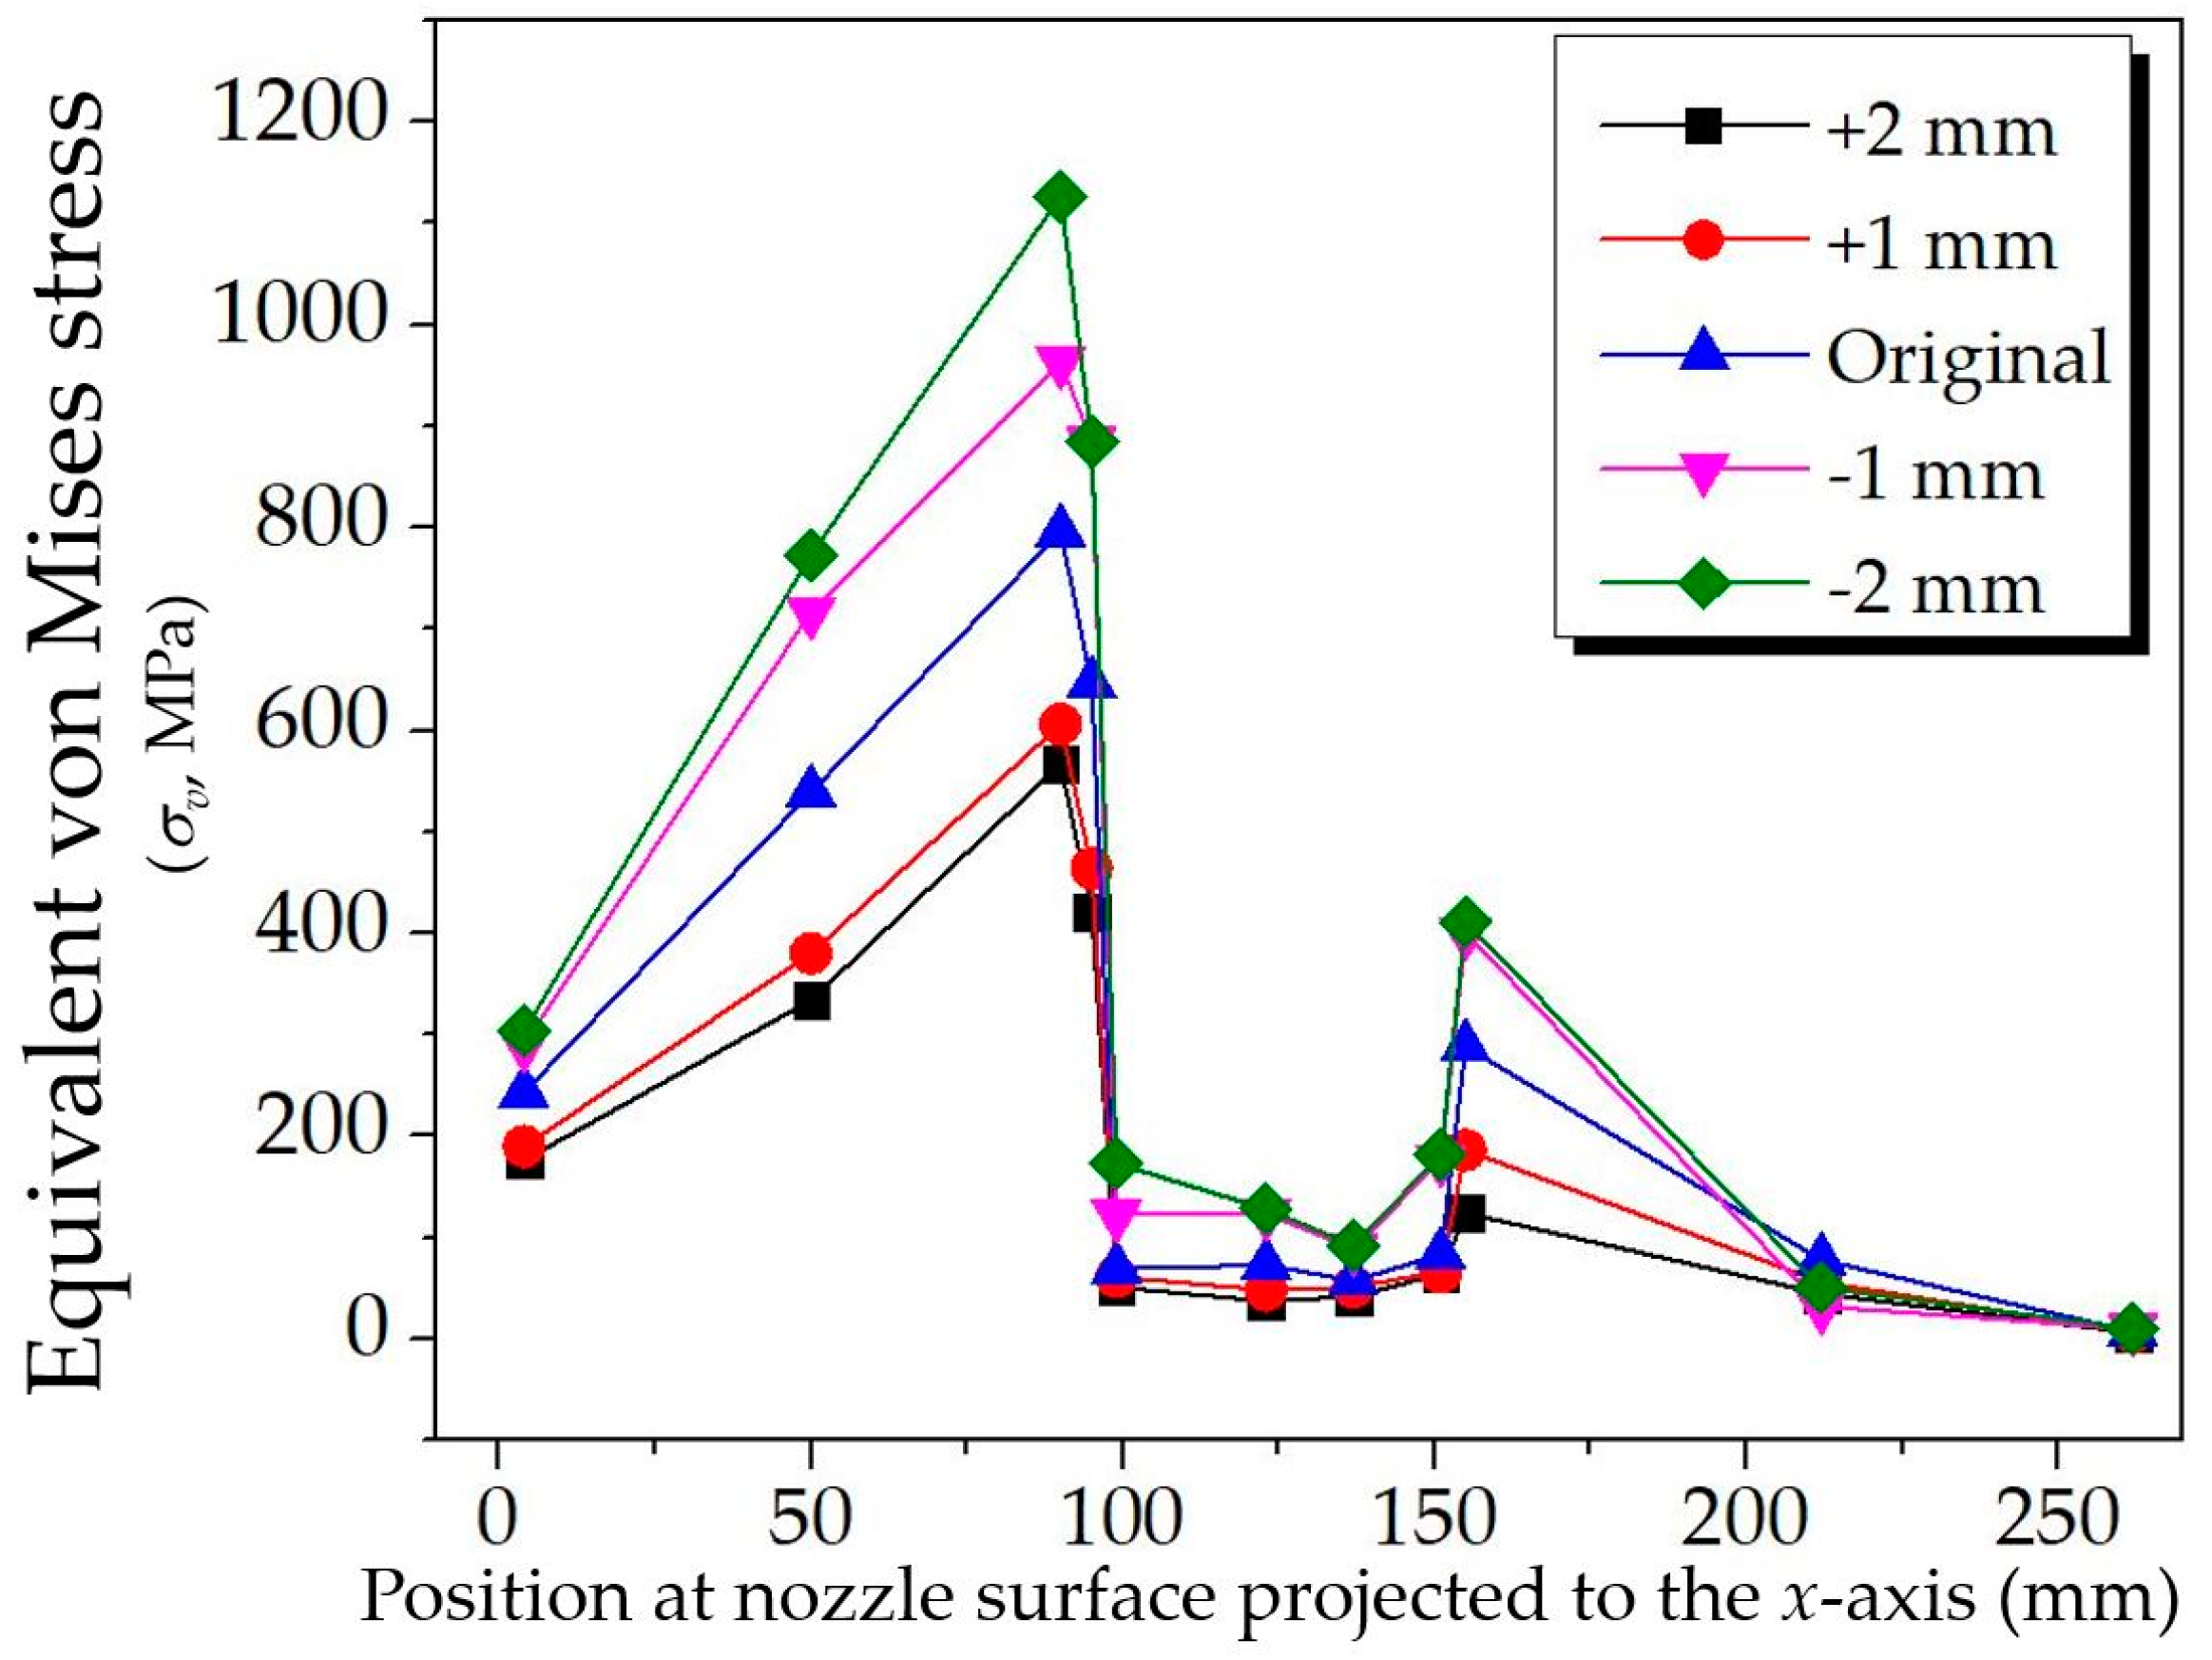
Figure 11 reveals the M at 1.2 s collected at the central line starting from 0 mm to 260 mm, depicted previously in Figure 7. The solid and dashed lines represent the CFD and theoretical results, respectively, in which the theoretical results were calculated using the rocket thrust Equation (9). From the figure, the Mach numbers from both methods were consistent. The maximum discrepancy was 9.09% at position x = 160 mm. The increasing M from left to right clearly presented the gas flow in the convergent-divergent nozzle, as presented in [1,2,3,4] and mentioned in Section 2.3. Comparing Figure 2, Figure 3 and Figure 11 from left to right, the M in the convergent zone was subsonic, sonic in the throat zone, and supersonic in the divergent zone, as expected. Moreover, the M increases with the increasing x position from left to right. The maximum M was about 2.6, clearly at a supersonic level, which is consistent with the manufacturer’s design in usage.
Similarly, Figure 12 compares total pressure at the nozzle outlet (Po) against the time between the theoretical and simulation results, presented as dash and solid lines, respectively. The theoretical results were calculated using the rocket thrust Equation (8) and the total pressure measured by the pressure sensor as Pi, which is depicted in Figure 6. Again, both results were very consistent. The maximum discrepancy of the simulation results was 6.5% at 0.5 s. As expected, Po peaked at 1.2 s and continued to decrease until the combustion ended at 2.4 s.
Figure 11 and Figure 12 show that the simulation results were very consistent with the theoretical results. Discrepancies might arise from assuming that fluid was H2 instead of a combustion mixture, due to the settings convenience in the software. As mentioned in Section 3.1, there were 51 compounds in the gas mixture, with the highest quantity of H2; therefore, the pure H2 assumption in this research was the cause of the discrepancy. Indeed, using all real compound properties from the experiment yielded more accurate simulation results. However, the obtained discrepancy was slight, and the simulation results were consistent with the theoretical results confirmed in Figure 11 and Figure 12. Therefore, the research methodology and simulation results reported in this article were also reliable. Moreover, since both figures reported the gas flow behavior inside the nozzle, the results outside are reported in the next section.
Figure 13 presents the M results at 1.2 s, demonstrating the shock’s family, separation, sonic, jet, and vortex ring, which are similar to the results presented by Dipen et al. [7], but with different appearances due to different nozzle shapes. For example, recirculation and reattachment zones did not appear in this nozzle but occurred in the bell-shaped nozzle reported in [7]. The recirculation and reattachment zones may reduce the rocket’s performance; therefore, they are unwanted by the nozzle’s manufacturer. In addition, compared to the gas flow inside a de Laval Nozzle reported in [1], a normal shock in Figure 13 occurred outside the nozzle as expected, while in [1], it occurred in the nozzle. Therefore, the shock occurred inside the nozzle due to an improper pressure outlet, which may decrease the efficiency of the supersonic rocket. Accordingly, the manufacturer prefers employed optimum operating conditions for the supersonic rocket, which results in the outside shock. In addition, the M gradually increased from left to right inside the nozzle with a maximum M of 2.836, a supersonic level, as expected.
Figure 14 shows the sample results of the gas flow total pressure at 1.2 s. Focusing the gas released from the nozzle into the environment meant that it gradually decreased to the same level as the environment. Remarkably, the high pressure inside the nozzle may cause ablation, which will be discussed next.
Similarly, Figure 15 reveals the sample results of the gas flow total temperature at 1.2 s. Again, the total temperature of released gas from the nozzle slowly decreased to the same level as the environment. Furthermore, the high temperature inside the nozzle may cause ablation, which will be discussed next.
The findings from Figure 13, Figure 14 and Figure 15 help design and develop a high-efficiency supersonic rocket. All-time results from 0 s–2.4 s that support the discussion of Figure 13, Figure 14 and Figure 15 were rendered to animation clips, which are included in the Supplementary Materials using the same title as the figure captions. Therefore, readers who need more information on the precise analysis can download the animation clips.
Moreover, the animation clips show the gas flows as the steady-state results from 0 s–2.30 s; after that, they are in a transient state as the propellant had nearly run out. The M, P, and T demonstrated fluctuation. Knowing the transient or steady-state simulations and time for fluctuation helps researchers to design the CFD simulation methodology to achieve accurate results quickly.
As discussed in Figure 14 and Figure 15, the gas flow’s high pressure and high temperature may cause ablation, so both results were applied as loads to the FEA for completing the CHTA simulation. Figure 16 shows the gas flow behavior inside the fluid domain of (a) the total pressure and (b) total temperature at 1.2 s, applied further to the FEA. Since both loads varied with time, all loads from 0 s to 2.4 s were applied to the FEA. Moreover, the total pressure and temperature of the gas flow decreased from left to right inside the nozzle, which was consistent with the gas flow behavior mentioned in Figure 3 and a previous report [1]. It is similar to an enlarged version of Figure 14 and Figure 15 and but presented in different color scales. The solid domain is colorless. Accordingly, the CHTA simulation and the ablation from the experiment in the solid domain are reported and analyzed next.

4.2. Ablation

This section is separated into qualitative analysis, quantitative analysis, and nozzle development.
In the qualitative analysis, Figure 17 shows the cross-section images of the ablation inside the nozzle from the static experiment mentioned in Section 3.1, including the (a) actual image and (b) sketch image. In (a), it can be observed that there was more ablation on the left nozzle, in the convergent zone, than on the right, in the divergent zone, as observed by the naked eye using shade color investigation. The very dark color indicates significant ablation. On the other hand, the less dark the color, the less ablation there was. The dark color implies the conversion of silica phenolic to charcoal, the primary ablation material. The ablation’s thickness in (a) was analyzed and transformed into the sketch image in the marked areas of (b). In (b), consistent with the image in (a), the left side exhibited more ablation than the right nozzle by considering the ablation’s thickness. Additionally, there was more ablation near the throat than in the area further away. The study of material removal due to the melting point of the interfaces at a higher temperature assuredly helped us to better understand the ablation of the 122 mm nozzle; however, it is not in the scope of this work. As a result, the settings in the CHTA and experiment are enough to understand the nozzle ablation.
Because no variables in the CHTA simulation directly correspond to ablation, an indirect validation using the equivalent von-mises stress (σv) to analyze the ablation was proposed. The advantages of the σv have been explained previously in Section 2.4.
After completing the calculation, Figure 18 reports the σv on the solid domain of the nozzle at 1.2 s, the maximum loads. Again, the results showed that the σv was higher near the throat. In addition, it was higher in the silica phenolic of the convergent zone than in the divergent zone, consistent with the qualitative analysis reported in Figure 17. Although it is not reported in this article, the CHTA also reported that the pressure load affects the σv more than temperature loads. The authors presume that it is because graphite and silica phenolic are good thermal insulators in the supersonic nozzle with high specific heat and slow ablation rate [27], so they have less thermal stress. In practical application, the CHTA in further work considering only the pressure load may be sufficient to predict the ablation, making the CHTA simulation very quick. However, it is difficult to analyze Figure 18 in detail to link it with the ablation from the experiment.
Therefore, in the quantitative analysis, Figure 19 compares the σv from the CHTA simulation at the insulators’ surface in Figure 18 and the ablation’s thickness from the experiment mentioned in Figure 17. As expected, both results were consistent, validating the employed methodology, the CHTA results, and the use of σv to analyze ablation. Consistent with the qualitative analysis discussed above, the ablation and the σv were high near the throat and gradually decreased further away from the throat. The higher the σv, the greater the ablation. Moreover, from left to right, the ablation levels were divided into three zones according to the nozzle shapes, convergent, throat, and divergent. The ablation was higher in the convergent zone and moderate in the divergent zone. The ablation in the throat was the lowest, since the insulator in that zone was made of graphite. In comparison, the convergent and divergent zones were made of silica phenolic, which is easier to ablate than graphite. The concept background of the material design was that graphite has advantages over silica phenolic in terms of heat resistance and ease in casting, but is brittle and has a high price. Therefore, modern supersonic rockets are commonly designed with nozzles that consist of both materials placed in the positions shown in Figure 7.
In the process of nozzle development to reduce ablation, Figure 20 shows the effect of the insulators’ thickness on the σv. All the boundary conditions remained the same but enhanced both insulators’ silica phenolic and graphite thickness from the original model in Figure 7 by +1 mm and +2 mm, and reduced it by −1 mm and −2 mm. The CHTA results reveal a similar trend in the relationship between the σv and position at the nozzle surface projected to the x-axis, as reported in Figure 18. This relationship also confirmed the ablation behavior inside the convergent, throat, and divergent zones. In the analysis, increasing the insulators’ thickness reduced the σv, leading to less ablation. On the contrary, decreasing the insulators’ thickness enhanced the σv, leading to more ablation. Although increasing the insulators’ thickness helps decrease the ablation, it also increases the rocket weight and increases the budget. Since the ablation was higher in the convergent zone than in the divergent zone, enhancing the thickness of silica phenolic only in the convergent zone is a good cost-saving option. In addition, from the authors’ experience, the rocket propellant weight and combustion time depend on the mission. The higher the propellant weight, the longer the combustion time. For example, a rocket needs more propellant than a shorter distance mission on a longer distance mission. Therefore, it leads to more ablation in the nozzle of the longer distance mission. Accordingly, the nozzle’s developer must optimize the insulators’ thickness to match the mission for it to be economical with the highest efficacy. Accordingly, all the results reported in this article help us to understand ablation and confirm that the CHTA is a powerful tool that helped us to develop a high-efficiency supersonic rocket to reduce ablation. Finally, the findings of this research were verified by a military agency that can be practically applied in a domestic manufacturing process to sustainably reduce imported supersonic rocket nozzles from abroad.
Usually, ablation is determined using the heat flux (Q); for example, the Q in the equation proposed by NASA [28] must be defined according to the calorimetrical value, actual measurement, etc. Furthermore, the Q found in the literature review was used to prepare the nozzle to test the ablation [8]. However, the measurements and literature review used to expose the Q were not convenient in this research because of a lack of related instruments and differences in the nozzle shape and materials used. Therefore, the CHTA is an alternative way to predict the reliable ablation in the nozzle, which does not require heat flux for the simulation.

5. Conclusions and Limitations

A 122 mm supersonic rocket for a mission over 40 km frequently exhibits excessive ablation in its nozzle. This article reports a solution to the problem by employing the conjugate heat transfer analysis (CHTA) and this experiment. The CHTA is an investigation of heat transfer between the fluid domain using computational fluid dynamics (CFD) and the solid domain using finite element analysis (FEA). First, the nozzle was tested based on actual operation in a static experiment to collect the necessary data, such as total pressure, total temperature, gas compounds, and ablation, for simulation setting and validation. Then, the CFD was used to investigate the gas flow using previously collected experimental results as the boundary conditions. The CFD results revealed the gas flow’s Mach number, total pressure, shock, separation, and jet during operation, which were consistent with the theoretical results. After this, the CFD results of the total pressure and total temperature were used in the FEA as loads. After completing the FEA calculation, the FEA results showed the equivalent von Mises stress (σv) caused by the gas flow’s total pressure and total temperature. This σv corresponds to the experimental ablation from the static experiment; therefore, the methodology and the CHTA employed in this research are reliable. In addition, the σv and ablation tended to occur in the convergent zone rather than in the divergent zone, closer to the throat than further away. The more the σv, the greater the ablation. Last, the CHTA results suggested that increasing the insulators’ thickness reduced the ablation. The findings of this research help us to understand the ablation occurrence in the 122 mm supersonic rocket nozzle and confirm that the CHTA is a powerful tool to help develop high-efficacy supersonic rockets with ablation reduction.
There are significant limitations in this experiment that affected the CHTA results. First, the material properties in Table 2 were set as constant values at room temperature. Indeed, those properties have to change with temperature. Unfortunately, the nozzle manufacturer did not provide us with this information, and the authors tried, but could not found this in the literature review. Then, the convection at the nozzle surface and environment was neglected because of the short duration of the simulation. Next, the nozzle shape and dimensions were only modified according to the parts required for the CHTA simulation, as directed by the manufacturer. As a result, the actual nozzle has more detail than is shown in Figure 7. Accordingly, the authors are not allowed to disclose some results from the experiment, since it is a weapon and also involves manufacturer disclosure. Last, the σv was calculated from the maximum loads; therefore, it cannot be exactly compared with the actual ablation that depended on the time, meaning that increasing the combustion time enhances the ablation. Accordingly, adding external codes and algorithms to the software, including a dynamic adaptive mesh model as reported in [16], will help the CHTA calculate the σv more accurately and in line with reality, which is a challenging task for the authors in the future. However, the mentioned limitations have been proven to have a slight effect and did not alter the conclusion, since the CHTA results were consistent with the experimental and theoretical results.

Supplementary Materials

The following supporting information can be downloaded at: https://www.mdpi.com/article/10.3390/pr10091823/s1; The animation clips supporting the discussion of Figure 13, Figure 14 and Figure 15 are included in the Supplementary Materials.

Author Contributions

Conceptualization, J.T. and A.B.; methodology, J.T. and A.B.; software, K.S.; validation, J.T., K.S. and A.B.; formal analysis, J.T.; investigation, J.T.; resources, A.B.; data curation, J.T.; writing—original draft preparation, J.T.; writing—review and editing, J.T. and A.B.; visualization, J.T.; supervision, J.T.; project administration, J.T.; funding acquisition, J.T. All authors have read and agreed to the published version of the manuscript.

Funding

The financial support was sponsored by the College of Advanced Manufacturing Innovation (AMI), King Mongkut’s Institute of Technology Ladkrabang (KMITL), grant number 2565-02-10-002.

Institutional Review Board Statement

Not applicable.

Informed Consent Statement

Not applicable.

Data Availability Statement

Not applicable.

Acknowledgments

This research has facilities supported by AMI, KMITL, and the Defence Technology Institute.

Conflicts of Interest

The authors declare no conflict of interest.

Nomenclatures

F1Blending function in the SST k-ω turbulence model
[C]Capacitance matrix (F)
ui, uj, and ukCartesian velocities in each direction (m/s)
T ˙ Change in nodal vector temperature (K/s)
α3, β3, σk3, σω3Coefficients of the SST k-ω turbulence model
ρDensity (kg/m3)
μtEddy viscosity (m2/s)
KeffEffective conductivity (W/m-K)
EEnergy (J)
F External force (F)
g Gravitational force (F)
MMach number
{T}Nodal vector temperature (K)
xPosition in x-axis (mm)
PPressure (Pa)
PkShear production of turbulence (Pa)
ωSpecific dissipation rate (1/s)
γSpecific heat ration
σI, σj and σkStress in each direction (Pa)
τ ¯ ¯ Stress tensor (Pa)
{Q}Thermal load vector (K)
[K]Thermal stiffness matrix (W/K)
tTime (s)
KTurbulence kinetic energy (J/kg)
v Velocity vector (m/s)

References

  1. Darbandi, M.; Roohi, E. Study of subsonic-supersonic gas flow through micro/nanoscale nozzle using unstructured DSMC solver. Microfluid Nanofluid 2011, 10, 321–335. [Google Scholar] [CrossRef]
  2. Prathibha, M.; Gupta, M.S.; Naidu, S. CFD Analysis on a Different Advanced Rocket Nozzles. Int. J. Eng. Adv. Technol. 2015, 4, 14–22. [Google Scholar]
  3. Roy, P.; Mondal, A.; Barai, B. CFD Analysis Of Rocket Engine Nozzle. Int. J. Adv. Eng. Res. Sci. 2015, 4, 14–22. [Google Scholar]
  4. Nayeem, S.; Chaitanya, K.L.V.B.S.S.S.; Murali krishna, G.; Dileep, C.; Ramana, D.V. Optimization of Convergent—Divergent Taper Angle with Combustion Chamber of Rocket Engine through Numerical Analysis. Int. J. Innov. Technol. Explor. Eng. 2020, 9, 76–81. [Google Scholar] [CrossRef]
  5. Baidya, R.; Pesyridis, A.; Cooper, M. Ramjet Nozzle Analysis for Transport Aircraft Configuration for Sustained Hypersonic Flight. Appl. Sci. 2018, 8, 574. [Google Scholar] [CrossRef]
  6. Afzali, B.; Karimi, H. Numerical Investigation on Thermo-Acoustic Effects and Flow Characteristics in Semi-Conical Hartmann–Sprenger Resonance Tube. J. Aerosp. Eng. 2016, 231, 2706–2722. [Google Scholar] [CrossRef]
  7. Dipen, R.D.; Parth, B.T.; Atal, B.H. Flow Analysis of Roket Nozzle using Method of Characteristics. In Proceedings of the 6th International Conference on Recent Trends in Engineering, Science & Management, Shri Guru Teg Bahadur Khalsa College Anandpur Sahib, Punjab, India, 8 January 2017. [Google Scholar]
  8. Sae-ngow, C.; Palsarn, S.; Boonpan, A. Insulation Analysis for Rocket’s Nozzle to Reduce Deformation of Nozzle Shape. In Proceedings of the 35th Conference of Mechanical Engineering Network of Thailand (ME-NETT), Nakhon Pathom, 20–23 July 2021. (In Thai). [Google Scholar]
  9. Hui, W.H.; Bao, F.T.; Wei, X.G.; Liu, Y. Ablation Performance of a 4D-Braided C/C Composite in a Parameter-Variable Channel of a Laval Nozzle in a Solid Rocket Motor. New Carbon Mater. 2017, 32, 365–373. [Google Scholar] [CrossRef]
  10. Peter, G.C.; Boyd, I.D. Reduced Reaction Mechanism for Rocket Nozzle Ablation Simulations. J. Thermophys. Heat Transf. 2018, 32, 429–439. [Google Scholar]
  11. Peter, G.C.; Boyd, I.D. Conjugate Analysis of Rocket Nozzle Ablation. In Proceedings of the 47th AIAA Thermophysics Conference, Denver, CO, USA, 5–9 June 2017. [Google Scholar]
  12. Xiaotian, Z.; Zhengkang, W.; Ruiqing, W.; Chengyang, L.; Ruipeng, Y.; Hui, T. Numerical Simulation of Chemical Ablation and Mechanical Erosion in Hybrid Rocket Nozzle. Acta Astronaut. 2022, 192, 82–96. [Google Scholar]
  13. Gudlavalleti, V.B.; Murthy, V.B. Prediction of Thermal Ablation in Rocket Nozzle Using CFD and FEA. Int. J. Comput. Mater. Sci. Eng. 2020, 9, 2050014. [Google Scholar]
  14. How Fluid-Structure Interaction Works and Why It’s Important. Available online: https://www.ansys.com/blog/fluid-structure-interaction-explained (accessed on 1 June 2022).
  15. Huc, N. Conjugate Heat Transfer. Available online: https://www.comsol.com/blogs/author/nicolas-huc/ (accessed on 1 June 2022).
  16. Thongsri, J.; Tangsopa, W.; Kaewbumrung, M.; Phanak, M.; Busayaporn, W. Derosion Lattice Performance and Optimization in Solving an End Effect Assessed by CFD: A Case Study in Thailand’s Beach. Water 2022, 14, 1358. [Google Scholar] [CrossRef]
  17. Khongsin, J.; Thongsri, J. Numerical Investigation on the Performance of Suction Head in a Cleaning Process of Hard Disk Drive Factory. ECTI Trans. Electr. Eng. Electron. Commun. 2020, 18, 28–33. [Google Scholar] [CrossRef]
  18. Puangburee, L.; Busayaporn, W.; Kaewbumrung, M.; Thongsri, J. Evaluation and Improvement of Ventilation System Inside Low-Cost Automation Line to Reduce Particle Contamination. ECTI Trans. Electr. Eng. Electron. Commun. 2020, 18, 35–44. [Google Scholar] [CrossRef]
  19. Thongsri, J.; Tangsopa, W.; Khongsin, J. A Suitable Shape of the Suction Head for a Cleaning Process in a Factory Developed by Computational Fluid Dynamics. Processes 2021, 9, 1902. [Google Scholar] [CrossRef]
  20. Jansaengsuk, T.; Kaewbumrung, M.; Busayaporn, W.; Thongsri, J. A Proper Shape of the Trailing Edge Modification to Solve a Housing Damage Problem in a Gas Turbine Power Plant. Processes 2021, 9, 705. [Google Scholar] [CrossRef]
  21. Ansys, Inc. Ansys Mechanical Heat Transfer. Nonlinear and Transient Thermal Electric; ANSYS, Inc.: Canonsburg, PA, USA, 2016. [Google Scholar]
  22. Narayana, K.P.S.S.; Reddy, K.S. Simulation of Convergent Divergent Rocket Nozzle using CFD Analysis Ansys Thermal. J. Mech. Civ. Eng. 2016, 4, 58–65. [Google Scholar]
  23. Nikhil, D.D.; Suyash, S.V.; Pratik, R.M.; Rutuja, S.J.; Jagtap, K.R. Theoretical & CFD Analysis of Delaval Nozzle. In Proceedings of the IRF International Conference, Pune, India, 16 March 2014. [Google Scholar]
  24. Malay, S.P.; Sulochan, D.M.; Raman, M. Concepts and CFD Analysis of De-Laval Nozzle. Int. J. Mech. Eng. Technol. 2016, 7, 221–240. [Google Scholar]
  25. Rocket Thrust Summary. Available online: https://www.grc.nasa.gov/www/k-12/rocket/rktthsum.html#:~:text=Thrust%20is%20produced%20according%20to,the%20design%20of%20the%20nozzle. (accessed on 1 June 2022).
  26. ANSYS, Inc. Solid Mechanics 1-Understanding the Physics. In Equivalent Stress; ANSYS, Inc.: Canonsburg, PA, USA, 2020. [Google Scholar]
  27. Elean, I.; Jabra, R.; Arafeh, M.H. Preparation and Ablation Performance of Lightweight Phenolic Composite Material under Oxyacetylene Torch Environment. J. Aerosp. Technol. Manag. 2018, 10, e3118. [Google Scholar] [CrossRef]
  28. Ellis, R. Solid Rocket Nozzle-NASA Space Vehicle Design Criteria (Chemical Propulsion); NASA: Cleveland, OH, USA, 1975. [Google Scholar]
Figure 1. Samples of the 122 mm supersonic rocket nozzle (a) before and (b) after the mission, exhibiting excessive ablation.
Processes 10 01823 g001
Figure 2. The gas flow and variables of de Laval (convergent-divergent) nozzle.
Processes 10 01823 g002
Figure 3. The estimated pressure (P), temperature (T), and Mach number (M) of a gas flow inside the de Laval nozzle.
Processes 10 01823 g003
Figure 4. A flowchart of methodology.
Processes 10 01823 g004
Figure 5. A static experiment: (a) actual image and (b) diagram.
Processes 10 01823 g005
Figure 6. The total pressure measured by a sensor in the experiment.
Processes 10 01823 g006
Figure 7. The solid model of the nozzle.
Processes 10 01823 g007
Figure 8. The suitable mesh model of nozzle.
Processes 10 01823 g008
Figure 9. The boundary conditions settings for (a) an overview and (b) an enlarged picture in the nozzle. Blue is for the pressure inlet, while red is for the pressure outlet.
Processes 10 01823 g009
Figure 10. The pre-simulation technique.
Processes 10 01823 g010
Figure 11. The Mach number (M) at the position x on the central line, which resulted from the simulation and the theory.
Processes 10 01823 g011
Figure 12. The total pressure at the nozzle outlet (Po), which resulted from the simulation and the theory.
Processes 10 01823 g012
Figure 13. The Mach number at 1.2 s.
Processes 10 01823 g013
Figure 14. The total pressure at 1.2 s.
Processes 10 01823 g014
Figure 15. The total temperature at 1.2 s.
Processes 10 01823 g015
Figure 16. The loads of (a) total pressure and (b) total temperature at 1.2 s, applied to the FEA.
Processes 10 01823 g016
Figure 17. The ablation in nozzle from the static experiment: (a) an actual image and (b) sketch image.
Processes 10 01823 g017
Figure 18. The σv on the solid domain calculated from the CHTA.
Processes 10 01823 g018
Figure 19. Comparison between the equivalent von-Mises stress from the CHTA simulation and the ablation’s thickness from the experiment.
Processes 10 01823 g019
Figure 20. Effect of insulators’ thickness on the equivalent von Mises stress.
Processes 10 01823 g020
Table 1. The CFD settings.
TypeSetting
Pressure inlet: pressure far-fieldGauge pressure: UDF *
Mach number: 0.234
Temperature: 3364.40 K
Pressure outletGauge pressure: UDF *
Temperature: 540.15 K
H2Density: ideal gas
Viscosity: Sutherland
Specific heat ratio: 1.4
Transient settingTime step size: 0.01
Number of time steps: 2400
Iteration per time step: 20
* defined based on the experimental results mentioned in Section 3.1.
Table 2. The FEA settings.
PropertiesMaterials *
Silica PhenolicGraphiteAlSI4130Al6061T6
Density (kg/m3)1656249078502700
Thermal conductivity (W/m-K)25011442.7167
Young’s modulus (GPa)36.627.620068.9
Poisson’s ratio0.150.230.300.33
* provided by the nozzle manufacturer.
Publisher’s Note: MDPI stays neutral with regard to jurisdictional claims in published maps and institutional affiliations.

