Article

Cultivation of Nitrifying and Nitrifying-Denitrifying Aerobic Granular Sludge for Sidestream Treatment of Anaerobically Digested Sludge Centrate

Department of Civil Engineering, Ryerson University , 350 Victoria Street, Toronto, ON M5B 2K3, Canada
*
Author to whom correspondence should be addressed.
In April 2022, the university announced the new name of Toronto Metropolitan University, which will be implemented in a phased approach.
Processes 2022, 10(9), 1687; https://doi.org/10.3390/pr10091687
Submission received: 28 June 2022 / Revised: 17 August 2022 / Accepted: 22 August 2022 / Published: 25 August 2022
(This article belongs to the Special Issue Environmental Protection by Aerobic Granular Sludge Process)

Abstract

:
In this study, three 1.2-L aerobic granular sludge sequencing batch reactors (AGS-SBRs) were used to cultivate nitrifying and nitrifying-denitrifying granules (w/supplemental carbon) and investigate sidestream treatment of synthetic-centrate and real-centrate samples from Ashbridges Bay Treatment Plant (ABTP) in Toronto, Ontario, Canada. Results showed that although the cultivation of distinct granules was not observed in the nitrifying reactors, sludge volume index (SVI30) values achieved while treating real and synthetic centrate were 72 ± 12 mL/g and 59 ± 11 mL/g (after day 14), respectively. Ammonia-nitrogen (NH3-N) removal in the nitrifying SBRs were 93 ± 19% and 94 ± 16% for real and synthetic centrate, respectively. Granules with a distinct round structure were successfully formed in the nitrifying-denitrifying SBR, resulting in an SVI30 of 52 ± 23 mL/g. NH3-N, chemical oxygen demand (COD) and phosphorus (P) removal in the nitrifying-denitrifying SBR were 92 ± 9%, 94 ± 5%, and 81 ± 14% (7th to 114th day), respectively with a low nitrite (NO2-N) and nitrate (NO3-N) concentration in the effluent indicating simultaneous nitrification-denitrification (SND) activity. High nutrient removal efficiencies via the nitrification and SND pathways shows that AGS technology is a viable process for treating sidestreams generated in a WWTP.

Graphical Abstract

1. Introduction

Wastewater treatment plants (WWTPs) face the challenge of implementing sustainable unit processes that enhance nutrient removal and contribute to the recovery of energy and value-added products [1]. In recent years, technologies that permit sustainable wastewater management and solids handling are being increasingly employed worldwide [2]. Anaerobic digestion (AD) is a widely used technology for solids handling that utilizes biochemical processes to facilitate the degradation of organic matter (OM) by a consortium of bacteria under anaerobic conditions. The process of anaerobic digestion also leaves behind digestate (or anaerobically digested sludge) which is a liquid slurry of microorganisms, digested substrates, and the carrier medium [3]. Dewatering anaerobically digested sludge generates a liquid sidestream–commonly referred to as centrate or reject water–with elevated concentrations of N (predominantly NH3-N) and P. In some installations, AD is preceded by thermal pre-treatment which increases the concentration of NH3-N up to 2500 mg/L in centrate [4,5]. Centrate can consists of 0.5–1% of mainstream flow, 10–30% of the plant’s influent nitrogen load and 20–40% of the plant’s phosphorus load [6]. WWTPs predominantly return centrate to the mainstream process for treatment, but the additional nutrient loading negatively impacts removal efficiency. Returned centrate can result in shock loads, process instability and increased operation costs [7]. The inclusion of separate sidestream treatment can improve the performance and reliability of a WWTP [8].
Centrate can be adequately treated in a separate sidestream process using various wastewater technologies that belong to mainly two categories, (1) biological, and (2) physical/chemical [9]. Ammonia stripping is a physical/chemical treatment technology which has been used to remove 80–90% of nitrogen from digester supernatant using air at full scale [10]. Alternatively, ammonia can be recovered as an ammonia salt solution through acid stripping. NH3-N concentration in a feed stream was drastically reduced from 21,006 to 10.6 mg/L (99.95% NH3-N removal) at a normal temperature of 25 °C using acid stripping [11]. Ion exchange is another physical/chemical treatment technology that can achieve high ammonia removal from a liquid waste stream [12]. Target ions present in the liquid/aqueous phase such as ammonium ion (NH4+) are capable of displacing similar cations on the exchange resin; resulting in nutrient removal [7]. Digested sludge liquor with an ammonia concentration of >600 mg/L was successfully treated using a clay-based ion exchange medium (MesoLite), resulting in >95% ammonia removal [13].
Biological treatment is an inexpensive alternative compared to physical/chemical processes. Conventional activated sludge (CAS) is the most widely applied biological treatment technology. In CAS systems, nitrogen is removed from wastewater via biological nitrification and denitrification [14]. The first step, nitrification, occurs under aerobic conditions, where NH3-N is oxidized to NO2-N by ammonia oxidizing bacteria (AOB) and further to NO3-N by nitrite oxidizing bacteria (NOB) [15]. In the denitrification step, organic loading in the influent or supplemental organic carbon (e.g., methanol) acts as an electron donor for the conversion of NO3-N to dinitrogen gas (N2) by heterotrophic denitrifying bacteria [9,16].
A submerged activated growth bioreactor (SAGB) that was fed centrate and operated with a nitrogen loading between 0.54 to 1.51 kg-N/m3·d, achieved stable NH3-N oxidation and a nitrification efficiency of 98% according to Pedros et al. [17]. Furthermore, treatment of co-digested piggery/poultry manure and agro-waste sludge liquor from a full-scale anaerobic digester was investigated by Scaglione et al. [18] in a pilot-scale SBR for partial-nitritation (PARNIT). In conjunction with a bench-scale SBR that was inoculated with anaerobic ammonium oxidation (anammox) granular sludge and fed with a combination of PARNIT effluent and synthetic wastewater, an average nitrogen removal of 91 ± 10% was achieved Scaglione et al. [18]. The anammox step allows for the conversion of NH3-N to N2 using NO2-N as the electron acceptor instead of supplemental carbon source, leading to considerable cost savings [19]. Typically, processes that utilize a shortcut route to nitrogen removal require less oxygen and biodegradable carbon [8,20]. Nutrient-rich centrate typically comprises of low biodegradable COD and insufficient alkalinity-both of which are required for biological treatment [9].
Similar to the above-mentioned technologies, aerobic granular is a fitting technology when attempting to treat a sidestream such as centrate with fluctuations in the NH3-N concentration and limited biodegradable COD [21]. An earlier study on formation of nitrifying granules was investigated by Liu et al. [22] using acclimated sludge and synthetic inorganic wastewater in an SBR. Nitrifying granules were reportedly formed within 21 days with a size of 240 μm and the biomass displayed a sludge volume index (SVI) of 40 mL/g [22]. Both nitrification and partial-nitrification was reported, with the authors stating that the system was negatively impacted by changing influent NH3-N concentrations (100 to 450 mg/L) [22]. López-Palau et al. [19] also worked with anaerobic digestion supernatant to form nitrifying (NIT) granules in an SBR. A conventional SBR with suspended growth biomass was operated for comparison with the characteristics of aerobic granules. Granules with a distinct and slightly spherical shape were formed with the diameter ranging from 2 to 5 mm [19]. In terms of performance, partial nitrification was achieved in both systems with the NO2-N/NH4+ ratio equating to approximately 1 in the effluent–mainly due to insufficient alkalinity in the system which induced pH suppression, thus resulting in partial nitrification [19,23].
Aerobic granular sludge (AGS) has also gained interest for its robustness and ability to maintain performance in adverse conditions [24]. The impact of COD/N ratio is a topic that is being continuously investigated by researchers worldwide. After investigating different COD/N ratios using ammonia-rich synthetic wastewater, Wei et al. [25] reportedly achieved the highest nitrogen removal at a ratio of 9. Kocaturk and Erguder [26] recommended a COD/N ratio of 7.5–30 for stable granules that favor the growth of heterotrophs and 2–5 for slow growing nitrifying granules. A recent investigation by Figdore et al. [27] pursued the growth of nitrification-denitrification (NDN) and phosphorus accumulating organisms (PAOs) granules from sidestream centrate. Growth of NDN-PAO granules were successful as reported by the author and removal efficiencies were 95% and 88% for NH3-N and total nitrogen (TN), respectively [27]. The application of AGS to centrate–containing high nutrient load and low biodegradable COD—is practical through the well-known nitrification-denitrification reaction pathway. Additionally, the microbial orientation of AGS offers the potential for multiple redox reactions across the layers of a granules in a single system [28].
This research aims to evaluate the application of AGS–to separate sidestream treatment of centrate. The experimental work explored formation of nitrifying granules with and without an organic carbon source and assessed the treatment of centrate at a low COD/N ratio. The objectives of this study were to: (1) Compare the cultivation aerobic granular sludge and treatment of diluted centrate via nitrification only and nitrification-denitrification reaction pathways, (2) determine the impact of increasing nitrogen (N) loading and a low COD/N (i.e., <5) ratio on nitrification and/or nitrification-denitrification, and (3) determine the rate of nitrification with respect to aeration time and volatile suspended solids (VSS) concentration and the efficiency of nitrification-denitrification. First, the cultivation of nitrifying granules without the addition of external carbon was investigated using real centrate and synthetic wastewater. Secondly, the cultivation nitrifying-denitrifying granules were investigated using synthetic wastewater with the addition of an external carbon source follow by the treatment of real centrate with supplemental carbon. Pollutant degradation was monitored during a designated cycle to determine nitrification rate (NR) and specific nitrification rate (SNR). Simultaneous nitrification-denitrification efficiency was computed using influent and effluent data. The effect of a low COD/N was also investigated during the treatment of centrate (i.e., after granule cultivation using synthetic organic wastewater).

2. Materials and Methods

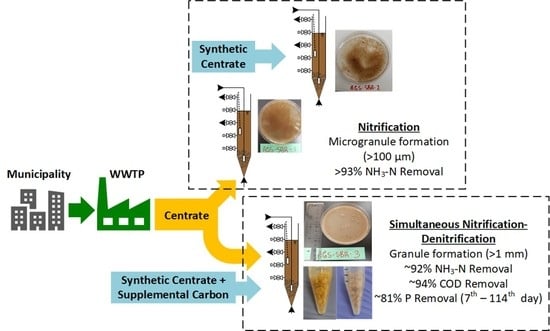
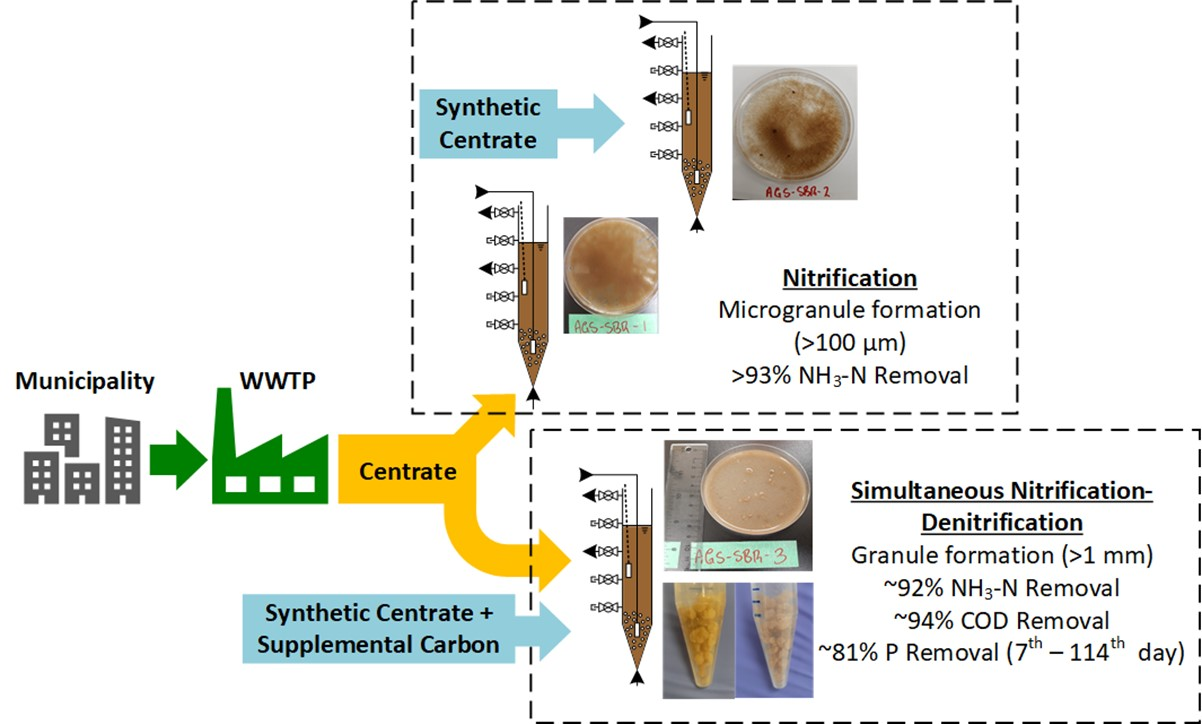
2.1. Reaction Configuration and Operation

The experimental study was performed in three column-type SCH 40 PVC reactors—AGS-SBR-1, AGS-SBR-2, and AGS-SBR-3—with a 5-cm internal diameter, height of 70 cm and a total volume of 1.38-L. The reactors were operated with a working volume of 1.2-L, equivalent to a working height of 61 cm and height-to-diameter (H/D) ratio of 12.2. Aeration was provided by fine air bubble diffusers located at the bottom of the reactors and flow meters were used to control the airflow at 3 L/min, resulting in a superficial air velocity (SAV) of 2.55 cm/s. Air flow in AGS-SBR-1 was reduced to 1 L/min (SAV = 0.8 cm/s) during the final period (i.e., days 162–183) of the reactor’s operation. The AGS-SBRs were designed to accommodate static feeding from the bottom of each reactor and upwards through the bed of settled biomass. The decant ports were conveniently located at the midpoint of each reactor column (i.e., at the 0.6-L mark), providing a volume exchange ratio (VER) of 50%. Peristaltic pumps were used to feed the reactors and discharge treated effluent. The reactors were operated sequentially on a 6-h cycle followed by a 4-h cycle to allow for a reduction in hydraulic retention time (HRT) as displayed in Table 1. The duration of influent filling, effluent discharge, and idle remained constant throughout the experimental study. AGS-SBR-3 was operated with a 60-min anoxic filling phase to stimulate denitrification. Settling times were decreased during the granule cultivation stage with the excess time added to the aeration phase.
The operating parameters for each reactor are shown in Table 2. The experiments were conducted at ambient temperature (22–25 °C). A common peristaltic pump was used to dose an 80 g/L solution of sodium bicarbonate (NaHCO3) to AGS-SBR-1 and AGS-SBR-2 for pH control. In AGS-SBR-3, pH was controlled using a 1 M hydrochloric acid (HCl) solution and an Etatron DLX series metering pump attached to a probe. Dissolved oxygen (DO) was considered >2 mg/L or non-limiting since air flow was controlled by a flow meter.
Operational periods for each reactor are displayed in Table 3 and Table 4. The experimental study consisted of several changes that were carried out in different periods. The experimental schematic is shown in Figure 1.

2.2. Seed Sludge

The AGS-SBRs were inoculated with return activated sludge (RAS) from the Ashbridges Bay Treatment plant (ABTP) in Toronto, Ontario, Canada, resulting in an initial sludge concentration of 4.3–5.2 g/L (65–80% volatile). Biomass in AGS-SBR-1 and AGS-SBR-2 was augmented with RAS during periods of low sludge concentration or following a process upset. Additionally, biomass augmentation with RAS was performed to maintain mixed liquor suspended solids (MLSS) and mixed liquor volatile suspended solids (MLVSS) concentrations above 2 g/L and 1.5 g/L, respectively. Biomass augmentation points are indicated on Figure 2a,b,d,e. Seed sludge sampled from ABTP had an average suspended solids (SS) concentration 10 ± 1 g/L (70% volatile) and sludge volume index (SVI30) of 115 ± 9 mL/g.

2.3. Wastewater Media Characteristics

Several feed streams were used to provide substrate to the AGS-SBRs in this experimental study. The characteristics of centrate collected from ABTP and composition of synthetic wastewater is described in Table 5. ABTP utilizes the conventional activated sludge process for biological treatment of wastewater and anaerobic digestion for sludge stabilization followed by the addition of a polymer compound prior to dewatering.
  • AGS-SBR-1: Centrate collected from ABTP was diluted to provide NH3-N feed concentrations between 80–300 mg/L. NaHCO3 was added as inorganic carbon source and pH control.
  • AGS-SBR-2: Synthetic centrate with NaHCO3 as inorganic carbon source and pH control, NH4Cl as nitrogen source and K2HPO4 & KH2PO4 as phosphorus sources.
  • AGS-SBR-3: Synthetic centrate with acetate as organic carbon source, NH4Cl as nitrogen source and K2HPO4 & KH2PO4 as phosphorus sources. The feed stream was switched to diluted centrate after day 79 with sodium acetate (CH3COONa) as supplemental carbon source.

2.4. Analytical Methods

2.4.1. Biomass (Solid Phase) Analysis

MLSS and MLVSS tests were performed according to Standard Methods 2540 D, 2540 E, and 2710 D, respectively [29]. Sludge was allowed to settle in the reactor and timed for 30 min to determine SVI30; similarly, to standard method 2710 D [29]. SVI30 tests were carried out in the reactor to prevent process disruptions associated with dismantling the system to access mixed liquor.

2.4.2. Wastewater (Liquid Phase) Analysis

Nutrient concentrations for influent and effluent were measured using a HACH DR 3900 (HACH company) portable spectrophotometer for the entire study period. NH3-N was analysed using the Salicylate method (10031). NO2-N, NO3-N and alkalinity analysis were performed using HCH test kits TNT plusTM839 & 840, TNT plusTM835 and TNT plusTM870, respectively. TN was determined by the persulfate digestion method (10071). Reactive phosphorus (PO43−) was determined using the Molybdovanadate method (8114). Total chemical oxygen demand (tCOD) and soluble COD (sCOD) (0.45 µm-filtered) were determined by using the reactor digestion method. Digestion was performed using a Labnet Accublock Digital dry bath (Labnet International Inc., Mayfield, NJ, USA) followed by spectrophotometric measurement. Total suspended solids (TSS) and Volatile suspended solids (VSS) were analysed in accordance with standard methods 2540 D, and 2540 E, respectively [29]. Fisher Scientific Accumet basic pH meter was used to measure pH in AGS-SBR-1 and AGS-SBR-2.

2.4.3. Reactor Performance and Removal Analysis

Removal efficiencies for NH3-N, sCOD, and PO43− were determined by Equation (1) [30]. The accumulation of nitrite in the reactors was determined by Equation (2) [31]. In AGS-SBR-3, the efficiency of simultaneous nitrification-denitrification was determined by Equation (3) [31].
Efficiency   ( % ) = C influent C effluent C influent × 100
Where ,   C   =   Concentration   in   mg / L
Nitrite   Accumulation   Rate   ( NAR )   ( % ) = NO 2 N NO 2 N + NO 3 N × 100
Simultaneous   Nitrification Denitrification   ( SND ) Efficiency   ( % ) = ( 1 [ NO x N ] accumulated [ NH 3 N ] removed ) × 100
Sludge production based on wastewater characteristics is determined by Equation (4). Parts A, B & C were computed to determine sludge production in AGS-SBR-3. Sludge production in AGS-SB-1 and AGS-SBR-2 were determined with only Part C. The concentration of nitrogen oxidized as NH3-N was determined with Equation (5). Nitrification rate was calculated using Equation (6) and specific nitrification rate was determined by taking into the consideration the VSS concentration as shown in Equation (7) [30].
P x ,   bio = Part   A   ( Heterotrophic   Biomass ) + Part   B   ( Cell   debris ) + Part   C   ( Nitrifying   bacteria   biomass ) P x ,   bio = QY H ( S 0 S ) ( 1 kg 10 3 g ) 1 + b H ( SRT ) + ( f d ) ( b H ) QY H ( S 0 S ) SRT ( 1 kg 10 3 g ) 1 + b H ( SRT ) + QY n ( NO x ) ( 1 kg / 10 3 g ) 1 + b n ( SRT )
NO x = concentration   of   NH 3 N   in   the   influent   flow   that   is   nitrified ,   mg / L Y H = heterotrophic   bacteria   synthesis   yield   coefficient ,   0.4   g   VSS / g   COD b H = endogenous   decay   coefficient   for   heterotrophic   organisms , 0.16   g   VSS / g   VSS   d b n = endogenous   decay   coefficient   for   nitrifying   organisms ,   0.2   g   VSS / g   VSS   d Y n = nitrifying   bacteria   synthesis   yield   coefficient ,   0.12   g   VSS / g   NH 4 N f d = fraction   of   cell   mass   that   remains   as   cell   debris ,   0.10 0.15   g   VSS / g   biomass   VSS   depleted   by   decay
Nitrogen   oxidized = nitrogen   in   influent nitrogen   in   effluent nitrogen   in   cell   mass ( NO x ) = ( TKN o ) * N e 0.12 ( P x ,   bio Q )
* Influent   NH 3 N   used   in   place   of   TKN o  
Nitrification   Rate = NO x t aeration
Specific   nitrification   rate   ( SNR ) = Nitrification   rate MLVSS reactor

2.4.4. Granule Structure and Morphology

Sludge was routinely collected from the lowest sample port of each reactor and poured into a Petri dish. Photographic images were captured with a Samsung Galaxy A50 smart phone camera and microscopic images were taken with a Leica DM1000 LED microscope. Following installation and start-up of the microscope, the Leica representative returned to calibrate the device using precise measurement bars.

3. Results and Discussion

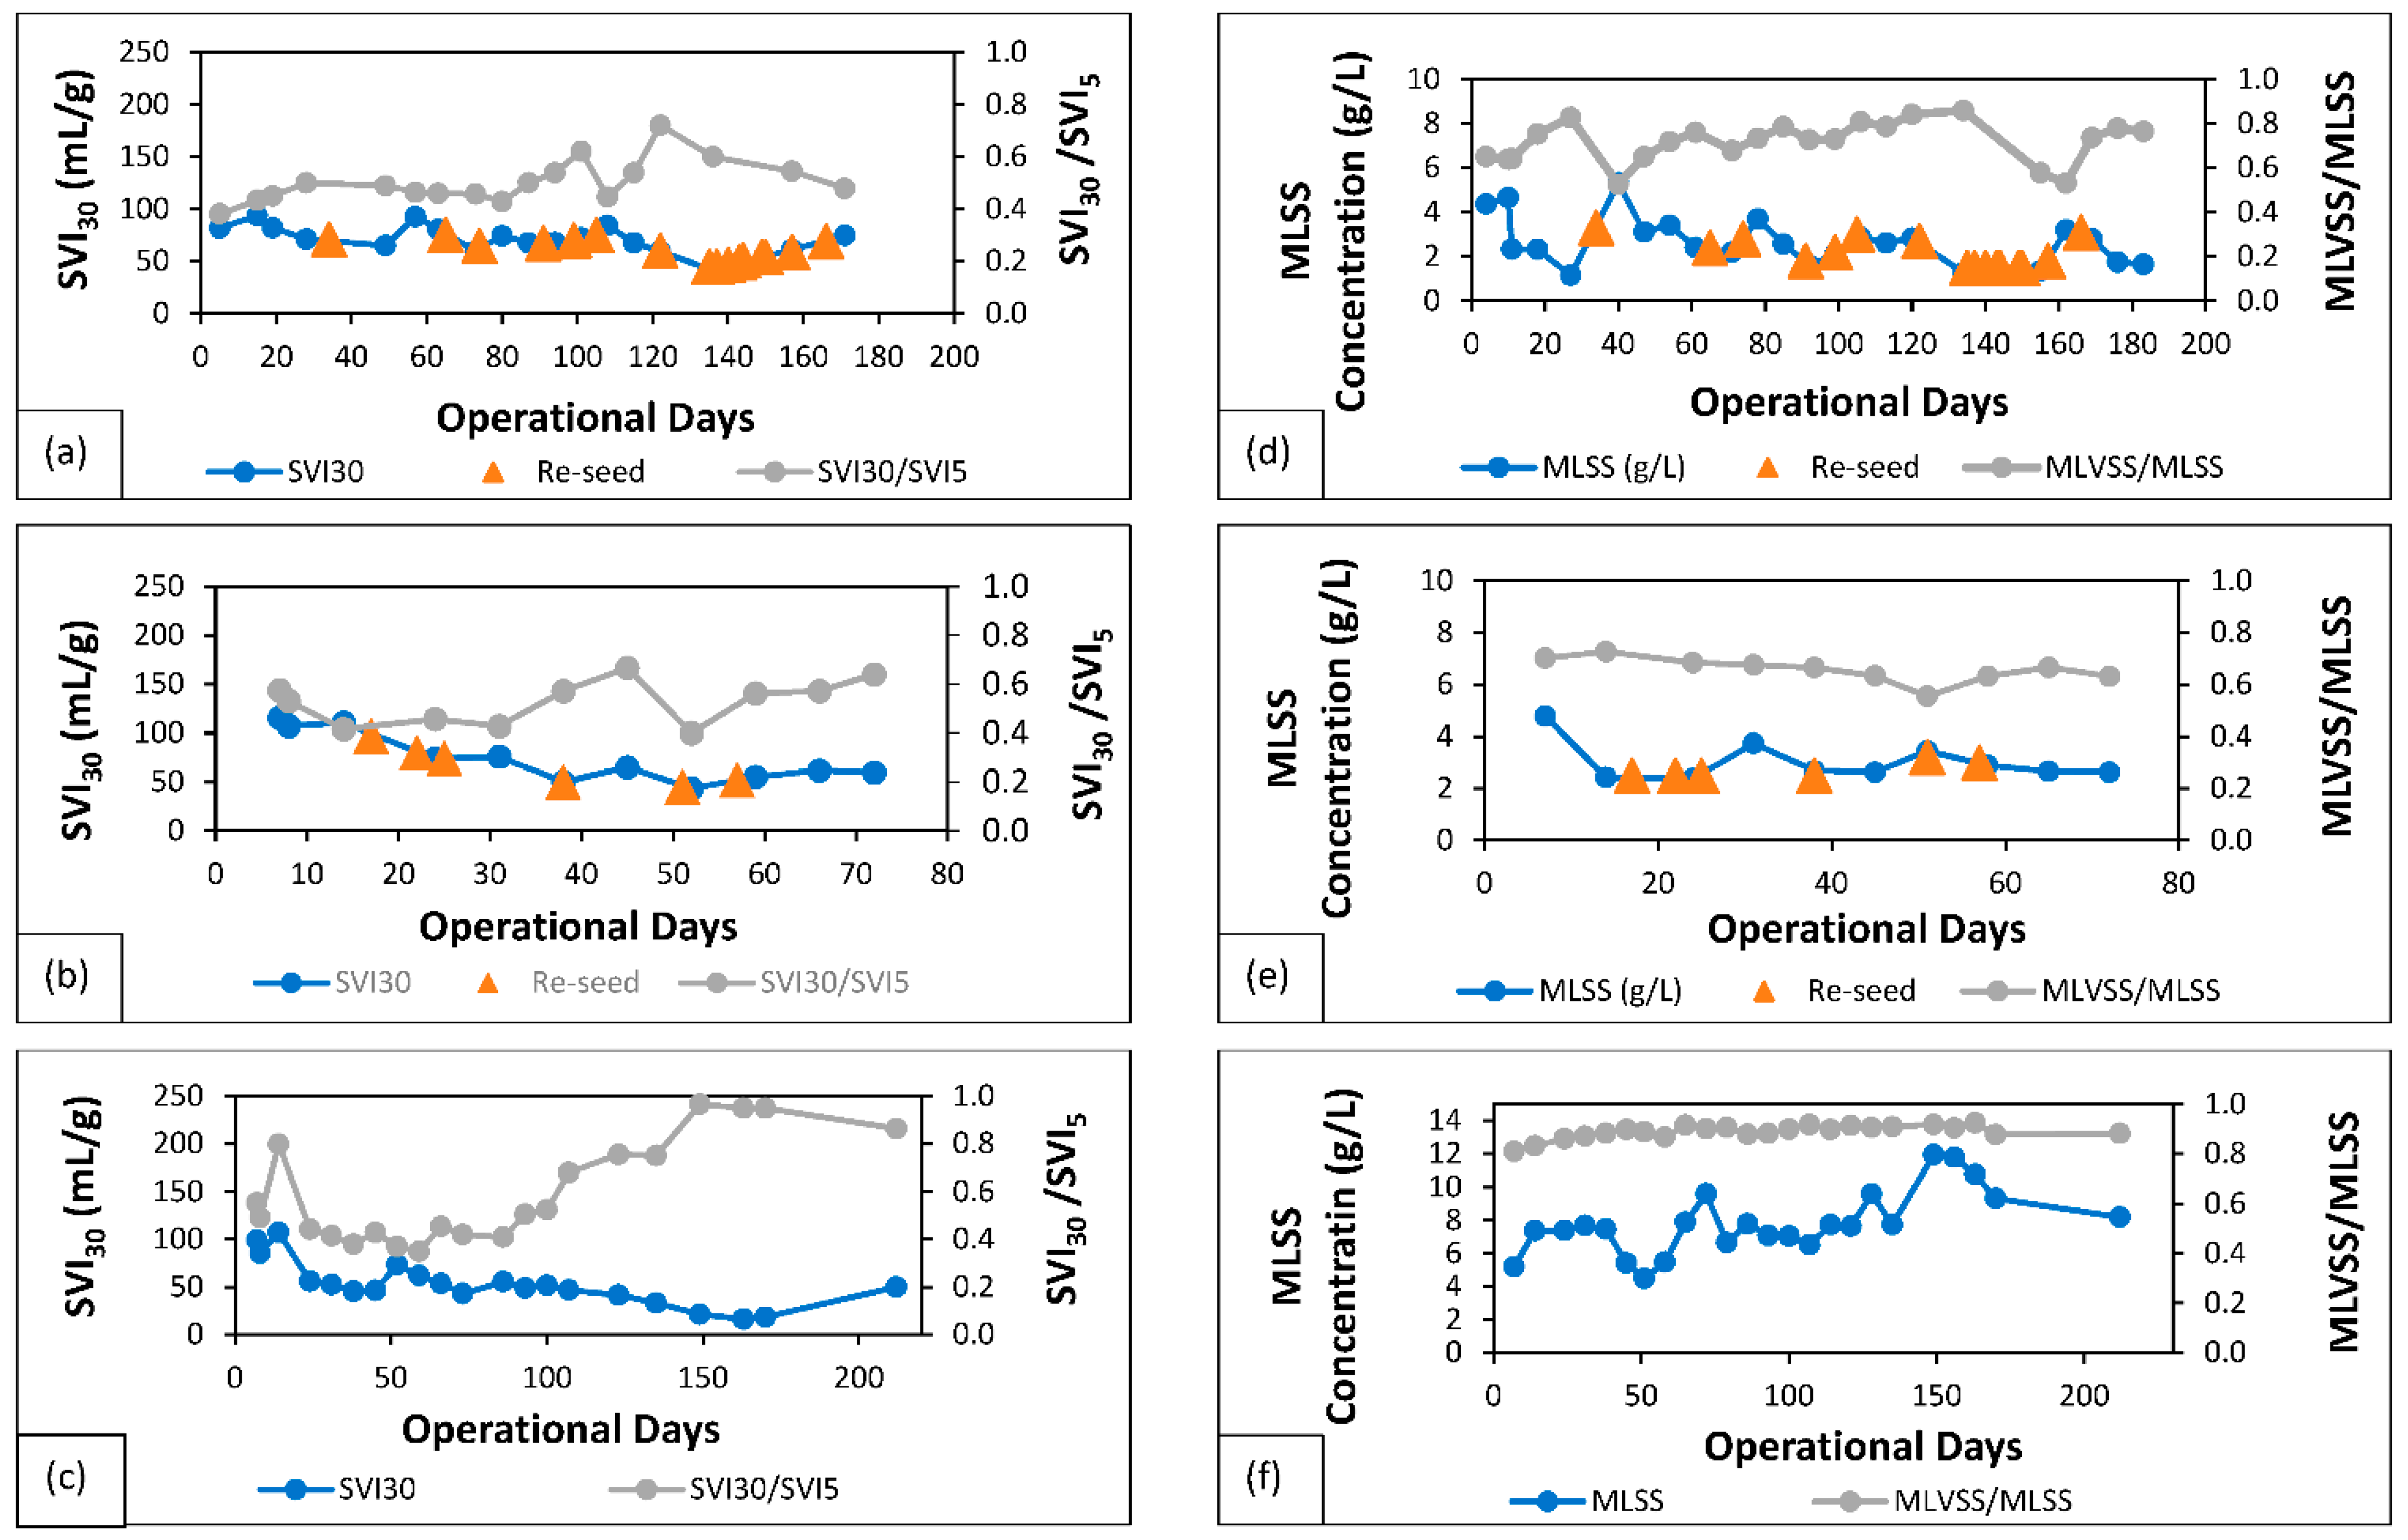
3.1. Characteristics of Granular Sludge

3.1.1. Centrate Nitrifying Sludge (AGS-SBR-1)

In AGS-SBR-1, SVI30 averaged 72 ± 12 mL/g; displaying good sludge settleability. The SVI30/SVI5 ratio averaged 0.5 ± 0.08, equating to 50% granulation as shown in Figure 2a. Settleability of the sludge was observed to be influenced by the reactor design and operation: (1) H/D ratio of 12.2 and, (2) air flow rate of 3 L/min. A high H/D ratio represents a slender column, which influences the settling time [24]. Non-limiting DO air flow during the aeration phase resulted in adequate oxidation of ammonia.
Sludge concentration for reactor start-up was approximately 4.37 g MLSS/L and 2.85 g MLVSS/L. After 11 days of operation, sludge concentration decreased to approx. 2.34 g MLSS/L and 1.50 g MLVSS/L. To maintain the sludge concentration, RAS samples from ABTP were added to AGS-SBR-1 throughout the operation. On average, a sludge concentration of 2.68 ± 1 g MLSS/L and 1.87 ± 0.63 g MLVSS/L was achieved for the entire duration of the study. This includes fluctuations in the MLSS and MLVSS concentration between 1.16–5.33 g/L and 0.79–2.97 g/L, respectively. In Figure 2d, instances in which RAS was used to augment the sludge concentration are indicated on the MLSS (g/L) concentration curve. The ratio of MLVSS/MLSS fluctuated in response to the sludge concentration, but an average vale of 0.72 ± 0.09 was determined for AGS-SBR-1. According to Czarnota et al. [32], MLVSS/MLSS ratio signifies sludge activity or organic content, and it is typically in the range 0.7–0.8 [30]. In Figure 2d, reactor re-seed on day 34 in response to a substantial decrease in sludge concentration resulted in a lower than usual MLVSS/MLSS ratio. Evidently, a lower MLVSS/MLSS concentration ratio indicated a change in the biomass component such as a decrease in the concentration of viable sludge [33].

3.1.2. Synthetic Centrate Nitrifying Sludge (AGS-SBR-2)

Sludge settleability for AGS-SBR-2 in terms of SVI30 averaged 111 ± 4 mL/g for days 4–14 and 59 ± 11 mL/g for the remainder of the reactor operation. The average granulation percentage for the entire research study based on the ratio SVI30/SVI5 was 53 ± 9%. Visual inspection of the sludge in AGS-SBR-2 did not show obvious evidence of distinct granule formation, but the settling behaviour was like that of a typical granular sludge reactor. Activated sludge systems are known to have an average SVI30 between 110 and 160 [34], but AGS-SBR-2 averages for settling was substantially lower, especially after day 14 of operation as shown in Figure 2b.
Sludge concentration for AGS-SBR-2 at start-up was approx. 4.78 g MLSS/L and 3.35 g MLVSS/L. The sludge concentration decreased to 2.43 g MLSS/L and 1.76 g MLVSS/L by day 14 as shown in Figure 2e. RAS from ABTP was added to AGS-SBR-2 to maintain sludge concentration and the MLVSS/MLSS ratio. In comparison to AGS-SBR-1, MLSS and MLVSS concentration experienced higher stability in AGS-SBR-2. The average MLSS and MLVSS concentration for AGS-SBR-2 were 3.03 ± 0.75 g/L and 1.99 ± 0.54 g/L, respectively. The average MLVSS/MLSS ratio for AGS-SBR-2 was 0.66 ± 0.05, which was lower than that of AGS-SBR-1 at 0.72 ± 0.09. The average MLVSS/MLSS ratio of 0.66 ± 0.05 was also lower than the typical ratio of 0.7–0.8 [30]. The ratio between MLVSS and MLSS highlighted sludge inactivity or subpar organic content [32].

3.1.3. Nitrifying-Denitrifying Sludge (AGS-SBR-3)

The transition from activated to predominantly granular sludge occurred in parallel with decreasing values for SVI30 as shown in Figure 2c, highlighting the progression of sludge settleability. The curve for SVI30 undergoes a downward trend, which begins with SVI testing performed on day 7 and onwards. In Figure 2c, peaks on SVI30 curve on days 14 and 52 were associated with excess sludge production and washout, respectively. On day 14, increased sludge production in AGS-SBR-3 resulted in a MLSS concentration of 7.37 g/L which increased settling time due to excess biomass present in the system. A longer sludge settling time on day 52 was recorded after a reactor upset two days prior. The system is estimated to have completed 2 cycles without receiving influent. Aeration of settled sludge with one-half of the reactor working volume led to disruption of biological aggregates that previously enhanced the settling time. The average SVI30 was 52 ± 23 mL/g for the entire duration of the study and 45 ± 15 mL/g for all tests performed after day 14. The SVI30/SVI5 ratio for the entire duration of the study was 0.59 ± 0.21, which quantifies the percent granulation in the system. In Figure 2c, SVI30/SVI5 ratio is shown to have gradually increased after day 59 and reached a maximum of 0.96 on day 149. Granules were occasionally collected to monitor sludge morphology through visual inspection and microscopic imaging. As the research objectives were completed by day 163, the reactor operation was maintained to accommodate sludge sampling and storage. On day 212, final sampling and testing were completed and the SVI30 narrowly increased in response to a power outage and a routine campus lockout.
The potential for aerobic granular sludge reactors to operate at high sludge concentrations compared to activated sludge was witnessed in AGS-SBR-3. Irrespective of the fluctuations in MLSS concentration displayed in Figure 2f, consistent biomass growth allowed for concentrations of >7 g/L in AGS-SBR-3. Furthermore, MLSS concentration appeared to trend upwards throughout the experimental study. Sludge concentration increased from 5.20 to 7.37 g MLSS/L and 4.21 to 6.14 g MLVSS/L between days 7 and 14. A high sludge concentration was maintained until day 45 when MLSS and MLVSS decreased to 5.41 and 4.86 g/L, respectively. On day 51, the lowest MLSS (4.49 g/L) and MLVSS (3.99 g/L) concentrations for the entire experimental were recorded. A reduction in sludge concentration was caused by an improper timer setting for the decant pump on day 43, which led to a discharge of approximately 50% of the reactor’s volume as mixed liquor. The robustness of the AGS-SBR-3 was confirmed as the sludge concentration increased to 9.62 g MLSS/L and 8.66 g MLVSS/L by the 72nd day of the experiment study. Numerous process modifications were applied to AGS-SBR-3 between days 72 and 156. Process modifications included altering the concentration of COD and NH3-N in the feed solution to lower the COD/N ratio. On day 159, both COD and NH3-N were adjusted to 1500 mg/L and 120 mg/L, respectively. Sludge analysis on day 163 confirmed a reduction in the sludge concentration to 10.76 g MLSS/L and 9.95 g MLVSS/L. Similarly, a reduction in sludge concentration was also recorded on day 170. AGS-SBR-3 rebounded prior to the end of the experiment with the sludge concentration on day 212 remaining at >8 g MLSS/L and >7 g MLVSS/L. The MLVSS/MLSS ratio curve in Figure 2f, displays a slightly horizontal curve that gradually trend upwards. The average MLVSS/MLSS ratio of 0.89 ± 0.03 proves that MLVSS concentration was also high and continued to increase with the progression of the research study. A high MLVSS concentration signifies good microbial activity within AGS-SBR-3 [32]. The presence of various organisms was captured with the assistance of a microscope.

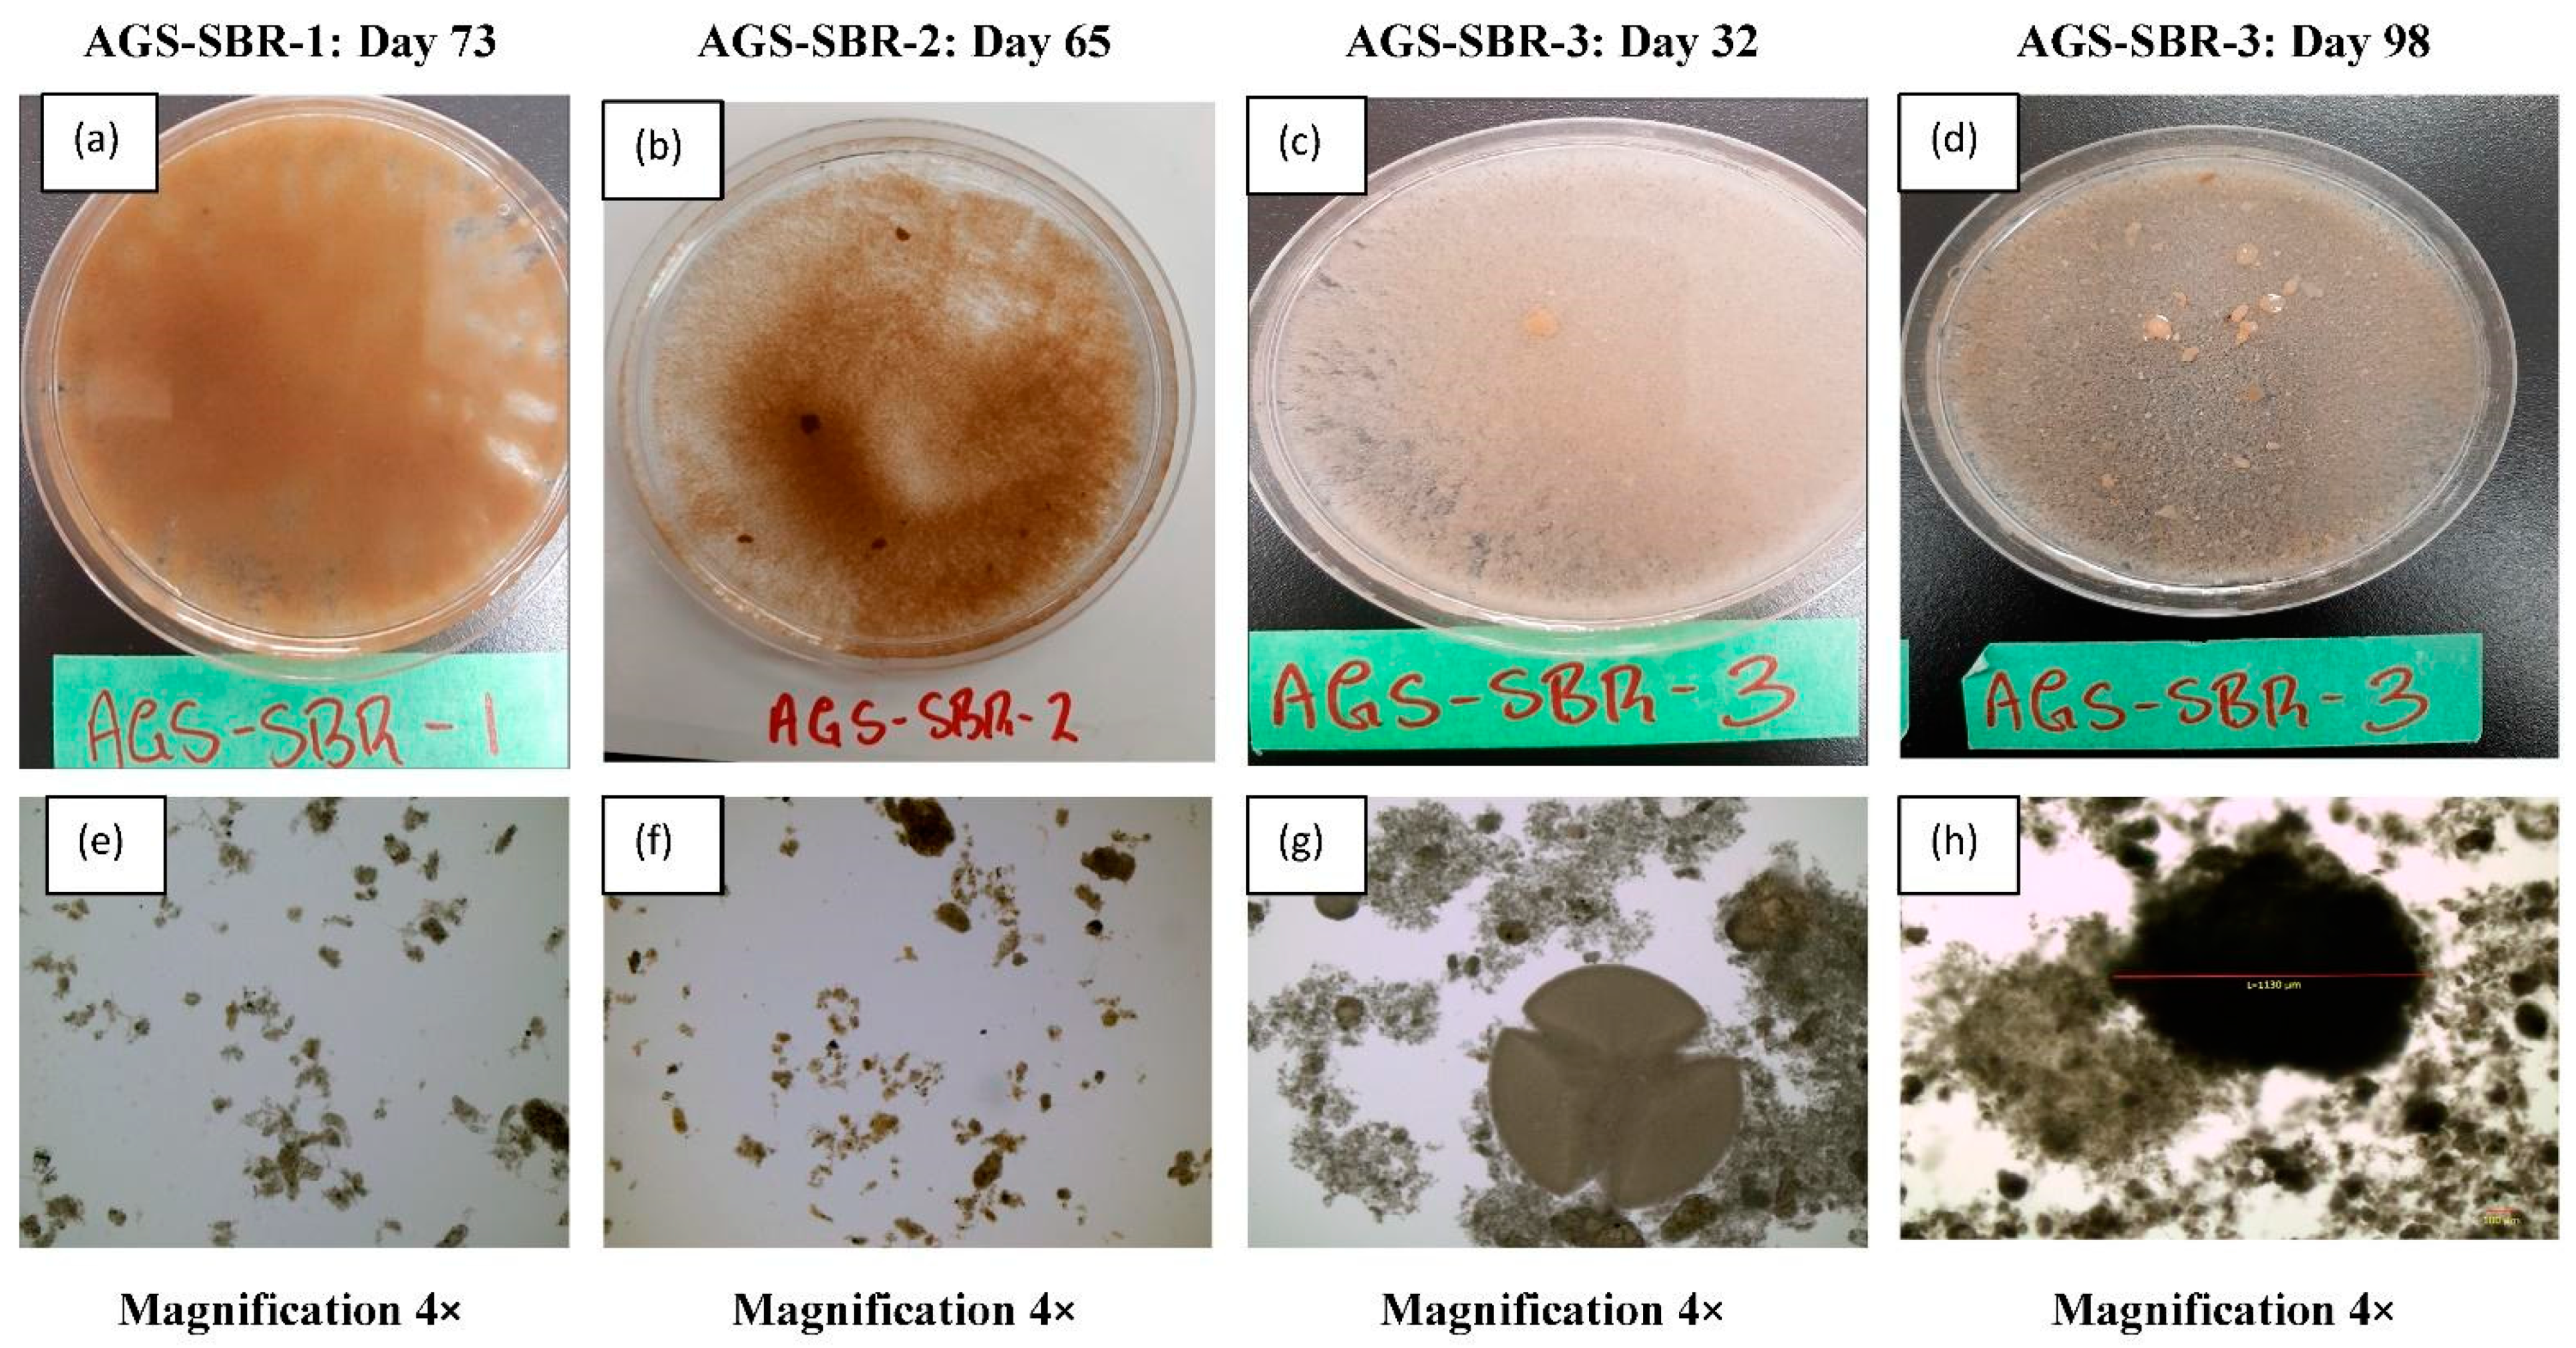
3.2. Morphology and Structure of Aerobic Granules

Images are organized according to the timeline of the study, which shows the following: (1) Transition from activated to granular sludge, and (2) Shape of granules. In Figure 3a,b,e,f, distinct nitrifying granules were not found even though the system displayed good settleability. In Figure 3e, several small aggregates in the sample were observed to be >100 μm. Similarly, the formation of small aggregates in AGS-SBR-2 was also observed in Figure 3f. In a study by Liu et al. [22], nitrifying granules with a size of 240 μm were formed using synthetic wastewater with an inorganic carbon source as feed. Figure 3c,g provide adequate evidence of granule formation as early as day 32 in AGS-SBR-3. In Figure 3h a granule with diameter 1130 μm (1.13 mm) was captured using the microscope. The diameter could have been slightly less since the cover slide crushed the granules during microscopic analysis. Nonetheless, large-sized granules were sampled as shown in Figure 3d.

3.3. Pollutants Removal Efficiencies

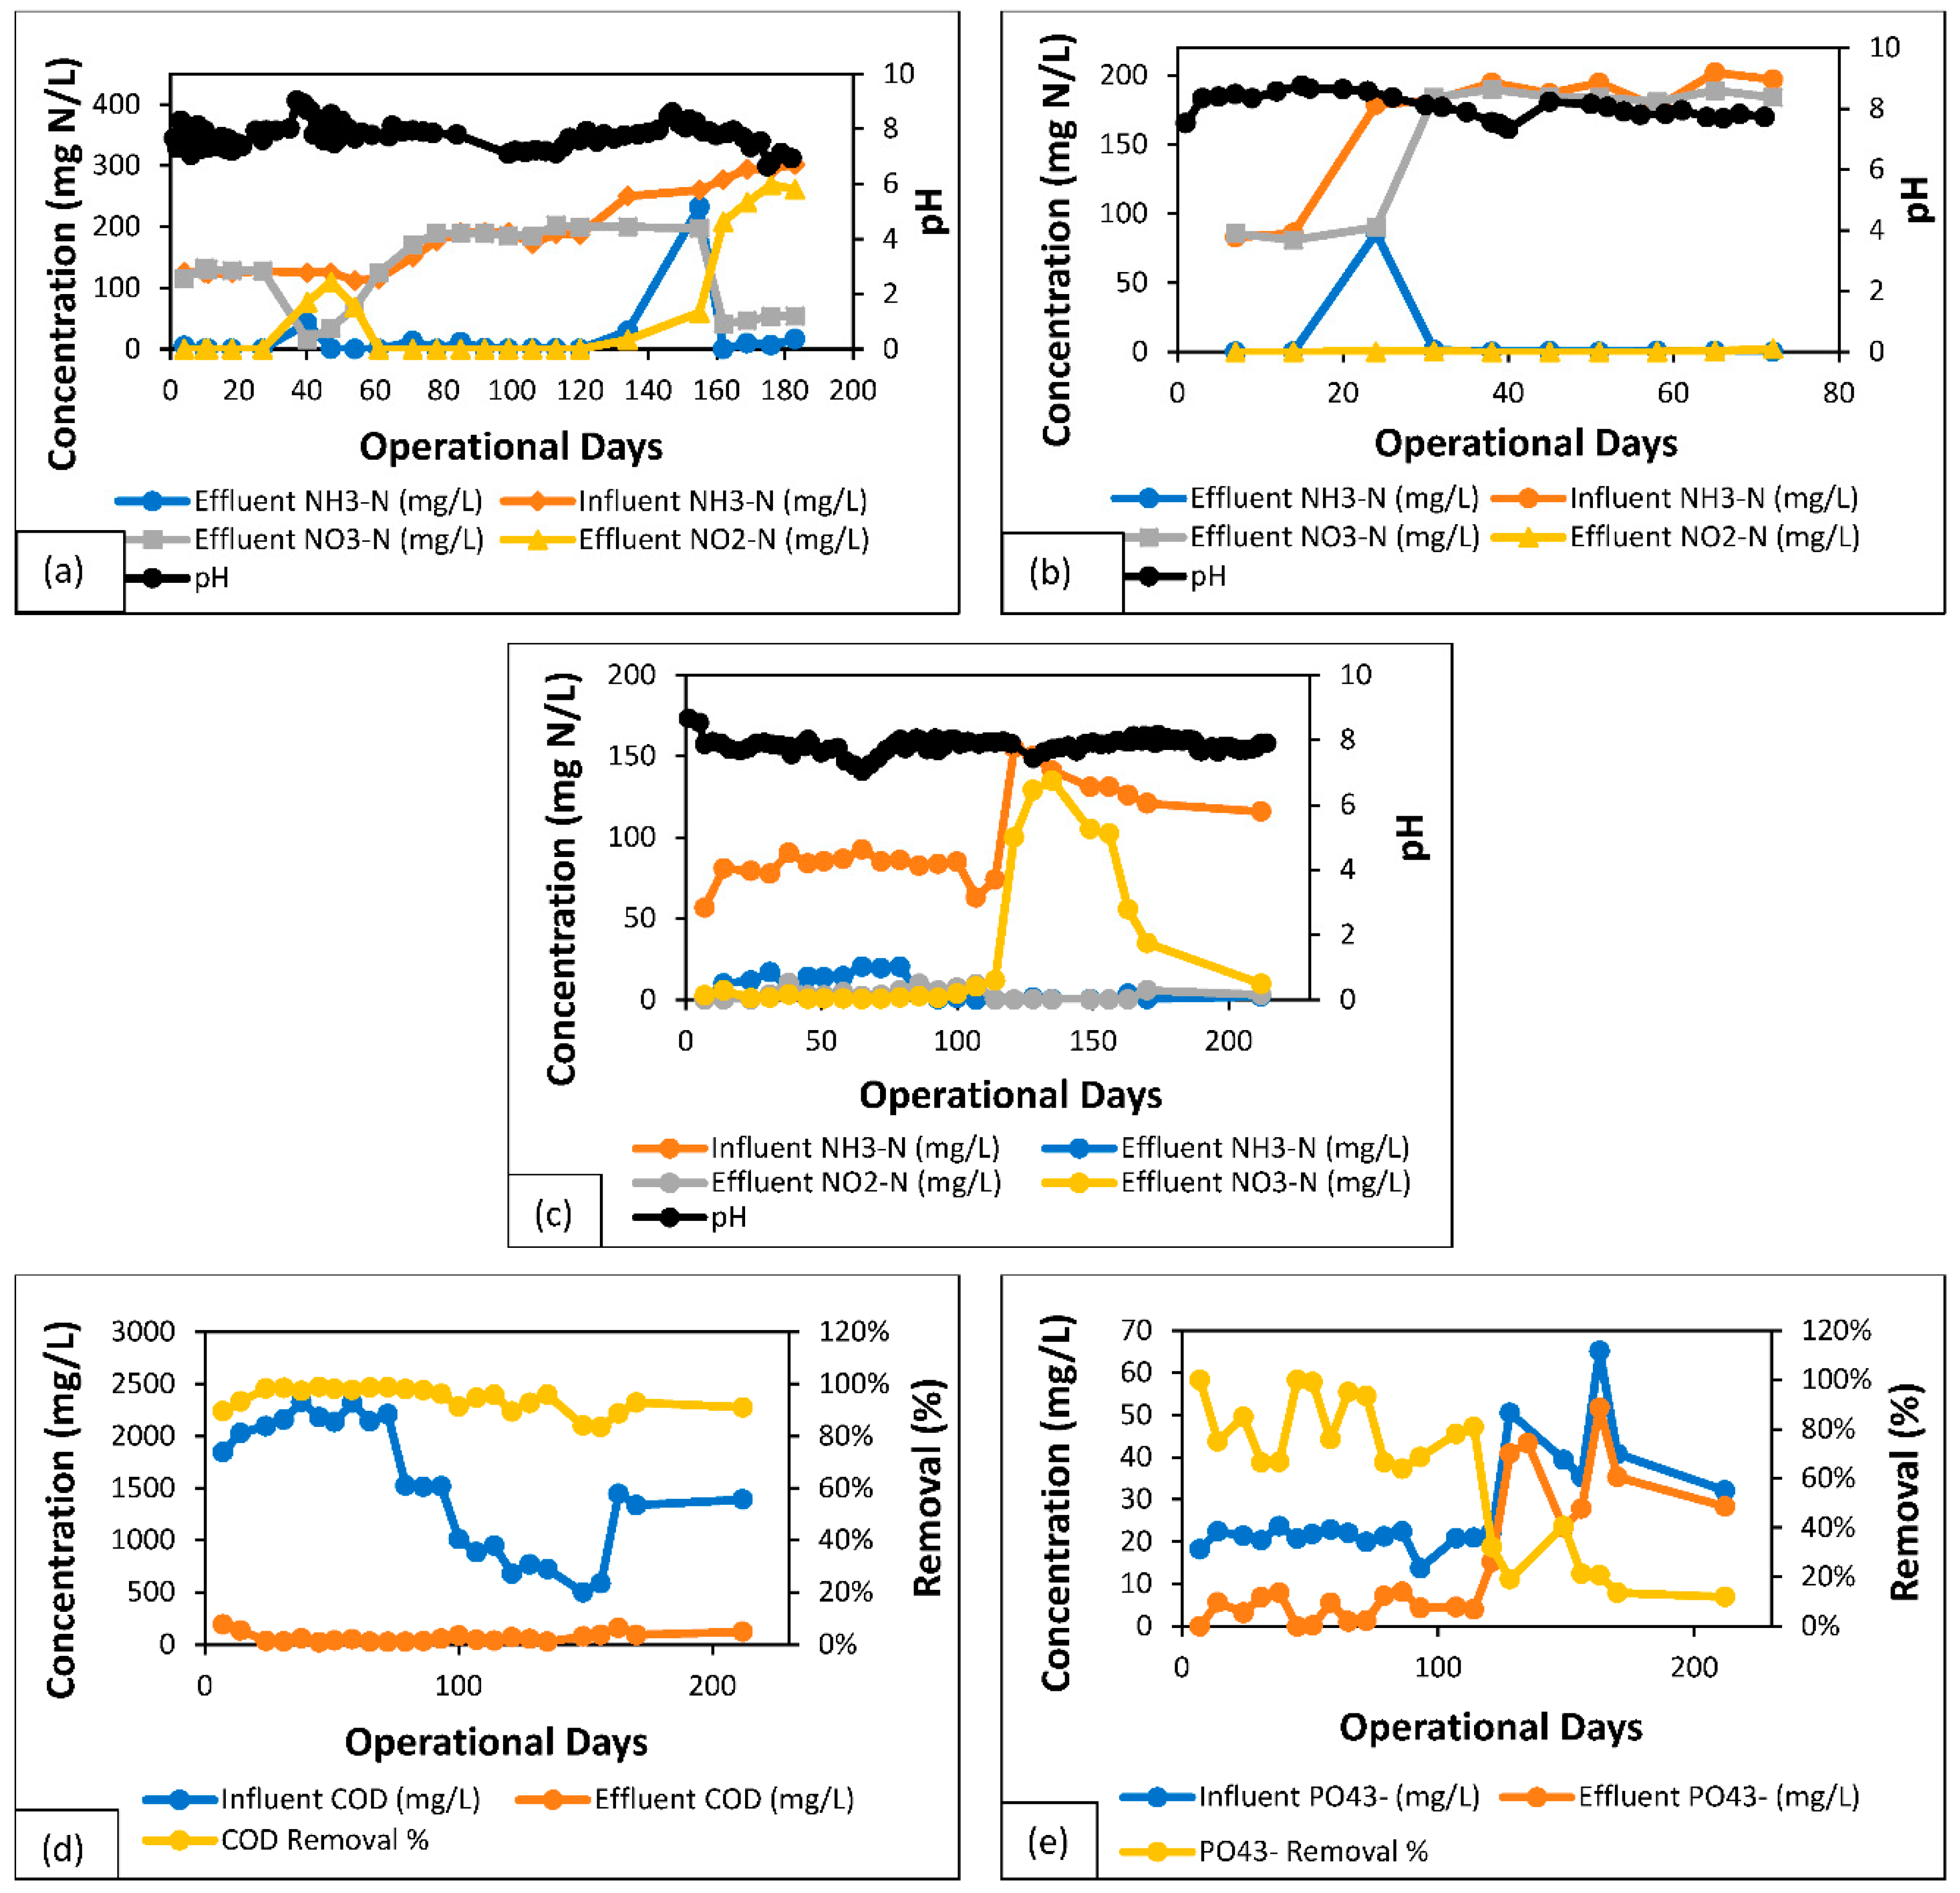
3.3.1. Centrate Nitrifying SBR (AGS-SBR-1)

AGS-SBR-1 displayed evidence of nitrification through the production of NOx-N [NO2-N + NO3-N]. During start-up, RAS was acclimated with undiluted centrate for three days to ensure adequate oxidation of NH3-N could be achieved during the subsequent 6-h (days 0–99) and 4-h (days 99–183) cycles. Following three days of acclimation, the reactor was fed with diluted centrate. Experimental analysis of samples collected on day 4 confirmed a 96% NH3-N removal and the production of NO3-N which signifies the occurrence of nitrification. NH3-N removal >96% was maintained throughout days 4–27 in AGS-SBR-1. Sludge sample collected and analyzed on the 27th day resulted in concentrations of 1.16 g MLSS/L and 0.96 g MLVSS/L. Though NH3-N removal was approx. 100%, a weekend shutdown was completed between days 34 to 36. With a reactor working volume of 1.2 L, half volume was re-seeded with RAS and the remainder was fed with undiluted centrate. On day 36, AGS-SBR-1 regained operation with a 6-h cycle time and a diluted centrate feed targeting 100 mg/L of NH3-N. Between days 36–61, it can be seen in Figure 4a that NH3-N removal was low on day 40, but it increased with continued operation. During this period, the production of NO3-N was hampered and NO2-N in the effluent was 109.8 mg/L. Secondly, on day 40 the pH reached 8.7 compared to a typical value within the range 7.3–7.9. The presence of AOBs in the mixed liquor allowed for efficient oxidation of NH3-N to NO2-N, resulting in partial nitrification. Further oxidation of NO2-N to NO3-N was impacted due to the absence of NOBs coupled with the increased pH resulting from the addition of NaHCO3 to supplement the alkalinity in centrate. A high pH would have impacted the growth of NOBs, which are considered to be more sensitive to increasing pH [35]. By day 61, experimental data obtained from analyzed sample confirmed complete recovery, i.e., low NO2-N and high NO3-N concentration in the effluent.
Increasing the concentration of NH3-Ncentrate feed to approx. 200 mg/L after day 61 did not impact performance. Between days 71 and 120, influent NH3-N averaged 180 ± 14 mg/L, equating to an NH3-N loading of 0.36 ± 0.03 g/L.d and the removal efficiency was 98 ± 3 %. A second increase in NH3-N influent concentration was interrupted due to a malfunction with the ancillary equipment. Prior to operational disruption, NH3-N removal was 88% on day 134, effluent NO3-N and NO2-N were 200 mg/L and 15 mg/L, respectively. The malfunctioning feed pump failure was discerned on day 137 and with unsuccessful attempts to guarantee adequate operation overnight, the remaining sludge in the reactor was augmented with 200 mL of RAS from ABTP on day 140. Reactor performance was severely impacted as shown by the low removal of NH3-N on day 155 at 11% in Figure 4a. The concentration of NO3-N slightly decreased to 198 mg/L, but NO2-N increased to a value of 60 mg/L. In addition to the effluent NH3-N of 232 mg/L, the nitrogen balance for day 155 was affected by the operational disruption–effluent concentrations of NH3-N, NO3-N and NO2-N exceeded the influent NH3-N concentration. The sludge concentration also decreased during this period, therefore, to prevent further sludge loss through resuspension while allowing for ammonia oxidation, SAV was lowered to 1 L/min after day 155. The impact of operating at a lower SAV was observed with samples collected between days 162 and 183. Excellent NH3-N removal was achieved, averaging 97 ± 2% but partial nitrification was dominant with NO2-N concentration remaining consistently high between 208–268 mg/L. Over the course of the entire research study (i.e., 183 days), average NH3-N removal was determined to be 93 ± 19%; inclusive of the reactor disruption periods. In Figure 4a, the downward peaks are indicative of the reactor disruptions periods. Additional information on the reactor’s performance can be found in the electronic Supplementary Material (Table S1).

3.3.2. Synthetic Centrate Nitrifying SBR (AGS-SBR-2)

The occurrence of nitrification in AGS-SBR-2 was confirmed after 7 days of operation, inclusive of an acclimation phase. An average NH3-N concentration of 84 ± 2 mg/L was fed to AGS-SBR-2 during acclimatization until day 14. Experimental analyses for days 7 and 14 confirmed 100% NH3-N removal, conversion of NO2-N during nitrification and an average effluent concentration of 83 ± 3 mg/L for NO3-N. Increasing the concentration of influent NH3-N after day 14 negatively impacted the performance of the system as shown in Figure 4b; NH3-N removal decreased to 52% and NO3-N concentration was 90 mg/L on day 24. On day 31, NH3-N returned to approximately 100% removal and NO3-N present in the effluent reflected the influent NH3-N concentration. Between days 31 and 72, influent NH3-N of 190 ± 8 mg/L was completely removed while average effluent concentration of NO3-N was 185 ± 3 mg/L. NO2-N effluent concentration was undetectable for majority of the period (i.e., <0.2 mg/L) until day 72 where a concentration of 2.19 mg/L was detected. Overall, NO2-N was consistently converted to NO3-N. The growth of distinct nitrifying granules was not detected in AGS-SBR-2, but the reactor’s performance in oxidizing NH3-N is an indication of the technology’s capability. The difficulty in cultivating nitrifying granules is related to the slow growth rate of autotrophic bacteria, which are responsible for nitrification [36]. Previously, researchers have confirmed the presence of nitrifying granules [22,37,38], but the cultivation process is understood to be time-consuming. Recent research have shifted to shortening the cultivation time through inoculation with mature granules or supplementing the carbon source [36,39].
The relationship between influent NH3-N and effluent NO3-N in AGS-SBR-2 between days 31 and 72, proved that the use of synthetic wastewater positively impacted nitrogen balance in the system. Synthetic centrate prepared in the laboratory contained considerably less impurities and was void of polymer compounds in comparison to real centrate collected from ABTP. In comparison to AGS-SBR-1, NO3-N in the effluent of AGS-SBR-2 was lower than the influent NH3-N concentration expect for days 31 and 58. The difference in concentration for days 31 and 58 were 2% and 3%, respectively. Similarly, day 7 shows NO3-N slightly higher than influent NH3-N with the difference being 3%. The average pH in AGS-SBR-2 for the duration of the research study was 8 ± 0.5. Minor fluctuation in pH was observed as depicted in Figure 4b, but the system displayed adequate stability. Over the course of the entire research study (i.e., 72 days), average NH3-N removal was determined to be 94 ± 16%. This takes into consideration a disruption in performance captured on day 24 in Figure 4b. Additional information on the reactor’s performance can be found in the electronic Supplementary Material (Table S2).

3.3.3. Nitrifying-Denitrifying SBR (AGS-SBR-3)

In AGS-SBR-3, the marginal difference between influent and effluent NH3-N represented an average removal of 92 ± 9% for the entire duration of the research study. Complete nitrogen removal was achieved in AGS-SBR-3 prior to day 100 with low NOx-N concentration in the effluent. Therefore, it was evident that simultaneous nitrification and denitrification (SND) is possibly the main removal mechanism involved. Aerobic granules are capable of SND due to its layered structure which can provide anoxic/anaerobic conditions deep within the granule for conversion of NOx-N to dinitrogen gas (N2) [40]. An increase in NH3-N concentration in the feed stock with reduced COD resulted in excess NO3-N in the effluent as shown in Figure 4c. NO3-N accumulation is shown to moderately increase between days 100 and 114 with an average COD/N ratio of 13 ± 1. A tremendous increase in effluent NO3-N is seen between days 114 and 135; the latter representing the peak value of 134.8 mg/L. During this period, the average COD/N ratio was 5 ± 0.4. Effluent NO3-N concentrations of 105.2 mg/L and 102.4 mg/L were recorded on days 145 and 156, respectively. NO3-N concentration > 100 mg/L is considered high in comparison to recorded values prior to the first substantial spike on day 114. The COD/N ratio averaged 4 ± 0.5 for day 145 and 156. Overall, the average COD/N ratio for days 114 to 156 was 5 ± 0.5. NOx-N accumulation at a low COD/N highlights the dependence on readily biodegradable in the feed for adequate SND. In a study by Ren et al. [31], NOx-N accumulation and low SND efficiencies occurred in an aerobic granular sludge system when biodegradable COD in the feed decreased. NO3-N continued to decrease after day 156 through to the 212th day with an average COD/N ratio of 12 ± 0.5 recorded during this period. The intermediate product, NO2-N, generated during nitrification was continuously converted to NO3-N. The maximum concentration of NO2-N recorded in the effluent was 10.28 mg/L on day 38, while 42% of samples had concentration of <0.2 mg/L. SND efficiency for the period with low NOx-N accumulation was 87 ± 11%. pH readings were recorded at various instances during a cycle and automatic adjustments was performed with the help of a pump used to dose HCl. An average pH of 7.86 ± 0.29 was tabulated for the duration of the experimental study. Additional information on the reactor’s performance can be found in the electronic Supplementary Material (Table S3).
COD concentration between days 7 and 72 averaged 2143 ± 139 mg/L as shown in Figure 4d. After confirming the presence of granules in AGS-SBR-3, COD concentration in the feed was gradually lowered in stages until day 159. COD concentration in the feed was increased to 1445 mg/L on day 159 and an average of 1390 ± 54 was maintained for the remainder of the study as shown in Figure 4d. CH3COONa was included in both the synthetic wastewater and diluted centrate feed solution as the main source of COD; with a switch in feed streams occurring after day 79. Supplemental acetate-COD played two important roles in AGS-SBR-3: (1) Nitrogen removal—Heterotrophic organisms utilize acetate-COD as electron donor for energy generation [30,41], and (2) Phosphorus removal—Acetate-COD is hydrolyzed into organic acids to aid in phosphorus release and uptake [42]. Excellent COD removal is supported by the fact that it is the limiting substrate in nitrogen and phosphorus removal [43].
Effluent monitoring of AGS-SBR-3 captured the removal of phosphorus as shown in Figure 4e, where an average removal of 81 ± 14% was achieved between days 1–114 of operation. During this period, COD in the feed was gradually decreased after day 72 and the feed stream was switched to centrate instead of synthetic wastewater after day 79. Synthetic wastewater consisted of K2HPO4, KH2PO4 as a phosphorus source. Phosphorus removal drastically decreased on day 121, at which point the COD was <800 mg/L and NH3-N was increased to >120 mg/L in the feed. Average phosphorus removal determined for the remainder of the study was 23 ± 10%. Sequential operation of AGS-SBR-3 did not change; therefore the presence of anoxic-aerobic conditions would have influenced the growth of phosphate-accumulating organisms (PAOs)—widely known their role in biological phosphorus removal [43]. A reduction in phosphorus removal on day 121 indicates that a low COD concentration negatively impacts the function of PAOs. According to Zeng et al. [43], COD is a limiting substrate in nitrogen and phosphorus removal processes. Furthermore, the connection between nitrogen and phosphorus removal (i.e., the denitrification step) led researchers to recognizing the function of denitrifying PAOs [44]. Pronk et al. [45] expressed that dPAOs can operate with double functionality in an AGS system: (1) an electron donor in the denitrification process, and (2) store phosphate as poly-P. In this study, NH3-N was removed without NO2-N and NO3-N accumulation, indicating simultaneous nitrification, denitrification, and phosphorus removal. In a study by Figdore et al. [27], a cycle test using NDN-PAO granules resulted in concurrent phosphate uptake and NH3-N removal without accumulation of NO2-N and NO3-N. Furthermore, it was concluded that NO2-N and NO3-N occurred during the aeration phase—thus confirming SND mechanism in a granular system [27].

3.4. Pollutants Degradation in SBR Cycle

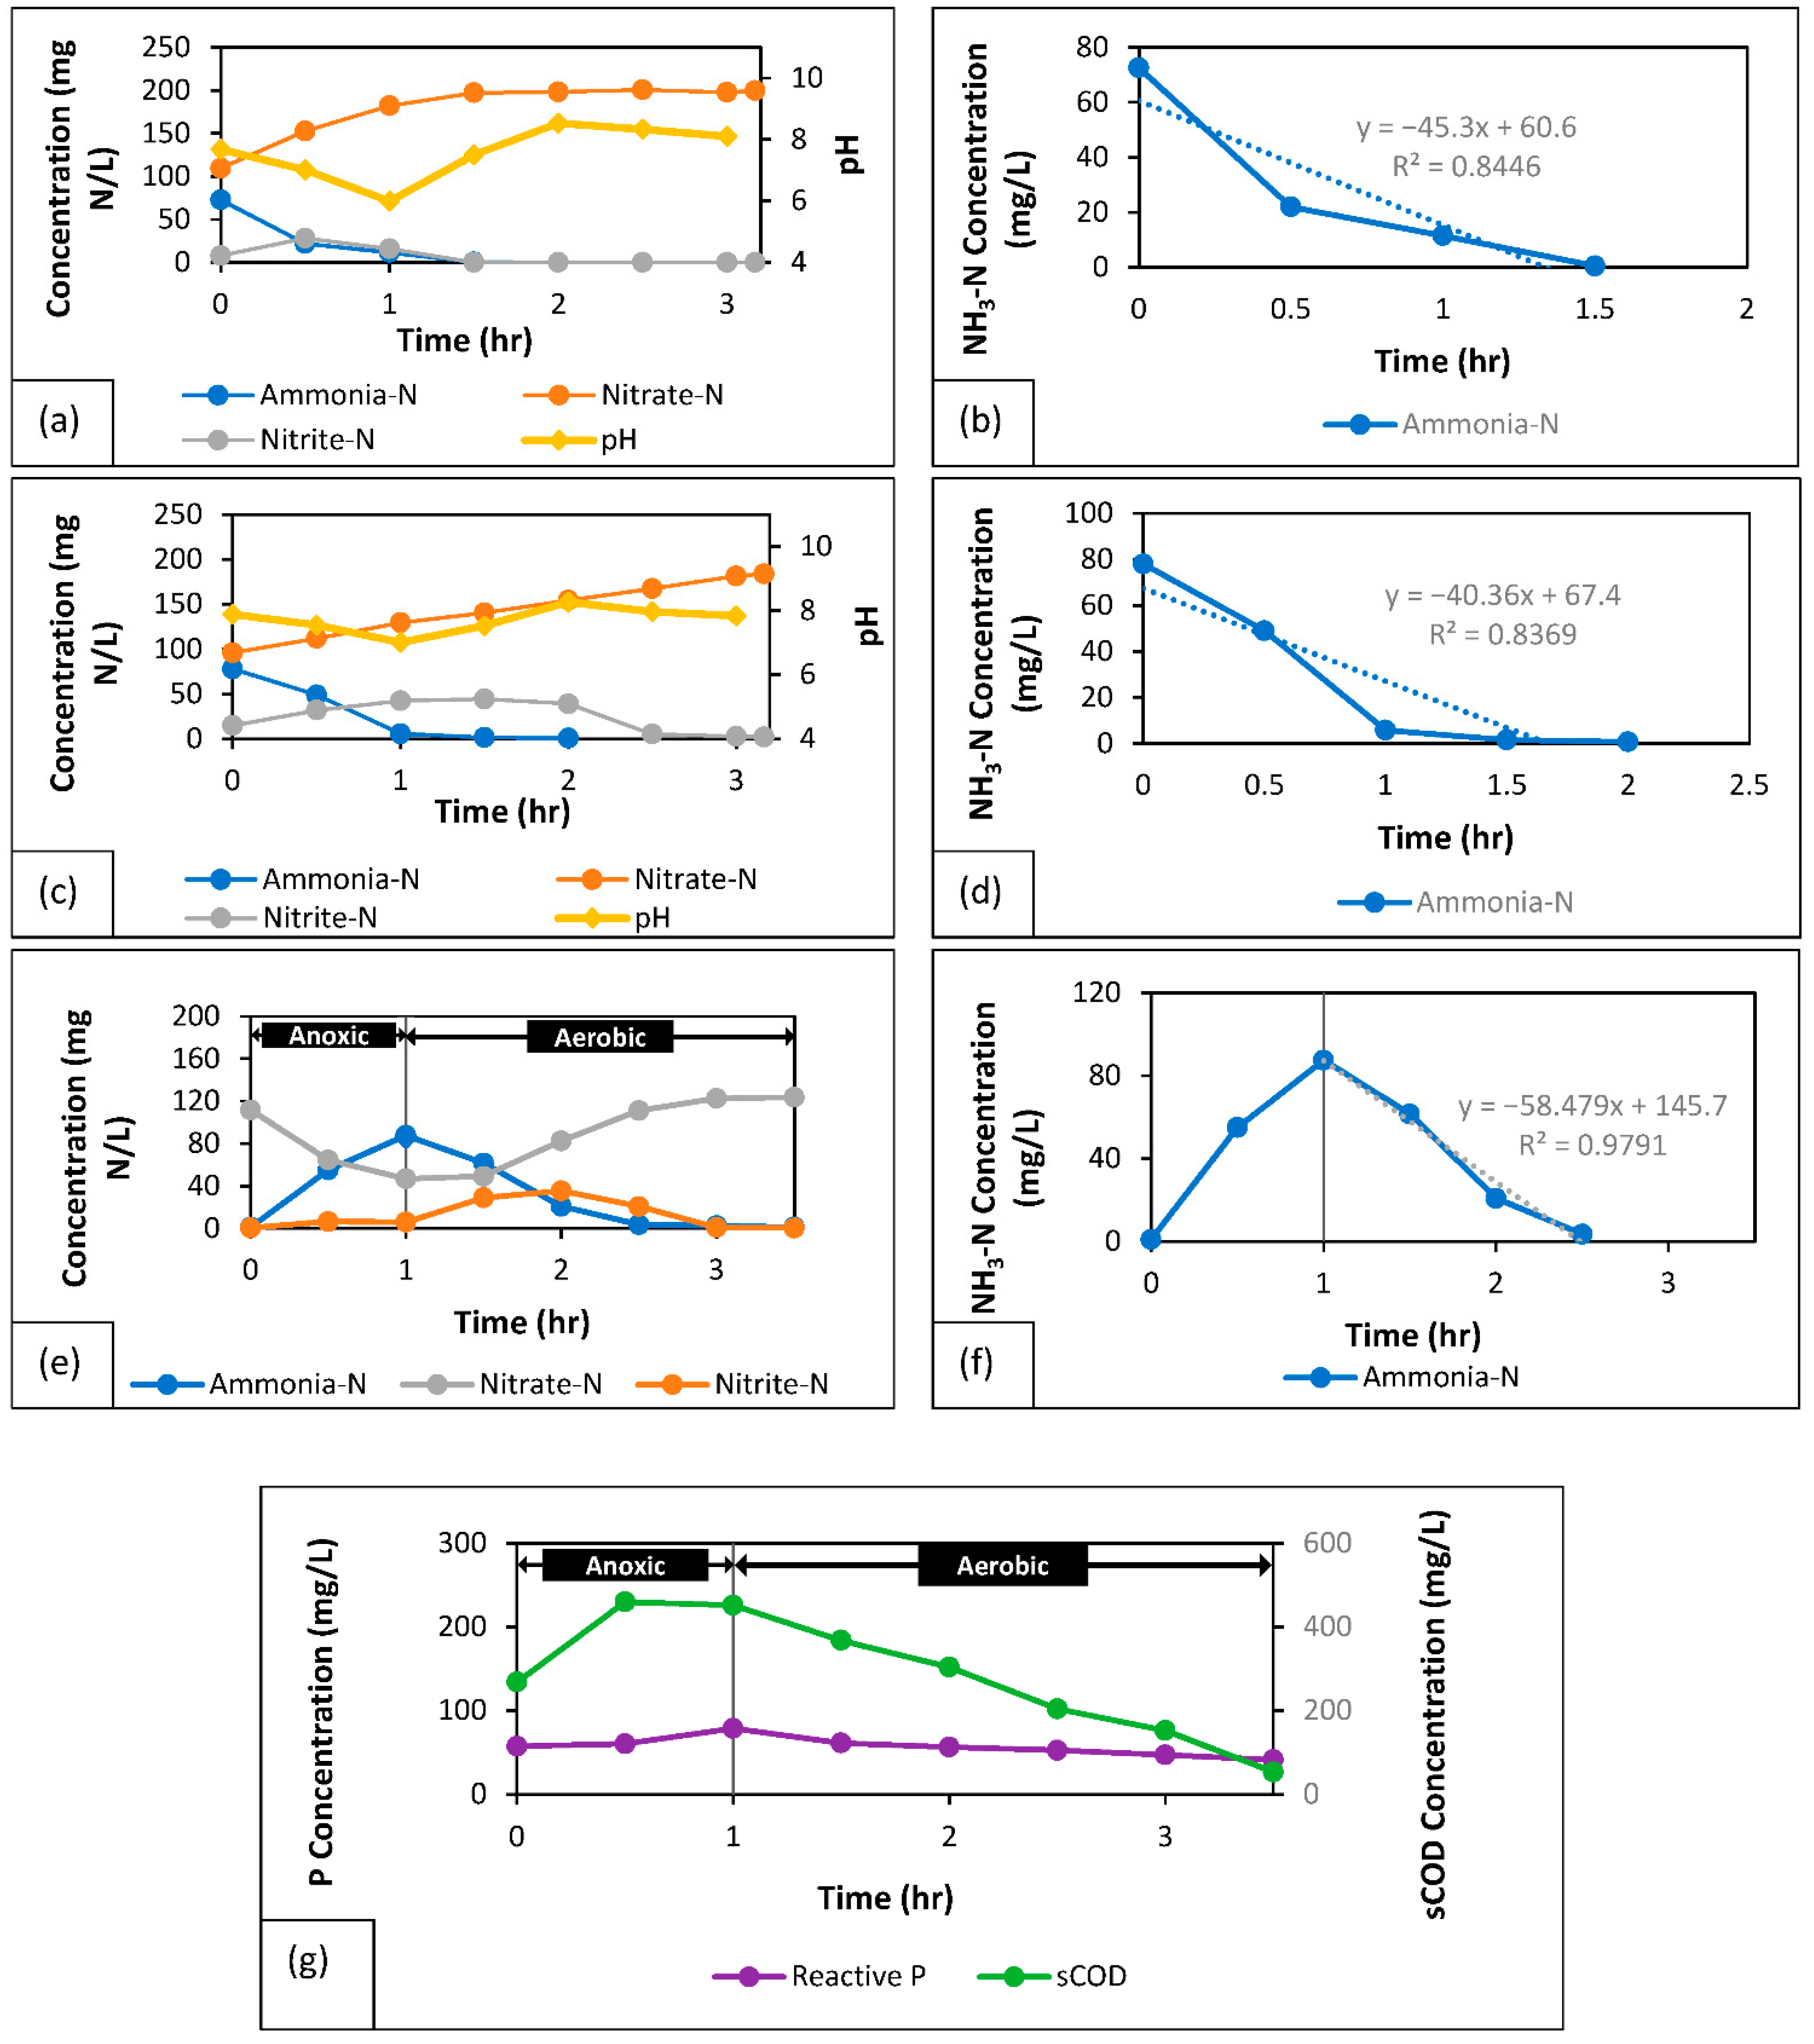
3.4.1. Cycle Test: AGS-SBR-1 (Day 120)

The cycle test completed for AGS-SBR-1 captured the concentrations of NH3-N, NO3-N and NO2-N during a 4-h cycle period in Figure 5a. The pH curve depicts the effect of nitrification reaction on alkalinity during the cycle. It is evident in Figure 5a that the pH decreases from 7.68 to 5.99 within the first hour of the cycle. NaHCO3 was dosed to the reactor at two different points during the 4-h cycle; the 1-h and 1.5-h mark. Nitrification reduces alkalinity and subsequently the pH of the system through oxidation of NH3-N [46]. The H+ ions are freed from the nitrogen bond as NH3-N is converted to NO2-N and inevitably NO3-N, thus creating acidic conditions and altering the pH buffer capability.
Ammonia removal in parallel with the production of NO3-N via conversion of NO2-N occurred with 1.5 h of the cycle as shown in Figure 5a. Concentrations of NH3-N, NO3-N and NO2-N measured at time zero were 72.5 mg/L, 109.5 mg/L and 7.85 mg/L, respectively. At the 1.5-h mark, both NH3-N and NO2-N were depleted, and the concentration of NO3-N was 197.0 mg/L, approximately 7 mg/L more than the sum of concentrations for all three nitrogenous compounds at time zero. While this confirmed ammonia oxidation and complete nitrification within 1.5 h, the additional production of NO3-N is presumably linked to the presence of organic nitrogen in the centrate. Organic nitrogen can form NH3-N and undergo nitrification. The rate of NH3-N uptake was determined by performing linear regression on NH3-N depletion over time. In Figure 5b, NH3-N is shown to have been depleted within 1.5 h. Linear regression of the curve resulted in a nitrification rate (NR) of 45.3 mg NH3-N/L·h. Furthermore, the average MLVSS concentration was 2.36 ± 0.02 g/L, resulting in a specific nitrification rate (SNR) of 19.19 mg NH3-N/g VSS·h. Calculated values for NR and SNR using Equations (4)–(7) were 64.16 mg NH3-N/L·h and 26.96 mg NH3-N/g VSS·h, respectively.

3.4.2. Cycle Test: AGS-SBR-2 (Day 72)

In Figure 5c, the depletion of NH3-N is monitored for one complete cycle. In addition to NH3-N, Figure 5c shows how NO2-N is produced and convert to NO3-N. The concentration of NH3-N after 1.5 h is 1.6 mg/L, followed by 0.8 mg/L at the 2-h mark. NH3-N is completed depleted after the 2 h of operation. Interestingly, the concentration of NH3-N at the 0.5-h mark was 49 mg/L, which is high compared to AGS-SBR-1 where a lower concentration of 22 mg/L was achieved within the same time span. Between 0.5 to 1 h, majority of the NH3-N in AGS-SBR-1 was oxidized. The production and conversion of NO2-N to NO3-N occurred for the entire duration of the cycle, but majority of NO2-N was converted after the 2.5 h. The concentration of NO2-N at the 2.5-h mark was 5.37 mg/L. The slow-paced conversion of NO2-N resulted in a gradual increase in NO3-N. The NO3-N curve in Figure 5c increased to a concentration of 184 mg/L. Reactor pH was dependent on the occurrence of nitrification and the addition of NaHCO3 to supplement alkalinity. AGS-SBR-1 and AGS-SBR-2 were fed with NaHCO3 from a common pump which operated on a timer. NaHCO3 would be dosed at the 1-h and 1.5-h mark during a cycle. It can be seen in Figure 5c that pH increased after the alkalinity dosing points for AGS-SBR-2. The pH in AGS-SBR-2 decreased to 7.01 before the first dose of NaHCO3. In AGS-SBR-1, Figure 5a shows that pH decreased to 5.99 before the first dose of NaHCO3. It is evident through the consumption of alkalinity–ability of the system to buffer pH decreases—that AGS-SBR-2 initially experienced a slower nitrification rate compared to AGS-SBR-1, but the rate increased after the 0.5 and 1-h mark. Computational determination of NR and SNR were performed by analyzing the NH3-N curve in Figure 5d. Irrespective if the slow start to NH3-N removal in AGS-SBR-2, linear regression of the curve resulted in a NR of 40.36 mg NH3-N/L·h. The average concentration of MLVSS between the start and end of the cycle was 1.475 ± 0.26 g/L, therefore SNR was 27.36 mg NH3-N/g VSS·h. Calculated values for NR and SNR using Equations (4)–(7) were 63.31 mg NH3-N/L·h and 38.14 mg NH3-N/g VSS·h, respectively.

3.4.3. Cycle Test: AGS-SBR-3 (Day 128)

The cycle test completed on day 128 as shown in Figure 5e, accurately displays the impact of a low COD/N ratio on NH3-N removal via the nitrification-denitrification reaction pathway. During the anoxic feeding period, NO3-N is biologically used as an oxidizer to remove organics–representing denitrification. In Figure 5e, NO3-N concentration is reduced by 58% during the anoxic period from 111.50 to 46.70 mg/L. NH3-N concentration continues to increase in the system as the reactor is fed during the anoxic period. NO2-N in the feed is typically <0.2 mg/L, yet it’s generation during the anoxic period is linked to residual oxygen within the system. An extended aeration period from the previous cycle introduces a substantial amount of oxygen in the system that may promote minimal nitrification during the anoxic period. At the 1-h mark, air bubbles are introduced to develop an aerobic environment within the system. NO2-N is produced and converted to NO3-N—which continues to increase for the remainder of the cycle. NO2-N concentration peaked at after 1 h while NH3-N is decreased to a concentration of 3.59 mg/L within 1.5 h of aeration. The final concentration for NH3-N recorded at the end of the cycle was 1.23 mg/L. Accumulation of NO3-N discussed previously was evident in the cycle test conducted on day 128. The COD/N ratio was determined to be 4.77 on the 128th day of operation. Linear regression of the curve resulted in a NR of 58.48 mg NH3-N/L·h as shown in Figure 5f. The average concentration of MLVSS between the start and end of the cycle was 8.52 ± 0.26 g/L, therefore SNR was 6.86 mg NH3-N/g VSS·h. Calculated values for NR and SNR using Equations (4)–(7) were 79.86 mg NH3-N/L·h and 9.18 mg NH3-N/g VSS·h, respectively. Nitrification and/or specific nitrification rates for various studies are presented in Table 6.
The concentration profiles of COD and phosphorus for day 128 are shown in Figure 5g. COD increases during the anaerobic feed phase before it is assimilated under aerobic conditions. A fraction of the COD is assimilated under anaerobic conditions for denitrification and phosphorus release [47,48]. Low COD concentrations on day 128 resulted in subpar phosphorus removal as shown in Figure 5g.

4. Conclusions

This study shows that aerobic granular sludge systems are a viable treatment technology for liquid sidestreams generated in a WWTP. Cultivation of nitrifying-denitrifying granules <1000 μm (<1 mm) was observed after 32 days, whereas nitrifying sludge consisted of small aggregates with diameter >100 μm for majority of the study period. Good settleability of nitrifying sludge was observed with SVI30 values of 72 ± 12 mL/g (AGS-SBR with real centrate) and 59 ± 11 mL/g (AGS-SBR-2 with synthetic centrate). Nitrifying-denitrifying displayed an average SVI30 of 52 ± 23 mL/g for the entire duration of the study. Excellent NH3-N removal, >90%, was achieved in the nitrifying AGS-SBRs. The nitrifying-denitrifying AGS-SBR displayed good COD (>90%) and P (>80%) removal without NOx-N accumulation COD/N ratio >11 mg sCOD/mg NH3-N. Simultaneous nitrification-denitrification (SND) and phosphorus removal was dominant at higher COD/N ratios. NOx-N accumulation was observed, and P removal was affected when decreasing the COD/N (4–5 mg sCOD/mg NH3-N). The nitrifying-denitrifying AGS-SBR displayed produced the highest NR 58.48 mg NH3-N/L·h, while the overall SND during periods with negligible NOx-N accumulation was 87 ± 11%. With the formation of small aggregates (i.e., microgranules) in the nitrifying systems fed with real and synthetic centrate, the NR was 45.3 mg NH3-N/L·h and 40.36 mg NH3-N/L·h, respectively. The AGS-SBRs in this study produced higher nitrification rates compared to that reported in the literature. Future research should focus on enhancing the mechanism of formation for nitrifying granules without an organic carbon source within a short period and implementing SND using nitrifying-denitrifying at pilot scale.

Supplementary Materials

The following supporting information can be downloaded at: https://www.mdpi.com/article/10.3390/pr10091687/s1, Table S1: Performance summary of AGS-SBR-1; Table S2: Performance summary of AGS-SBR-2; Table S3: Performance summary of AGS-SBR-3.

Author Contributions

Conceptualization, R.A.H.; methodology, R.A.H. and G.M.; validation, R.A.H.; formal analysis, R.A.H. and G.M.; investigation, R.A.H. and G.M.; resources, R.A.H.; data curation, G.M.; writing—original draft preparation, G.M.; writing—review and editing, R.A.H.; visualization, R.A.H.; supervision, R.A.H.; project administration, R.A.H.; funding acquisition, R.A.H. All authors have read and agreed to the published version of the manuscript.

Funding

This research was funded by Natural Sciences and Engineering Council of Canada (NSERC), Discovery Grants and Faculty of Engineering and Architectural Science (FEAS) at Ryerson University.

Institutional Review Board Statement

Not Applicable.

Informed Consent Statement

Not Applicable.

Data Availability Statement

Not Applicable.

Acknowledgments

The authors would like to acknowledge the funding support provided by the Natural Sciences and Engineering Council of Canada (NSERC) and the Faculty of Engineering and Architectural Science (FEAS) at Ryerson University (renaming to Toronto Metropolitan University in progress).

Conflicts of Interest

The authors declare no conflict of interest.

References

  1. Stamatelatou, K. Novel biological processes for nutrient removal and energy recovery from wastewater. In Wastewater and Biosolids Management; IWA Publishing: London, UK, 2020; pp. 27–42. [Google Scholar]
  2. Mihelcic, J.R.; Ren, Z.J.; Cornejo, P.K.; Fisher, A.; Simon, A.J.; Snyder, S.W.; Zhang, Q.; Rosso, D.; Huggins, T.M.; Cooper, W.; et al. Accelerating Innovation that Enhances Resource Recovery in the Wastewater Sector: Advancing a National Testbed Network. Environ. Sci. Technol. 2017, 51, 7749–7758. [Google Scholar] [CrossRef] [PubMed]
  3. Dev, S.; Saha, S.; Kurade, M.B.; Salama, E.S.; El-Dalatony, M.M.; Ha, G.-S.; Chang, S.W.; Jeon, B.-H. Perspective on anaerobic digestion for biomethanation in cold environments. Renew. Sustain. Energy Rev. 2019, 103, 85–95. [Google Scholar] [CrossRef]
  4. De Vrieze, J.; Smet, D.; Klok, J.; Colsen, J.; Angenent, L.T.; Vlaeminck, S.E. Thermophilic sludge digestion improves energy balance and nutrient recovery potential in full-scale municipal wastewater treatment plants. Bioresour. Technol. 2016, 218, 1237–1245. [Google Scholar] [CrossRef] [PubMed]
  5. Ochs, P.; Martin, B.D.; Germain, E.; Stephenson, T.; van Loosdrecht, M.; Soares, A. Ammonia removal from thermal hydrolysis dewatering liquors via three different deammonification technologies. Sci. Total Environ. 2020, 755, 142684. [Google Scholar] [CrossRef]
  6. Stenström, F.; La Cour Jansen, J. Promotion of nitrifiers through side-stream bioaugmentation: A full-scale study. Water Sci. Technol. 2016, 74, 1736–1743. [Google Scholar] [CrossRef]
  7. Eskicioglu, C.; Galvagno, G.; Cimon, C. Approaches and processes for ammonia removal from side-streams of municipal effluent treatment plants. Bioresour. Technol. 2018, 268, 797–810. [Google Scholar] [CrossRef] [PubMed]
  8. Lacroix, A.; Mentzer, C.; Pagilla, K.R. Full-scale N removal from centrate using a sidestream process with a mainstream carbon source. Water Environ. Res. 2020, 92, 1922–1934. [Google Scholar] [CrossRef] [PubMed]
  9. Bowden, G.; Tsuchihashi, R.; Stensel, H.D. Technologies for Sidestream Nitrogen Removal; IWA Publishing: London, UK, 2016; Volume 15. [Google Scholar]
  10. Menkveld, H.W.H.; Broeders, E. Recovery of ammonia from digestate as fertilizer. Water Pract. Technol. 2018, 13, 382–387. [Google Scholar] [CrossRef]
  11. Lei, C.S.; Ma, J.F.; Li, D.L.; Zhang, W.Y.; Guang, X.H.; Ma, J. Composite denitrification reagent for high concentration ammonia removal by air stripping. Chin. Sci. Bull. 2010, 55, 2657–2661. [Google Scholar] [CrossRef]
  12. Aljerf, L. Advanced highly polluted rainwater treatment process. J. Urban Environ. Eng. 2018, 12, 50–58. [Google Scholar] [CrossRef]
  13. Thornton, A.; Pearce, P.; Parsons, S.A. Ammonium removal from digested sludge liquors using ion exchange. Water Res. 2007, 41, 433–439. [Google Scholar] [CrossRef] [PubMed]
  14. Zeng, Y.; Sun, Z.Y.; Chen, Y.T.; Xia, Z.Y.; Gou, M.; Tang, Y.Q. Performance and bacterial communities in conventional activated sludge and membrane bioreactor systems with Low C/N ratio wastewater for nitrogen removal. Environ. Eng. Sci. 2019, 36, 1112–1126. [Google Scholar] [CrossRef]
  15. Dold, P.; Du, W.; Burger, G.; Jimenez, J. Is Nitrite-Shunt Happening in the System? Are Nob Repressed? Proc. Water Environ. Fed. 2015, 2015, 1360–1374. [Google Scholar] [CrossRef]
  16. Kartal, B.; Kuenen, J.G.; Van Loodsdrecht, M.C.M. Sewage Treatment with Anammox. Am. Assoc. Adv. Sci. 2010, 328, 702–703. Available online: https://www.jstor.org/stable/40655872 (accessed on 14 March 2022). [CrossRef]
  17. Pedros, P.B.; Onnis-Hayden, A.; Tyler, C. Investigation of Nitrification and Nitrogen Removal from Centrate in a Submerged Attached-Growth Bioreactor. Water Environ. Res. 2008, 80, 222–228. [Google Scholar] [CrossRef] [PubMed]
  18. Scaglione, D.; Ficara, E.; Corbellini, V.; Tornotti, G.; Teli, A.; Canziani, R.; Malpei, F. Autotrophic nitrogen removal by a two-step SBR process applied to mixed agro-digestate. Bioresour. Technol. 2015, 176, 98–105. [Google Scholar] [CrossRef]
  19. López-Palau, S.; Dosta, J.; Pericas, A.; Mata-Álvarez, J. Partial nitrification of sludge reject water using suspended and granular biomass. J. Chem. Technol. Biotechnol. 2011, 86, 1480–1487. [Google Scholar] [CrossRef]
  20. Zhang, S.; Peng, Y.; Wang, S.; Zheng, S.; Guo, J. Organic matter and concentrated nitrogen removal by shortcut nitrification and denitrification from mature municipal landfill leachate. J. Environ. Sci. 2007, 19, 647–651. [Google Scholar] [CrossRef]
  21. Świątczak, P.; Cydzik-Kwiatkowska, A. Treatment of Ammonium-Rich Digestate from Methane Fermentation Using Aerobic Granular Sludge. Water Air. Soil Pollut. 2018, 229, 1–12. [Google Scholar] [CrossRef]
  22. Liu, Y.Q.; Wu, W.W.; Tay, J.H.; Wang, J.L. Formation and long-term stability of nitrifying granules in a sequencing batch reactor. Bioresour. Technol. 2008, 99, 3919–3922. [Google Scholar] [CrossRef]
  23. Figdore, B.A.; Winkler, M.-K.H.; Stensel, H.D. Bioaugmentation with Nitrifying Granules in Low-SRT Flocculent Activated Sludge at Low Temperature. Water Environ. Res. 2017, 90, 343–354. [Google Scholar] [CrossRef] [PubMed]
  24. Nancharaiah, Y.V.; Sarvajith, M. Aerobic granular sludge process: A fast growing biological treatment for sustainable wastewater treatment. Curr. Opin. Environ. Sci. Health 2019, 12, 57–65. [Google Scholar] [CrossRef]
  25. Wei, D.; Shi, L.; Yan, T.; Zhang, G.; Wang, Y.; Du, B. Aerobic granules formation and simultaneous nitrogen and phosphorus removal treating high strength ammonia wastewater in sequencing batch reactor. Bioresour. Technol. 2014, 171, 211–216. [Google Scholar] [CrossRef] [PubMed]
  26. Kocaturk, I.; Erguder, T.H. Influent COD/TAN ratio affects the carbon and nitrogen removal efficiency and stability of aerobic granules. Ecol. Eng. 2016, 90, 12–24. [Google Scholar] [CrossRef]
  27. Figdore, B.A.; David Stensel, H.; Winkler, M.K.H. Bioaugmentation of sidestream nitrifying-denitrifying phosphorus-accumulating granules in a low-SRT activated sludge system at low temperature. Water Res. 2018, 135, 241–250. [Google Scholar] [CrossRef]
  28. Wilén, B.M.; Liébana, R.; Persson, F.; Modin, O.; Hermansson, M. The mechanisms of granulation of activated sludge in wastewater treatment, its optimization, and impact on effluent quality. Appl. Microbiol. Biotechnol. 2018, 102, 5005–5020. [Google Scholar] [CrossRef]
  29. APHA. Standard Methods for Examination of Water and Wastewater, 22nd ed.; American Public Health Association: Washington, DC, USA, 2012. [Google Scholar]
  30. Inc. Metcalf & Eddy; Tchobanoglous, G.; Stensel, H.D.; Tsuchihashi, R.; Burton, F.; Abu-Orf, M.; Bowden, G.; Pfrang, W. Wastewater Engineering: Treatment and Resource Recovery; McGraw-Hill Education: New York, NY, USA, 2014. [Google Scholar]
  31. Ren, Y.; Ferraz, F.M.; Yuan, Q. Landfill Leachate Treatment Using Aerobic Granular Sludge. J. Environ. Eng. 2017, 143, 04017060. [Google Scholar] [CrossRef]
  32. Czarnota, J.; Tomaszek, J.A.; Masłoń, A.; Piech, A.; Łagód, G. Powdered Ceramsite and Powdered Limestone Use in Aerobic Granular Sludge Technology. Materials 2020, 13, 3894. [Google Scholar] [CrossRef]
  33. Fan, J.; Ji, F.; Xu, X.; Wang, Y.; Yan, D.; Xu, X.; Chen, Q.; Xiong, J.; He, Q. Prediction of the effect of fine grit on the MLVSS/MLSS ratio of activated sludge. Bioresour. Technol. 2015, 190, 51–56. [Google Scholar] [CrossRef]
  34. Hamza, R.; Rabii, A.; zahra Ezzahraoui, F.; Morgan, G.; Iorhemen, O.T. A review of the state of development of aerobic granular sludge technology over the last 20 years: Full-scale applications and resource recovery. Case Stud. Chem. Environ. Eng. 2021, 5, 100173. [Google Scholar] [CrossRef]
  35. Law, Y.; Lant, P.; Yuan, Z. The effect of pH on N2O production under aerobic conditions in a partial nitritation system. Water Res. 2011, 45, 5934–5944. [Google Scholar] [CrossRef] [PubMed]
  36. Zhang, B.; Long, B.; Cheng, Y.; Wu, J.; Zhang, L.; Zeng, Y.; Zeng, M.; Huang, S. Rapid domestication of autotrophic nitrifying granular sludge and its stability during long-term operation. Environ. Technol. 2021, 42, 2587–2598. [Google Scholar] [CrossRef]
  37. Shi, X.Y.; Sheng, G.P.; Li, X.Y.; Yu, H.Q. Operation of a sequencing batch reactor for cultivating autotrophic nitrifying granules. Bioresour. Technol. 2010, 101, 2960–2964. [Google Scholar] [CrossRef]
  38. Tsuneda, S.; Nagano, T.; Hoshino, T.; Ejiri, Y.; Noda, N.; Hirata, A. Characterization of nitrifying granules produced in an aerobic upflow fluidized bed reactor. Water Res. 2003, 37, 4965–4973. [Google Scholar] [CrossRef] [PubMed]
  39. Figdore, B.A.; Stensel, H.D.; Winkler, M.K.H. Comparison of different aerobic granular sludge types for activated sludge nitrification bioaugmentation potential. Bioresour. Technol. 2018, 251, 189–196. [Google Scholar] [CrossRef] [PubMed]
  40. He, Q.; Chen, L.; Zhang, S.; Wang, L.; Liang, J.; Xia, W.; Wang, H.; Zhou, J. Simultaneous nitrification, denitrification and phosphorus removal in aerobic granular sequencing batch reactors with high aeration intensity: Impact of aeration time. Bioresour. Technol. 2018, 263, 214–222. [Google Scholar] [CrossRef]
  41. Klein, K.; Tenno, T. Estimating the impact of inhibitory substances on activated sludge denitrification process. Water Pract. Technol. 2019, 14, 863–871. [Google Scholar] [CrossRef]
  42. Luiz de Sousa Rollemberg, S.; Queiroz de Oliveira, L.; Nascimento de Barros, A.; Igor Milen Firmino, P.; Bezerra dos Santos, A. Pilot-scale aerobic granular sludge in the treatment of municipal wastewater: Optimizations in the start-up, methodology of sludge discharge, and evaluation of resource recovery. Bioresour. Technol. 2020, 311, 123467. [Google Scholar] [CrossRef] [PubMed]
  43. Zeng, R.J.; Lemaire, R.; Yuan, Z.; Keller, J. Simultaneous nitrification, denitrification, and phosphorus removal in a lab-scale sequencing batch reactor. Biotechnol. Bioeng. 2003, 84, 170–178. [Google Scholar] [CrossRef]
  44. Kuba, T.; Smolders, G.; van Loosdrecht, M.C.M.; Heijnen, J.J. Biological phosphorus removal from wastewater by anaerobic-anoxic sequencing batch reactor. Water Sci. Technol. 1993, 27, 241–252. [Google Scholar] [CrossRef]
  45. Pronk, M.; de Kreuk, M.K.; de Bruin, B.; Kamminga, P.; Kleerebezem, R.; van Loosdrecht, M.C.M. Full scale performance of the aerobic granular sludge process for sewage treatment. Water Res. 2015, 84, 207–217. [Google Scholar] [CrossRef] [PubMed]
  46. Gerardi, M.H. Alkalinity and pH. In The Microbiology of Anaerobic Digesters; John Wiley and Sons, Inc.: Hoboken, NJ, USA, 2003; pp. 99–103. [Google Scholar] [CrossRef]
  47. Sarvajith, M.; Nancharaiah, Y.V. Enhancing biological nitrogen and phosphorus removal performance in aerobic granular sludge sequencing batch reactors by activated carbon particles. J. Environ. Manag. 2022, 303, 114134. [Google Scholar] [CrossRef] [PubMed]
  48. Callado, N.H.; Foresti, E. Removal of organic carbon, nitrogen and phosphorus in sequential batch reactors integrating the aerobic/anaerobic processes. Water Sci. Technol. 2001, 44, 263–270. [Google Scholar] [CrossRef] [PubMed]
  49. Leu, S.-Y.; Stenstrom, M.K. Bioaugmentation to Improve Nitrification in Activated Sludge Treatment. Water Environ. Res. 2010, 82, 524–535. [Google Scholar] [CrossRef] [PubMed]
  50. Mossakowska, A.; Reinius, L.-G.; Hultman, B. Nitrification reactions in treatment of supernatant from dewatering of digested sludge. Water Environ. Res. 1997, 69, 1128–1133. [Google Scholar] [CrossRef]
  51. Monti, A.; Hall, E.R. Comparison of Nitrification Rates in Conventional and Membrane-Assisted Biological Nutrient Removal Processes. Water Environ. Res. 2008, 80, 497–506. [Google Scholar] [CrossRef] [PubMed]
  52. Soriano, G.A.; Erb, M.; Garel, C.; Audic, J.M. A Comparative Pilot-Scale Study of the Performance of Conventional Activated Sludge and Membrane Bioreactors under Limiting Operating Conditions. Water Environ. Res. 2003, 75, 225–231. [Google Scholar] [CrossRef]
  53. Choubert, J.M.; Racault, Y.; Grasmick, A.; Beck, C.; Heduit, A. Maximum nitrification rate in activated sludge processes at low temperature: Key parameters, optimal value. Eur. Water Manag. Online 2005, 1–13. [Google Scholar]
  54. Dytczak, M.A.; Londry, K.L.; Oleszkiewicz, J.A. Nitrifying Genera in Activated Sludge May Influence Nitrification Rates. Water Environ. Res. 2008, 80, 388–396. [Google Scholar] [CrossRef]
Figure 1. Schematic of AGS-SBR-1, AGS-SBR-2, and AGS-SBR-3: (A) feed pump, (B) air diffuser, (C) pH probe, (D) decant pump, (E) overflow, (F) NaHCO3/HCl pump, (G) air pump, (H) flow meter, (I-1) effluent sample port, (I-2-3) spare sample ports, and (I-4) sludge sample port.
Processes 10 01687 g001
Figure 2. Sludge Volume Index (SVI30) for (a) AGS-SBR-1, (b) AGS-SBR-2, and (c) AGS-SBR-3; MLSS concentration and MLVSS/MLSS ratio for (d) AGS-SBR-1, (e) AGS-SBR-2, and (f) AGS-SBR-3.
Processes 10 01687 g002
Figure 3. Images of sludge morphology in AGS-SBR-1 (a,e), AGS-SBR-2 (b,f), and AGS-SBR-3 (c,d,g,h).
Processes 10 01687 g003
Figure 4. Nitrification profile for (a) AGS-SBR-1, (b) AGS-SBR-2, and (c) AGS-SBR-3; (d) COD profile for AGS-SBR-3, and (e) Phosphorus (as PO43−) profile for AGS-SBR-3.
Processes 10 01687 g004
Figure 5. Nitrification profile and ammonia-nitrogen removal rate for (a,b) AGS-SBR-1, (c,d) AGS-SBR-2, and (eg) AGS-SBR; (f) COD profile, and (g) Reactive Phosphorus profile for AGS-SBR-3.
Processes 10 01687 g005
Table 1. Cycle time and sequential phases for the investigated AGS-SBRs.
AGS-SBR-1AGS-SBR-2AGS-SBR-3
Phase6-h4-h6-h4-h6-h4-h
Influent Filling (min)151515156060
Aeration (min)265–315160–195265–315190–195220–270145–150
Settling (min)10–6010–4510–6010–1510–6010–15
Effluent discharge (min)151515151515
Idle (min)555555
Table 2. Summary of operating conditions for aerobic granular sludge SBR systems.
ParameterUnitAGS-SBR-1AGS-SBR-2AGS-SBR-3
Operating Durationdays18372212
pH-7.8 ± 0.58 ± 0.57.8 ± 0.3
Temperature°C22–2522–2522–25
VER%505050
DOmg/L>2 (non-limiting)>2 (non-limiting)>2 (non-limiting)
Table 3. Summary of reactor operational parameters for AGS-SBR-1 & 2.
ReactorPeriodOperation DaysInfluent NH3-N
Concentration (mg/L)
HRT (h)
AGS-SBR-1IDays 1–61123 ± 512
IIDays 71–99180 ± 1712
IIIDays 106–120182 ± 98
IVDays 134–155255 ± 78
VDays 162–183292 ± 118
AGS-SBR-2IDays 1–1484 ± 212
IIDays 24–51187 ± 712
IIIDays 58–72192 ± 138
Table 4. Summary of reactor operational parameters for AGS-SBR-3.
PeriodOperational DaysInfluent NH3-N
Concentration (mg/L)
Supplemental COD
Concentration (g/L)
HRT (h)COD:N:P
AGS-SBR-3IDays 1–3877 ± 122.09 ± 0.1512105:4:1
Days 38–7288 ± 32.20 ± 0.078110:4:1
IIDays 79–9384 ± 21.52 ± 0.01876:4:1
IIIDays 100–11474 ± 110.95 ± 0.06847:4:0.4
IVDays 121–135149 ± 70.72 ± 0.05836:8:2
Days 149–156131 ± 00.54 ± 0.06827:7:1
VDays 163–212121 ± 51.39 ± 0.05870:6:2
Table 5. Characteristics of centrate and synthetic centrate used for AGS-SBR-1, 2 & 3.
AGS-SBR-1AGS-SBR-2AGS-SBR-3 §
ParameterAverage Concentration
(Per Litre)
ComponentPer LitreComponentPer Litre
NH3-N484.83 ± 46.96 mgNaHCO31.2 gCH3COONa2.56 g
NO2-N0.074 ± 0.05 mgNH4Cl0.35 gNH4Cl0.35 g
NO3-N0.91 ± 0.13 mgK2HPO40.05 gK2HPO40.03 g
TSS0.089 ± 0.01 mgKH2PO40.045 gKH2PO40.025 g
VSS0.075 ± 0.01 mgCaCl2·2H2O0.03 gCaCl2·2H2O0.03 g
tCOD674.90 ± 139.62 mgMgSO4·7H2O0.025 gMgSO4·7H2O0.025 g
sCOD547.68 ± 136.34 mgFeSO4·7H2O0.02 gFeSO4·7H2O0.02 g
CaCO31922.58 ± 263.84 mgMicronutrients *1 mLMicronutrients *1 mL
TN524.75 ± 29.29 mg
PO43−103.10 ± 11.27 mg
§ AGS-SBR-3 feed solution changed to centrate with CH3COONa as supplemental carbon source after day 79. * The micronutrient solution consisted of (in g/L): H3BO3, 0.05; ZnCl2, 0.05; CuCl2, 0.30; MnSO4·H2O, 0.05; (NH4)6Mo7O24·4H2O, 0.05; AlCl3, 0.05; CoCl2·6H2O, 0.05 and CoCl2·6H2O, 0.05.
Table 6. Summary of nitrification and specific nitrification rates reported in the literature.
Reactor TypeParameter References
Aerobic Granular Sludge Sequencing Batch Reactor (AGS-SBR)Maximum specific ammonia oxidizing rate = 29.8 mg N/g VSS/h[23]
Aerobic Granular Sludge Sequencing Batch Reactor (AGS-SBR)Maximum specific ammonia oxidizing rate
NIT granules = 31.25 mg N/g VSS/h
NDN-PAO granules = 5.83 mg N/g VSS/h
[39]
Activated Sludge Sequencing batch reactor (AS-SBR)Specific Nitrification rate = 30–45 g NH4-N/kg MLVSS/h[49,50]
CASSpecific nitrification rates in the membrane and conventional mixed liquor: between 3 and 5 mg N/g VSS/h[51]
CASSpecific nitrification rates: between 4 and 7 mg N/g VSS/h were measured in both membrane and conventional systems.[51,52]
Activated Sludge (AS) Maximum Nitrification rate = 1.0–4.5 mg N/g MLVSS/h[53]
SBRAmmonia utilization rate (AUR) = 2.95 +/− 0.26 mg NH4+-N/g VSS/h
Ammonia utilization rate (AUR) was faster = 6.16 +/− 0.34 mg NH4+-N/g VSS/h
[54]
AGS-SBRsNitrifying AGS-SBR with diluted centrate:
Nitrification rate = 45.30 mg N/L·h
Specific nitrification rate = 19.19 mg N/g VSS·h
Nitrifying AGS-SBR with synthetic centrate:
Nitrification rate = 40.36 mg N/L·h
Specific nitrification rate = 27.36 mg N/g VSS·h
Nitrifying/Denitrifying AGS-SBR: Nitrification rate = 54.48 NH3-N/L·h Specific nitrification rate = 6.86 mg NH3-N/g VSS·h.
SND efficiency during periods with negligible NOx-N accumulation was 87 ± 11%.
(This Study)
Publisher’s Note: MDPI stays neutral with regard to jurisdictional claims in published maps and institutional affiliations.

