Article

A Study Using Optimized LSSVR for Real-Time Fault Detection of Liquid Rocket Engine

School of Intelligent Systems Engineering, Sun Yat-Sen University, Guangzhou 510006, China
*
Author to whom correspondence should be addressed.
Processes 2022, 10(8), 1643; https://doi.org/10.3390/pr10081643
Submission received: 4 July 2022 / Revised: 13 August 2022 / Accepted: 16 August 2022 / Published: 18 August 2022
(This article belongs to the Special Issue Evolutionary Process for Engineering Optimization (II))

Abstract

:
Health monitoring and fault diagnosis of liquid rocket engine (LRE) are the most important concerning issue for the safety of rocket’s flying, especially for the man-carried aerospace engineering. Based on the sensor measurement signals of a certain type of hydrogen-oxygen rocket engine, this paper proposed a real-time fault detection approach using a genetic algorithm-based least squares support vector regression (GA-LSSVR) algorithm for the real-time fault detection of the rocket engine. In order to obtain effective training samples, the data is normalized in this paper. Then, the GA-LSSVR algorithm is derived through comprehensive considerations of the advantages of the Support Vector Regression (SVR) algorithm and Least Square Support Vector Regression (LSSVR). What is more, this paper provided the genetic algorithm to search for the optimal LSSVR parameters. In the end, the computational results of the suggested approach using the rocket practical experimental data are given out. Through the analysis of the results, the effectiveness and the detection accuracy of this presented real-time fault detection method using LSSVR GA-optimized is verified. The experiment results show that this method can effectively diagnose this hydrogen-oxygen rocket engine in real-time, and the method has engineering application value.

1. Introduction

Health monitoring and fault diagnosis of liquid rocket engine (LRE), which can effectively improve the reliability and safety of launch vehicle power system, and relevant technologies have important engineering application value [1]. Anomaly detection can find the defects of LRE in development in time, which provides support for designers to locate and analyze the faults. After the flight, researchers evaluated the state of LRE based on the anomaly detection results, and provided direction for engine optimization and improvement in order to improve the safety and reliability of the launch system [2,3]. At the same time, it is beneficial for researchers to improve the engine structure and performance, and further reduce the cost of rocket launch and operation. The history of fault detection on LRE can be traced back to Apollo Moon-landing Project in 1967. To reduce engine failures, the U.S. Naval Research Laboratory began to research health monitoring technology of LRE [4]. Since the 1970s, the United States has developed various LRE fault detection and diagnosis systems, which are widely used in the Space Shuttle Main Engine (SSME) [5,6]. This mainly includes Redline System, System for Anomaly and Failure Detection (SAFD) [7], Health Management System for Rocket Engine (HMSRE) [8], Integrated Vehicle Health Management System (IVHMS), Real-time Turbine Engine Diagnostic System (RTTEDS) [9], Real-time Vibration Monitoring System (RTVMS) [10], Post-test Diagnostic System (PTDS), Health Monitoring System (HMS) [11], Intelligent Integrated Vehicle Management System (IIVMS), etc. [12,13]. In the 21st century, Stennis Space Center, Ames Research Center, and Rocketdyne proposed Integrated System Health Management (ISHM) for the A-1 test bed and J-2X engine [14,15]. Moonis developed an Expert System for Fault Diagnosis [16]. Gupta designed a real-time fault diagnosis expert system named LEADER for SSME [17]. The fault detection approach based on an expert system is subject to expert knowledge and is more dependent on past experience, so it is difficult to find more faults. It is generally used for offline analysis of engine working status.
The structure of LRE is extremely complicated, with many uncertainties in the fault detection. On the other hand, some failures occur only once in a long period of time, and are unlikely to reappear. At the same time, the LRE fault samples are reduced, and those that can cover the sample model are also reduced. The research of fault detection is faced with the problem of fewer samples.
In 1995, Vapnik proposed Support Vector Machine (SVM) based on statistical learning theory, which is a machine learning approach specifically for finite sample processing that transforms the original problem into a quadratic global optimization problem with strong generalizability [18]. The fault detection using SVM has been widely studied in the field of fault diagnosis. Fault detection using the approach of neural network tend to fall into local optimal values, and SVM avoids this problem to a certain extent, so it has received certain attention and research. Aiswarya researched the SVM fault detection algorithm based on time domain and frequency domain features [19]. Tao proposed an adaptive fault detection algorithm based on wavelet transform and SVM for real-time fault detection of LRE turbopump [20]. Tao proposed a fault detection algorithm based on root mean square of protrusion frequency component and SVM for real-time fault detection of LRE turbopump [21]. Yuan applied SVM based on boundary samples to real-time fault detection of LRE turbopump [22]. Heng researched fault prediction of aircraft engine based on SVM [23]. Hu used One-Class Support Vector Machine (OCSVM) to analyze the historical vibration signals of turbopump, and proposed an approach that was used for detecting and diagnosing faults online, separating sensor faults from actual faults of the turbopump [24]. Zhu [25] and Zhang [26] established LRE fault prediction model based on SVM. Although the development of LRE fault detection using artificial intelligence has made a lot of research achievements so far, it is still mainly affected by the scale and quality of sensor data. The data samples of rocket engines, especially new engines, are few, and relevant fault characteristics cannot be fully grasped. In addition, the collection, classification, and processing of engine sensor data are not standardized and unified, which limits the training of fault detection model [27].
From the development of LRE health monitoring system, it was seen that the approach of rocket engine fault detection has shifted from single algorithm detection to multi-algorithm fusion detection [28], and from traditional sensor-based diagnosis to fault prediction based on intelligent approaches [29,30]. However, most of the relevant research is based on the classification for fault diagnosis of LRE. For a certain type of hydrogen-oxygen rocket engine, its fault type and fault characteristics have not been completely understood, and the fault detection approach based on classification may not be able to detect the fault correctly. Therefore, this research proposes a genetic algorithm-based least squares support vector regression (LSSVR) algorithm for real-time fault detection of hydrogen-oxygen rocket engine, which provides technical support for the engineering application of online fault detection of rocket engine.
The rest of the paper is organized as follows. Section 2 introduces LRE model, LRE fault composition, threshold setting and data preparation. Section 3 introduces SVR and LSSVR algorithms in detail. Section 4 describes the parameter selection of LSSVR. Section 5 is the simulation verification of the proposed method. Section 6 draws the conclusion.

2. Problem Background

2.1. Description of Liquid Rocket Engine

Figure 1 shows the main structures of a large liquid hydrogen-oxygen rocket engine. The LRE is mainly composed of gas generator, thrust chamber, hydrogen main valve, oxygen main valve, hydrogen turbopump, oxygen turbopump and feedlines. During the normal operation, a small amount of the propellant is fed into the gas generator and burnt into high-temperature and high-pressure gas, driving both the fuel and oxygen turbopump components to pressurize the propellant main feedlines. Most of the propellant enters the thrust chamber to burn and generate thrust. LRE components and subsystems are coupled to form a complex dynamic system.
LRE has three main working states during operation, namely starting stage, steady stage and shutdown stage, as shown in Figure 2.
  • Starting Stage: LRE receives the boot instruction and starts to work until various operating indicators of the system enter the main working condition. The starting process of LRE is a nonlinear time-varying random process. It is necessary to complete the opening and closing of valve and the sudden rise of turbine and pump speed in a very short time. Various physical parameters vary widely and at a large rate.
  • Steady Stage: At this stage, the relevant parameters of LRE are in a preset state, and the relevant measurement data are generally in a stable state. If the engine working condition is adjusted, the relevant sensor measurement data will fluctuate.
  • Shutdown Stage: LRE receives shutdown instructions, various valves are closed, and relevant propellant connections are disconnected until the engine thrust is reduced to zero, completing engine shutdown.

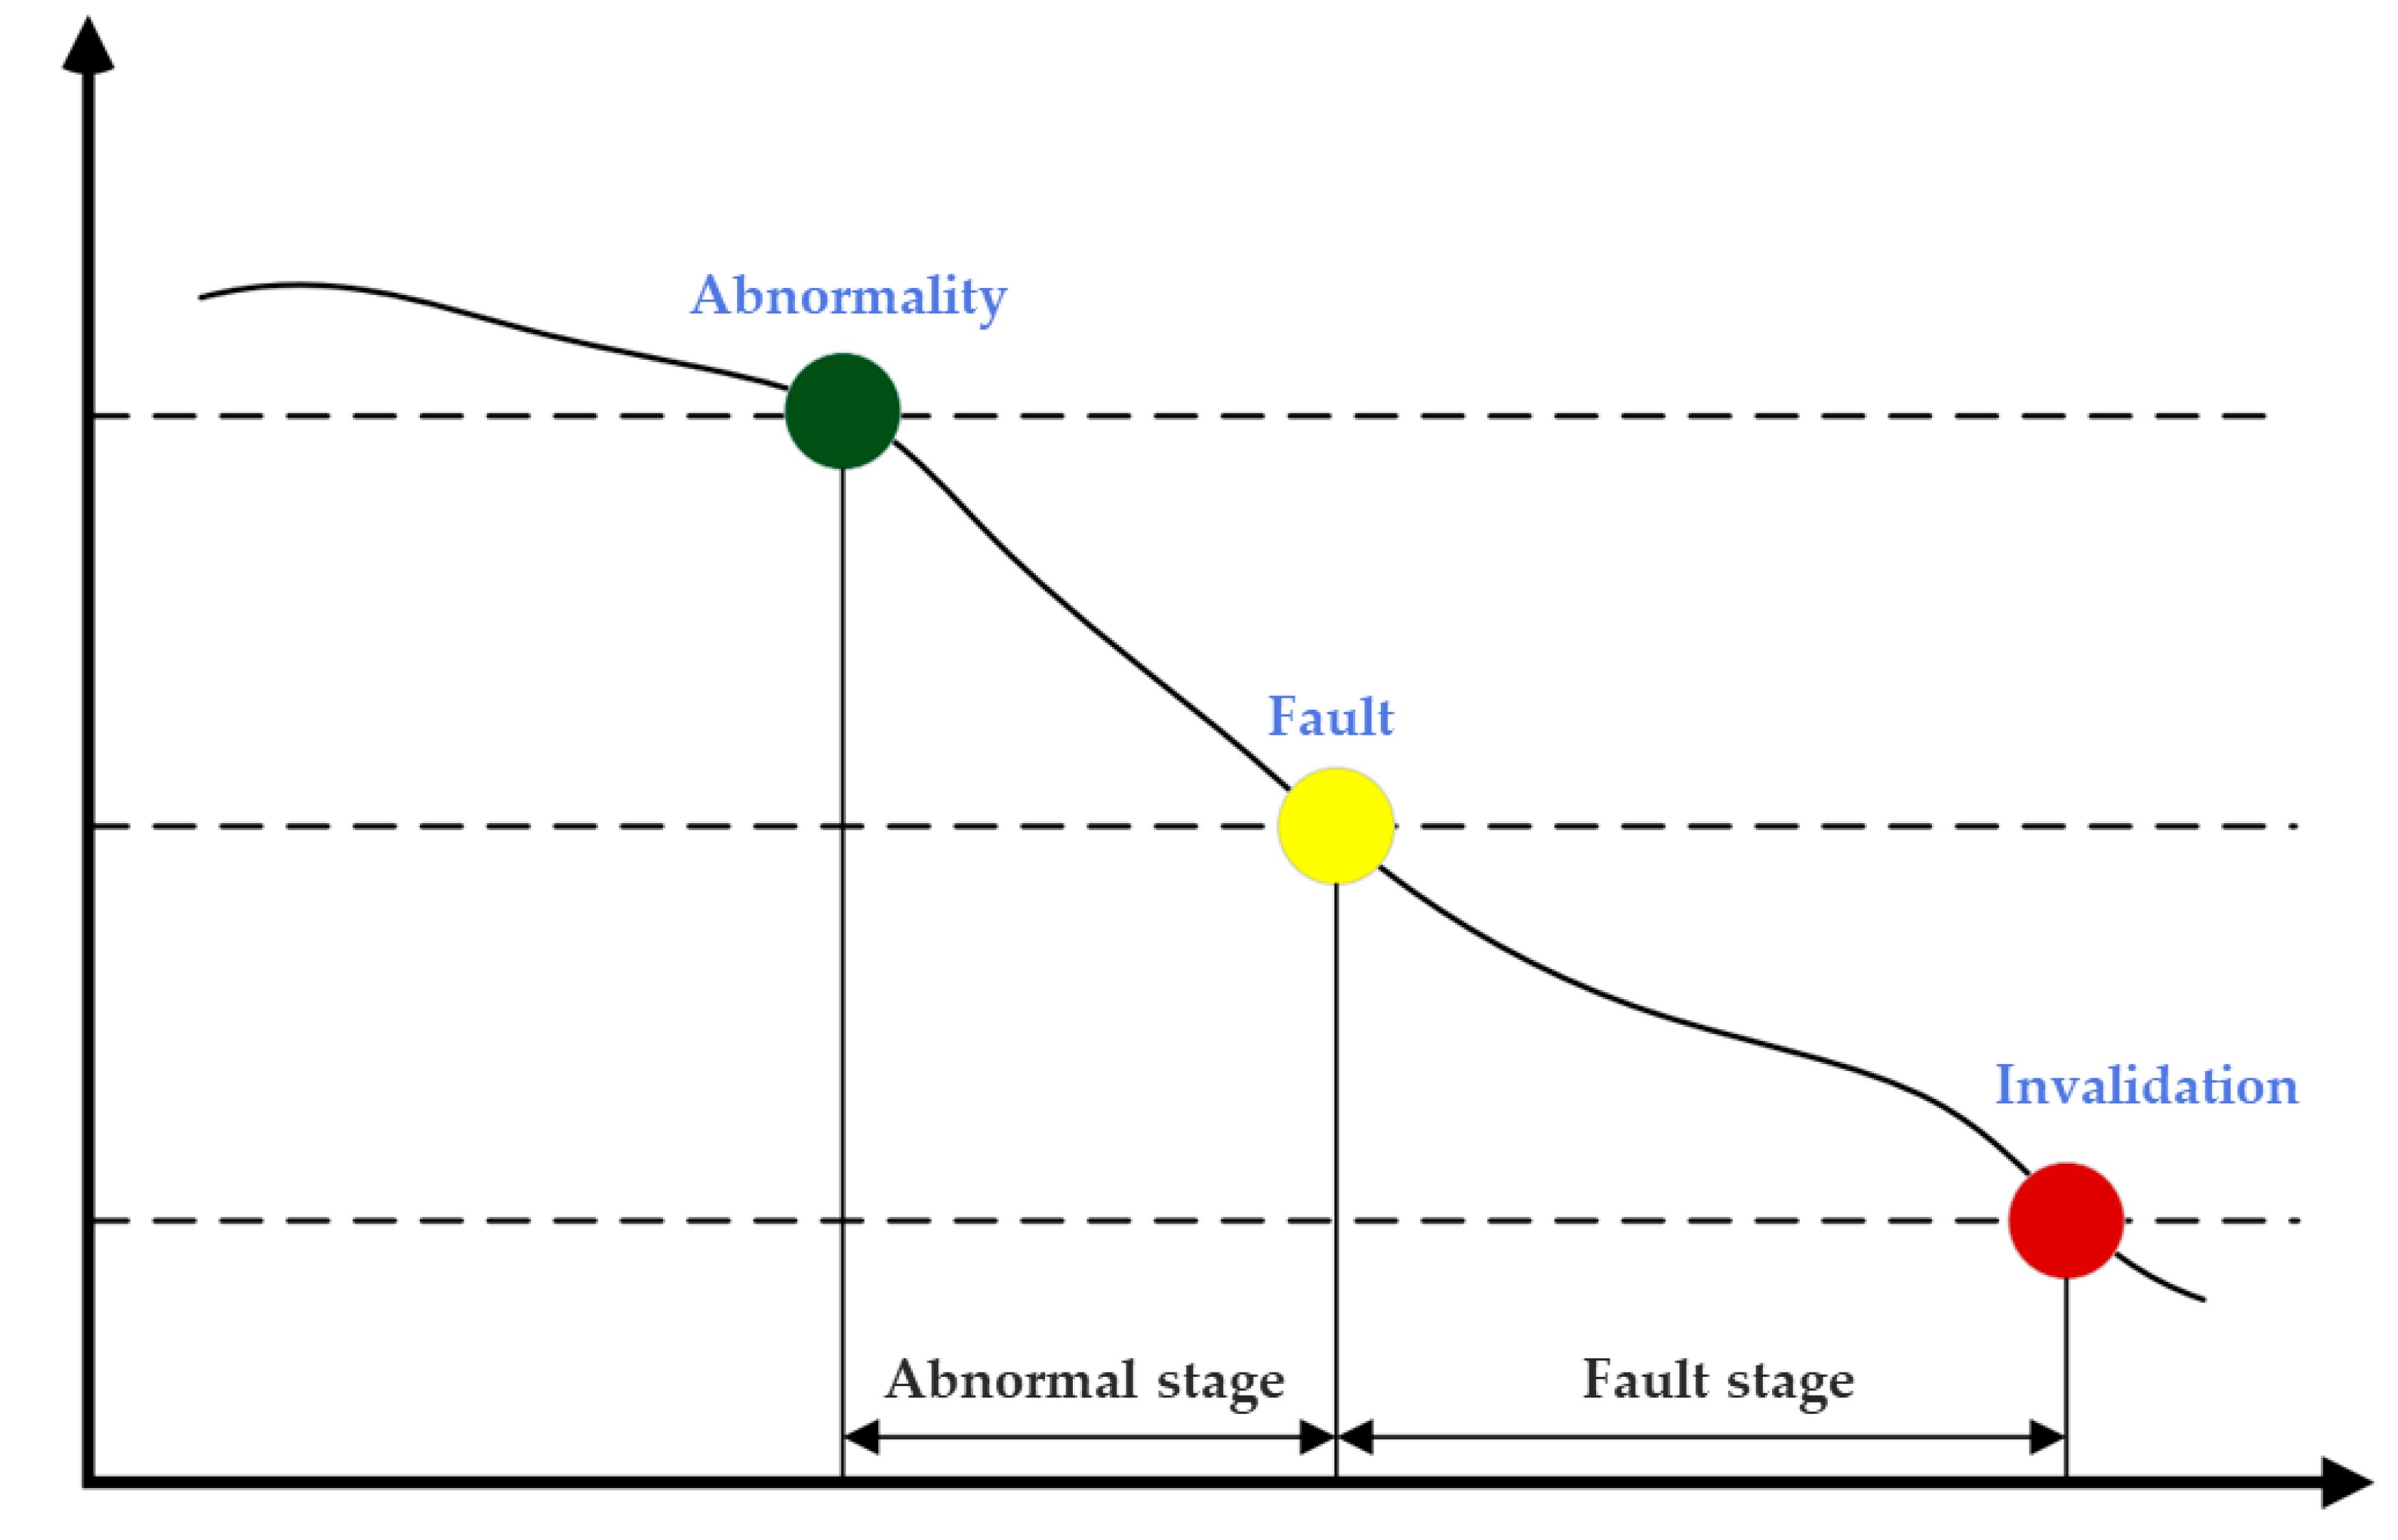
2.2. LRE Fault Process

For the fault development of LRE, there is generally a process in which the liquid rocket engine itself is affected by the fault and its working state changes from normal to fault, which is called the fault process and can generally be divided into two stages: abnormal occurrence and fault development. Abnormal occurrence is referring to the function index of the engine compared to the initial value is set or physical parameters appeared a certain deviation, the engine still can complete the task in this stage. Fault development is referring to the state of the engine failed but not invalidation, the function index of the engine or physical parameters appeared unacceptable deviation, the engine in this state cannot complete its work, as shown in Figure 3. The purpose of LRE fault detection in this paper is to detect the failure of the LRE system before the abnormal performance to failure, in order to carry out subsequent fault diagnosis, fault isolation and fault treatment.

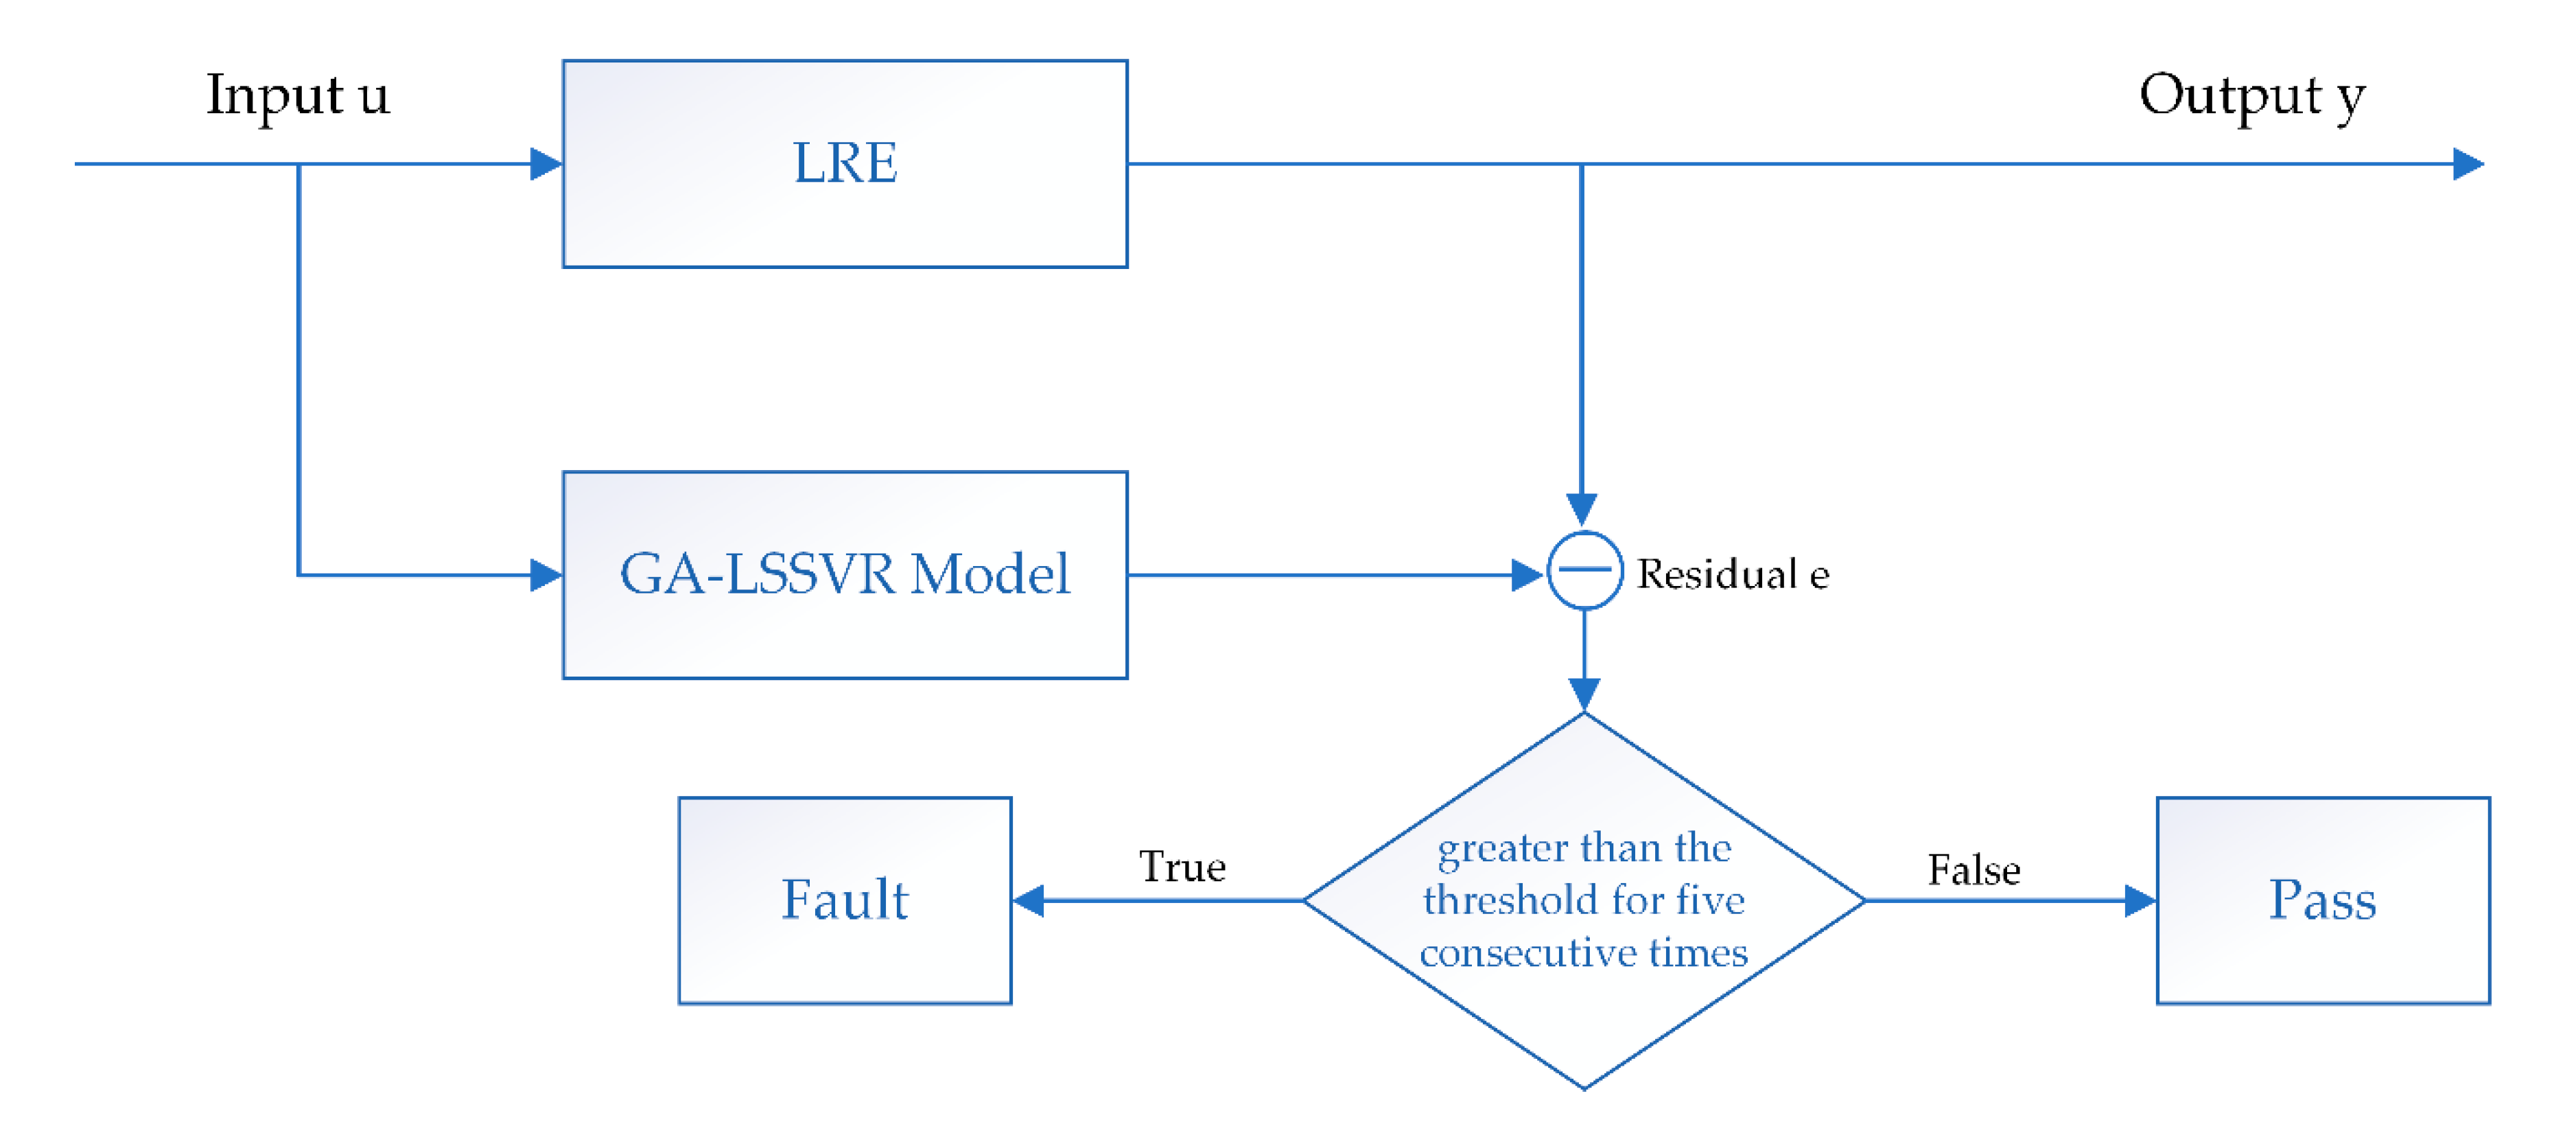
2.3. Fault Detection Logic

In this paper, the idea of regression is used to detect the fault of LRE. The corresponding regression problem can be expressed as: T = { ( x 1 , y 1 ) , ( x 2 , y 2 ) , , ( x m , y m ) } n × for training data, including training input is x i n ( i = 1 , 2 , , m ) , training output to y i ( i = 1 , 2 , , m ) , according to the decision function on the training set T looking for n . The decision function is then used to infer the output y i corresponding to any given input x i . The deduced y i was compared with the measured y ^ i , and the difference ( y i y ^ i ) was used as the basis for fault evaluation.
The basic idea of LRE intelligent fault detection method is as follows: Firstly, the sensor parameters to be used are separated from the measured engine data and preprocessed; Then, from the normal historical test data, an appropriate parameter prediction method is selected to establish a fault prediction model for the corresponding sensor parameters. Furthermore, based on the sensor parameters monitored by LRE and the detection algorithm model established, the output estimate of the current state of the system is obtained. Finally, the output of the fault detection method is compared with the actual output of the current system to get the residual value, and then the residual value is compared with the preset threshold value to get the judgment of the current LRE system working state.
The y is the fitting output of the selected key sensor parameter to predict, and y ^ is the actual measured output of the sensor parameters. And the residual vector e is defined as Equation (1):
e = y y ^
When the residual vector e exceeds the preset threshold δ, the fault detection system outputs a fault warning, indicating that the system determines the current engine state as failure. Figure 4 shows the related flowchart.
During the normal operation of the LRE, the sensor we need to pay attention to may have random disturbances that lead to data exceeding the set threshold, which often happens during the engine starting stage. In order to ensure the correctness of fault diagnosis, it is commonly used to consider engine failure when relevant data exceed the set threshold within five sampling periods.

2.4. Set the Threshold for Fault Detection

It is assumed that y ^ is the parameter that is measured by a sensor during the normal operation of the LRE. In sensor data measurement, y ^ is a random variable, and according to Chebyshev’s inequality as Equation (2):
P ( | y ^ μ | n σ ) 1 n 2
where μ is the mean value of sensor parameters at different moments under normal test conditions, σ is the standard deviation of sensor parameters at different moments under normal test conditions. For the parameter y ^ , the mathematical expectation is E ( y ^ ) = μ < , and the variance is D ( y ^ ) = σ 2 < .
According to Equation (2), the error probability α is a specified value, and the value range of parameter y ^   as shown in Equation (3).
[ μ n σ , μ + n σ ]
where n = 1 a , the fault prediction parameters that follow the normal distribution, the probability of their values is 99.74% at [ μ 3 σ , μ + 3 σ ] . Therefore, in the fault detection method of this paper, the value of n is 3.
Based on the above theoretical analysis and actual test data, the fault detection threshold interval in this paper is set as [ 0.35 , + 0.35 ] .

2.5. Data Preparation

The basis of fault detection for LRE is signal measurement from a sensor. When a rocket engine is working, its sensors measure a large number of different types of parameters about the engine, and the researchers analyze the engine’s working state based on the relevant sensor data. Generally, the data measured by sensors include information reflecting the working state of the engine, such as pressure, temperature, flow rate, etc., information reflecting engine working mechanism, such as frequency, spectrum, etc., and information that reflects the mechanical properties of an engine, such as stiffness, damping, etc. Note that vibration, pressure, temperature, flow rate, and other information are usually used for fault detection of LRE.
In this paper, based on the sensor measurement signals of a new type of hydrogen-oxygen rocket engine, a real-time fault detection approach suitable for the engine is designed, and the LRE fault detection approach is verified and analyzed. The article uses the fault monitoring parameters of the pump with hydrogen temperature (S1), oxygen pump after temperature (S2), the temperature of the gas generator (S3), generator hydrogen injection pressure (S4), oxygen generator before injection pressure (S5), hydrogen pump inlet pressure before (S6), hydrogen pump outlet pressure (S7), oxygen pump inlet pressure (S8), oxygen pump outlet pressure (S9), combustion chamber pressure (S10), and gas generator pressure (S11). The sensor monitoring parameters shown in Table 1, which the hydrogen-oxygen rocket engine uses for fault detection simulation analysis.
In order to obtain effective training samples, it is necessary to normalize the data, which collected in the steady state of LRE. Firstly, the sample parameters of LRE during normal test run are screened. After the outliers are removed, the maximum value x m a x and minimum value x m i n corresponding to each sensor are determined within the whole data range. The values collected by each sensor are scaled as Equation (4):
x i = x i x m i n x m a x x m i n
where x i is the input or output sensor parameters, x m i n is the minimum value of the sensor data for the entire normal test cycle, and x m a x is the maximum value of the sensor data for the entire normal test cycle.
The normalized parameters of S1, S2, S3, S4, S5, S6, S7, S8, S9, and S10 sensors are selected as the input parameters of the neural network, and the gas generator pressure (S11) is taken as the output parameters of the neural network. The input vector of the fault detection model is shown in Equation (5).
X = [ S 1 , S 2 , S 3 , S 4 , S 5 , S 6 , S 7 , S 8 , S 9 , S 10 ] T
The regression output is in Equation (6):
Y = [ S 11 ]

3. Introduction to SVR and LSSVR

3.1. Introduction to SVR

Support Vector Regression (SVR) refers to the SVM used to solve Regression problems [31]. SVR uses the training set for SVM training. After the regression model is obtained, the model is used for regression prediction of the newly added data.
In SVM, the function κ ( , ) is used to map the input space χ ( χ n ) where x is a Hilbert space, and function κ ( , ) is a kernel function defined as Equation (7):
Φ   : χ H x ϕ ( x )
From Equation (7), the following Equation (8) can be derived:
κ ( x , x ) = Φ ( x ) Φ ( x )
Therefore, the function κ ( x , x ) defined on χ × χ is called the kernel function, where (⋅) is the inner product of H .
A few commonly used kernels are as follows:
  • Linear Kernel Function
    κ ( x , x ) = ( x x )
  • Polynomial Kernel Function
    κ ( x , x ) = [ ( x x ) + C ] d ( C 0 )
  • Gaussian Kernel Function (RBF Kernel Function)
    κ ( x , x ) = exp ( || x x || 2 2 σ 2 ) = exp ( g || x x || 2 )
SVR can be described as:
For a given return to training set T = { ( x 1 , y 1 ) , ( x 2 , y 2 ) , , ( x l , y l ) } n × , including training input x i n ( i = 1 , 2 , , l ) , training output y i ( i = 1 , 2 , , l ) . The kernel function κ ( x , x ) , penalty factor c , and insensitive loss parameter ε were selected to construct and solve the optimization problem in Equation (12):
m i n 1 2 i = 1 l j = 1 l ( a i a i * ) ( a j a j * ) κ ( x i , x j ) + ε i = 1 l ( a i + a i * ) i = 1 l y i ( a i a i * ) s . t i = 1 l ( a i a i * ) = 0 , 0 a i , a i * c , i = 1 , 2 , , l
The optimal solution is a ( * ) = ( a 1 , a 1 * , , a l , a l * ) T , then select a positive component of a ( * ) , where 0 a j c and 0 a j * c , a i , a i * , a j and a j * are Lagrange multipliers, these are the parameters that need to be solved in the optimization problem, a is the parameter of the sample point constraint at the upper bound, and a * is the parameter of the sample point constraint at the lower bound and calculate the bias accordingly as in Equation (13):
b * = y i i = 1 l ( a i a i * ) κ ( x i , x k ) + ε   o r     b * = y i i = 1 l ( a i a i * ) κ ( x i , x j ) ε
Construct the demarcated hyperplane [ w * Φ ( x ) ] + b * = 0 , and obtain the regression decision function as in Equation (14):
f ( x ) = i = 1 l ( a i a i * ) κ ( x i , x ) + b *
The above algorithm is also called ε-support vector regression algorithm (referred to as ε-SVR).

3.2. Introduction to LSSVR

For a given training data set { ( x i , d i ) } i = 1 N , where x i n is the input of the system and d i R is the output of the system, by changing inequality constraints into equality constraints, Suykens et al. proposed the mathematical model of Least Square Support Vector Regression (LSSVR) as Equation (15):
m i n w , e J ( w , e ) = 1 2 w T w + c 2 i = 1 N e i 2 s . t .   d i = w T φ ( x i ) + b + e i , i = 1 , , N
where c + is the penalty factor, error variables e i ϵ R and e = [ e 1 , , e N ] T , φ ( ) is a nonlinear map. The constrained optimization is transformed into unconstrained optimization by constructing Lagrange function as Equation (16):
L ( w , b , e ; α ) = J ( w , e ) i = 1 N α i [ w T φ ( x i ) + b + e i d i ]
where α = [ α 1 , , α N ] T is Lagrange multiplier. It is known from the Karush–Kuhn–Tucker condition that the following Equation (17) can be derived:
{ L w = 0 w = i = 1 N α i φ ( x i ) L b = 0 i = 1 N α i = 0 L e i = 0 α i = c e i L α i = 0 w T φ ( x i ) + b + e i d i = 0
Substituting w and e i into Equation (17), the following linear equations can be obtained as Equation (18):
[ Ω Ι Ι T 0 ] [ α b ] = [ d 0 ]
where d = [ d 1 , , d N ] T , I = [ 1 , , 1 ] T , Ω i j = κ ( x i , x j ) + δ i j c , δ i j = { 1 i = j 0 i j , κ ( x i , x j ) is a kernel function. The regression model, as shown in Equation (19), can be obtained by solving Equation (18):
y = f ( x ) = w T x + b = i = 1 N α i κ ( x i , x j ) + b

4. Determine Parameters of LSSVR

In the existing research, the vast majority of SVR algorithm adopt RBF as kernel function. Some relevant research show that different types of kernel functions have little impact on SVR performance, but parameters of kernel function have a great impact on SVR performance.
For SVR, the main parameters to be determined are penalty factor c , RBF kernel parameter g , and insensitive loss factor ε . Where c affects the generalization ability of training, g affects the distribution of sample data after mapping to high-dimensional space, and ε determines the number of support vectors in the regression model, which affects the training accuracy and the convergence speed of the model. Common approaches to determine parameters include empirical approach, grid search approach, and optimization approach using intelligent algorithms. The empirical approach needs to set parameters according to the user’s experience and put forward higher requirements to the user. The grid search approach searches the parameters of SVR in a certain range, while the optimization approach based on intelligent algorithms considers parameter setting as the problem of seeking the optimal solution and obtains the optimal parameter setting value by solving this problem. This section mainly optimizes penalty factor c and RBF kernel parameter g . Firstly, the grid search approach was used to find the appropriate parameters, and then the genetic algorithm was used to search for the optimal LSSVR parameters.

4.1. Grid Search

The grid search approach is to adjust the parameters according to the set step size within the specified parameter range, and then use the parameters to train the model, and find the parameters that make the model perform best among these parameters. In this subsection, the search scope of c is set as [ 2 8 , 2 8 ] , and the search scope of g is set as [ 2 8 , 2 8 ] . The step size of iteration is 2 0.8 , and the CV process is folded by 3. LSSVR parameter selection results in this range are shown in Figure 5. It can be seen that under this condition, the optimal parameters of LSSVR searched by using the grid search approach are c = 0.32988 and g = 0.11842 .

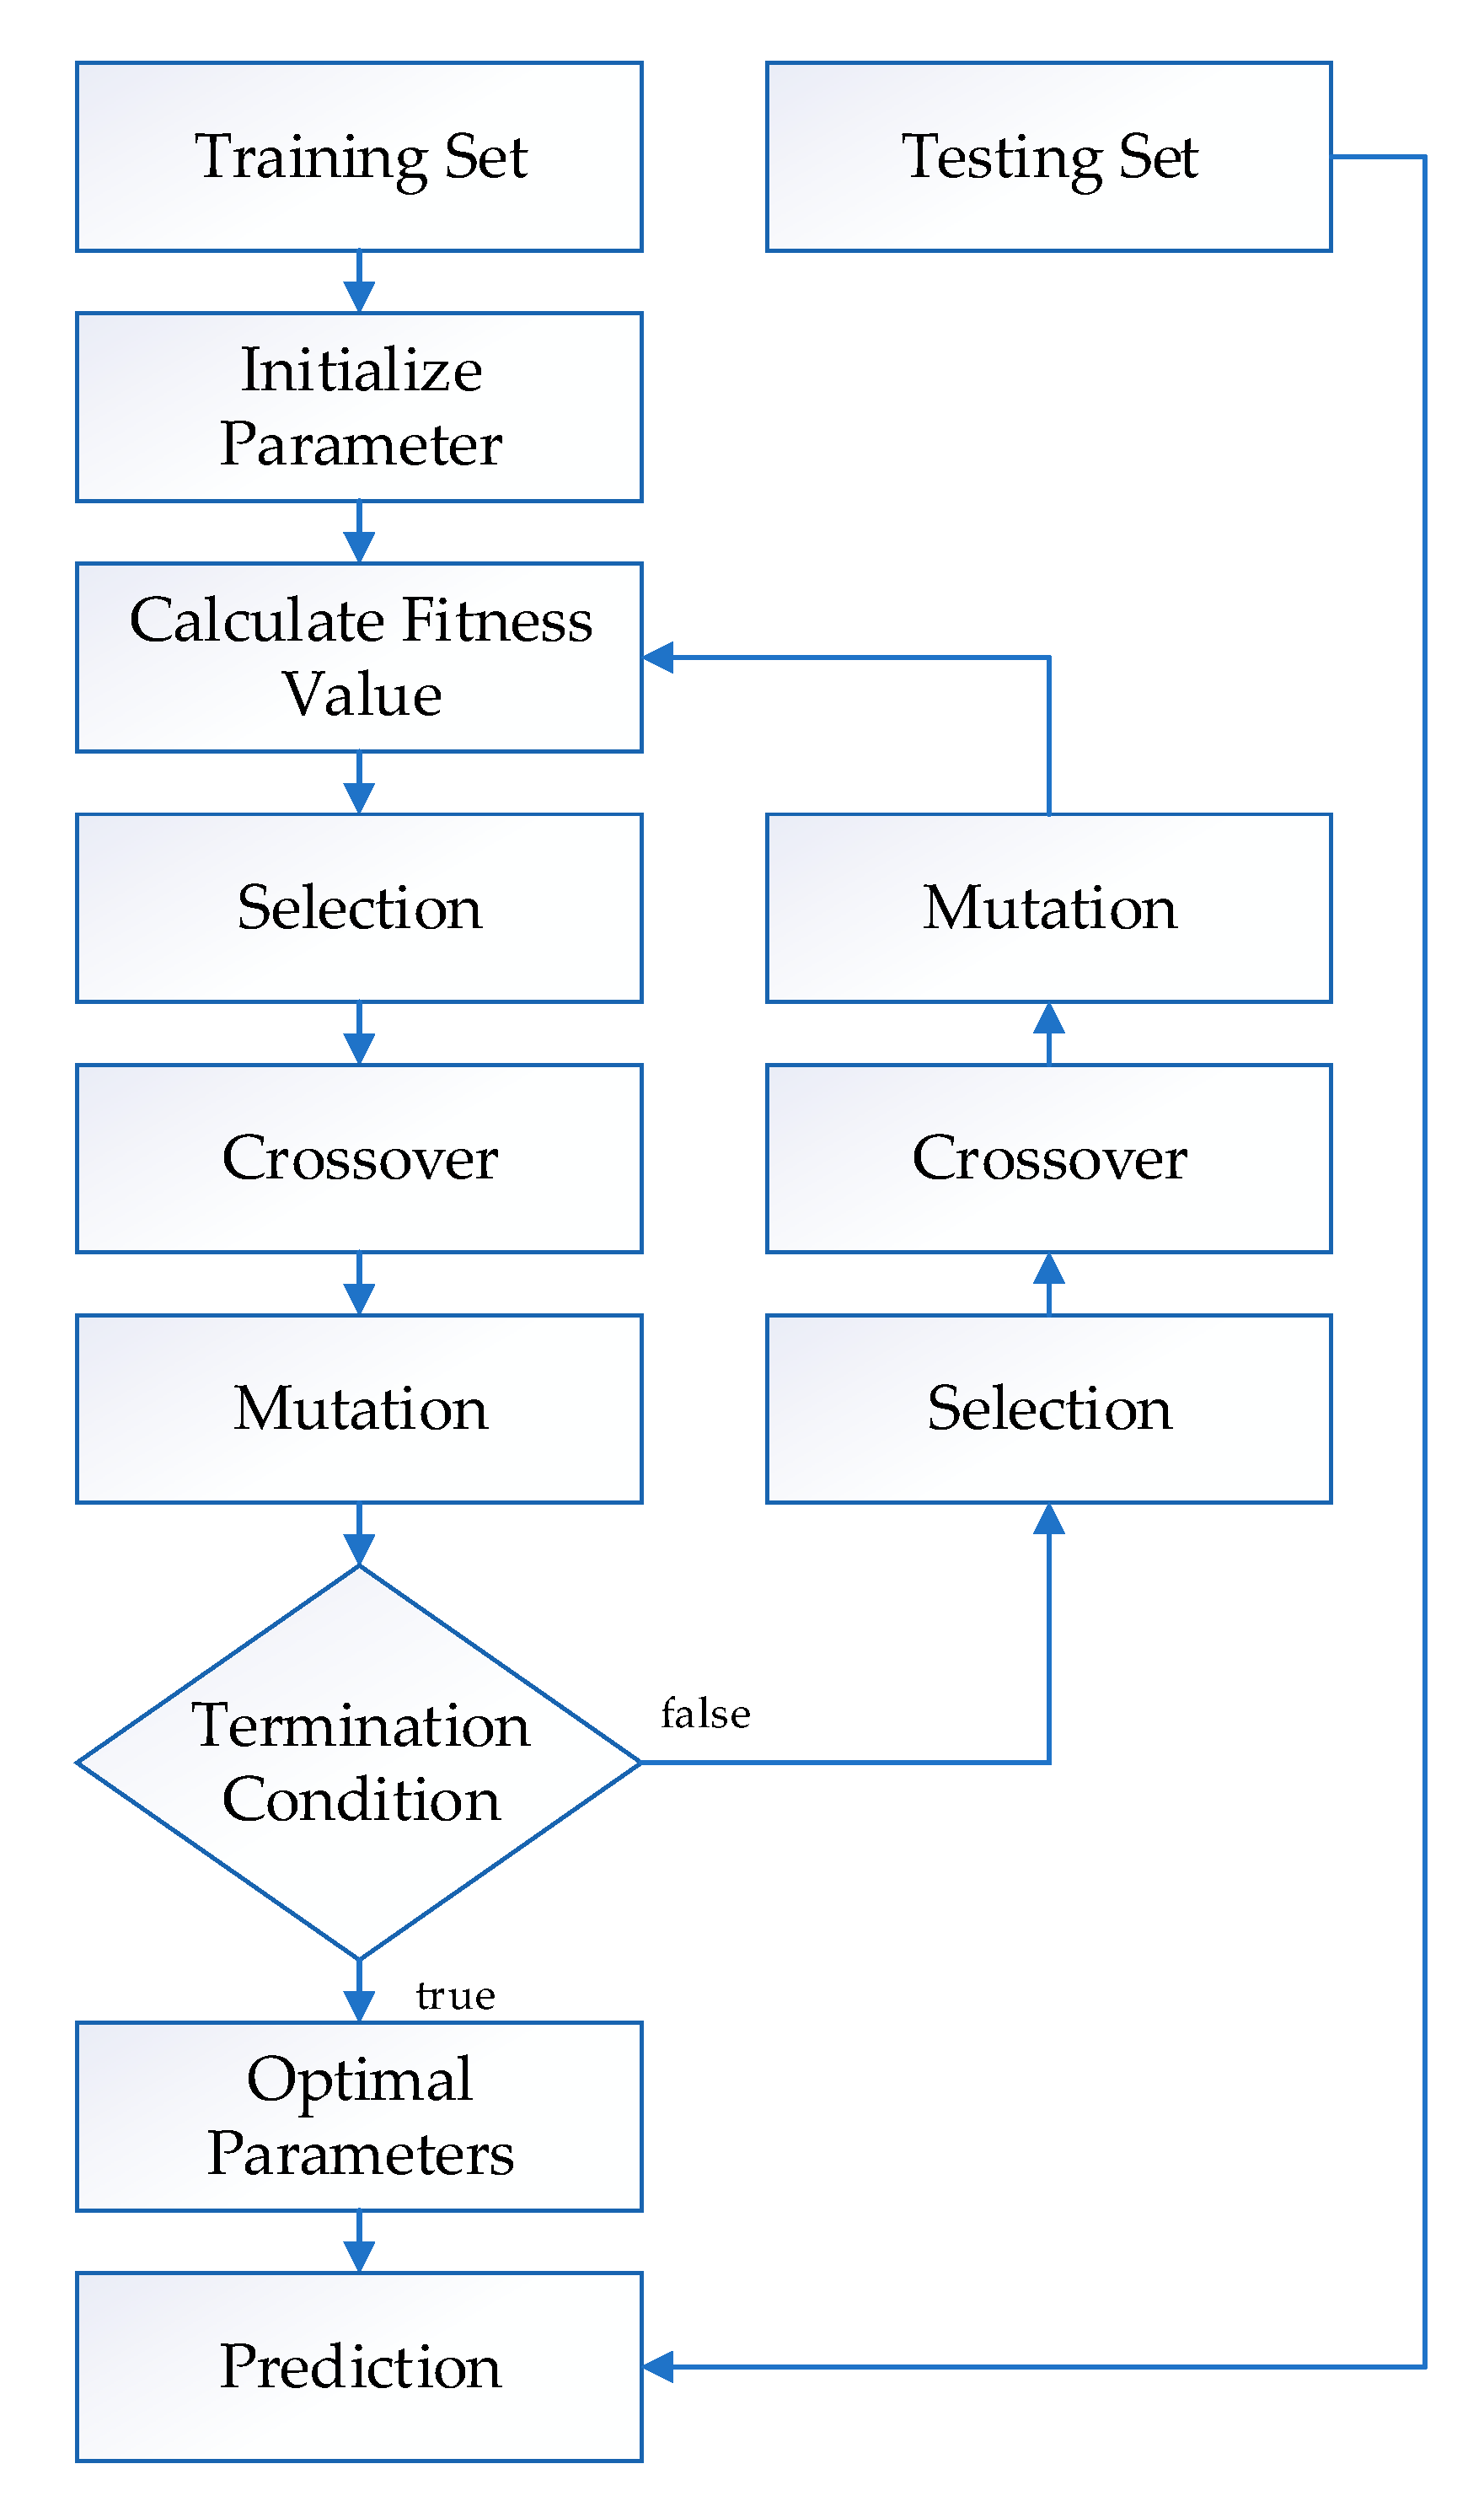
4.2. Optimization of LSSVR Using Genetic Algorithm

On the basis of Section 4.1, the optimal parameters of LSSVR were defined as c : [ 0.30 , 0.35 ] , g : [ 0 , 0.015 ] . In this range, genetic algorithm was used for parameter optimization in order to obtain more suitable LSSVR parameters. The flow chart of LSSVR optimization based on genetic algorithm is shown in Figure 6. The specific steps are as follows:
  • Step 1: The parameters that need to be optimized by LSSVR are binary coded to form chromosomes and initialize the population.
  • Step 2: The chromosome in the population was decoded to obtain the parameter value of LSSVR, which was used to train the LSSVR model, calculate the fitness value of each chromosome, and record the best fitness obtained in the contemporary population and the corresponding parameters.
  • Step 3: Selection, crossover, and mutation were carried out on the population.
  • Step 4: Decode the newly obtained population, calculate the fitness value, and judge whether the termination condition is met. If not, continue to perform Step 3.
  • Step 5: Output the optimal LSSVR parameters.
The parameters of genetic algorithm are set as follows: maximum evolution algebra is 200, population number is 20, crossover probability is 0.9, and mutation probability is 0.1. After optimization calculation, the optimal parameters of the current model are c = 0.34969 , g = 0.014954 . Figure 7 shows the evolution curve of LSSVR parameters optimized by genetic algorithm.

5. Computations and Analysis

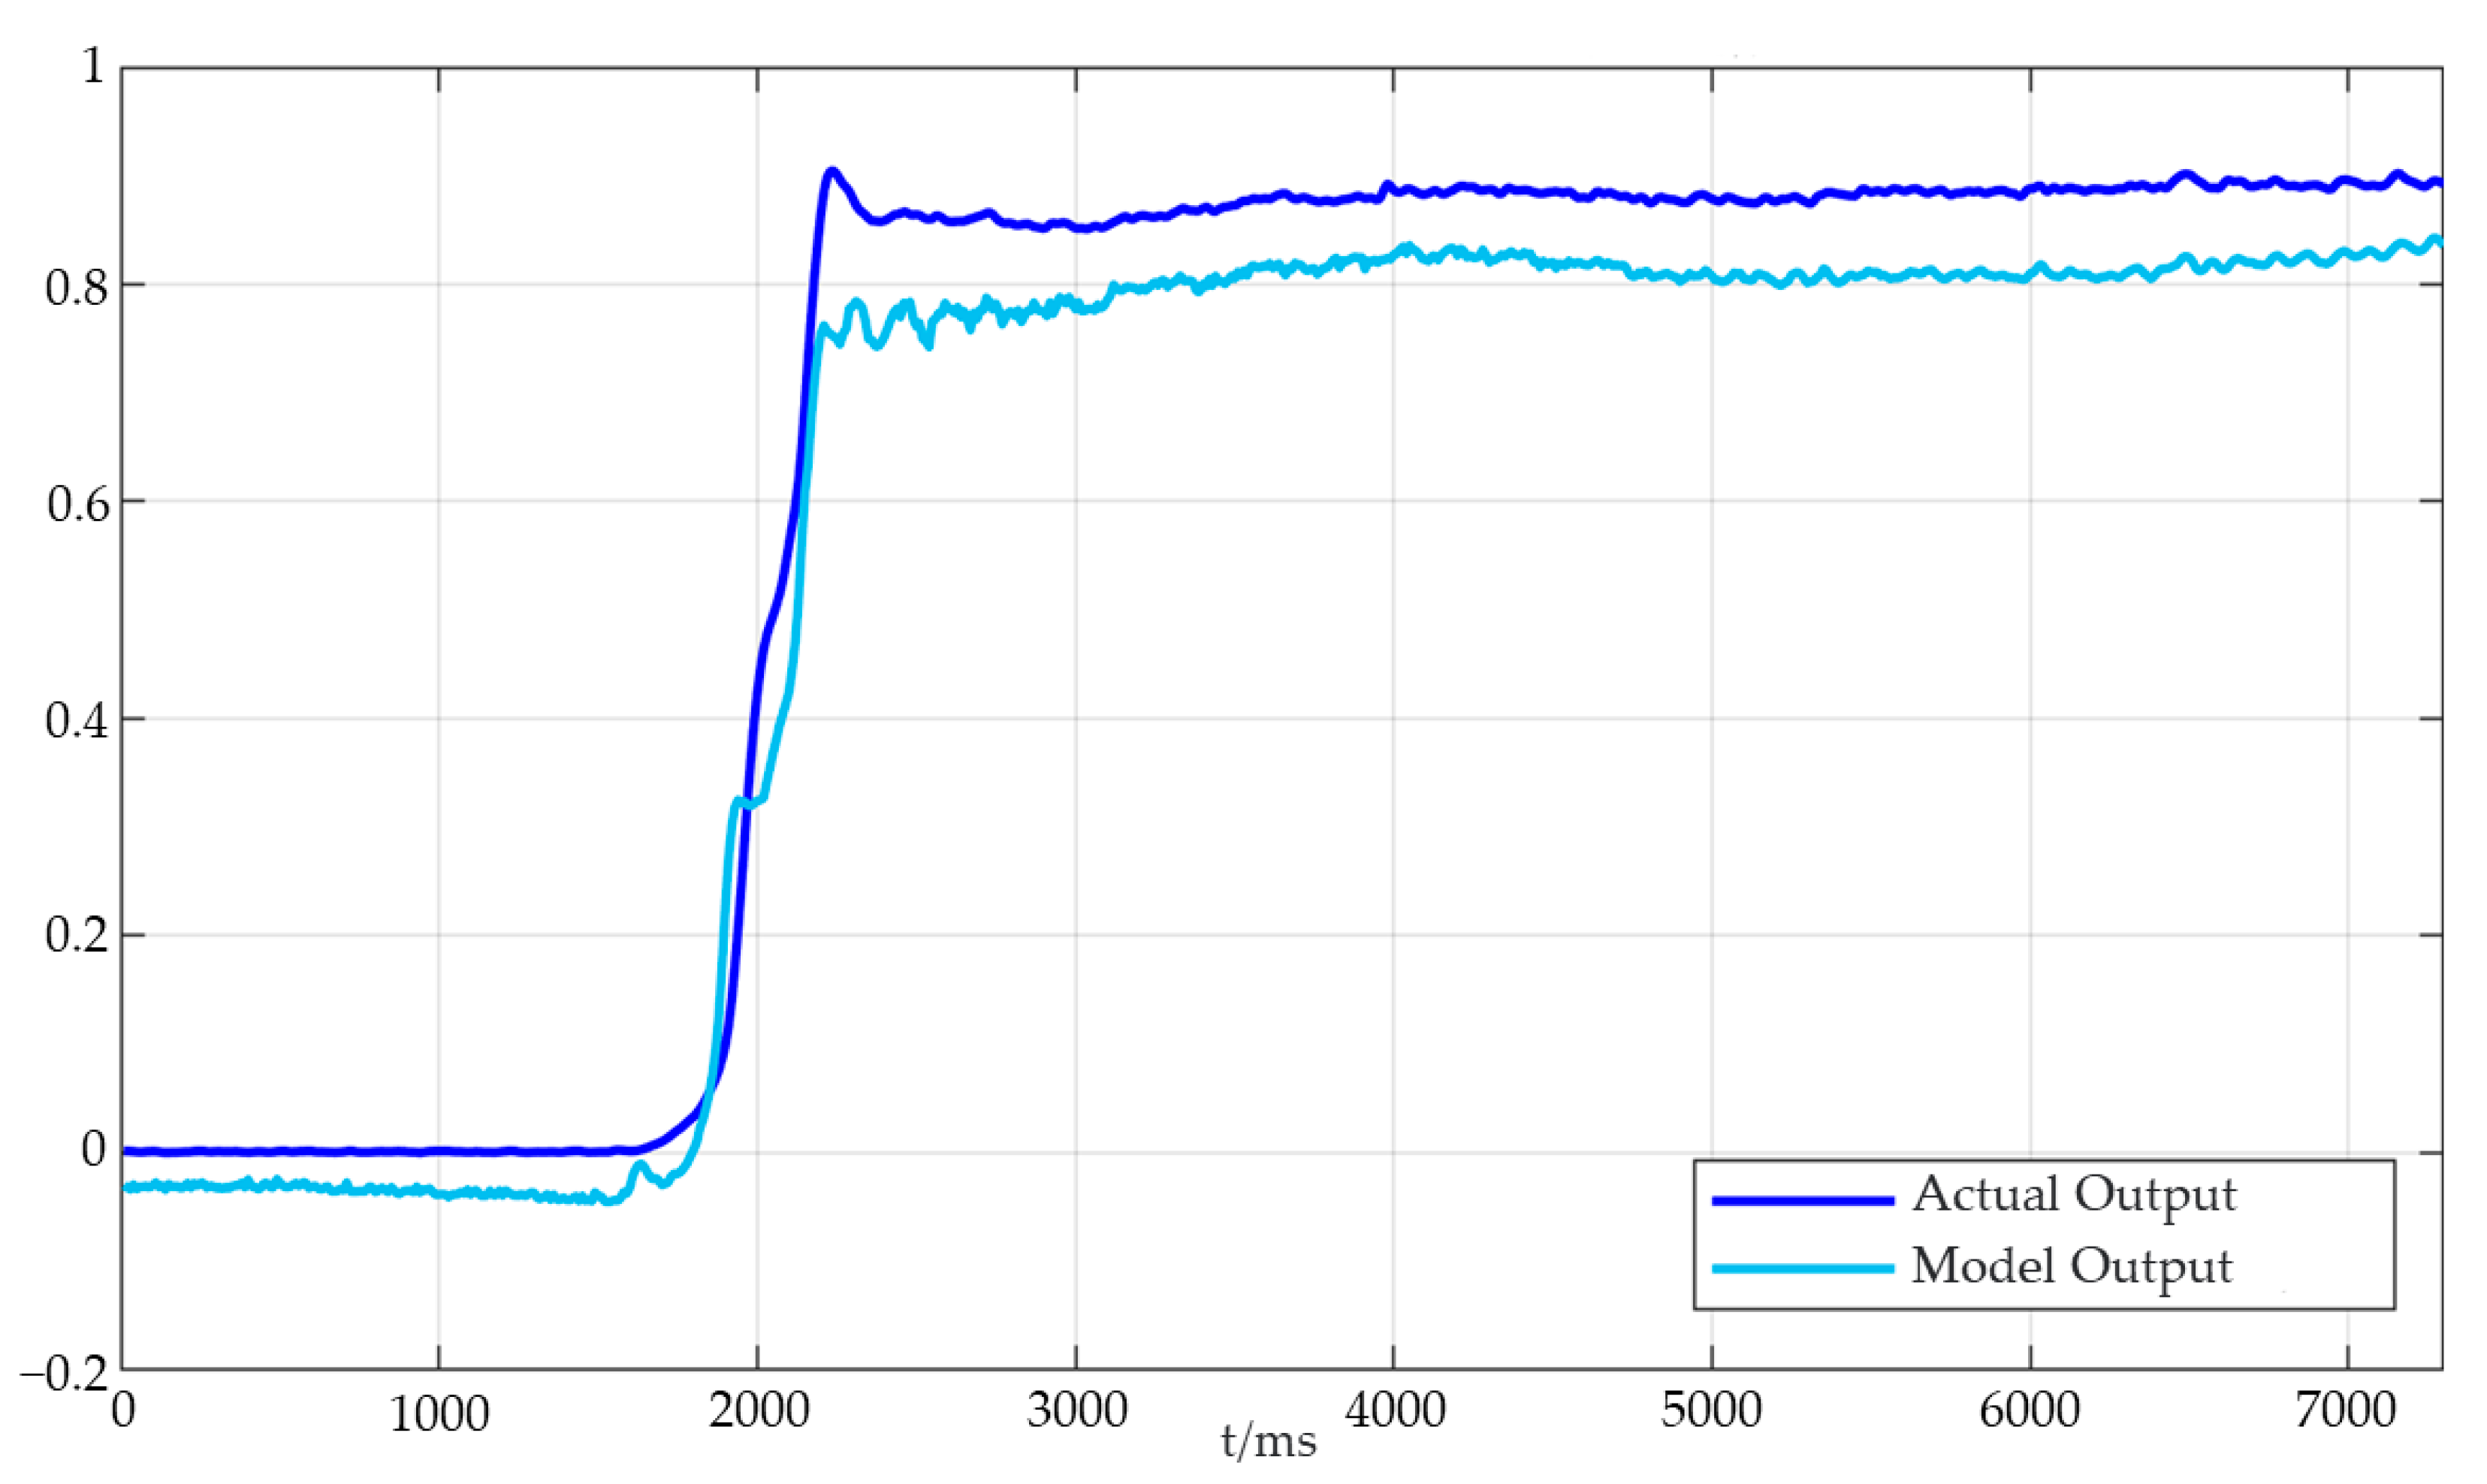
5.1. Real-Time Fault Detection

After the suitable parameters of LSSVR were obtained by genetic algorithm, a fault detection model of LRE was established based on a genetic algorithm to optimize LSSVR (GA-LSSVR). The principle for sensor information input will be an LRE real-time measure trained GA-LSSVR model based on historical test data, with the engine of a sensor forecasting the output. This will get the output of the actual output of the engine which, at the moment, is poor, residual value, and then the residual values and setting threshold comparison, to judge the current working state of the engine. Figure 8 shows the LRE fault detection process based on GA-LSSVR.

5.2. Validation of Fault Detection Effect

The computational environment for the validation simulation is MATLAB R2020b. The computer’s processor and memory used for the computations are, respectively, i7-10700 2.90 GHz and 64 GB. The test data of a certain type of hydrogen-oxygen rocket engine are analyzed by using the trained model. Figure 9 shows the fitting of the GA-LSSVR fault detection model to the data collected in a normal test cycle. It can be seen from Figure 9 that the GA-LSSVR fault detection model can fit the normal test state well.
Figure 10 is the residual diagram of the fitting of normal test data. It can be seen that there is a large fluctuation in the process from the starting stage to the stable stage. The maximum value appears at the data point 1920 and the corresponding value is −0.159816, but the corresponding data is far from reaching the fault warning. The residuals in the whole normal test are ±0.2. It can be seen that for a GA-LSSVR based fitting of normal engine test status, the threshold setting of 0.35 has a margin and is generally appropriate. The fitting output of GA-LSSVR for failure test data is shown in Figure 11. Figure 12 shows the corresponding residual output. As can be seen from Figure 12, under the current fault detection threshold of 0.35, the GA-LSSVR fault detection model can accurately identify the fault, and the data point of fault detection is 2281. At this time, the normalized output of model prediction is 0.943933, and the ratio between the actual output value of fault detection point and the predicted output of GA-LSSVR model is 0.6285. At data point 2707, the maximum residual error is −0.538746.
According to the experimental results, the GA-LSSVR fault detection model can effectively identify the normal working status of the liquid hydrogen-oxygen rocket engine, effectively detect the engine faults in real time, and timely give fault warning.

6. Conclusions

In this paper, LRE fault detection based on genetic algorithm optimized LSSVR is established for a certain type of hydrogen-oxygen rocket engine. To solve the problem of LSSVR’s difficulty in finding suitable parameters, the grid search method is used to search parameters first, and then the genetic algorithm is used to search for optimization. After obtaining the appropriate parameters, the LRE fault detection model was established based on genetic algorithm to optimize LSSVR, and the model was used for fault detection of a certain type of hydrogen-oxygen rocket engine. The simulation results show that the LRE fault detection based on genetic algorithm optimized LSSVR can better identify the working state of the hydrogen-oxygen rocket engine and accurately warn the fault state. The proposed approach has engineering application value. It is worth noting that the existing fault detection methods of rocket engine still have a lot of room for improvement due to various limitations. In the future research, fusion detection of multiple fault detection methods based on deep learning should be an important direction of its development.

Author Contributions

Conceptualization, H.Y., P.H. and T.W.; Methodology, H.Y. and P.H.; Software, H.Y.; Validation, H.Y. and P.H.; Formal analysis, H.Y. and P.H.; Investigation, H.Y., P.H. and T.W.; Resources, T.W.; Data curation, H.Y. and P.H.; Writing—original draft preparation, P.H.; Writing—review and editing, P.H. and T.W.; Visualization, H.Y. and P.H.; Supervision, T.W.; Project administration, T.W.; Funding acquisition, T.W. All authors have read and agreed to the published version of the manuscript.

Funding

This research received no funding.

Institutional Review Board Statement

Not applicable.

Informed Consent Statement

Not applicable.

Data Availability Statement

The data is not publicly available.

Conflicts of Interest

The authors declare no conflict of interest.

References

  1. Duyar, A.; Eldem, V. Fault detection and diagnosis in propulsion systems; a real time identification approach. In Proceedings of the IFAC/IMACS Symposium, Baden-Baden, Germany, 10–13 September 1991; Elesevier: Amsterdam, The Netherlands, 1992; pp. 473–478. [Google Scholar]
  2. Tao, H.; Minchao, H.; Xiaoping, H.; Qi, Z. Design Analysis of Fault Detection and Diagnosis Algorithms for Rocket Engine. J. Nanjing Univ. Aeronaut. Astronaut. 2019, 51, 50–55. [Google Scholar]
  3. Lv, H.; Chen, J.; Wang, J.; Yuan, J.; Liu, Z. A Supervised Framework for Recognition of Liquid Rocket Engine Health State Under Steady-State Process Without Fault Samples. IEEE Trans. Instrum. Meas. 2021, 70, 1–10. [Google Scholar] [CrossRef]
  4. Jianjun, W.; Yuqiang, C.; Xing, C. Research Status of the Health Monitoring Technology for Liquid Rocket Engines. Aerosp. Shanghai 2020, 37, 1–10. [Google Scholar]
  5. Tsutsumi, S.; Hirabayashi, M.; Sato, D.; Kawatsu, K.; Sato, M.; Kimura, T.; Hashimoto, T.; Abe, M. Data-driven fault detection in a reusable rocket engine using bivariate time-series analysis. Acta Astronaut. 2020, 179, 685–694. [Google Scholar] [CrossRef]
  6. Naderi, M.; Karimi, H.; Guozhu, L. Modeling the effect of reusability on the performance of an existing LPRE. Acta Astronaut. 2020, 181, 201–216. [Google Scholar] [CrossRef]
  7. Panossian, H.; Ewing, W. Real time failure detection algorithm for the Space Shuttle main engine. IEEE Control Syst. 1997, 17, 16–23. [Google Scholar] [CrossRef]
  8. Nemeth, E. Health Management for Rocket Engines System; National Technical Information Service: Washington, DC, USA; National Aeronautics and Space Administration: Springfield, VA, USA, 1990.
  9. Bickford, R.; Malloy, D. Development of a Real-Time Turbine Engine Diagnostic System. In Proceedings of the 38th AIAA/ASME/SAE/ASEE Joint Propulsion Conference & Exhibit, Indianapolis, IN, USA, 7–10 July 2002. [Google Scholar]
  10. Fiorucci, T.; II, D.L.; Reynolds, T. Advanced engine health management applications of the SSME Real-Time Vibration Moni-toring System. In Proceedings of the 36th AIAA/ASME/SAE/ASEE Joint Propulsion Conference and Exhibit, Las Vegas, NV, USA, 24–28 July 2000. [Google Scholar]
  11. Hawman, M. Health monitoring system for the SSME—Program overview. In Proceedings of the 26th Joint Propulsion Conference, Orlando, FL, USA, 16–18 July 1990. [Google Scholar]
  12. Feng, Y.; Liu, Z.; Chen, J.; Lv, H.; Wang, J.; Yuan, J. Make the Rocket Intelligent at IoT Edge: Stepwise GAN for Anomaly Detection of LRE With Multisource Fusion. IEEE Internet Things J. 2021, 9, 3135–3149. [Google Scholar] [CrossRef]
  13. Wu, J. Liquid-propellant rocket engines health-monitoring—A survey. Acta Astronaut. 2005, 56, 347–356. [Google Scholar] [CrossRef]
  14. Figueroa, F.; Schmalzel, J. Rocket Testing and Integrated System Health Management. In Condition Monitoring and Control for Intelligent Manufacturing; Wang, L., Gao, R.X., Eds.; Springer: London, UK, 2006; pp. 373–391. [Google Scholar]
  15. Zhong, Z.; Xu, L.; Xu, J. ISHM-Oriented Time Decision-Making for Condition-Based Maintenance of Multistate Systems. IEEE Trans. Aerosp. Electron. Syst. 2019, 56, 15–29. [Google Scholar] [CrossRef]
  16. Ali, M.; Gupta, U. An expert system for fault diagnosis in a Space Shuttle main engine. In Proceedings of the 26th Joint Propulsion Conference, Orlando, FL, USA, 16–18 July 1990. [Google Scholar]
  17. Gupta, U.K.; Ali, M. LEADER-an integrated engine behavior and design analyses based real-time fault diagnostic expert system for space shuttle main engine (SSME). In Proceedings of the 2nd International Conference on Industrial and Engineering Applications of Artificial Intelligence and Expert Systems, Tullahoma, TN, USA, 6–9 June 1989; ACM: New York, NY, USA, 1989; Volume 1, pp. 135–145. [Google Scholar]
  18. Vapnik, V.N. An overview of statistical learning theory. IEEE Trans. Neural Netw. 1999, 10, 988–999. [Google Scholar] [CrossRef]
  19. Aiswarya, N.; Priyadharsini, S.S.; Moni, K.S. An efficient approach for the diagnosis of faults in turbo pump of liquid rocket engine by employing FFT and time-domain features. Aust. J. Mech. Eng. 2016, 16, 1–10. [Google Scholar] [CrossRef]
  20. Hong, T.; Yang, S. Adaptive Algorithm Based on Wavelet and SVM for Turbopump Fault Detection. Appl. Mech. Mater. 2014, 644–650, 994–1002. [Google Scholar] [CrossRef]
  21. Hong, T.; Li, H. Turbopump fault detection algorithm based on protruding frequency components RMS and SVM. In Proceedings of the 2013 IEEE International Conference on Mechatronics and Automation, Takamatsu, Japan, 4–7 August 2013; Institute of Electrical and Electronics Engineers (IEEE): Piscataway, NJ, USA, 2013; pp. 1311–1316. [Google Scholar]
  22. Yuan, S.-F.; Chu, F.-L. Support vector machines-based fault diagnosis for turbo-pump rotor. Mech. Syst. Signal Process. 2006, 20, 939–952. [Google Scholar] [CrossRef]
  23. Heng, H.; Zhang, J.; Xin, C. Research on aircraft engine fault detection based on support vector machines. In Proceedings of the 2012 2nd International Conference on Consumer Electronics, Communications and Networks (CECNet), Yichang, China, 21–23 April 2012; Institute of Electrical and Electronics Engineers (IEEE): Piscataway, NJ, USA, 2012; pp. 496–499. [Google Scholar]
  24. Hu, L.; Hu, N.; Zhang, X.; Gu, F.; Gao, M. Novelty detection methods for online health monitoring and post data analysis of turbopumps. J. Mech. Sci. Technol. 2013, 27, 1933–1942. [Google Scholar] [CrossRef]
  25. Zhu, X.; Cheng, Y.; Wu, J.; Hu, R.; Cui, X. Steady-State Process Fault Detection for Liquid Rocket Engines Based on Convolu-tional Auto-Encoder and One-Class Support Vector Machine. IEEE Access 2020, 8, 3144–3158. [Google Scholar] [CrossRef]
  26. Strauss, A.M. Failure Characteristics Analysis and Fault Diagnosis for Liquid Rocket Engines; American Library Association dba CHOICE: Middletown, NJ, USA, 2016; Volume 54, p. 556. [Google Scholar]
  27. Feng, Y.; Liu, Z.; Chen, J.; Lv, H.; Wang, J.; Zhang, X. Unsupervised Multimodal Anomaly Detection with Missing Sources for Liquid Rocket Engine. IEEE Trans. Neural Networks Learn. Syst. 2022, 1–15. [Google Scholar] [CrossRef]
  28. Nie, Y.; Cheng, Y.; Wu, J. Liquid-propellant rocket engine online health condition monitoring base on multi-algorithm parallel integrated decision-making. Proc. Inst. Mech. Eng. Part G J. Aerosp. Eng. 2016, 231, 1621–1633. [Google Scholar] [CrossRef]
  29. Yu, H.; Wang, T. A Method for Real-Time Fault Detection of Liquid Rocket Engine Based on Adaptive Genetic Algorithm Optimizing Back Propagation Neural Network. Sensors 2021, 21, 5026. [Google Scholar] [CrossRef]
  30. Yu, H.; Wang, T.; Tang, Y. A Method Using Quantum Genetic Algorithm optimized BP Neural Network of Real-time Fault Detection for the Liquid Rocket Engine. In Proceedings of the 2021 Global Reliability and Prognostics and Health Management (PHM-Nanjing), Nanjing, China, 15–17 October 2021; Institute of Electrical and Electronics Engineers (IEEE): Piscataway, NJ, USA; pp. 1–6. [Google Scholar]
  31. Al-Zoubi, N.; Kachrimanis, K.; Younis, K.; Malamataris, S. Optimization of extended-release hydrophilic matrix tablets by support vector regression. Drug Dev. Ind. Pharm. 2010, 37, 80–87. [Google Scholar] [CrossRef]
Figure 1. Main structures of the LRE.
Processes 10 01643 g001
Figure 2. LRE operating status.
Processes 10 01643 g002
Figure 3. The development process of liquid rocket engine failure.
Processes 10 01643 g003
Figure 4. LRE fault detection flow chart.
Processes 10 01643 g004
Figure 5. LSSVR parameter selection result.
Processes 10 01643 g005
Figure 6. GA-LSSVR flow chart.
Processes 10 01643 g006
Figure 7. The evolution curve of LSSVR parameters optimized by genetic algorithm.
Processes 10 01643 g007
Figure 8. LRE fault detection process based on GA-LSSVR.
Processes 10 01643 g008
Figure 9. GA-LSSVR fault detection: normal test data.
Processes 10 01643 g009
Figure 10. GA-LSSVR fault detection residual: normal test data.
Processes 10 01643 g010
Figure 11. GA-LSSVR fault detection: fault test data.
Processes 10 01643 g011
Figure 12. GA-LSSVR fault detection residual: fault test data.
Processes 10 01643 g012
Table 1. Sensor monitoring parameters.
Sensor NumberParameters (Unit)
S1Post hydrogen pump temperature (K)
S2Post oxygen pump temperature (K)
S3Gas generator temperature (K)
S4Generator pressure before hydrogen injection (MPa)
S5Pressure before oxygen injection of generator (MPa)
S6Inlet pressure of hydrogen pump (MPa)
S7Oxygen pump outlet pressure (MPa)
S8Oxygen pump inlet pressure (MPa)
S9Outlet pressure of hydrogen pump (MPa)
S10Combustion chamber pressure (MPa)
S11Gas generator pressure (MPa)
Publisher’s Note: MDPI stays neutral with regard to jurisdictional claims in published maps and institutional affiliations.

