
Inline Weld Depth Evaluation and Control Based on OCT Keyhole Depth Measurement and Fuzzy Control

 , and
, and 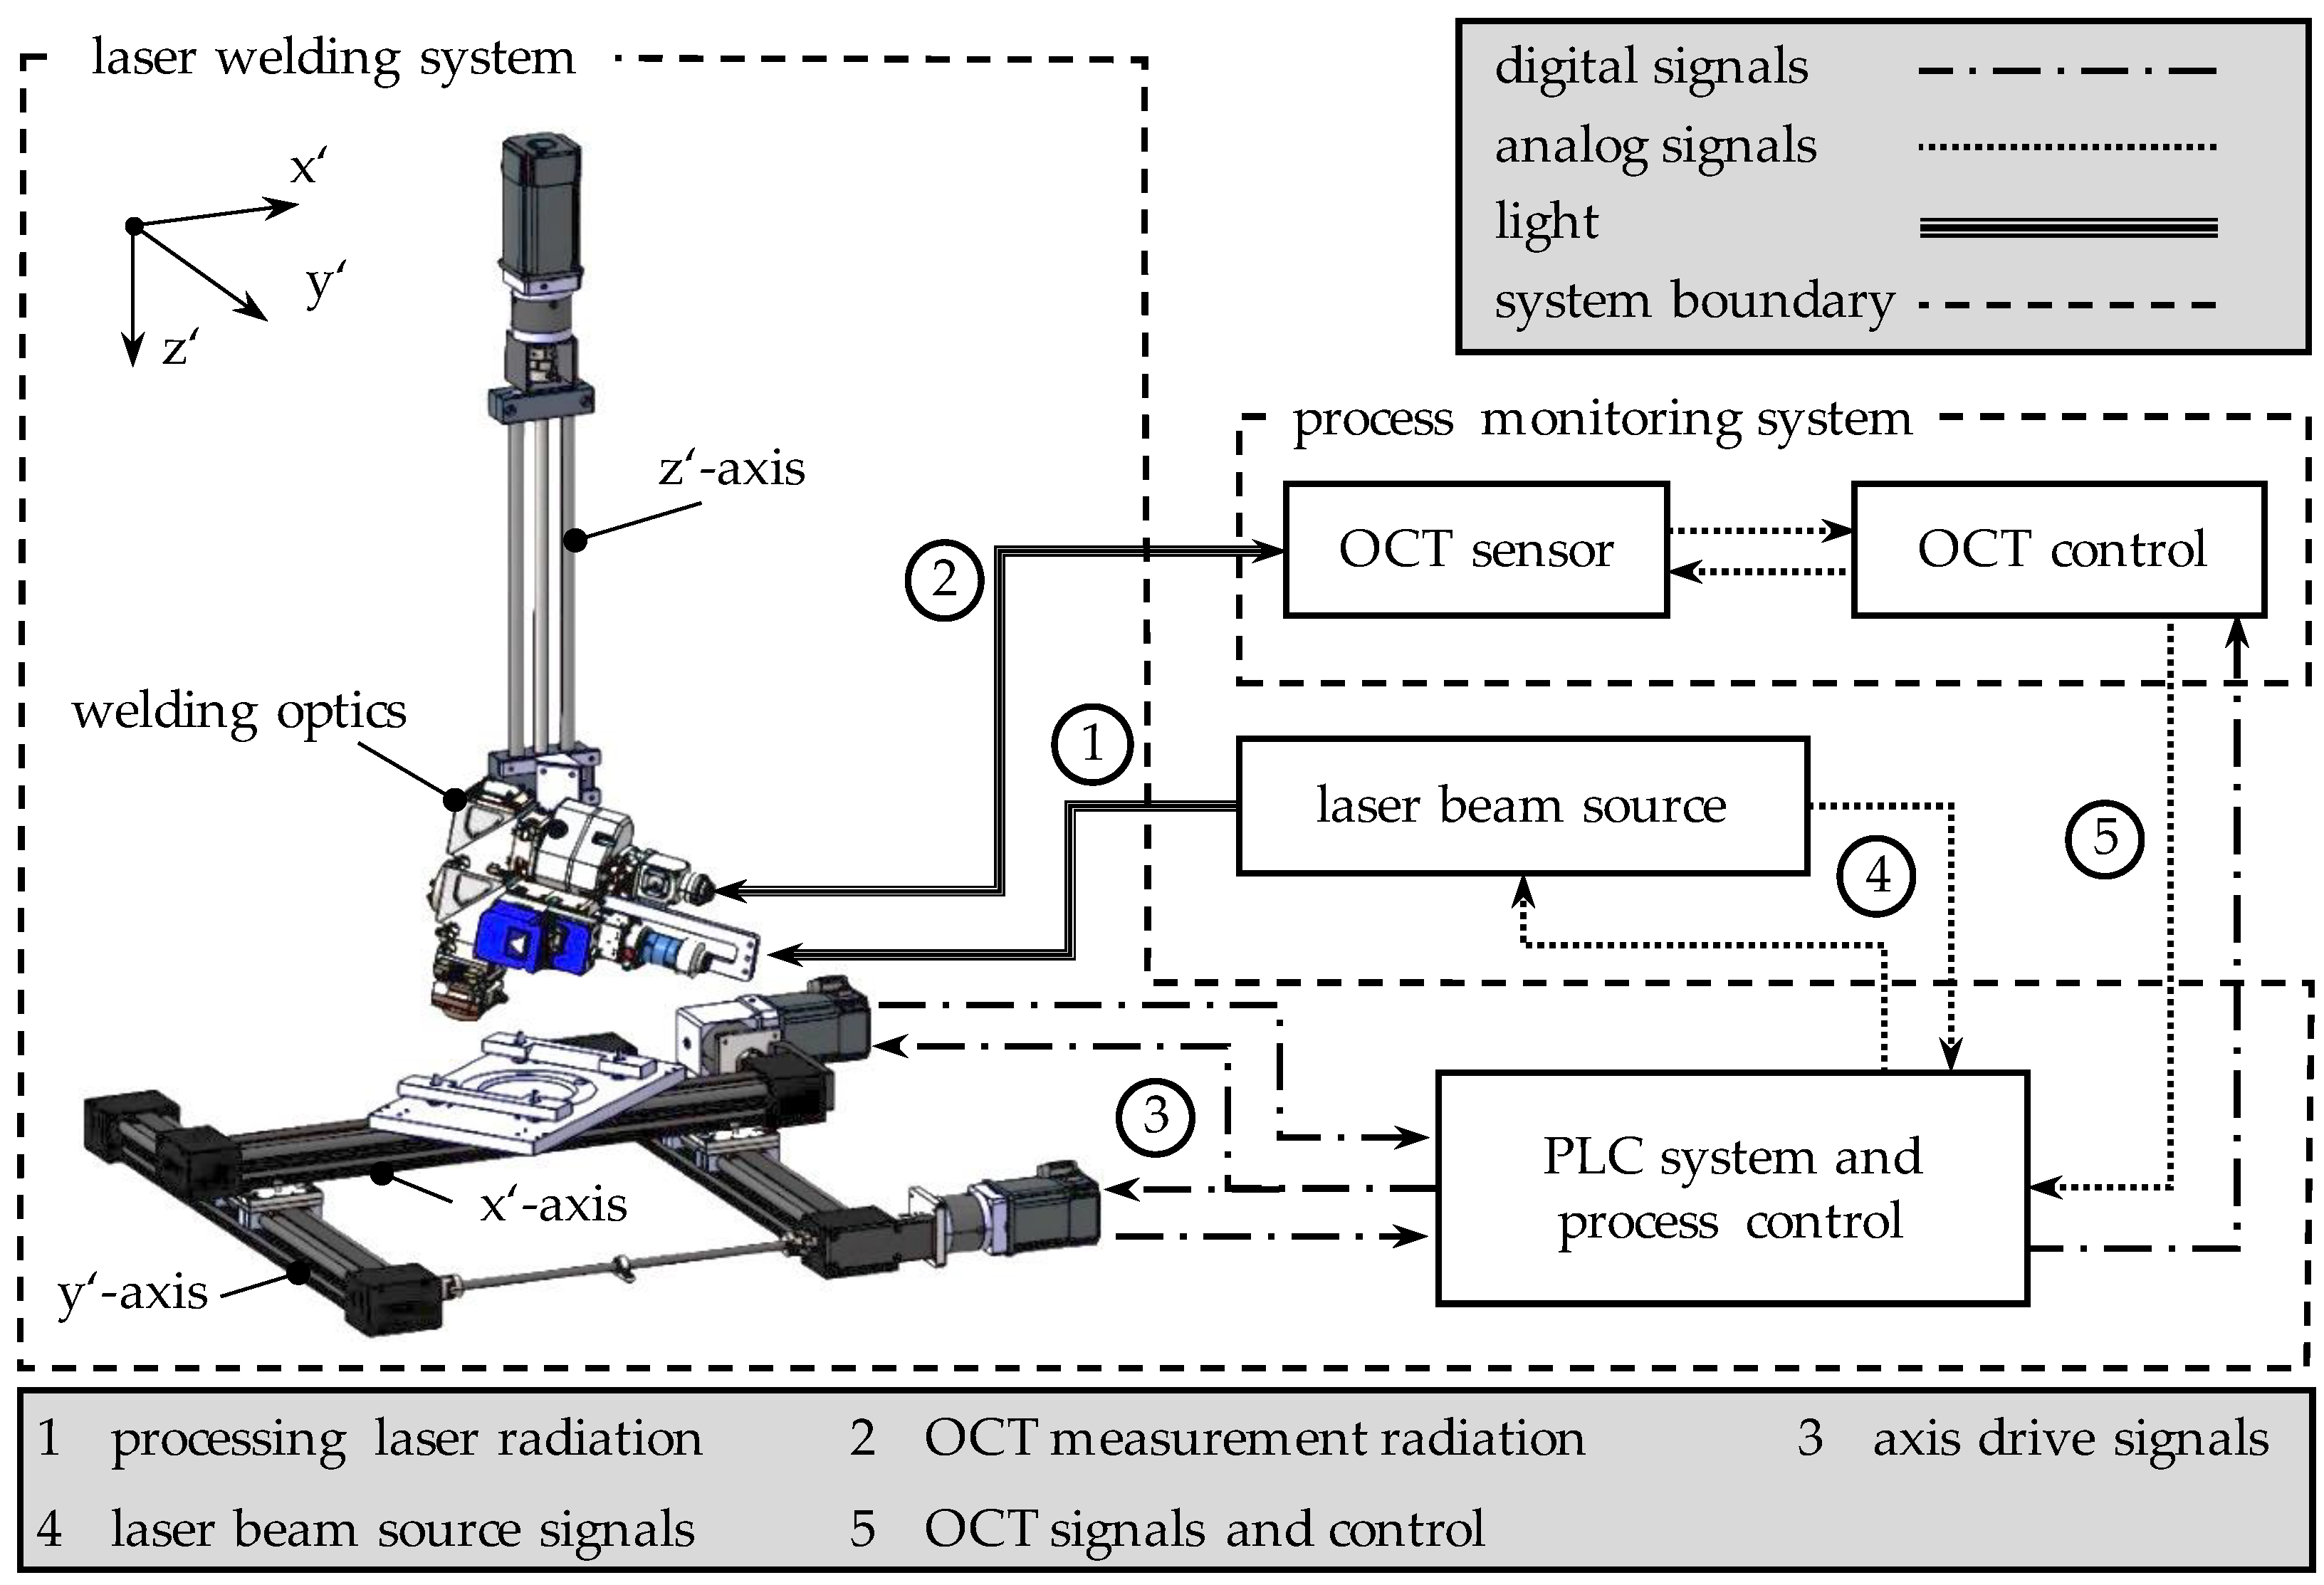
Abstract
:1. Introduction
2. State of the Art
2.1. Inline Weld Depth Measurement for Deep Penetration Laser Beam Welding
2.2. Artificial Intelligence in Laser Welding Applications
2.3. Process Control in Deep Penetration Laser Beam Welding
3. Objectives and Approach
4. Materials and Methods
4.1. Experimental Setup
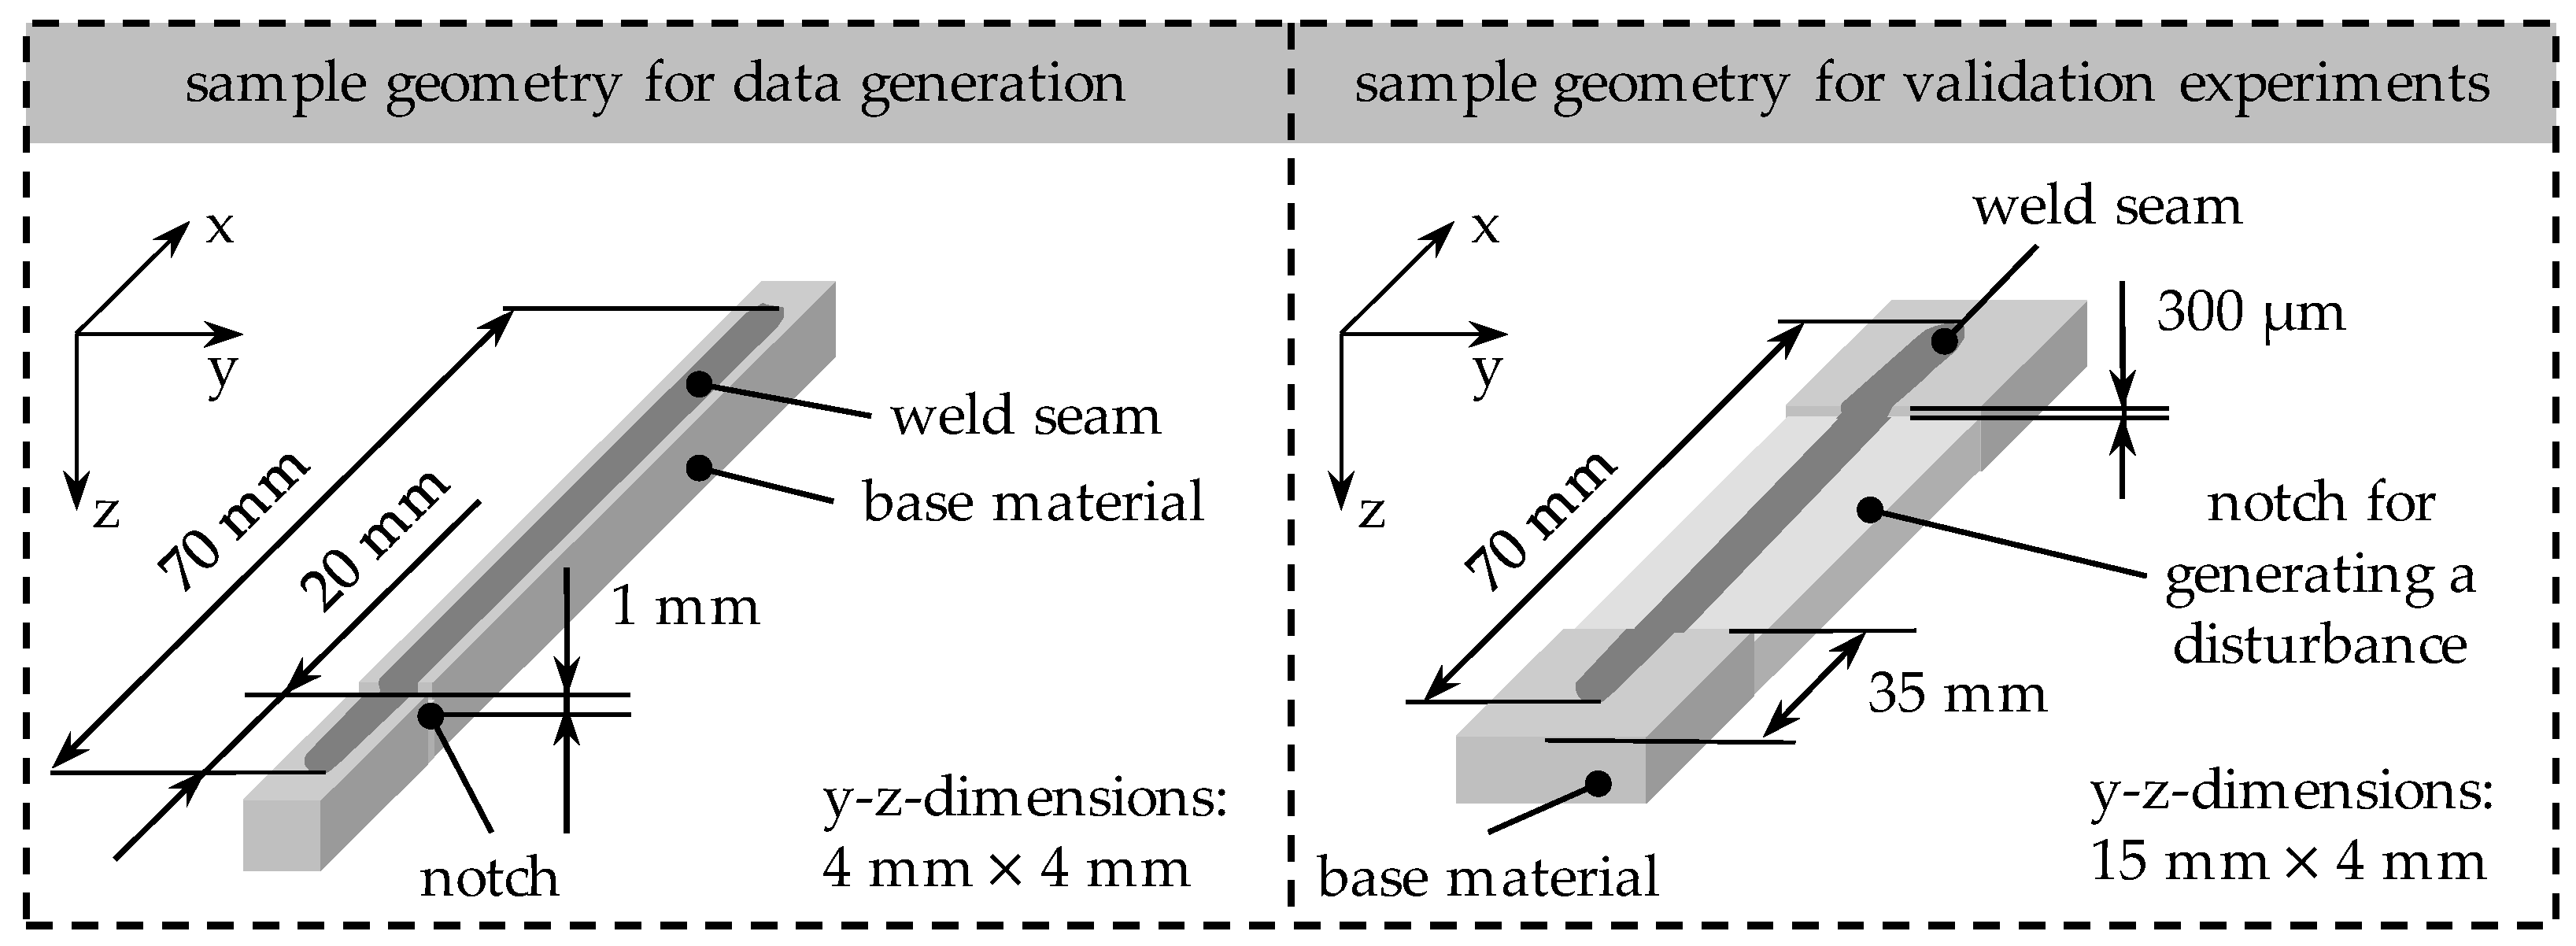
4.2. Materials and Specimens
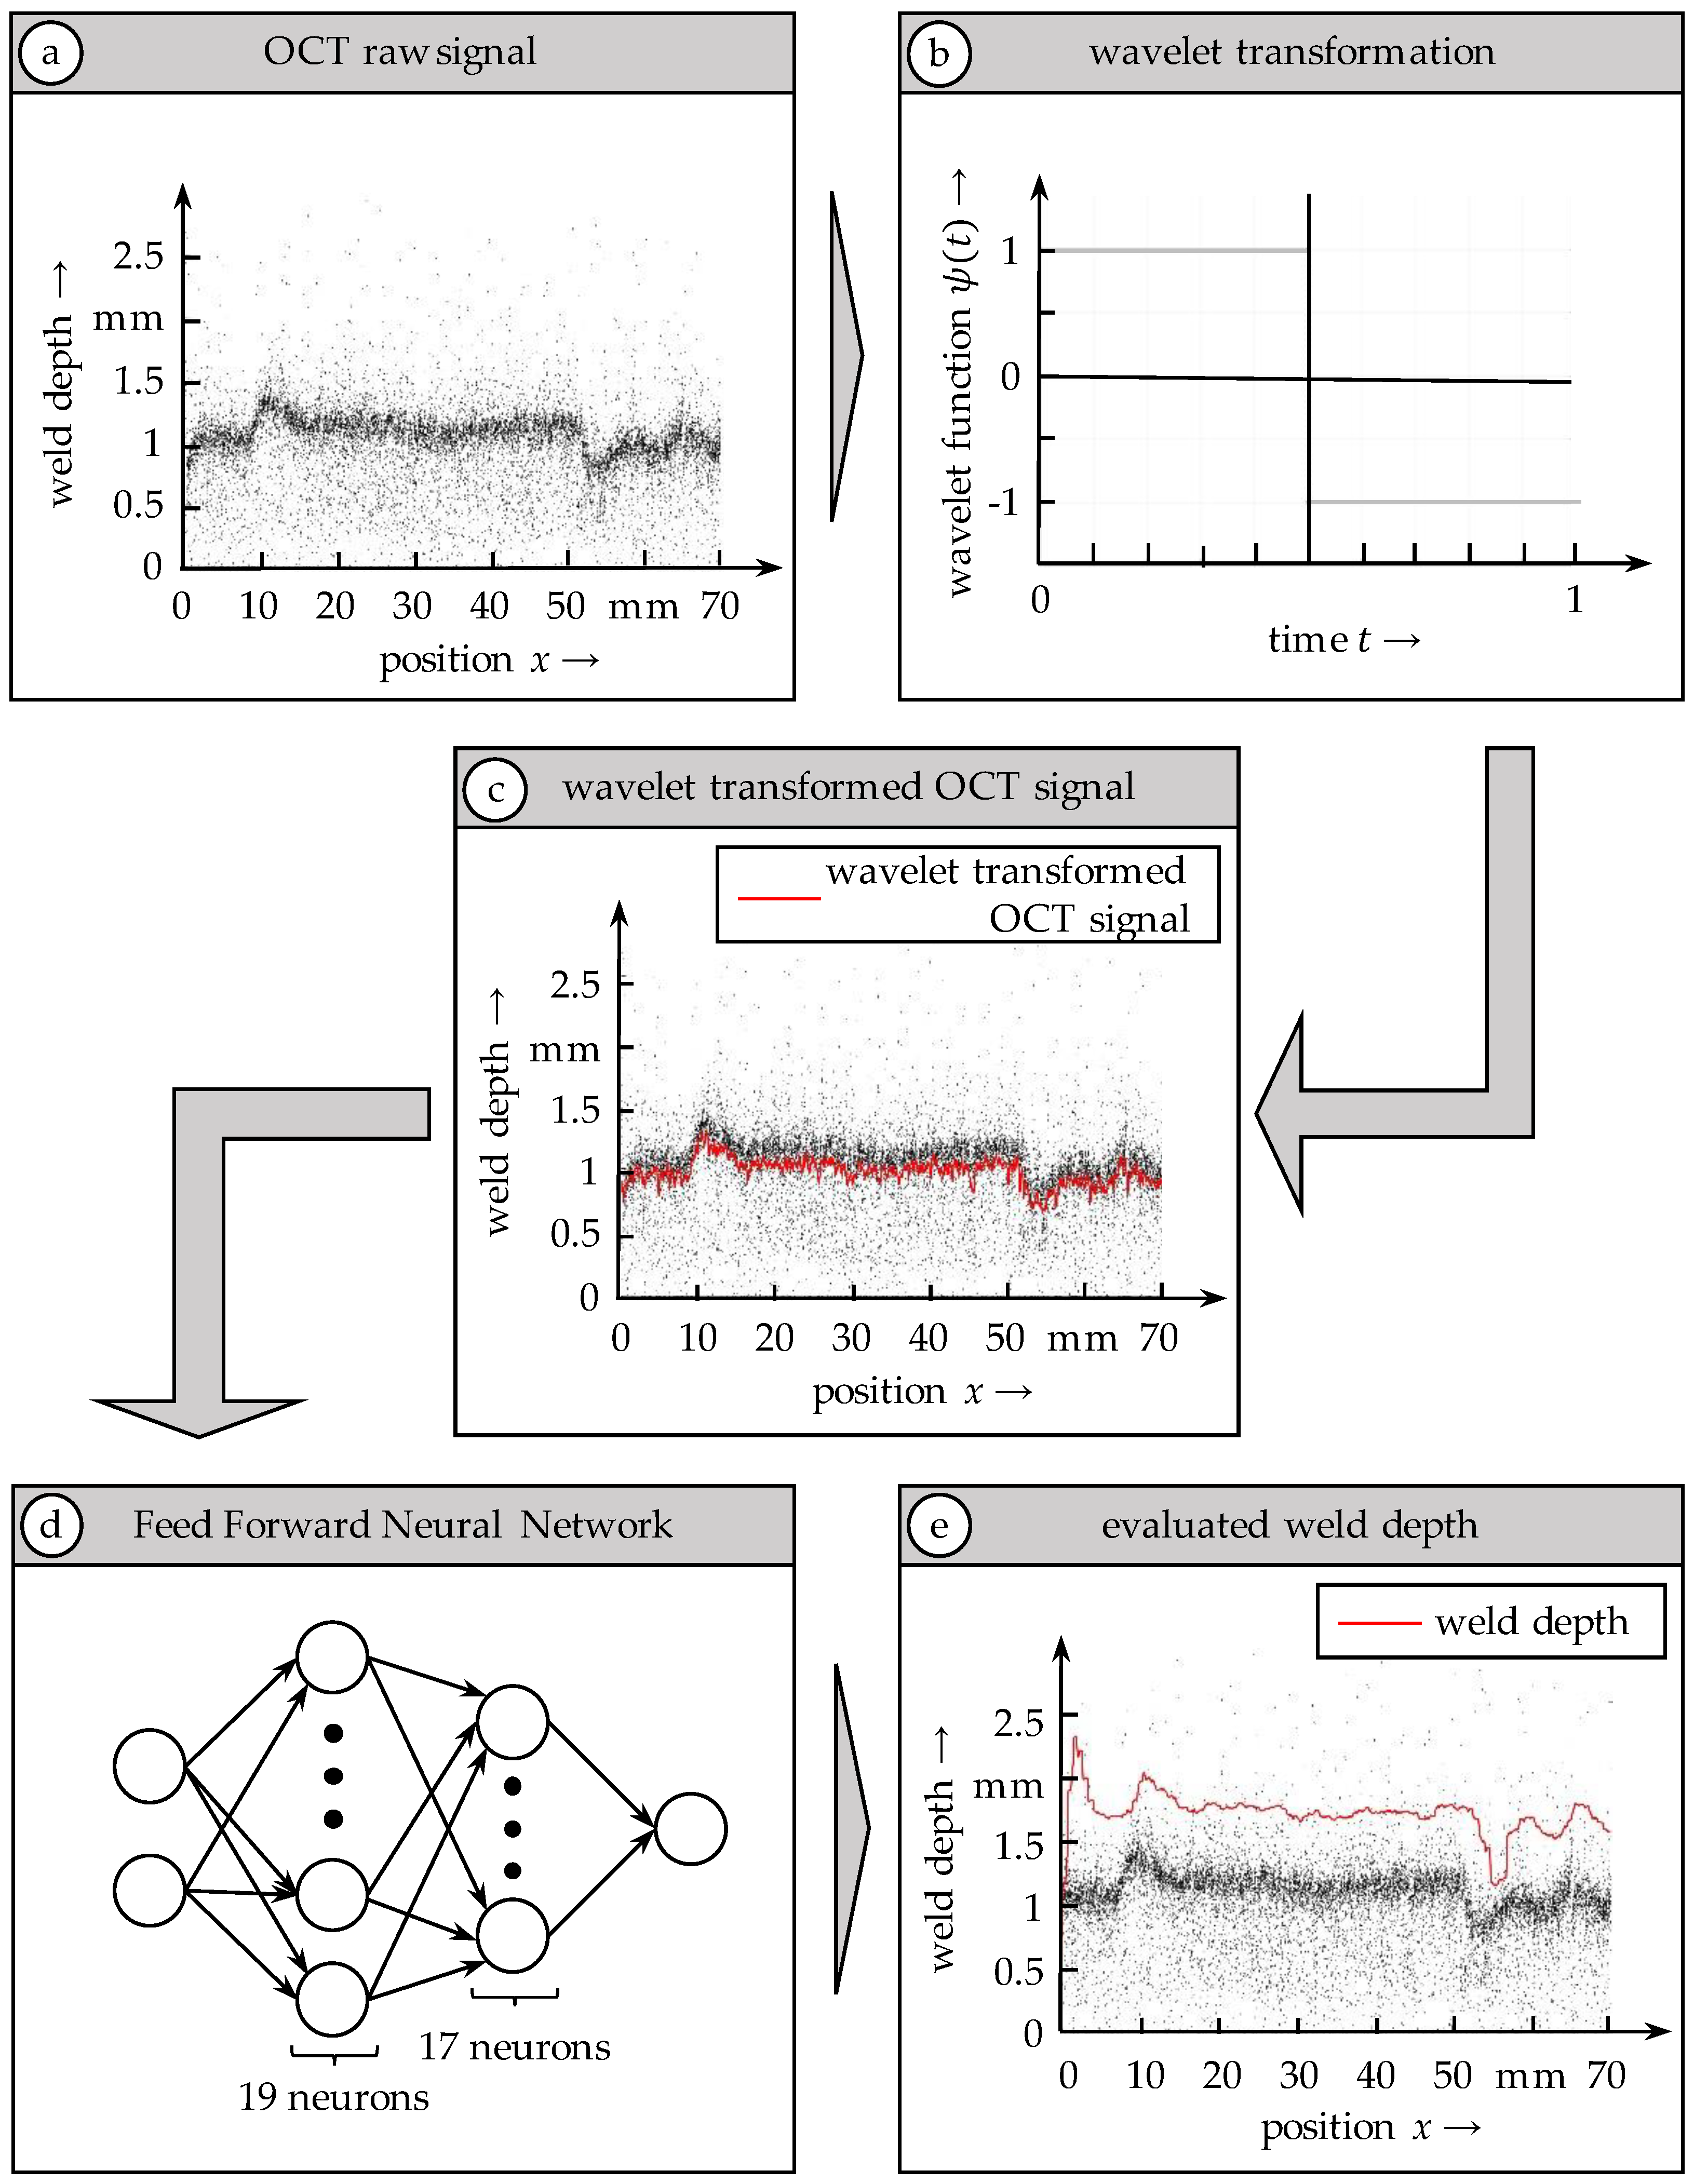
4.3. Data Processing Methods
5. Structure of the Data Evaluation and Control System
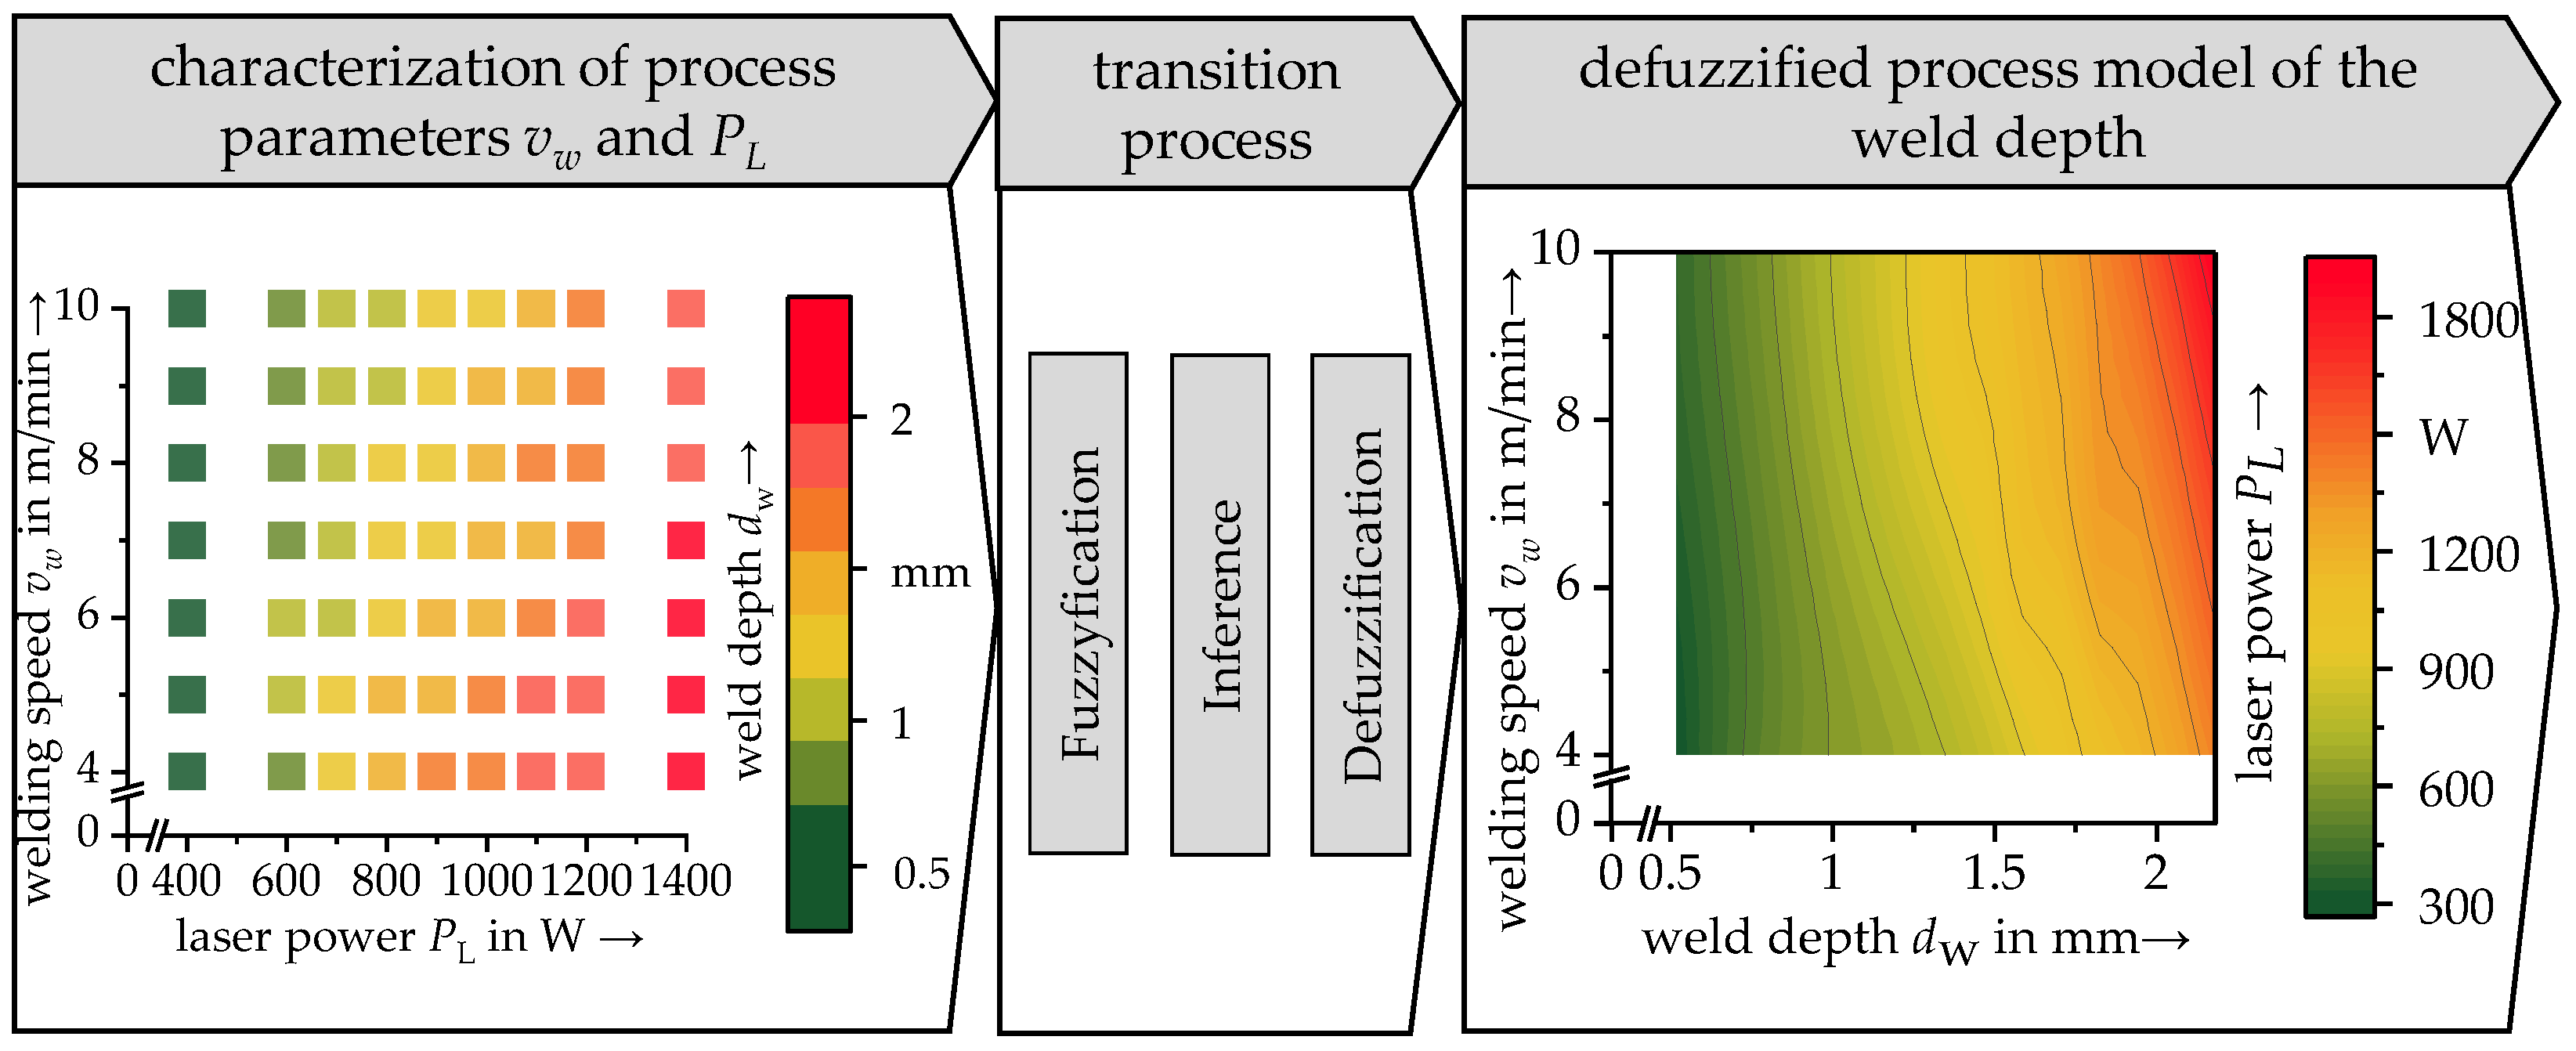
5.1. Inline Weld Depth Evaluation
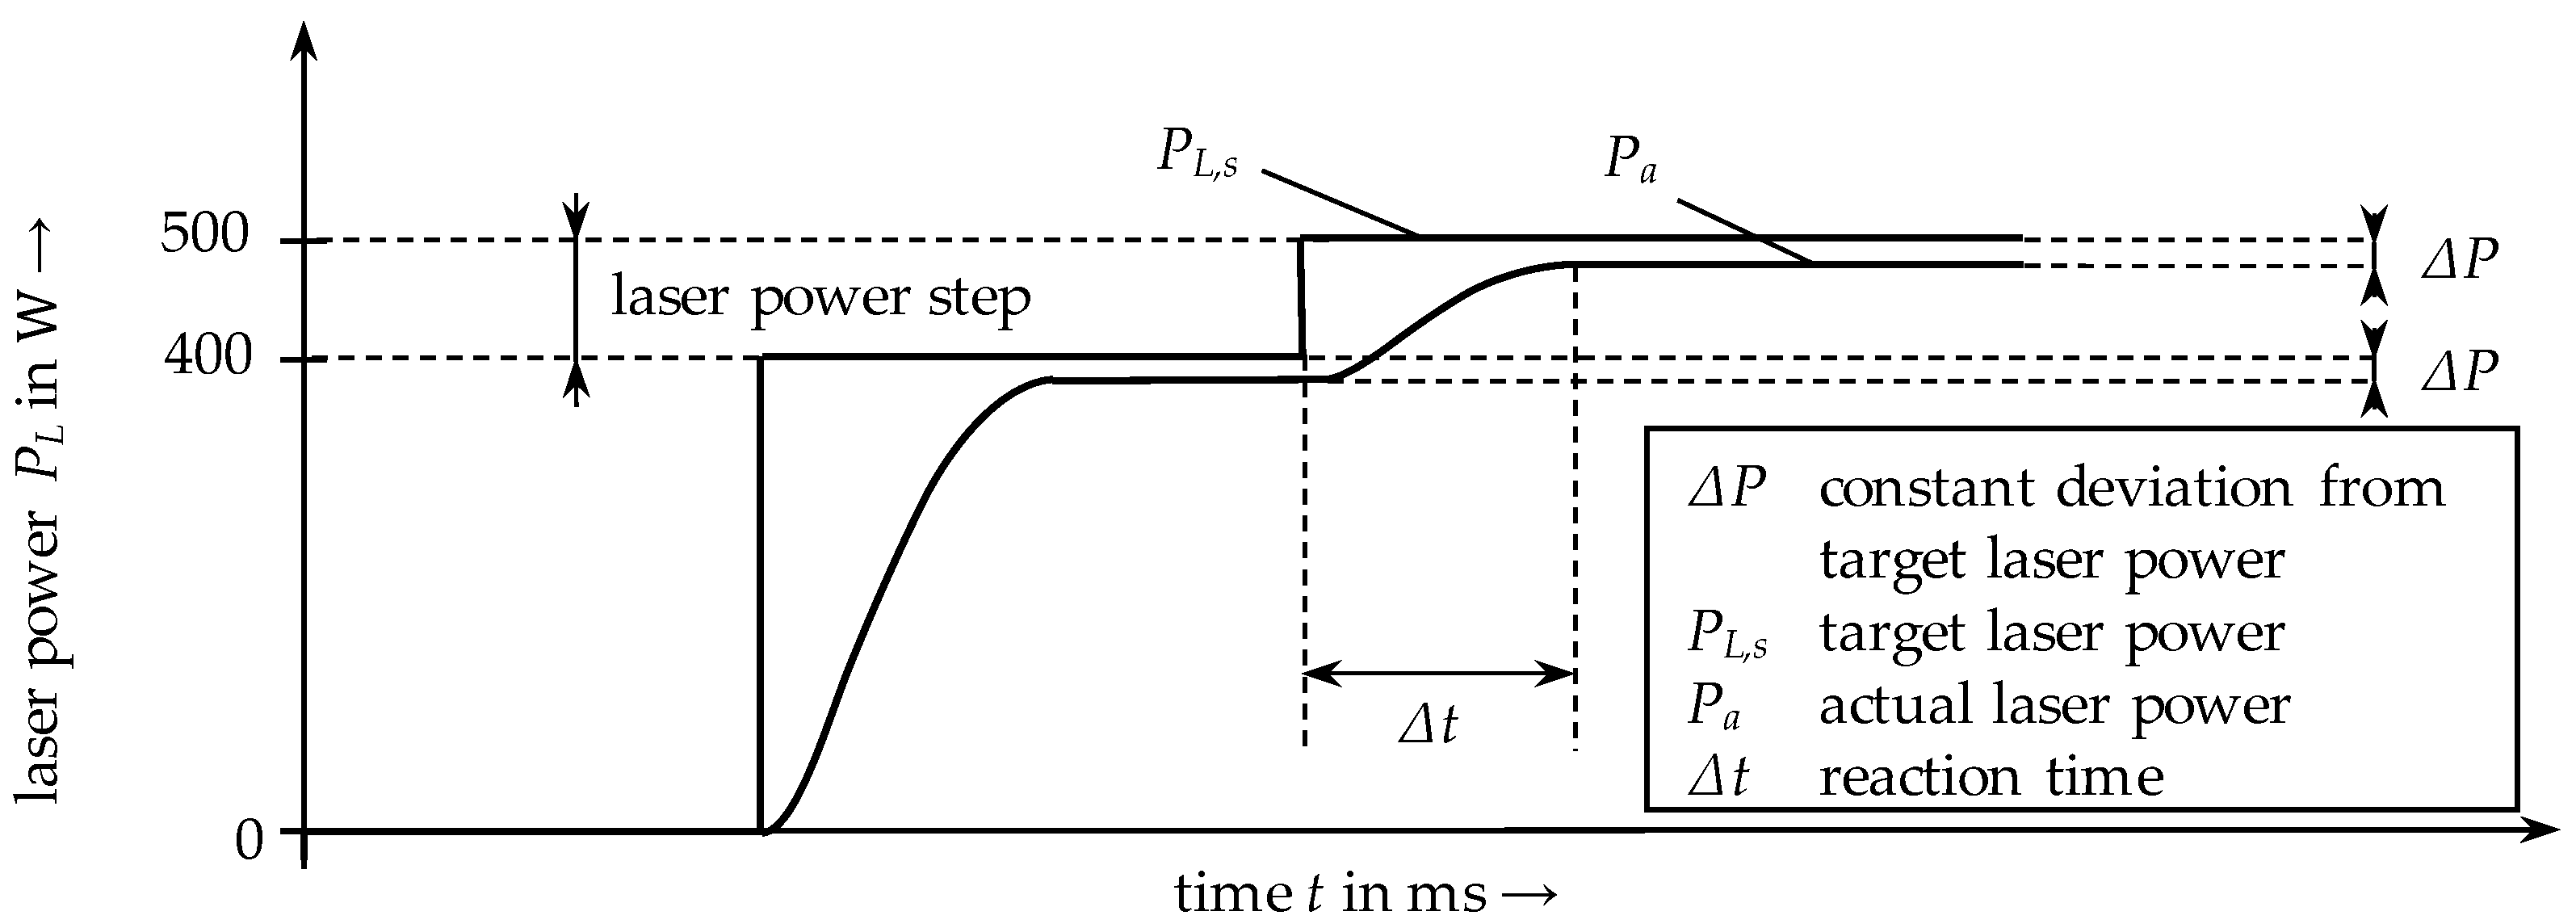
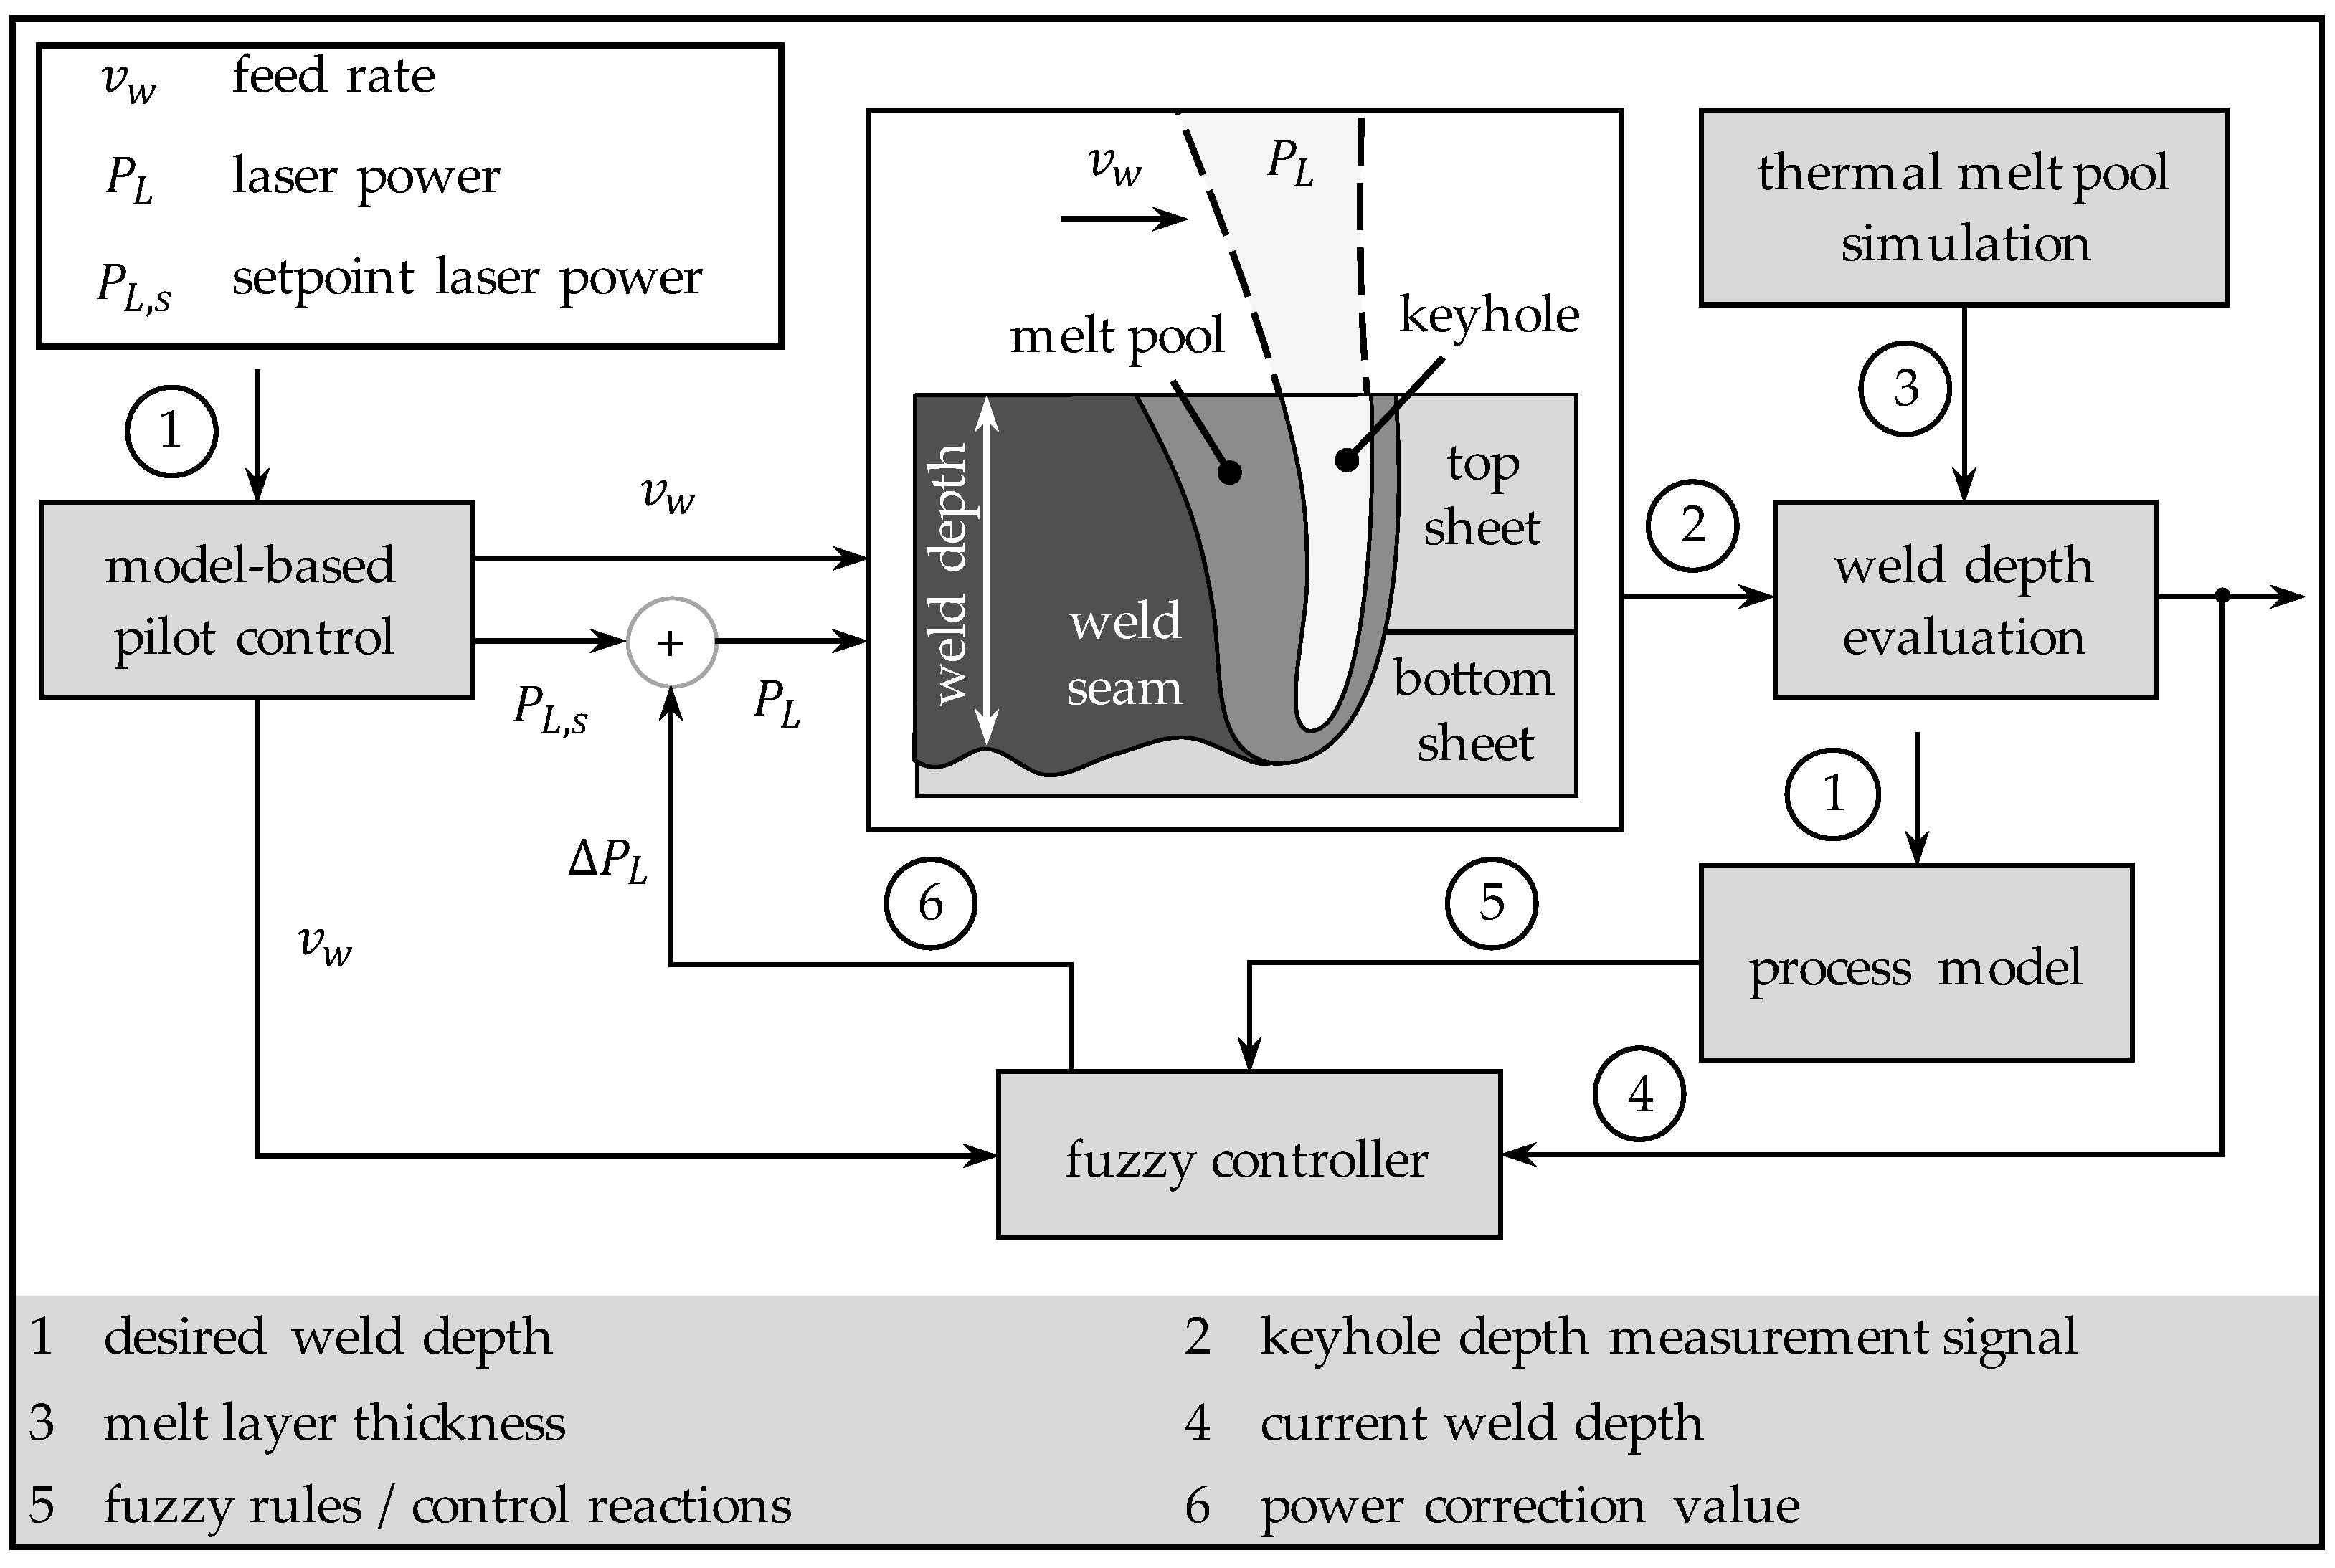
5.2. Inline Weld Depth Control
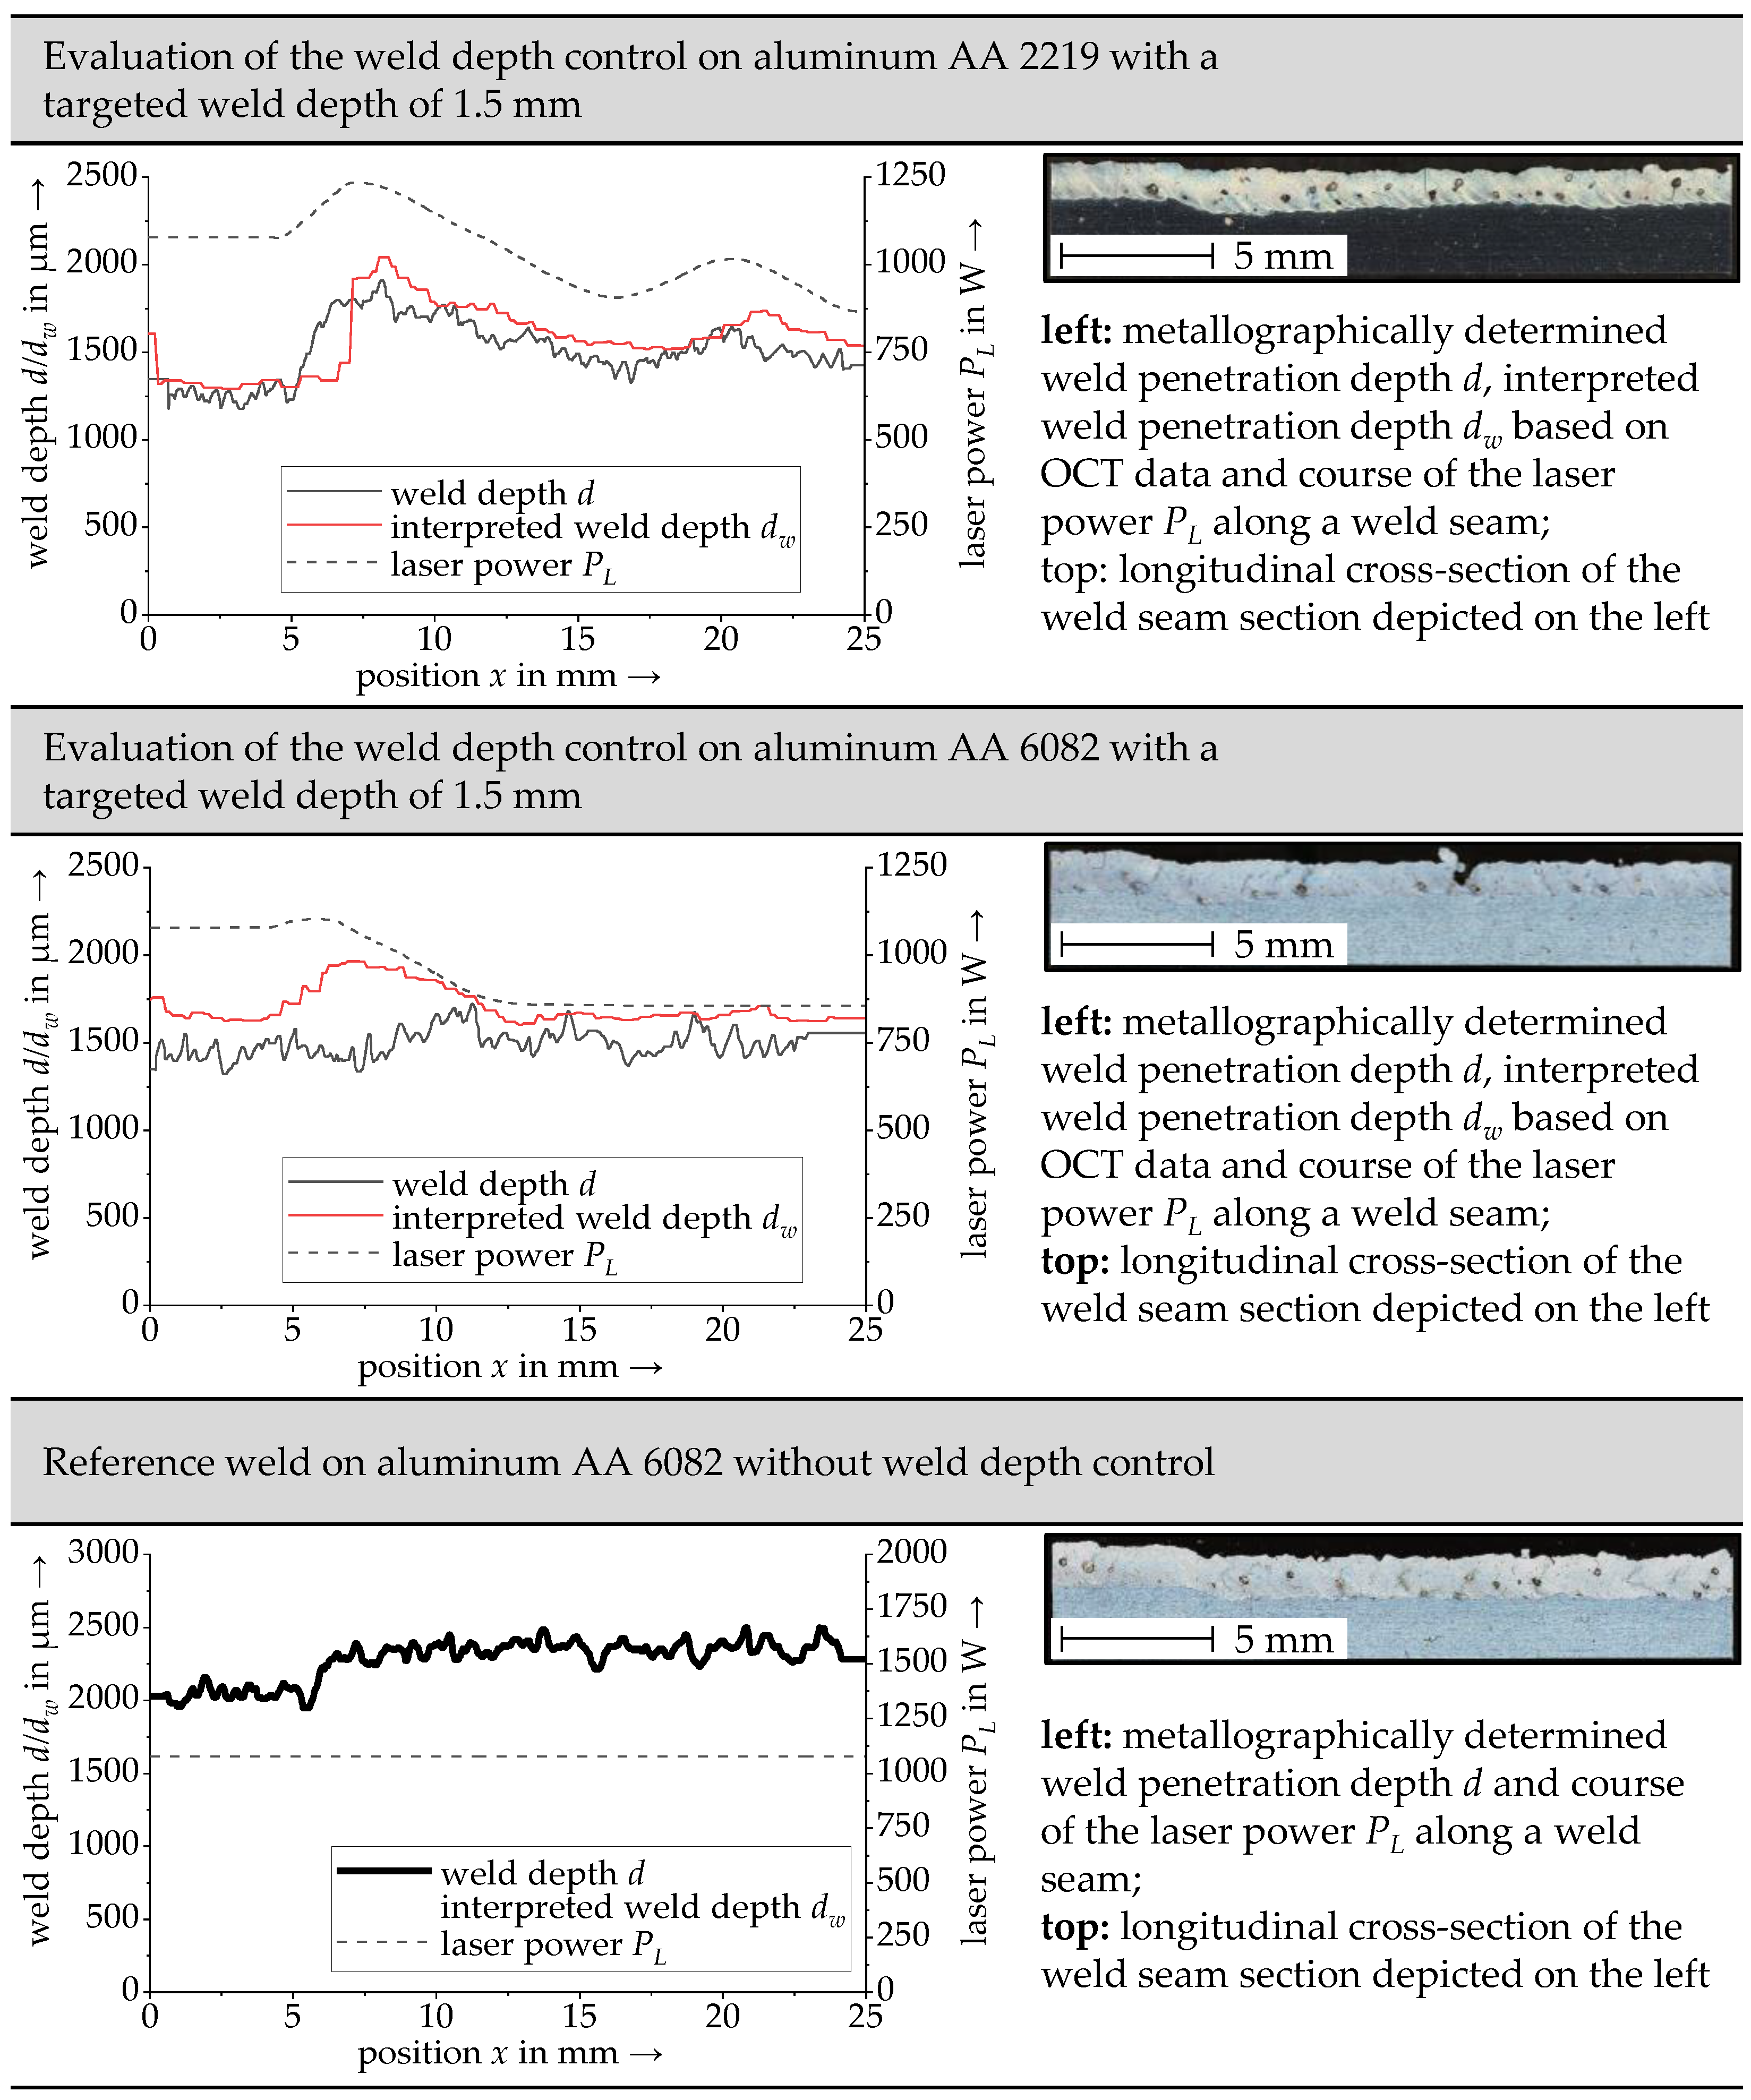
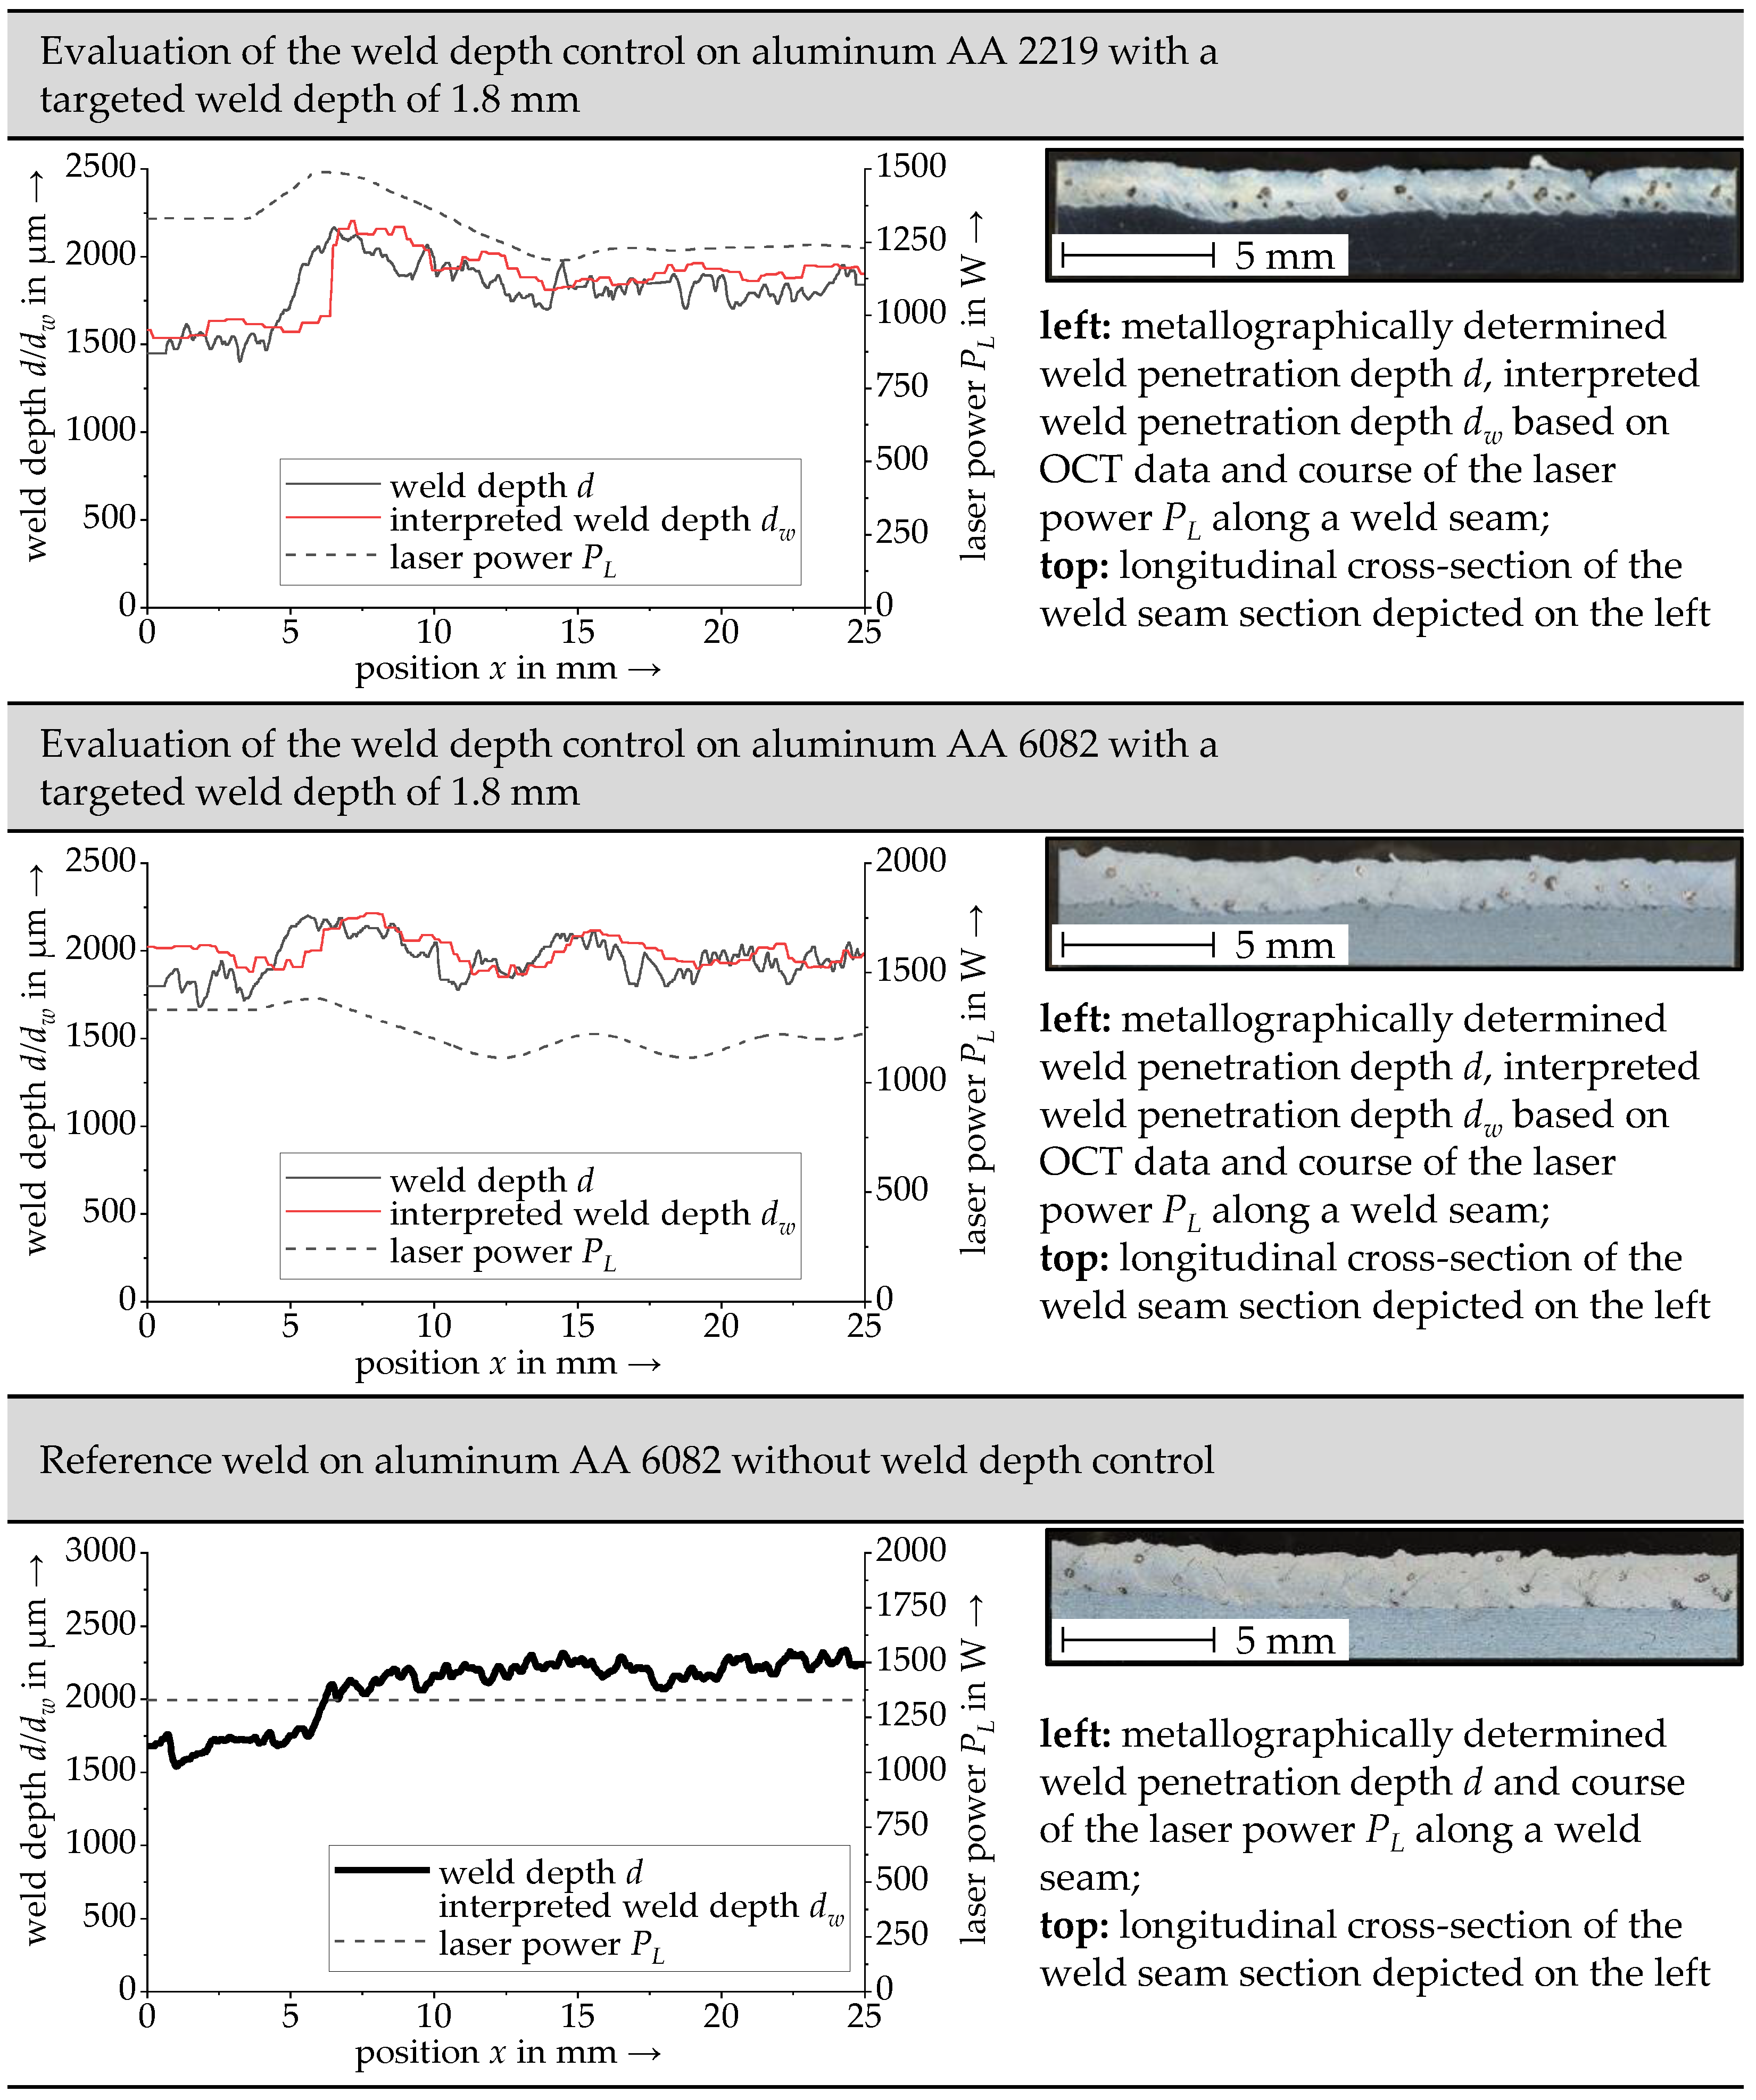
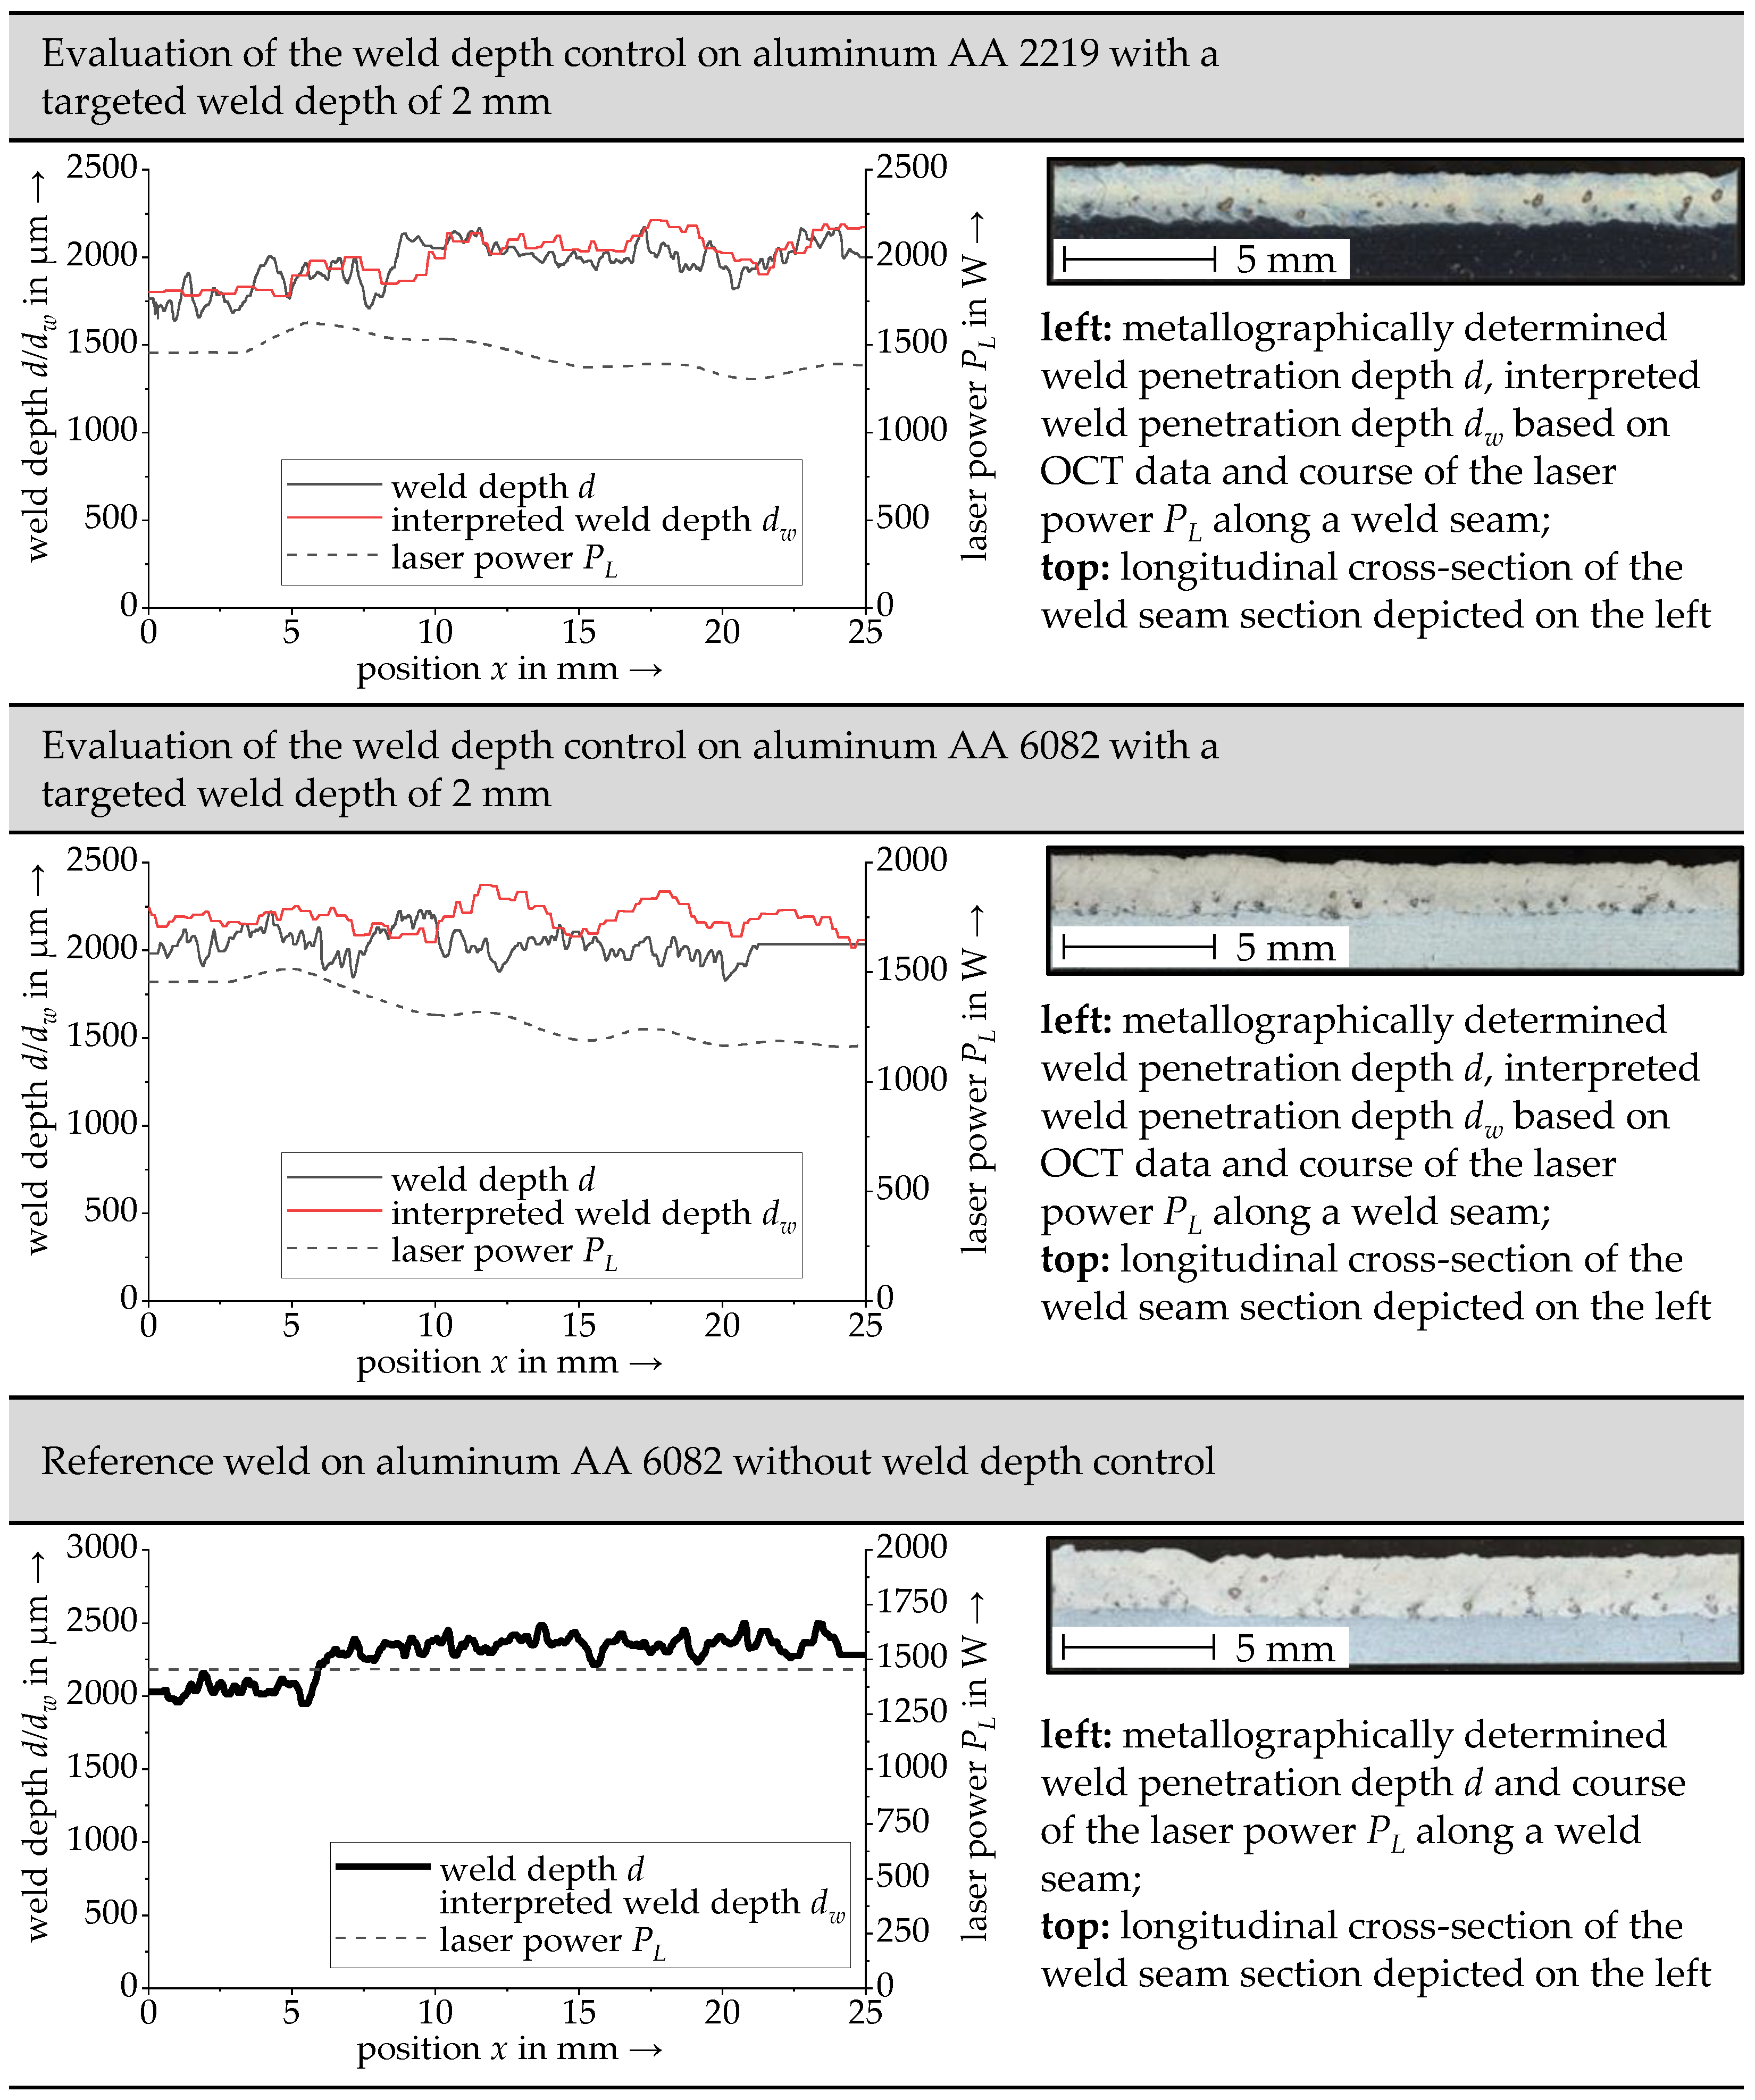
6. Experimental Validation and Discussion
7. Summary and Outlook
Author Contributions
Funding
Institutional Review Board Statement
Informed Consent Statement
Data Availability Statement
Acknowledgments
Conflicts of Interest
References
- Stadter, C.; Schmoeller, M.; Zeitler, M.; Tueretkan, V.; Munzert, U.; Zaeh, M.F. Process control and quality assurance in remote laser beam welding by optical coherence tomography. J. Laser Appl. 2019, 31, 22408. [Google Scholar] [CrossRef]
- Mayr, A.; Lutz, B.; Weigelt, M.; Glabel, T.; Kibkalt, D.; Masuch, M.; Riedel, A.; Franke, J. Evaluation of Machine Learning for Quality Monitoring of Laser Welding Using the Example of the Contacting of Hairpin Windings. In Proceedings of the 8th International Electric Drives Production Conference (EDPC), Schweinfurt, Germany, 4–5 December 2018; pp. 1–7, ISBN 9781728101484. [Google Scholar]
- Schaumberger, K.; Beck, M.; Saffer, J.; Kaufmann, F.; Ermer, J.; Roth, S.; Schmidt, M. Improving process reliability by means of detection of weld seam irregularities in copper via thermographic process monitoring. Procedia Manuf. 2019, 36, 58–63. [Google Scholar] [CrossRef]
- Boley, M.; Fetzer, F.; Graf, T.; Weber, R. High-speed x-ray imaging system for the investigation of laser welding processes. J. Laser Appl. 2019, 31, 042004-1–042004-10. [Google Scholar] [CrossRef]
- Purtonen, T.; Kalliosaari, A.; Salminen, A. Monitoring and Adaptive Control of Laser Processes. Phys. Procedia 2014, 56, 1218–1231. [Google Scholar] [CrossRef] [Green Version]
- Bautze, T.; Kogel-Hollacher, M. Keyhole Depth is just a Distance. Laser Tech. J. 2014, 11, 39–43. [Google Scholar] [CrossRef] [Green Version]
- Stadter, C.; Schmoeller, M.; von Rhein, L.; Zaeh, M.F. Real-time prediction of quality characteristics in laser beam welding using optical coherence tomography and machine learning. J. Laser Appl. 2020, 32, 22046. [Google Scholar] [CrossRef]
- Schmoeller, M.; Stadter, C.; Liebl, S.; Zaeh, M.F. Inline weld depth measurement for high brilliance laser beam sources using optical coherence tomography. J. Laser Appl. 2019, 31, 22409. [Google Scholar] [CrossRef]
- Kogel-Hollacher, M.; Schoenleber, M.; Schulze, J.; Bautze, T.; Strebel, M.; Moser, R. Inline measurement for quality control from macro to micro laser applications (Conference Presentation). In High-Power Laser Materials Processing: Applications, Diagnostics, and Systems VI; SPIE: Bellingham, WA, USA, 2017; Volume 10097, pp. 100910H-1–100910H-9. [Google Scholar] [CrossRef]
- Sokolov, M.; Franciosa, P.; Al Botros, R.; Ceglarek, D. Keyhole mapping to enable closed-loop weld penetration depth control for remote laser welding of aluminum components using optical coherence tomography. J. Laser Appl. 2020, 32, 32004. [Google Scholar] [CrossRef]
- Webster, P.J.L.; Wright, L.G.; Ji, Y.; Galbraith, C.M.; Kinross, A.W.; van Vlack, C.; Fraser, J.M. Automatic laser welding and milling with in situ inline coherent imaging. Opt. Lett. 2014, 39, 6217–6220. [Google Scholar] [CrossRef]
- Stadter, C.; Kick, M.K.; Schmoeller, M.; Zaeh, M.F. Correlation analysis between the beam propagation and the vapor capillary geometry by machine learning. Procedia CIRP 2020, 94, 742–747. [Google Scholar] [CrossRef]
- Aktepe, A.; Ersöz, S.; Lüy, M. Welding Process Optimization with Artificial Neural Network Applications. Neural Netw. World 2014, 24, 655–670. [Google Scholar] [CrossRef] [Green Version]
- Günther, J.; Pilarski, P.M.; Helfrich, G.; Shen, H.; Diepold, K. Intelligent laser welding through representation, prediction, and control learning: An architecture with deep neural networks and reinforcement learning. Mechatronics 2015, 34, 1–11. [Google Scholar] [CrossRef]
- Zhang, Z.; Li, B.; Zhang, W.; Lu, R.; Wada, S.; Zhang, Y. Real-time penetration state monitoring using convolutional neural network for laser welding of tailor rolled blanks. J. Manuf. Syst. 2020, 54, 348–360. [Google Scholar] [CrossRef]
- Zhang, Y.; You, D.; Gao, X.; Wang, C.; Li, Y.; Gao, P.P. Real-time monitoring of high-power disk laser welding statuses based on deep learning framework. J. Intell. Manuf. 2020, 31, 799–814. [Google Scholar] [CrossRef]
- Blug, A.; Abt, F.; Nicolosi, L.; Heider, A.; Weber, R.; Carl, D.; Höfler, H.; Tetzlaff, R. The full penetration hole as a stochastic process: Controlling penetration depth in keyhole laser-welding processes. Appl. Phys. A 2012, 108, 97–107. [Google Scholar] [CrossRef] [Green Version]
- Blug, A.; Carl, D.; Höfler, H.; Abt, F.; Heider, A.; Weber, R.; Nicolosi, L.; Tetzlaff, R. Closed-loop Control of Laser Power using the Full Penetration Hole Image Feature in Aluminum Welding Processes. Phys. Procedia 2011, 12, 720–729. [Google Scholar] [CrossRef]
- Bardin, F.; Cobo, A.; Lopez-Higuera, J.M.; Collin, O.; Aubry, P.; Dubois, T.; Högström, M.; Nylen, P.; Jonsson, P.; Jones, J.D.C.; et al. Closed-loop power and focus control of laser welding for full-penetration monitoring. Appl. Opt. 2005, 44, 13–21. [Google Scholar] [CrossRef]
- Birnesser, A.J. Prozessregelung beim Laserstrahlschweißen; Universität Stuttgart: München, Germany, 2011; ISBN 9783831641338. [Google Scholar]
- Konuk, A.; Aarts, R.; Veld, A.H.I.; Sibillano, T.; Rizzi, D.; Ancona, A. Process Control of Stainless Steel Laser Welding using an Optical Spectroscopic Sensor. Phys. Procedia 2011, 12, 744–751. [Google Scholar] [CrossRef] [Green Version]
- Kos, M.; Arko, E.; Kosler, H.; Jezeršek, M. Penetration-depth control in a remote laser-welding system based on an optical triangulation loop. Opt. Lasers Eng. 2021, 139, 106464-1–106464-14. [Google Scholar] [CrossRef]
- Michel, J. Approximatives Modell für das Tiefschweißen mit Laserstrahlung; RWTH Aachen: Aachen, Germany, 2004; ISBN 3832224076. [Google Scholar]
- Bollig, A.; Mann, S.; Beck, R.; Kaierle, S. Einsatz optischer Technologien zur Regelung des Laserstrahlschweißprozesses. Automatisierungstechnik 2005, 53, 513–521. [Google Scholar] [CrossRef]
- Liu, Y.; Zhang, W.; Zhang, Y. Dynamic Neuro-Fuzzy-Based Human Intelligence Modeling and Control in GTAW. IEEE Trans. Autom. Sci. Eng. 2015, 12, 324–335. [Google Scholar] [CrossRef]
- Schmoeller, M.; Stadter, C.; Kick, M.; Geiger, C.; Zaeh, M.F. A Novel Approach to the Holistic 3D Characterization of Weld Seams—Paving the Way for Deep Learning-Based Process Monitoring. Materials 2021, 14, 6928. [Google Scholar] [CrossRef]
- Mertins, A. Signaltheorie: Grundlagen der Signalbeschreibung, Filterbänke, Wavelets, Zeit-Frequenz-Analyse, Parameter- und Signalschätzung, 4th ed.; Springer Fachmedien Wiesbaden: Wiesbaden, Germany, 2020; ISBN 9783658296483. [Google Scholar]
- Kim, H.; Melhem, H. Fourier and wavelet analyses for fatigue assessment of concrete beams. Exp. Mech. 2003, 43, 131–140. [Google Scholar] [CrossRef]
- Cariolaro, G. Unified Signal Theory; Springer: Heidelberg, Germany, 2011; ISBN 9780857294630. [Google Scholar]
- Schmoeller, M.; Neureiter, M.; Stadter, C.; Zaeh, M.F. Numerical weld pool simulation for the accuracy improvement of inline weld depth measurement based on optical coherence tomography. J. Laser Appl. 2020, 32, 22036. [Google Scholar] [CrossRef]
- Schmoeller, M.; Stadter, C.; Wagner, M.; Zaeh, M.F. Investigation of the influences of the process parameters on the weld depth in laser beam welding of AA6082 using machine learning methods. Procedia CIRP 2020, 94, 702–707. [Google Scholar] [CrossRef]
- Hagenlocher, C.; Fetzer, F.; Weber, R.; Graf, T. Benefits of very high feed rates for laser beam welding of AlMgSi aluminum alloys. J. Laser Appl. 2018, 30, 12015. [Google Scholar] [CrossRef] [Green Version]


Publisher’s Note: MDPI stays neutral with regard to jurisdictional claims in published maps and institutional affiliations. |
© 2022 by the authors. Licensee MDPI, Basel, Switzerland. This article is an open access article distributed under the terms and conditions of the Creative Commons Attribution (CC BY) license (https://creativecommons.org/licenses/by/4.0/).
Share and Cite
Schmoeller, M.; Weiss, T.; Goetz, K.; Stadter, C.; Bernauer, C.; Zaeh, M.F. Inline Weld Depth Evaluation and Control Based on OCT Keyhole Depth Measurement and Fuzzy Control. Processes 2022, 10, 1422. https://doi.org/10.3390/pr10071422
Schmoeller M, Weiss T, Goetz K, Stadter C, Bernauer C, Zaeh MF. Inline Weld Depth Evaluation and Control Based on OCT Keyhole Depth Measurement and Fuzzy Control. Processes. 2022; 10(7):1422. https://doi.org/10.3390/pr10071422
Chicago/Turabian StyleSchmoeller, Maximilian, Tony Weiss, Korbinian Goetz, Christian Stadter, Christian Bernauer, and Michael F. Zaeh. 2022. "Inline Weld Depth Evaluation and Control Based on OCT Keyhole Depth Measurement and Fuzzy Control" Processes 10, no. 7: 1422. https://doi.org/10.3390/pr10071422