1. Introduction
The foreseen use of fuel cell electric vehicles (FCEV) is quickly moving from light duty such as cars to heavy duty applications such as buses or trucks [
1]. The European Commission has planned that hydrogen could represent 32% of the European fuel mix in 2050 [
2] and supply 17% of the heavy-duty vehicles by 2030 [
3]. To support this ambition, several regulations are being implemented worldwide, and the ‘Fit for 55 package’ [
4] in Europe requires the deployment of hydrogen refuelling stations every 150 km along the Trans-European Transport Network. Following these drivers, the hydrogen infrastructure is expected to significantly increase over the next few years with a target of 4500 hydrogen refuelling stations (HRS) in Europe by 2030 [
5] and a target of 13 million FCEVs [
6].
FCEVs require hydrogen fuel with a chemical composition specification to avoid any improper performance of the vehicles. International standards such as ISO 14687 [
7], EN17124 [
8], and SAE J2719 [
9] define a list of chemical compounds with amount fraction thresholds in hydrogen fuel for FCEV usage. Total sulphur is one of the most impactful contaminants in fuel cell systems and has a threshold of 4 nmol/mol in hydrogen fuel. Cheng et al. [
10] reported that 100 nmol/mol of H
2S could cause a significant cell voltage drop within only 300 h. Hydrogen sulphide (H
2S) and sulphur species strongly adsorb on the Pt catalyst. The adsorption of S-containing species to the active sites of a catalyst, occupying the polyatomic sites, prevents the reactants, including oxygen and hydrogen, from adsorbing at the catalyst surface [
10]. Therefore, significant performance loss will be observed in an FCEV. The adsorption of sulphur onto Pt on the catalyst surface makes it highly irreversible for the fuel cell [
11].
The impact of sulphur has been a key topic for the deployment of passenger fuel cell electrical vehicles. At trace amount fractions the impact may only be visible over the long term (several years of performance) and may be difficult to realise on the current passenger vehicles (short daily use). However, heavy-duty vehicles which will operate for longer hours per day and almost daily will become more susceptible to the impact of sulphur compounds on performance. It is therefore important for analytical laboratories to develop the capability to measure total sulphur at a lower limit of detection (picomol/mol).
Total sulphur analysis in hydrogen fuel has been a challenging measurement for analytical laboratories. The recent review of Beurey et al. [
12] highlighted that most methods have a limit of detection between 0.001–0.0071 µmol/mol for GC-SCD (no preconcentration) [
13], OFCEAS [
12], and GC-FPD with pre-concentrator [
14]. Only one ASTM method using GC-SCD with pre-concentrator (withdrawn in 2020) provided a limit of detection at picomol/mol for independent sulphur compounds [
15]. Most analytical laboratories currently provide limit of detections close to 1 nmol/mol for sulphur analysis [
16]. This limit of detection is compatible with the current ISO 14687:2019 threshold for total sulphur set at 4 nmol/mol. However, it reflects a lack of sensitivity for understanding total sulphur presence and behaviour at hydrogen refuelling stations. For example, a limit of detection of 1 nmol/mol will not allow differentiation if hydrogen fuel has 0.9 nmol/mol of total sulphur or less than 0.1 nmol/mol of total sulphur. This difference is critical as sulphur compounds have long-term and irreversible poisoning effects on fuel cell systems. Based on the Beurey et al. review [
12], several methods at nmol/mol level already require pre-concentration steps which make improving their limit of detection challenging. The GC-SCD technique without preconcentration technique was able to reach 1 nmol/mol amount fraction as the limit of detection. Therefore, the combination of preconcentration by cryo-focussing and GC-SCD is a suitable choice to develop a new analytical method to measure total sulphur at picomol/mol amount fraction. Another important aspect is to ensure the accuracy of the method. The accuracy of the measurement at 4 nmol/mol is limited if the analytical method is only capable of reaching 1 nmol/mol. The consequence may be an uncertainty higher than 20% (
k = 2). The improvement of an analytical method (lower limit of detection) may lead to a lower uncertainty in the region close to the threshold of 4 nmol/mol. The benefit will be better accuracy in the region close to the ISO 14687 threshold of 4 nmol/mol. To ensure accuracy, it is critical to evaluate the possibility of preparing reference materials for sulphur compounds in hydrogen at low nmol/mol to picomol/mol. This type of reference material is commercially unavailable which makes it difficult to determine accuracy of analytical methods for sulphur compounds at low nmol/mol or picomol/mol amount fraction.
This study will present the new cryo-focussing GC-SCD analytical method for total sulphur analysis at picomol/mol with performance results. The results of reference materials and real hydrogen fuel sample samples will be reported. Finally, a discussion will highlight the advantages and disadvantages of this method in the rollout of hydrogen fuel quality.
2. Materials and Methods
2.1. Gas Reference Standard Preparation
The first part of the work was the gravimetric preparation of standards of carbonyl sulphide (OCS), dimethyl sulphide (DMS), and hydrogen sulphide (H
2S) at nmol/mol and picomol/mol amount fraction levels in hydrogen. Three gas standards were prepared in accordance with ISO 6142-1 [
17] using high purity hydrogen (H
2 BIP
+®, Air products, Crewe, UK) and NPL primary gas mixtures, NPL PRM (NPL, Teddington, UK). The components used were typically of the highest purity commercially available, and purity analysis was performed to identify and quantify any impurities present.
Mixtures for OCS and DMS were prepared in three types of 10 L (internal water volume) aluminium cylinder spectraseal (BOC, Woking, UK), aluminium cylinder (Luxfer, Nottingham, UK) with SGS® (Superior Gas Stability) finish or aluminium cylinder Performax (Effectech, Uttoxeter, UK) with an NPL-designed outlet diaphragm valve (Rotarex Ceodeux, Luxembourg). It includes an internal screw thread to minimise dead volume. For H2S, the cylinders were 10 L (internal water volume) aluminium cylinder (Luxfer, UK) with SGS® (Superior Gas Stability) finish or aluminium cylinder Performax (Effectech, UK) with an NPL-designed outlet diaphragm valve (Rotarex Ceodeux, Luxembourg), with an internal screw thread to minimise dead volume.
Prior to use, the cylinders were evacuated below 5 × 10⁻⁷ mbar using a turbo molecular pump (Leybold Vacuum, Chessington, UK) then conditioned prior to use using a NPL proprietary treatment.
The compounds were added to the cylinder being filled by direct transfer via a length of 1/16 inch external diameter stainless steel tubing (Swagelok, Kings Langley, UK) that had been internally passivated using the Silcosteel
® process (Thames Restek, High Wycombe, UK). Upon completion of preparation, the mixtures were homogenised by rolling along the vertical axis for two hours. The compositions of the mixtures (amount fraction and associated uncertainty of each compound) were calculated using the software package ‘GravCalc2’ [
18] (NPL, Teddington, UK). The sulphur amount fraction in the gas mixtures prepared is presented in
Table 1.
2.2. Analytical Methods
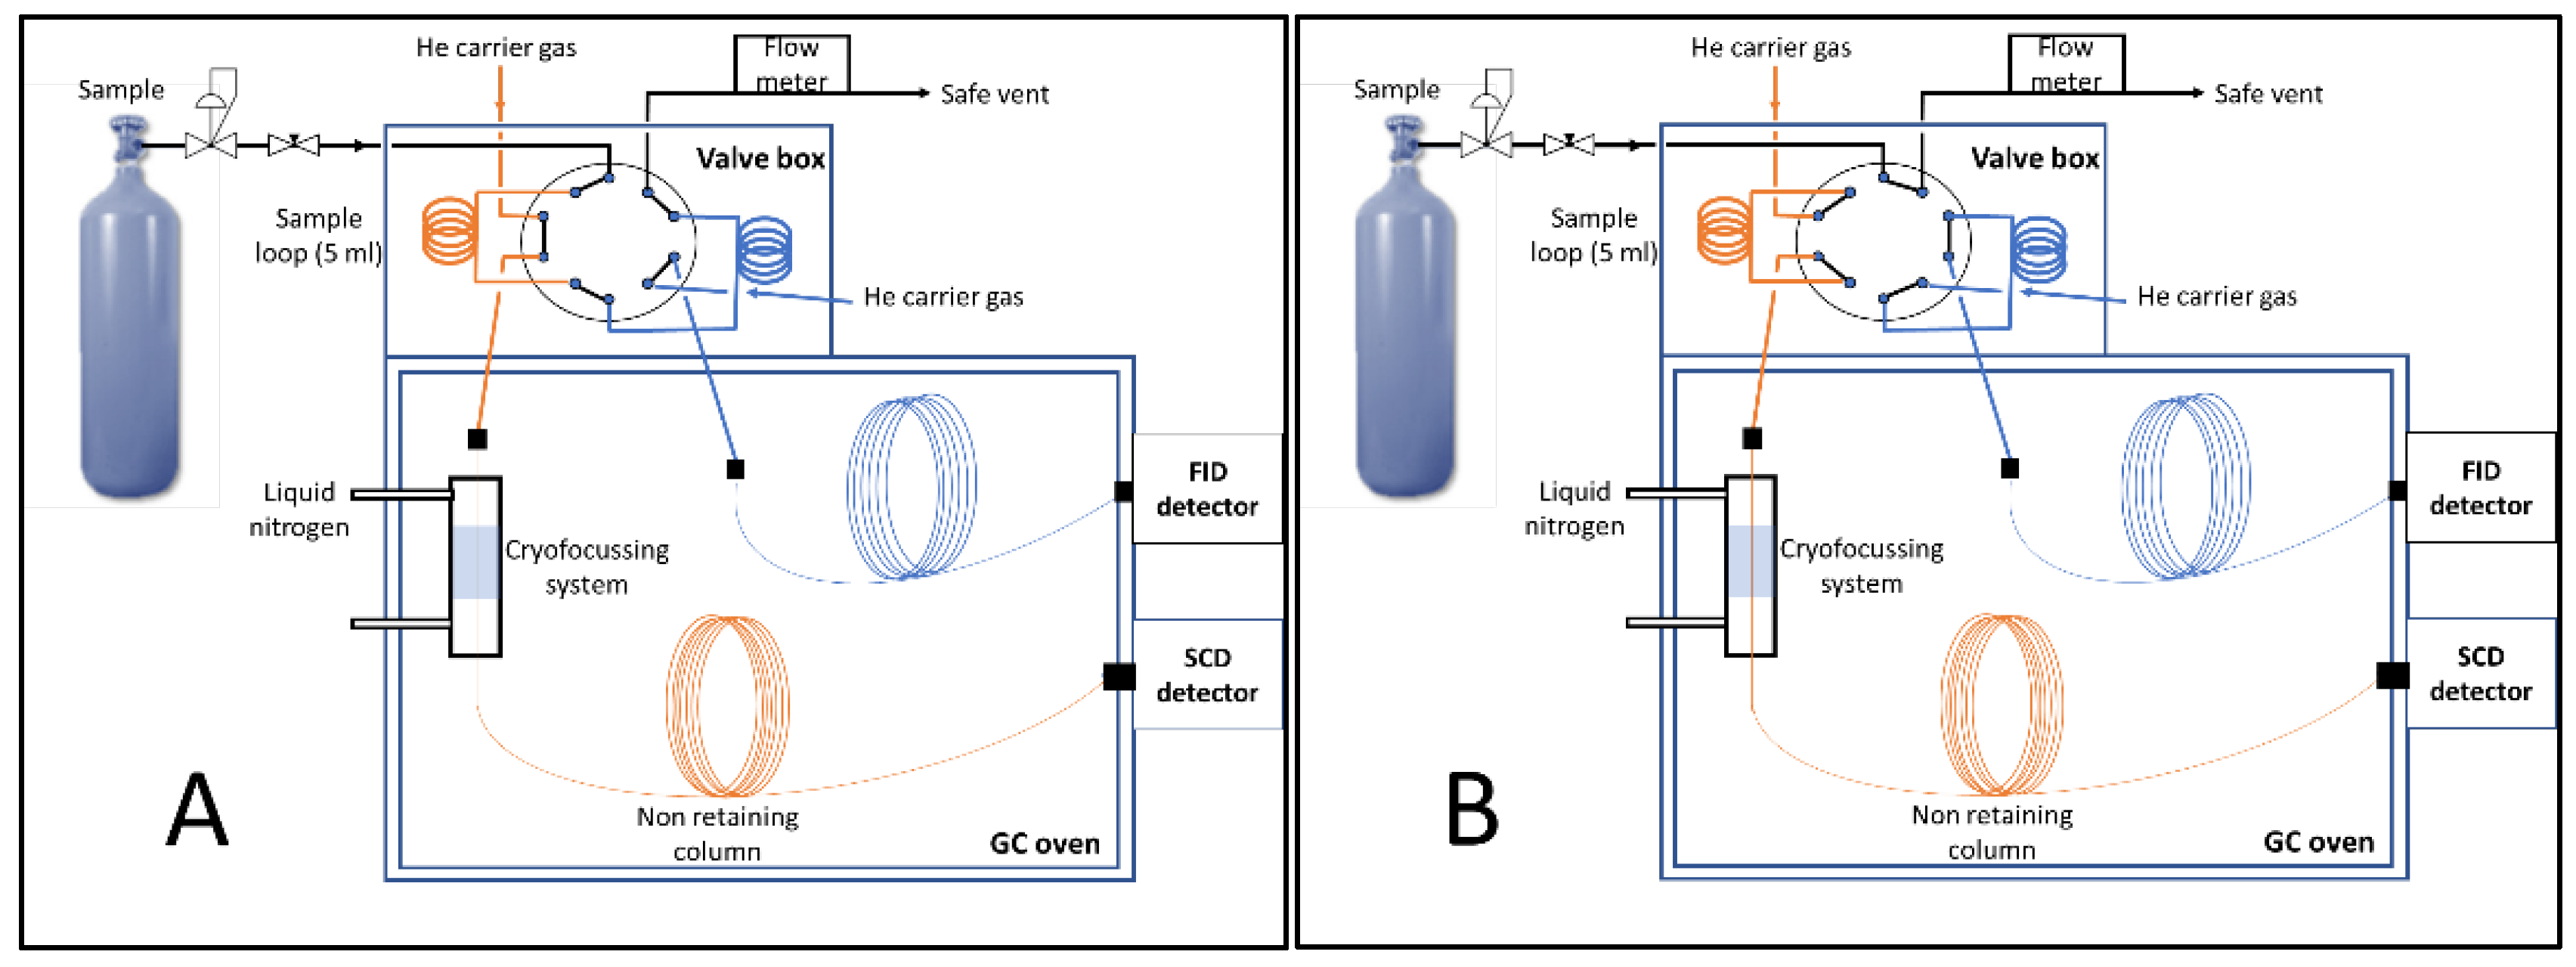
Gas analysis was performed on an Agilent 7890 GC equipped with SCD355 (Agilent, Harwell, UK). The GC contained a liquid-nitrogen-cooled cryo-focussing trap (SIM Scientific Instruments Manufacturer GmbH, Oberhausen, Germany), a 5 mL Silconert
® treated sample loop connected to the SCD side in a heated valve box (80 °C), and a HP-5 column (30 m × 0.320 mm ID × 0.251 µm film thickness, Agilent, Santa Clara, CA, USA). A schematic of the system is presented in the
Figure 1.
The gas standards were connected to the GC via minimum dead volume flow metering valves. All parts of the sampling lines were Silconert
®-treated 1/16-inch external diameter stainless steel tubing. The gas being analysed was set to a flow rate of 80 mL/min and allowed to stabilise for 10 min prior to analysis (
Figure 1A).
At the beginning of the analysis, the cryo-focussing system was held at a temperature of −160 °C. The GC oven was held isothermal at a temperature of 110 °C during the whole analysis. The column used a carrier gas (helium) pressure of 55 psi (isobaric).
Then the sample was injected (start of the analysis) onto the GC column when the valve in the valve box was changing position (
Figure 1B). The injection was performed for 1 min onto the column (valve in position of
Figure 1B). The cryo-focussing trap was held at a temperature of −160 °C for two minutes (one minute with the valve in the position of
Figure 1B and one minute with the valve in the position of
Figure 1A). After two minutes, the cryo-focussing trap heated to 180 °C (temperature ramp: 999 °C/min) for three minutes to rapidly release the compounds onto the column. The analysis was then completed within 5 min. Before the next analysis, the cryo-focussing trap was held at a temperature of −160 °C for at least one minute.
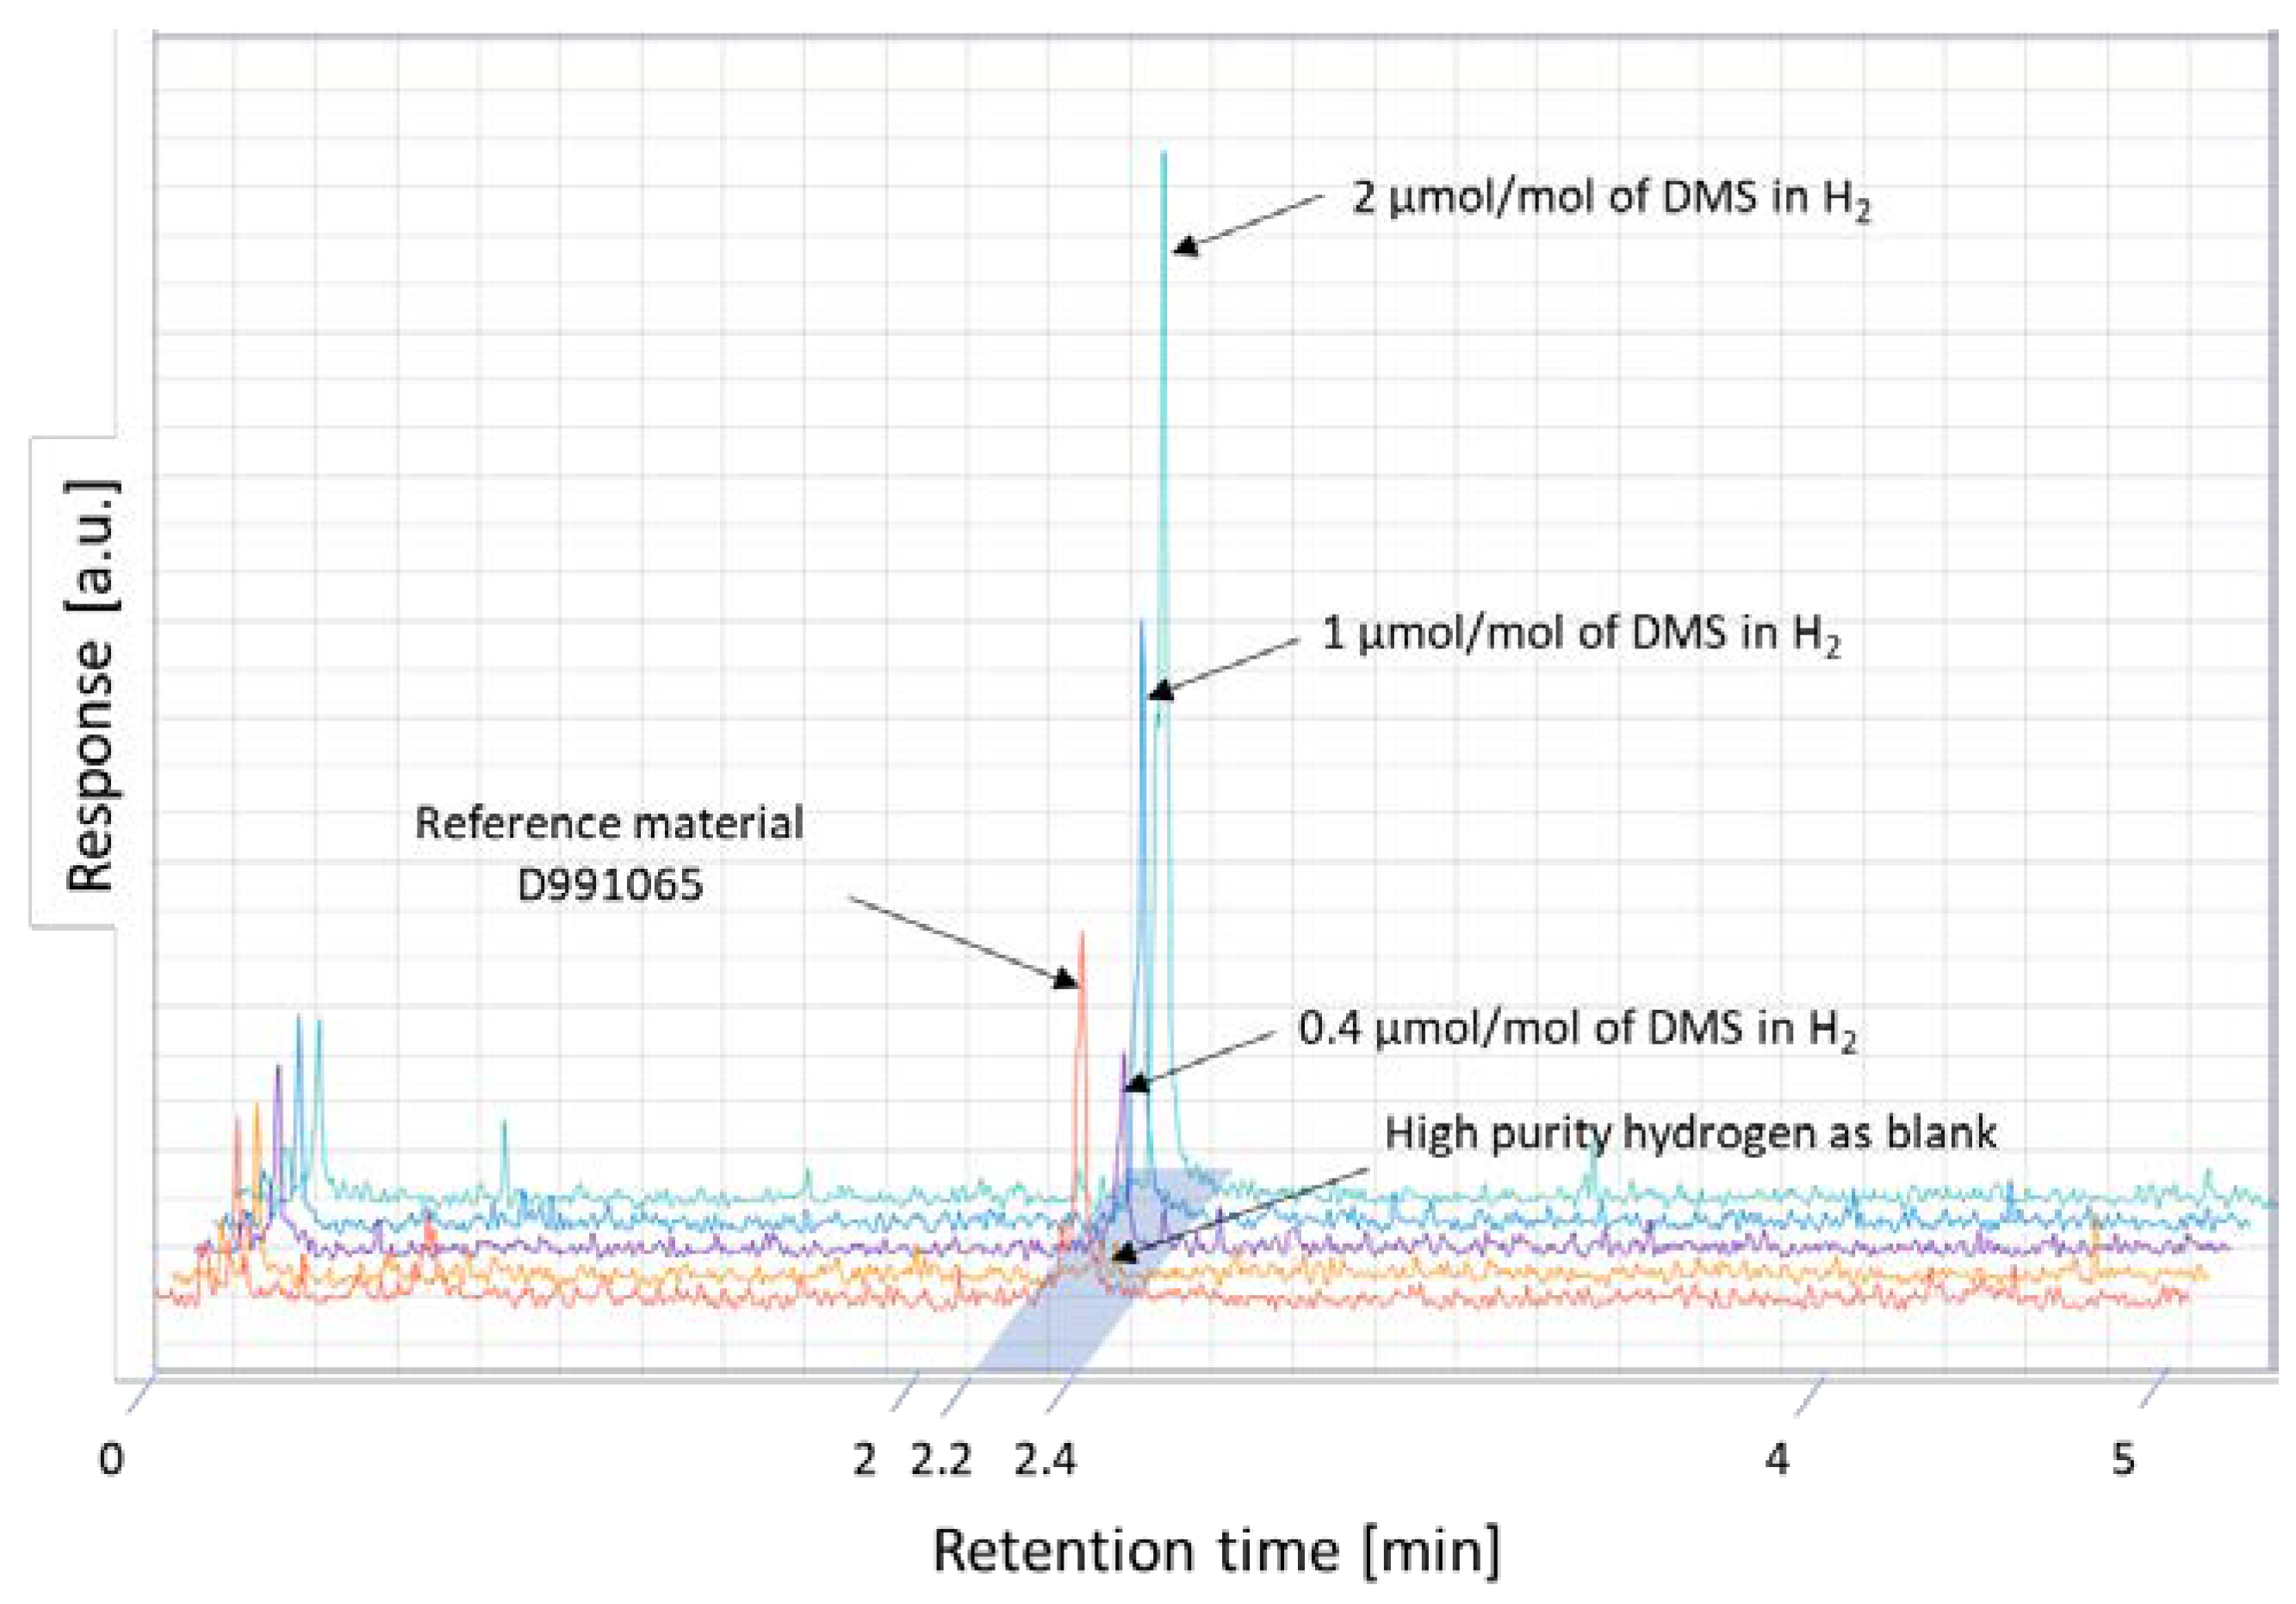
The retention time of the total sulphur peak was between 2.2 to 2.4 min for this method.
2.3. Dynamic Calibration Standards
The cryo-focussing GC-SCD was calibrated using one sulphur compound: either OCS, DMS, or H2S in hydrogen. Dynamic standards were prepared by dilution of NPL PRM (A624R or 2351R2) in high purity hydrogen (H2 BIP+®, Air products, Crewe, UK) using two mass flow controllers (EL-FLOW® Bronkhorst, Veenendaal, The Netherlands) calibrated for hydrogen gas.
The gas standards were connected to a pressure regulator set to 5.5 bar. The mass flow controllers were calibrated for an input pressure of 5.5 bar and outlet pressure of 1 bar. The mass flow controllers were operating 5–100%. The mass flow controller of high purity hydrogen was set to 1 L/min (50% of the full range). The mass flow controller and the pressure regulator of the NPL PRM were sulfinert-treated. The mass flow controller was set to 100 mL/min (100% of the full range).
The dynamic standards generated were used to produce a calibration curve for the total sulphur measurement by cryo-focussing GC-SCD. The dynamic standards shown in
Table 2 were used in the calibration curve.
2.4. Method Performance
2.4.1. Linearity
The cryo-focussing analytical method linearity was assessed on different occasions with a minimum of four points between 150–6000 picomol/mol. The different calibration points were generated dynamically according to the methodology described in
Section 2.3.
2.4.2. Trueness
To determine if the method has a bias, the cryo-GC-SCD method was tested using a NPL PRM, with certified amount fraction of OCS in hydrogen at 349 picomol/mol (
Table 3). The measured values of the reference gas mixture were compared with the certified value according to application note 1 [
19]. The reference gas mixture reference value was 349 picomol/mol and was assessed over two different days. An uncertainty of 11 picomol/mol was assigned to the reference value as a gravimetric uncertainty.
Additionally, the trueness of the measurement was assessed for other sulphur compounds (DMS and H2S). For these two sulphur compounds, a dynamically generated standard was produced. Dynamic standards were prepared by dilution of NPL PRM in high purity hydrogen (H2 BIP+®, Air products, Crewe, UK) using two mass flow controllers (EL-FLOW® Bronkhorst, NL) calibrated for hydrogen gas. NPL reference gas mixtures were used to assess DMS and H2S trueness at picomol/mol.
The standard gas mixtures were measured by cryo-focussing GC-SCD and quantified by a calibration curve generated using an OCS in hydrogen calibration standard (dynamically generated or PRM). XLGenlinev2 software (version 2, NPL, Teddington, UK) [
20] was used to calculate the amount fraction of total sulphur in the three reference gas mixtures.
2.5. Real Hydrogen Fuel Samples from Hydrogen Refuelling Station
Samples from hydrogen refuelling stations were obtained in 2021 (three independent sampling campaigns) from various hydrogen refuelling stations (HRS) in Europe. The locations were anonymized in agreement with the HRS operators, but hydrogen feedstock information was provided.
The samplings were performed using the H2 Qualitizer (HRS 5–6) and the HySaM system (HRS 1–4 and 7–11). The samplings were performed according to the methodology presented in the peer review article of Aarhaug et al. [
16]. The samplings were performed by NPL, SINTEF, and ZSW. The samplings cylinders were aluminium cylinder 10 L with SGS finish (Luxfer, UK) for HRS 1–7 and 9; aluminium cylinder 10 L with spectraseal passivation (BOC, UK) for HRS 2 and 10–11.
3. Results and Discussion
3.1. Analytical Method Performance at picomol/mol Amount Fraction
NPL developed an analytical method based on cryo-GC-SCD. The analytical method performance was assessed following several parameters: linearity, precision, and trueness.
The analytical method was proven linear from 150 to 16,000 nmol/mol (minimum of four independent calibration points) with a coefficient of regression better than 0.995 on three different occasions. It should be noted that even though the method was linear, the slope of regression was changing significantly. It can be related to the sensitivity change of the detector. The method requires a daily calibration to ensure the accuracy of the measurements.
Figure 2 presents chromatograms of different calibration points and reference materials.
The precision was assessed through the repeated analysis of reference material at picomol/mol. Measurement of the reference material at 349 picomol/mol was performed over two days (six replicate analysis each day). Statistical analysis was performed to determine the repeatability and the intermediate precision of the measurement. The results showed a relative repeatability of 5.1% and relative intermediate precision (between days) of 9.3%. It led to a relative precision uncertainty of 10.7% (k = 1) at 349 picomol/mol. These results demonstrated the performance of the method at picomol/mol, its suitability to measure sulphur compound accurately, and its compatibility with ISO 21087 requirements.
The method is linear from 0.15–16 nmol/mol with relative uncertainty of 22% (k = 2) and proven performance through measurement of reference materials at picomol/mol amount fraction. The method was therefore suitable to be applied to real hydrogen fuel samples.
The limit of detection (LOD) of the cryo-focussing GC-SCD method was estimated using an average blank response plus the standard deviation of the lowest standard point (i.e.,150 picomol/mol) from a dynamic standard calibration curve. It represents the lowest signal that can be significantly detected from the background signal with a 95% confidence level. The LOD was estimated on several occasions and ranged from 70–160 picomol/mol depending on the instrument response.
3.2. Information on Stability of Sulphur Gas Standard at picomol/mol in Hydrogen
During the study, NPL prepared several picomol/mol sulphur primary reference materials. The measurements presented in this study highlight the challenges and emerging results related to the stability of sulphur compounds at picomol/mol in different gas cylinders. It has been observed that the stability of dimethyl sulphide was better in an aluminium performax cylinder compared to aluminium spectraseal. The analysis of cylinder D991065 agreed with the NPL reference value (at 95% confidence level) for 4 months, while measurement of cylinder A501R4 showed a significantly lower value after 1 month.
OCS was considered stable in the aluminium spectraseal cylinder. Measurement of sulphur amount fraction in cylinder 2079R2 after 1 year agreed with the NPL reference value with a 95% confidence level.
Hydrogen sulphide was unstable in aluminium spectraseal. It would be interesting to perform a stability study on the Performax and new passivated cylinder for H2S at picomol/mol.
The limited results from the study highlight the difficulty to find a cylinder type suitable for long-term stability of all sulphur compounds at picomol/mol in hydrogen fuel; however, it demonstrated that some cylinder types were promising for the development of reference materials. There is a need to continue stability studies for low sulphur amount fraction reference materials in hydrogen to support the deployment of new analytical methods able to measure picomol/mol of sulphur in hydrogen fuel.
3.3. Application to Hydrogen Fuel from Hydrogen Refuelling Stations
The cryo-focussing GC-SCD method was applied to several hydrogen fuel samples collected in Europe (
Table 4). The cryo-focussing GC-SCD analysis involved use of an NPL reference material to ensure the accuracy of the measurement sequence (e.g., D991065, 2079R2, or D828042R). The agreement between the NPL reference value and the measured values was checked according to Application Note 1 [
5]. With a 95% confidence level, the NPL reference value and the measured value agreed on all occasions. It ensured the reliability of the hydrogen fuel analysis and that the analytical method was fit for the purpose.
The results from the 11 HRS samples showed a really low amount fraction of total sulphur with the highest value around 290 picomol/mol (
Table 4). Most of the results reported are below the limit of detection of 160 picomol/mol which supports the assumption that sulphur amount fraction is significantly lower than the standard LOD of 1 nmol/mol.
No correlation was observed between the hydrogen feedstock and the level of total sulphur.
This results at picomol/mol were compared with other relevant literature [
15,
16]. Smart Chemistry presented a value for total sulphur in the range of 4–16 nmol/mol for HRS samples in [
15] and 10–130 nmol/mol for HRS samples [
16] using method ASTM D7652 (withdrawn in 2020). This method used cryo-trapping and GC-SCD and achieved a better limit of detection. The values obtained from the real HRS samples were in similar order of magnitude as this study. However, there is no information about method validation using nmol/mol sulphur reference materials.
It is important to continue gathering data across a wide range of hydrogen refuelling stations to obtain a better understanding of total sulphur amount fraction in hydrogen fuel at picomol/mol.
3.4. Implication for Hydrogen Fuel Quality
The methodology presented in this study demonstrated that it is possible to perform accurate measurement of total sulphur amount fraction in hydrogen fuel at picomol/mol amount fraction. The application on a real hydrogen fuel sample showed that the total sulphur amount fraction was more than 10 times lower than the actual ISO 14687:2019 threshold in the 11 real hydrogen fuel samples analysed. This new methodology would support better knowledge of the actual total sulphur amount fraction in hydrogen fuel. It will help develop better monitoring of sulphur compounds which are known to irreversibly impact FCEV performance.
Even if the performance of the method improves the current total sulphur analysis state of the art, it requires specific equipment as GC-SCD, cryo-focussing system with liquid nitrogen, dynamic dilution system sulfinert-coated, and reference standard at nmol/mol and picomol/mol. However, the picomol/mol limit of detection would be important to gather new, sensitive, and accurate information about the sulphur amount fraction in hydrogen fuel. For example, a large research study including an analytical campaign would provide new insight to industry for understanding the current total sulphur levels. As the current state-of-the-art equipment for commercial laboratories provides a limit of detection close to 1 nmol/mol, this new method is 5–10 time more sensitive for total sulphur amount fraction. Finally, this new methodology is an enabler for further revision (e.g., reduction) of the sulphur threshold in ISO14687:2019.
4. Conclusions
This manuscript presents a novel analytical method to accurately determine total sulphur at picomol/mol in hydrogen fuel. The cryo-focussing GC-SCD method is linear between 150–16,000 picomol/mol and an expanded relative uncertainty (k = 2) is estimated around 22%. It demonstrated the performance of the method and coherence with ISO 21,087 requirements for a hydrogen fuel quality analytical method.
The analytical method was used to assess total sulphur amount fraction in 11 hydrogen fuel samples from European HRSs in 2021. The results showed a really low amount fraction of total sulphur in all the HRS sampled with the highest value around 290 picomol/mol. The total sulphur amount fraction was more than 10 times lower than the ISO 14687:2019 threshold in all hydrogen fuel samples analysed. Even if the analytical method described in this study is not suitable for routine monitoring of fuel quality, it is important to perform more hydrogen fuel quality analysis, especially at picomol/mol amount fraction for sulphur to develop a better understanding of hydrogen fuel quality worldwide. These results would support confidence in hydrogen fuel quality and the durability of the FCEVs. Once the total sulphur amount fraction is measured, a speciation method would need to be developed at the relevant amount fraction (i.e., low picomol/mol) to clearly identify which sulphur compounds are present in hydrogen fuel.
Additionally, the study provided the first result on primary reference materials for picomol/mol sulphur in a hydrogen cylinder. The limited results from the study highlight the challenges of finding a cylinder type suitable for long-term stability of all sulphur compounds at picomol/mol in hydrogen fuel; however, it demonstrated that some cylinder types were promising for the development of reference materials at picomol/mol (i.e., aluminium Performax or aluminium SGS for dimethyl sulfide or hydrogen sulphide, aluminium Spectraseal for OCS). Further studies are required to evaluate long-term stability and investigate other type of cylinders.


 ,
, 

