
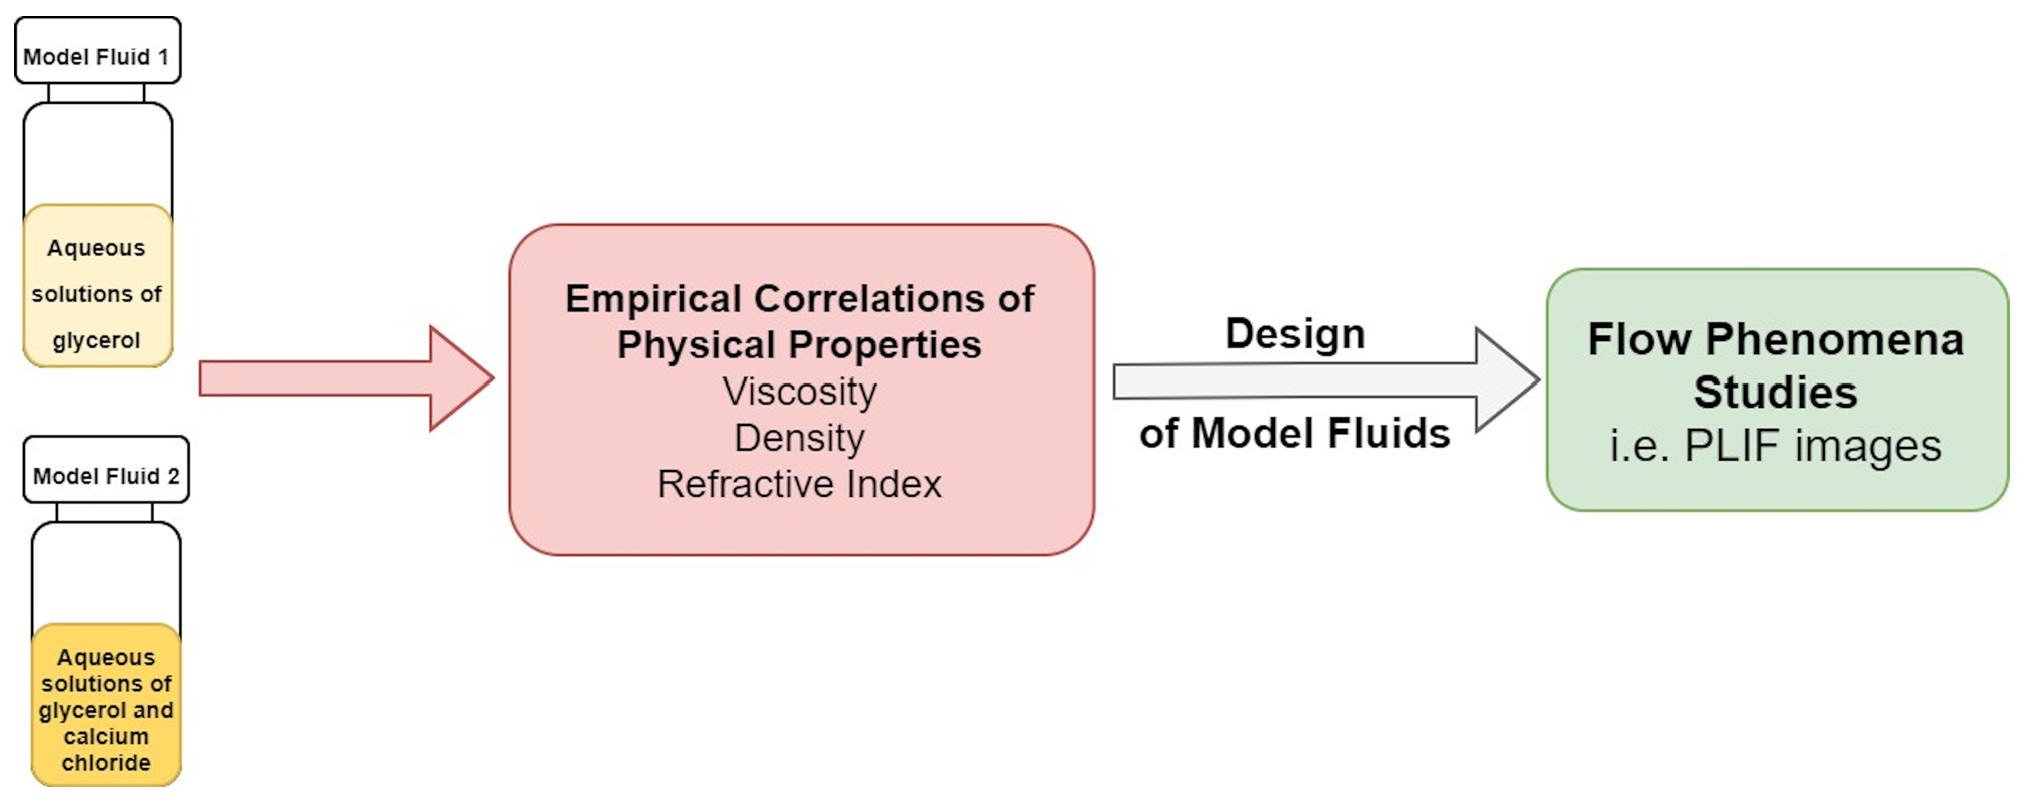
Design of Model Fluids for Flow Characterization Experiments Involving Mixing of Dissimilar Fluids—Refractive Index Matching and Physical Properties


Abstract
: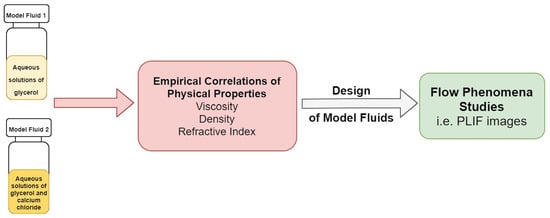
1. Introduction
- RIM of fluids and the walls of the flow geometry;
- RIM of two fluids in the same flow.
2. Experimental Section
2.1. Materials
2.2. Methods
3. Results and Discussion
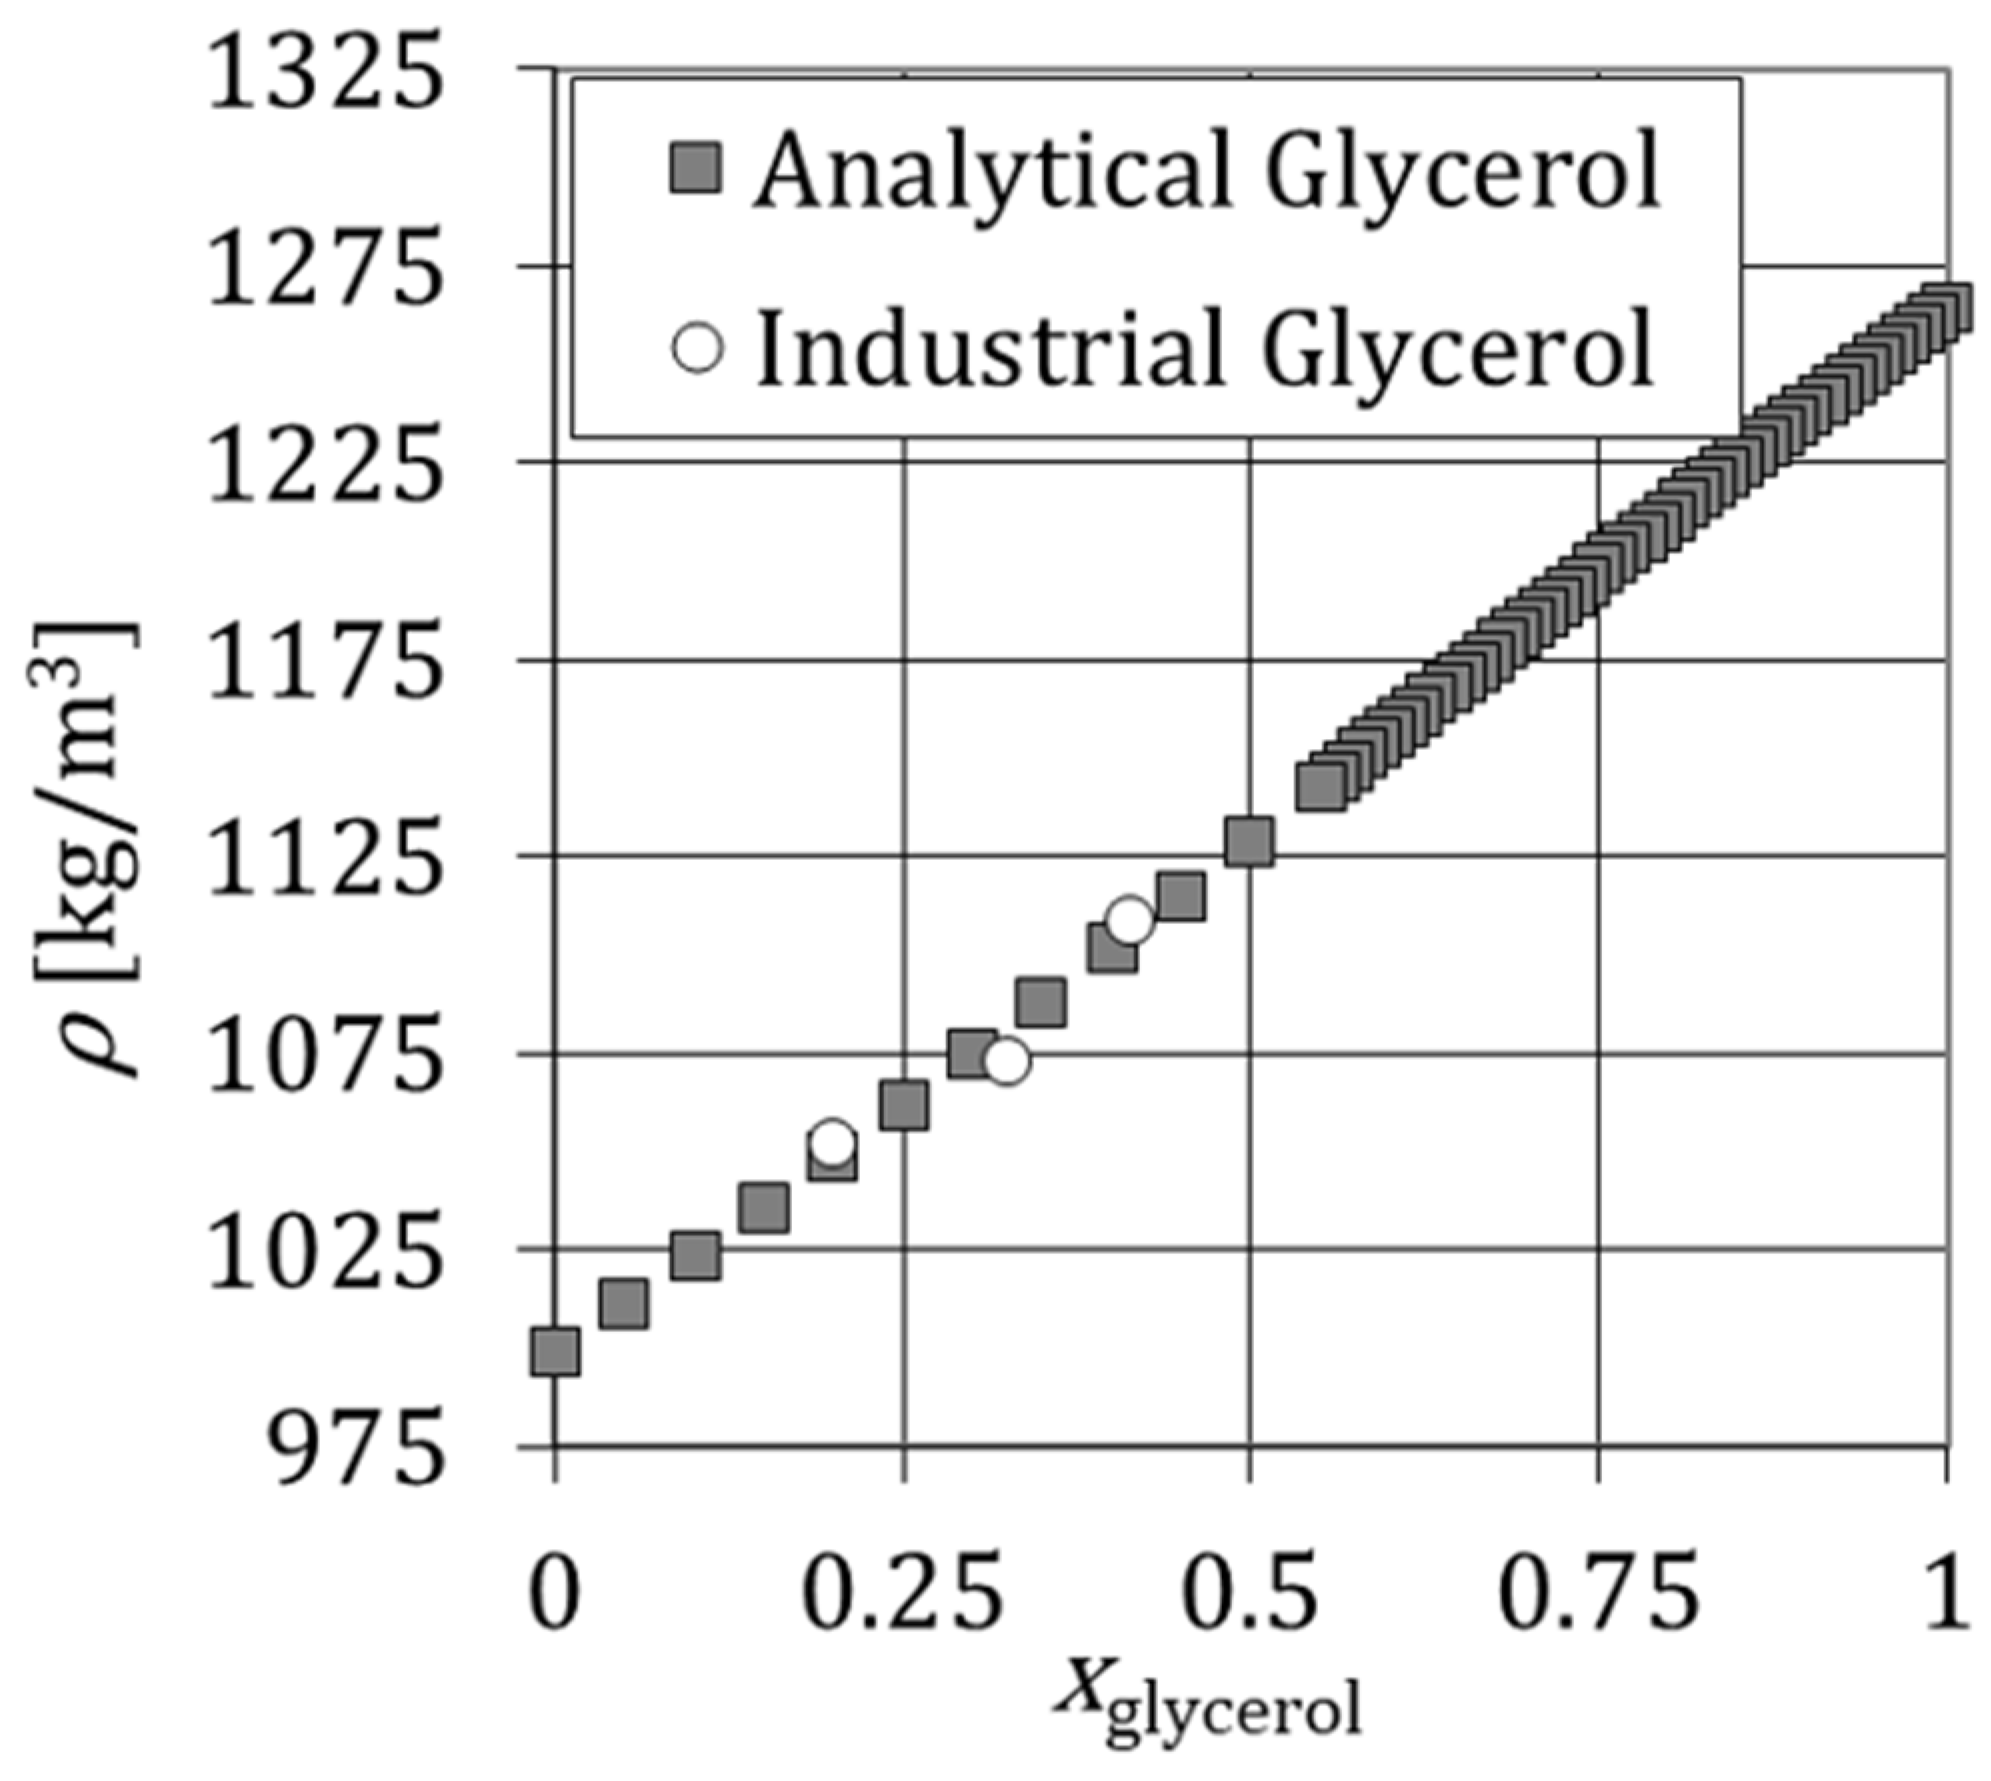
Density of Glycerol Solutions
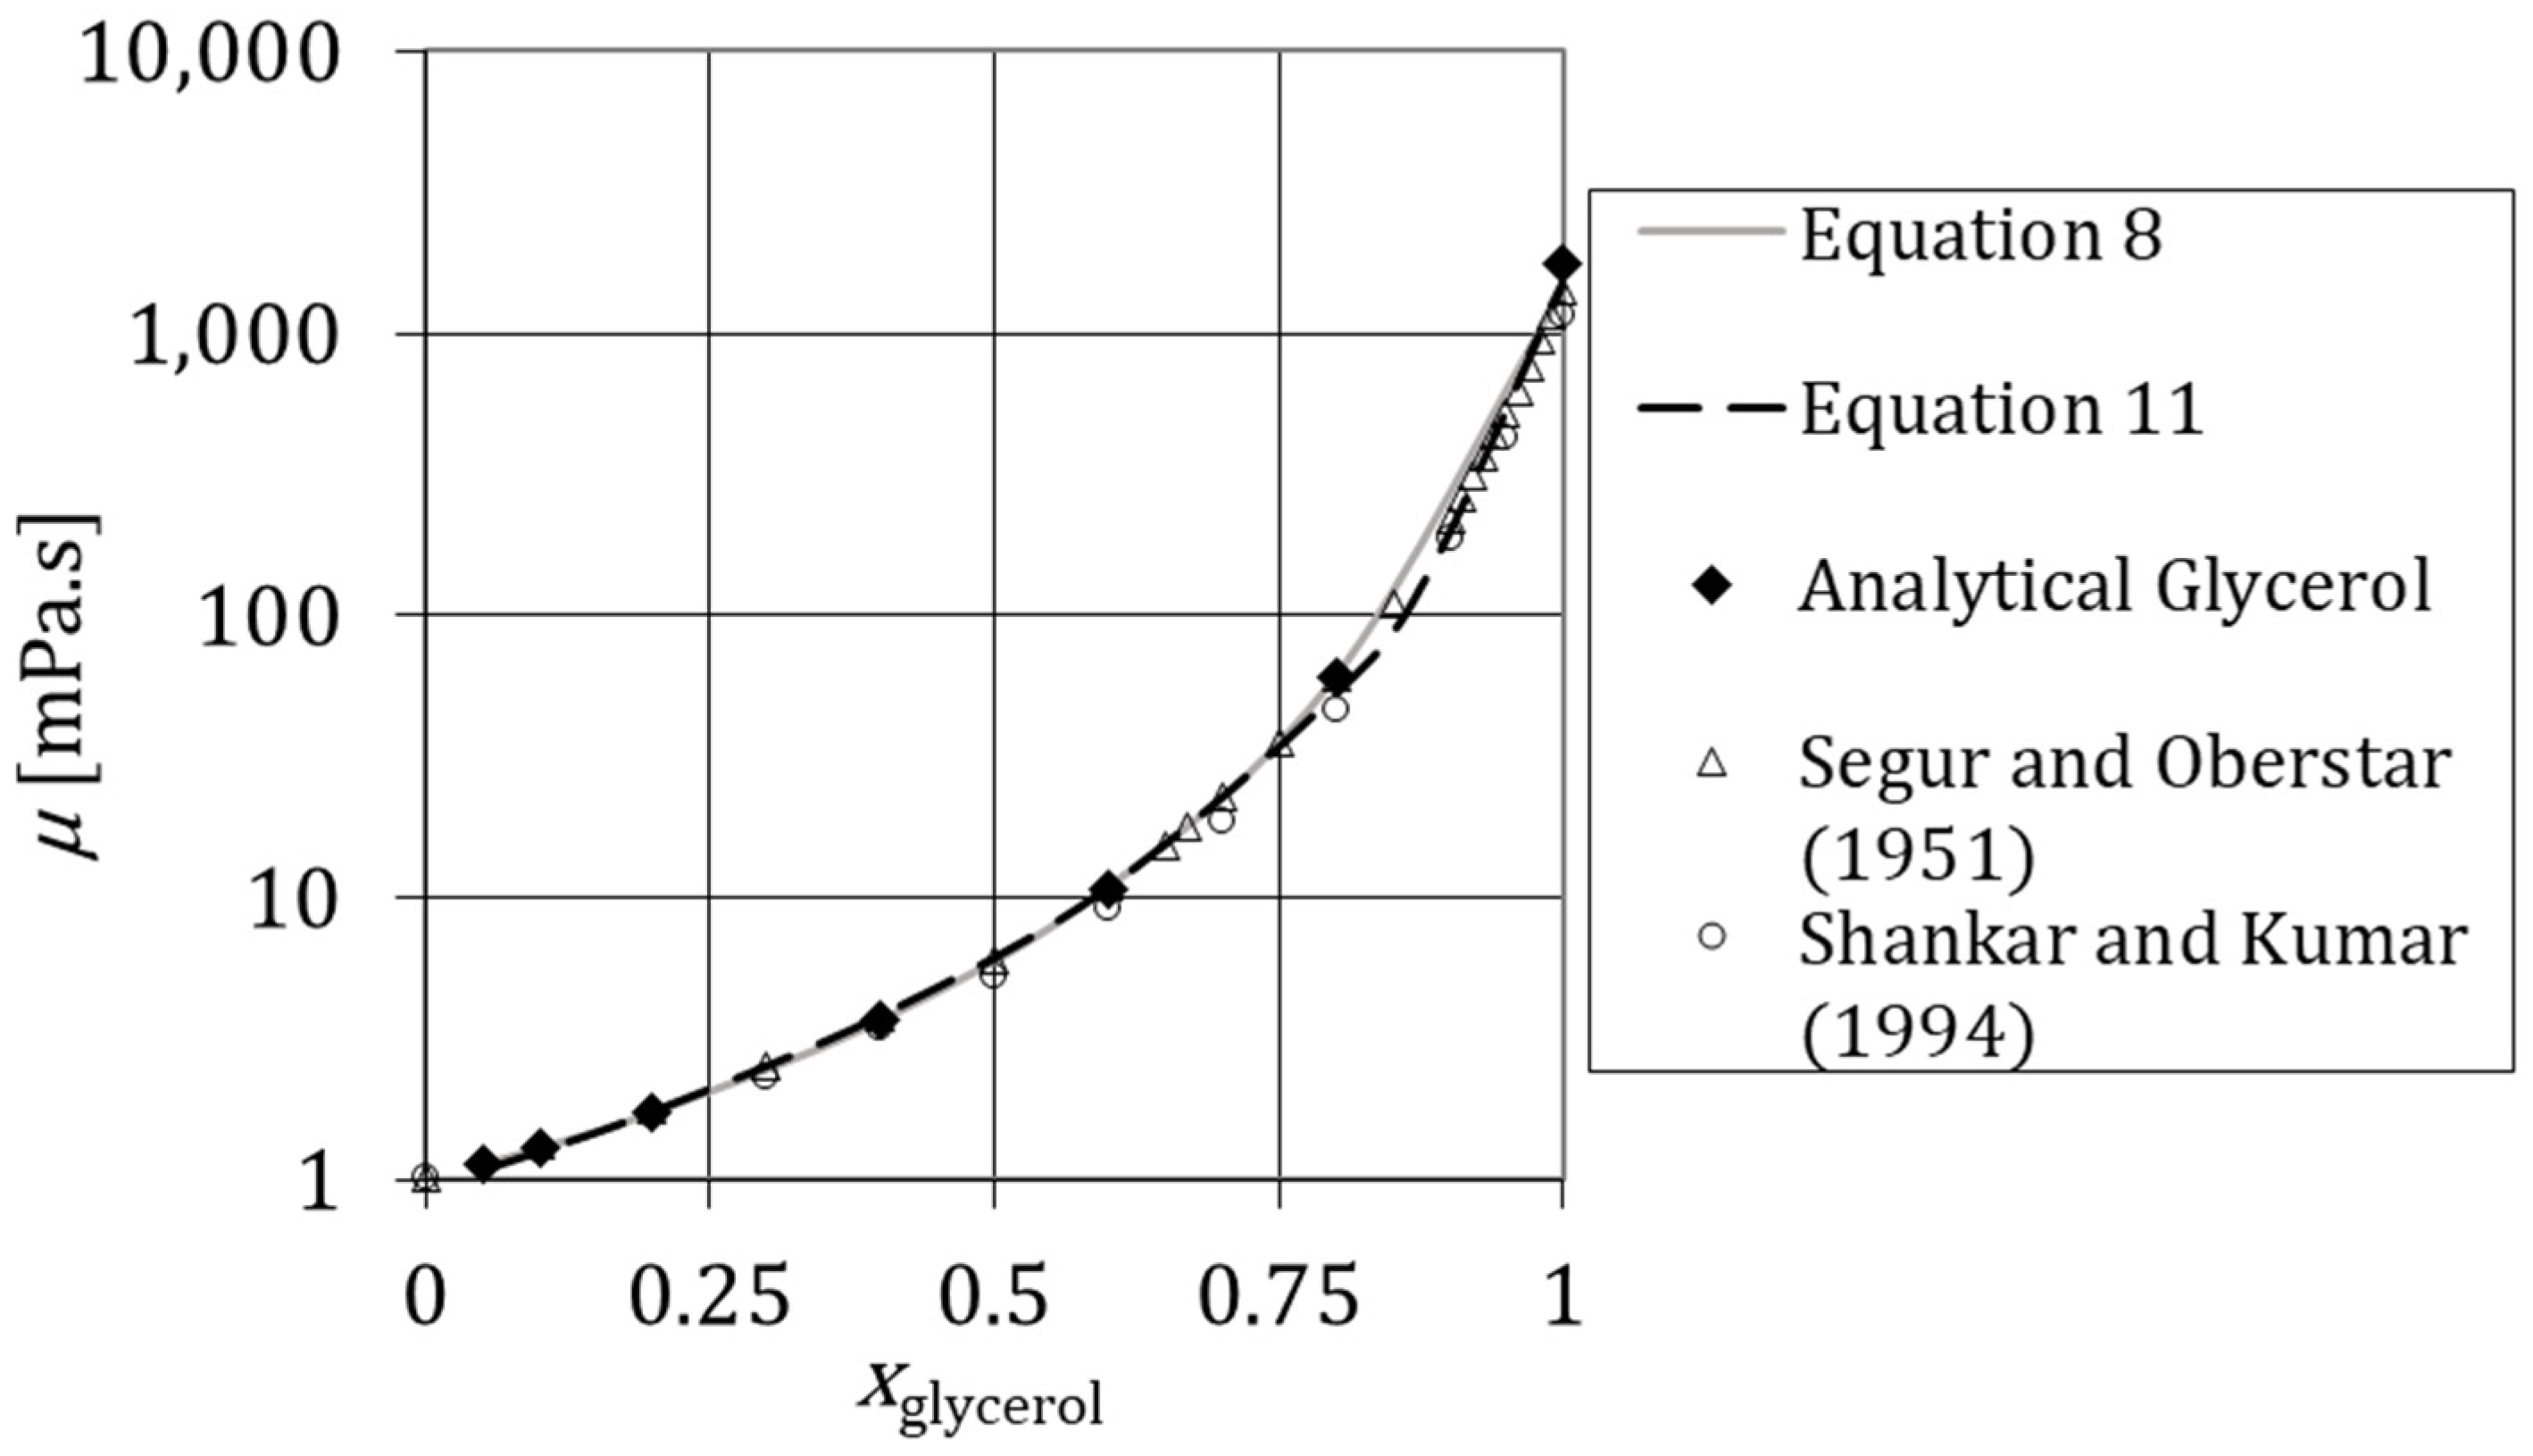
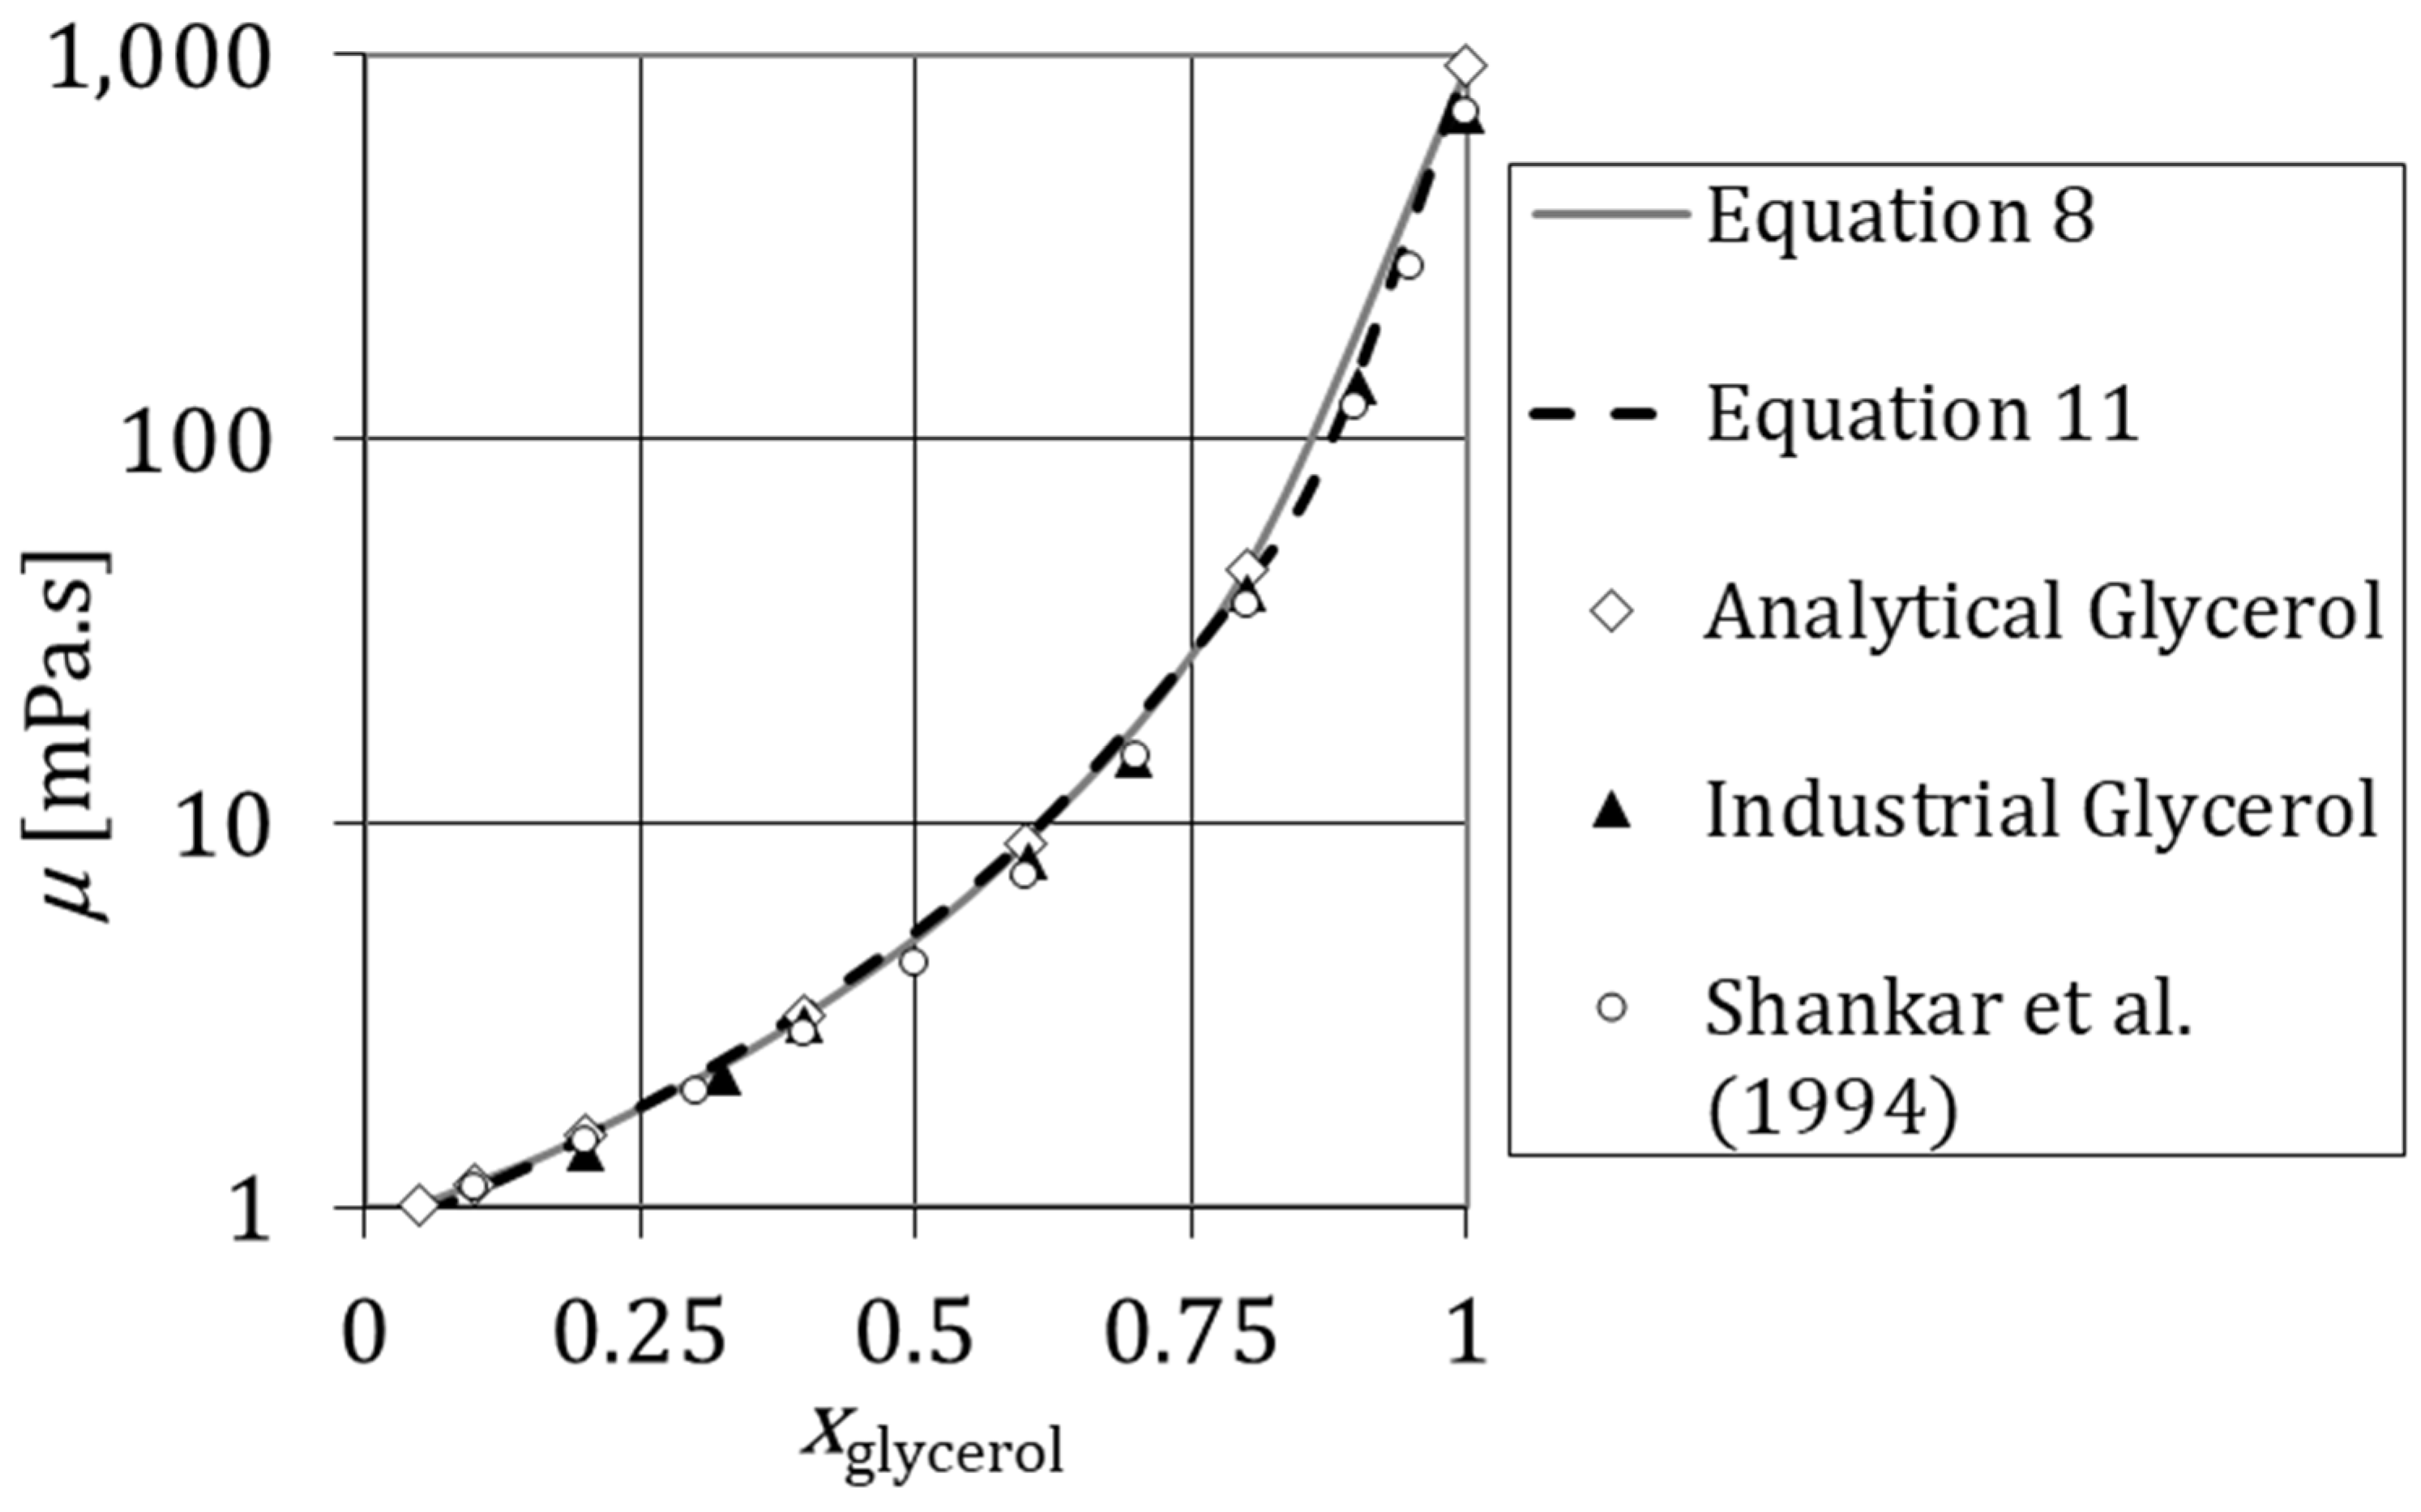
4. Viscosity of Glycerol Solution
5. Refractive Index of Glycerol Solution
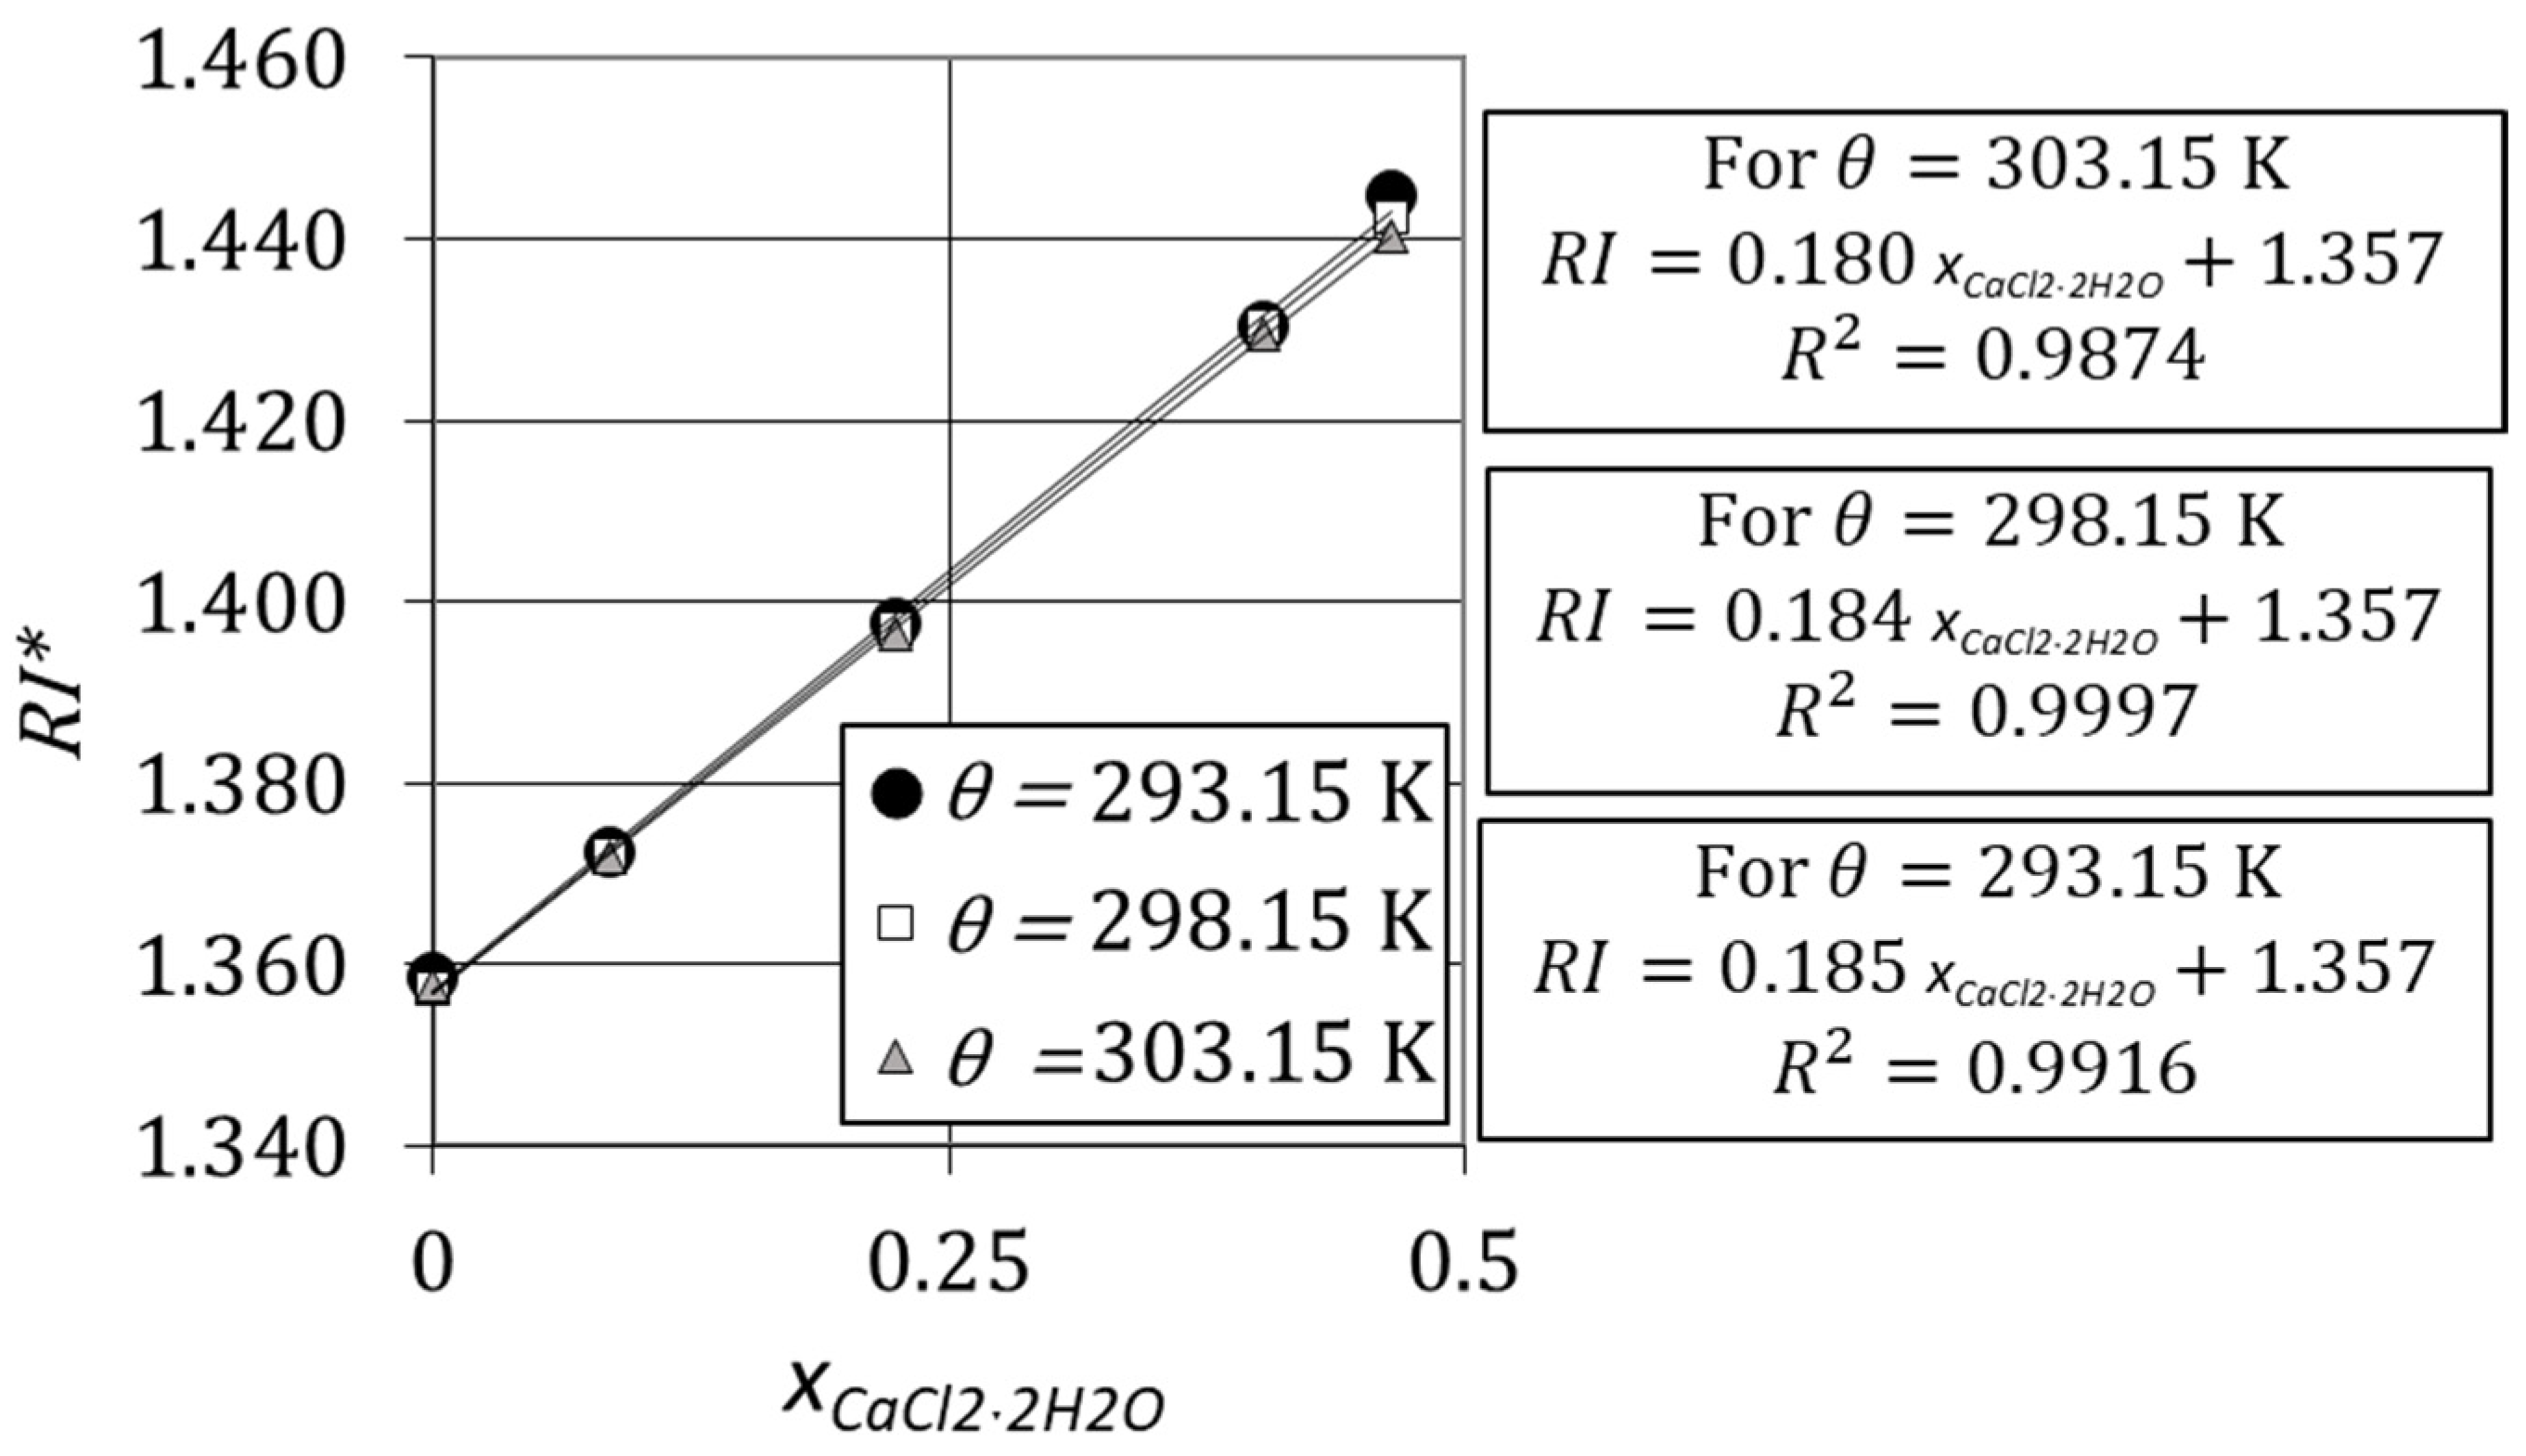
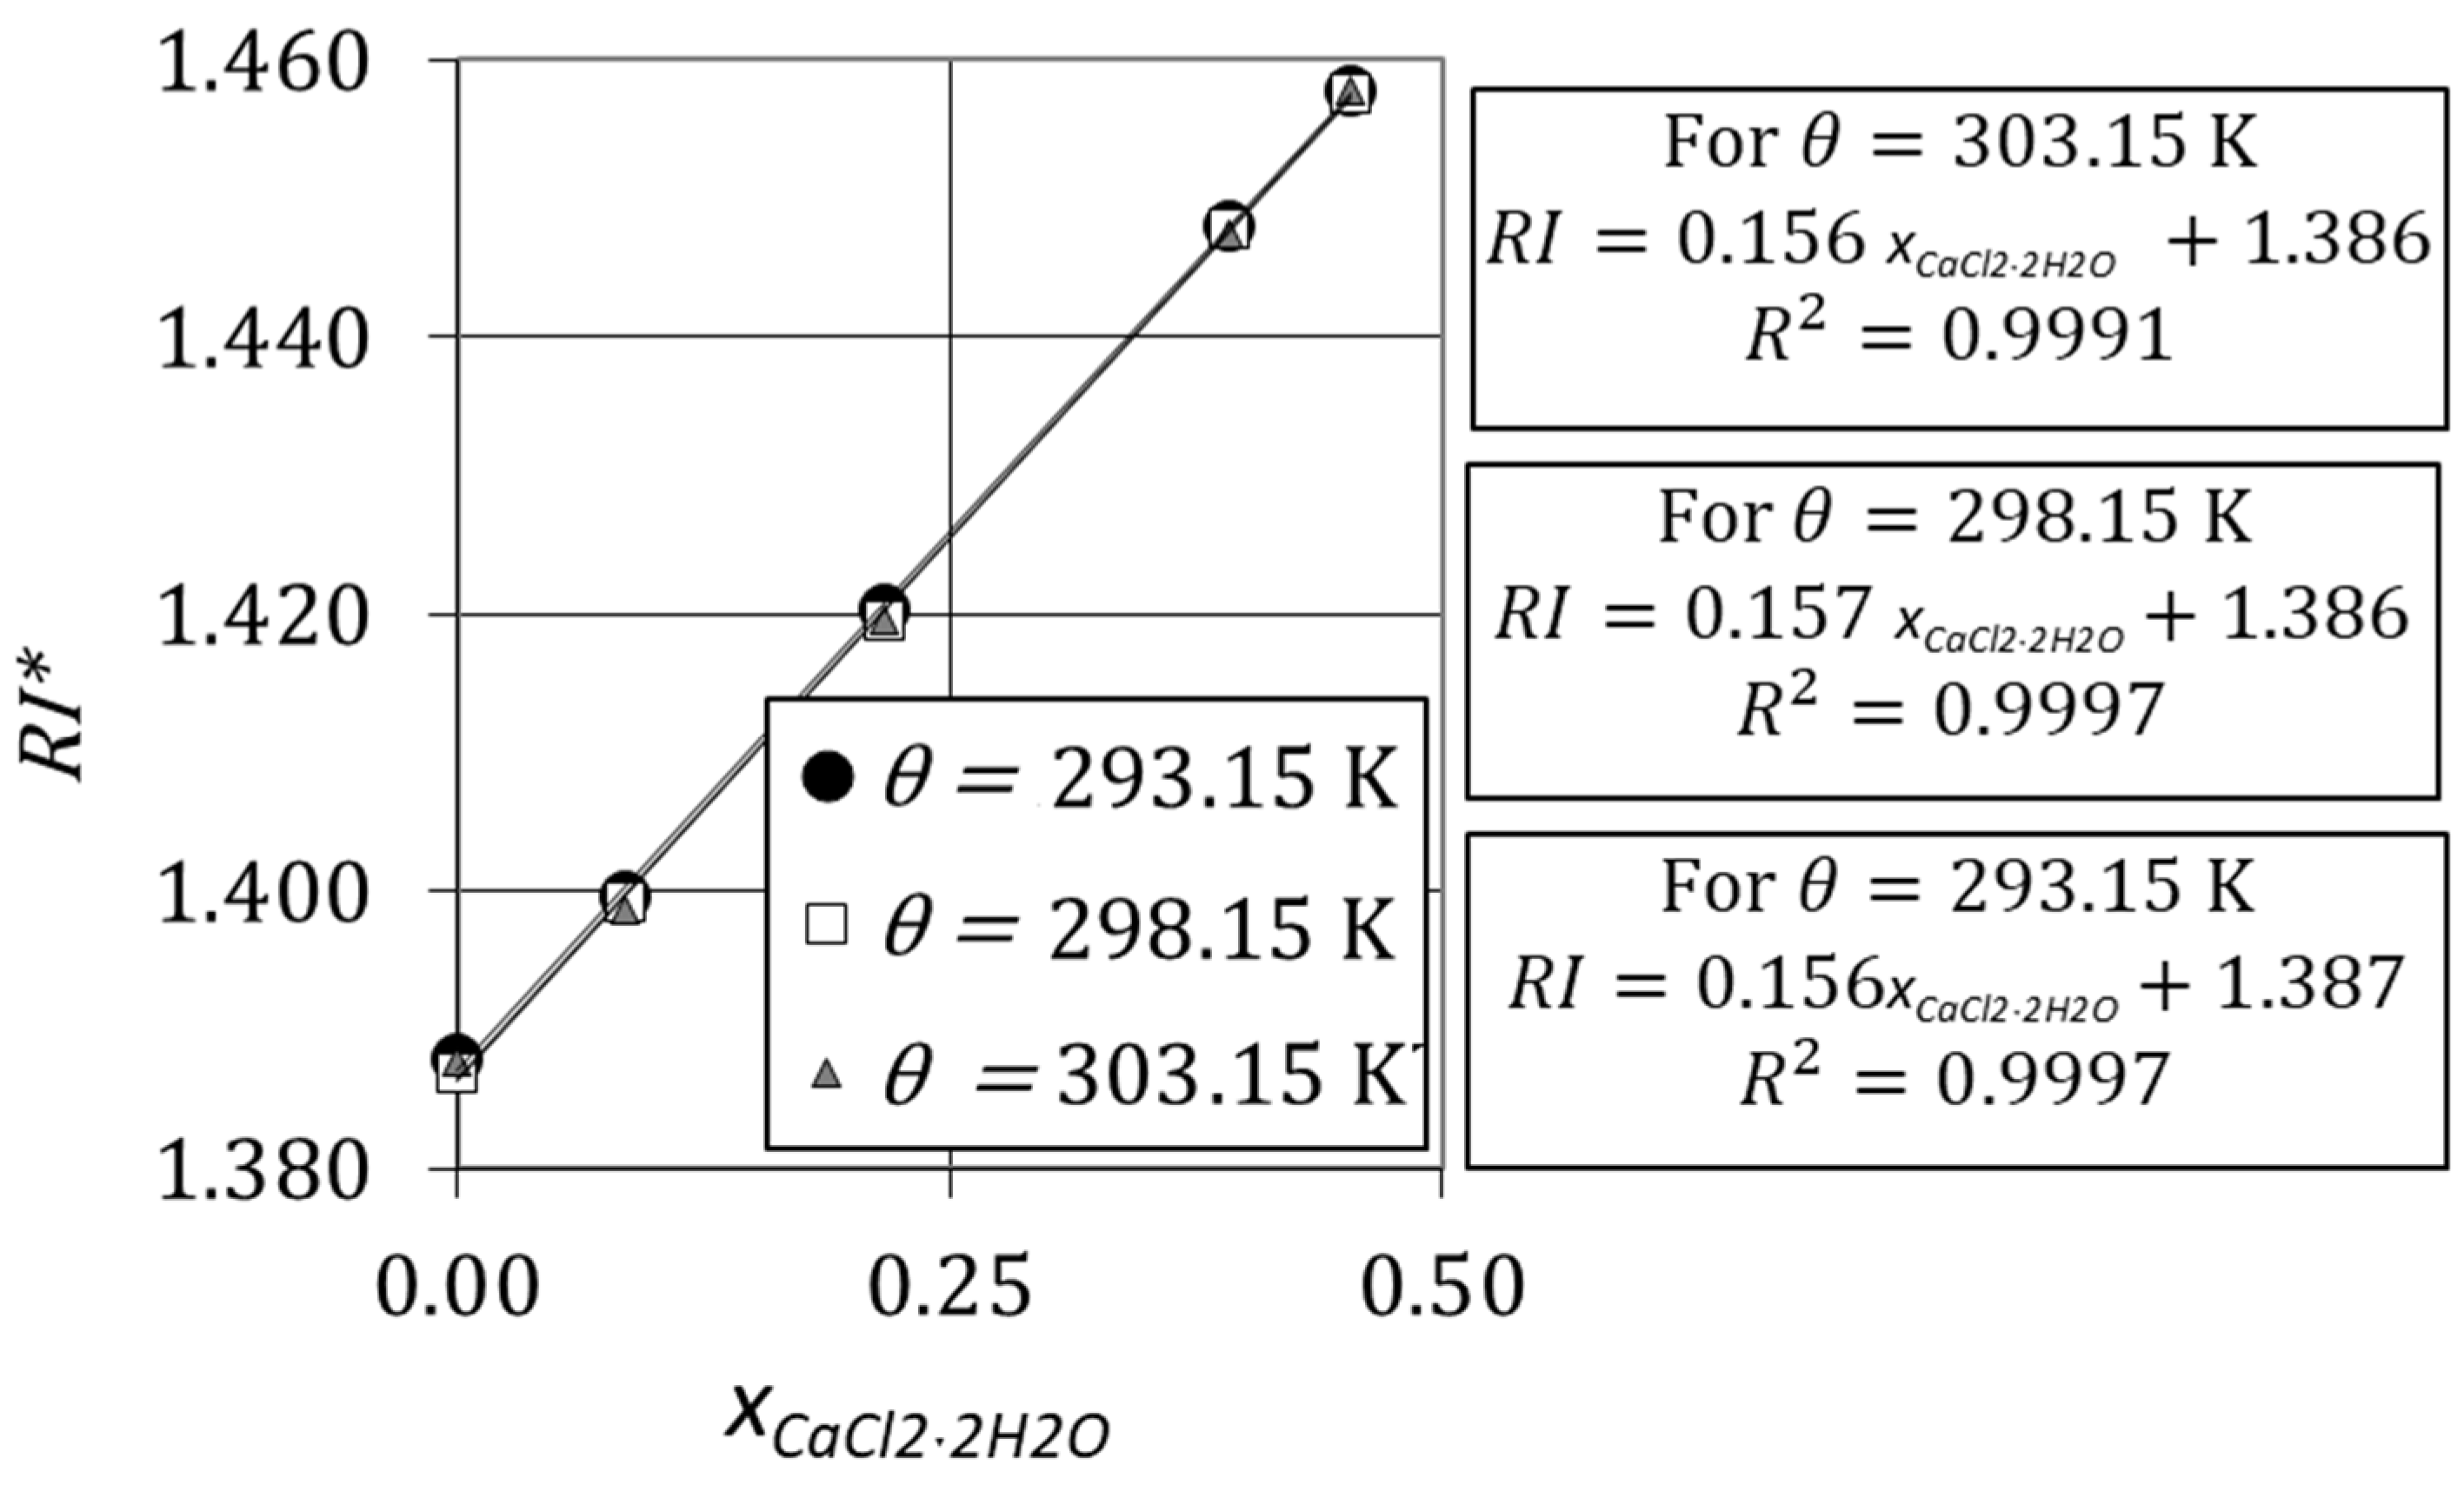
6. Refractive Index of Aqueous Solutions of Glycerol and Calcium Chloride Dihydrate
7. Density of Aqueous Solutions of Glycerol and Calcium Chloride Dihydrate
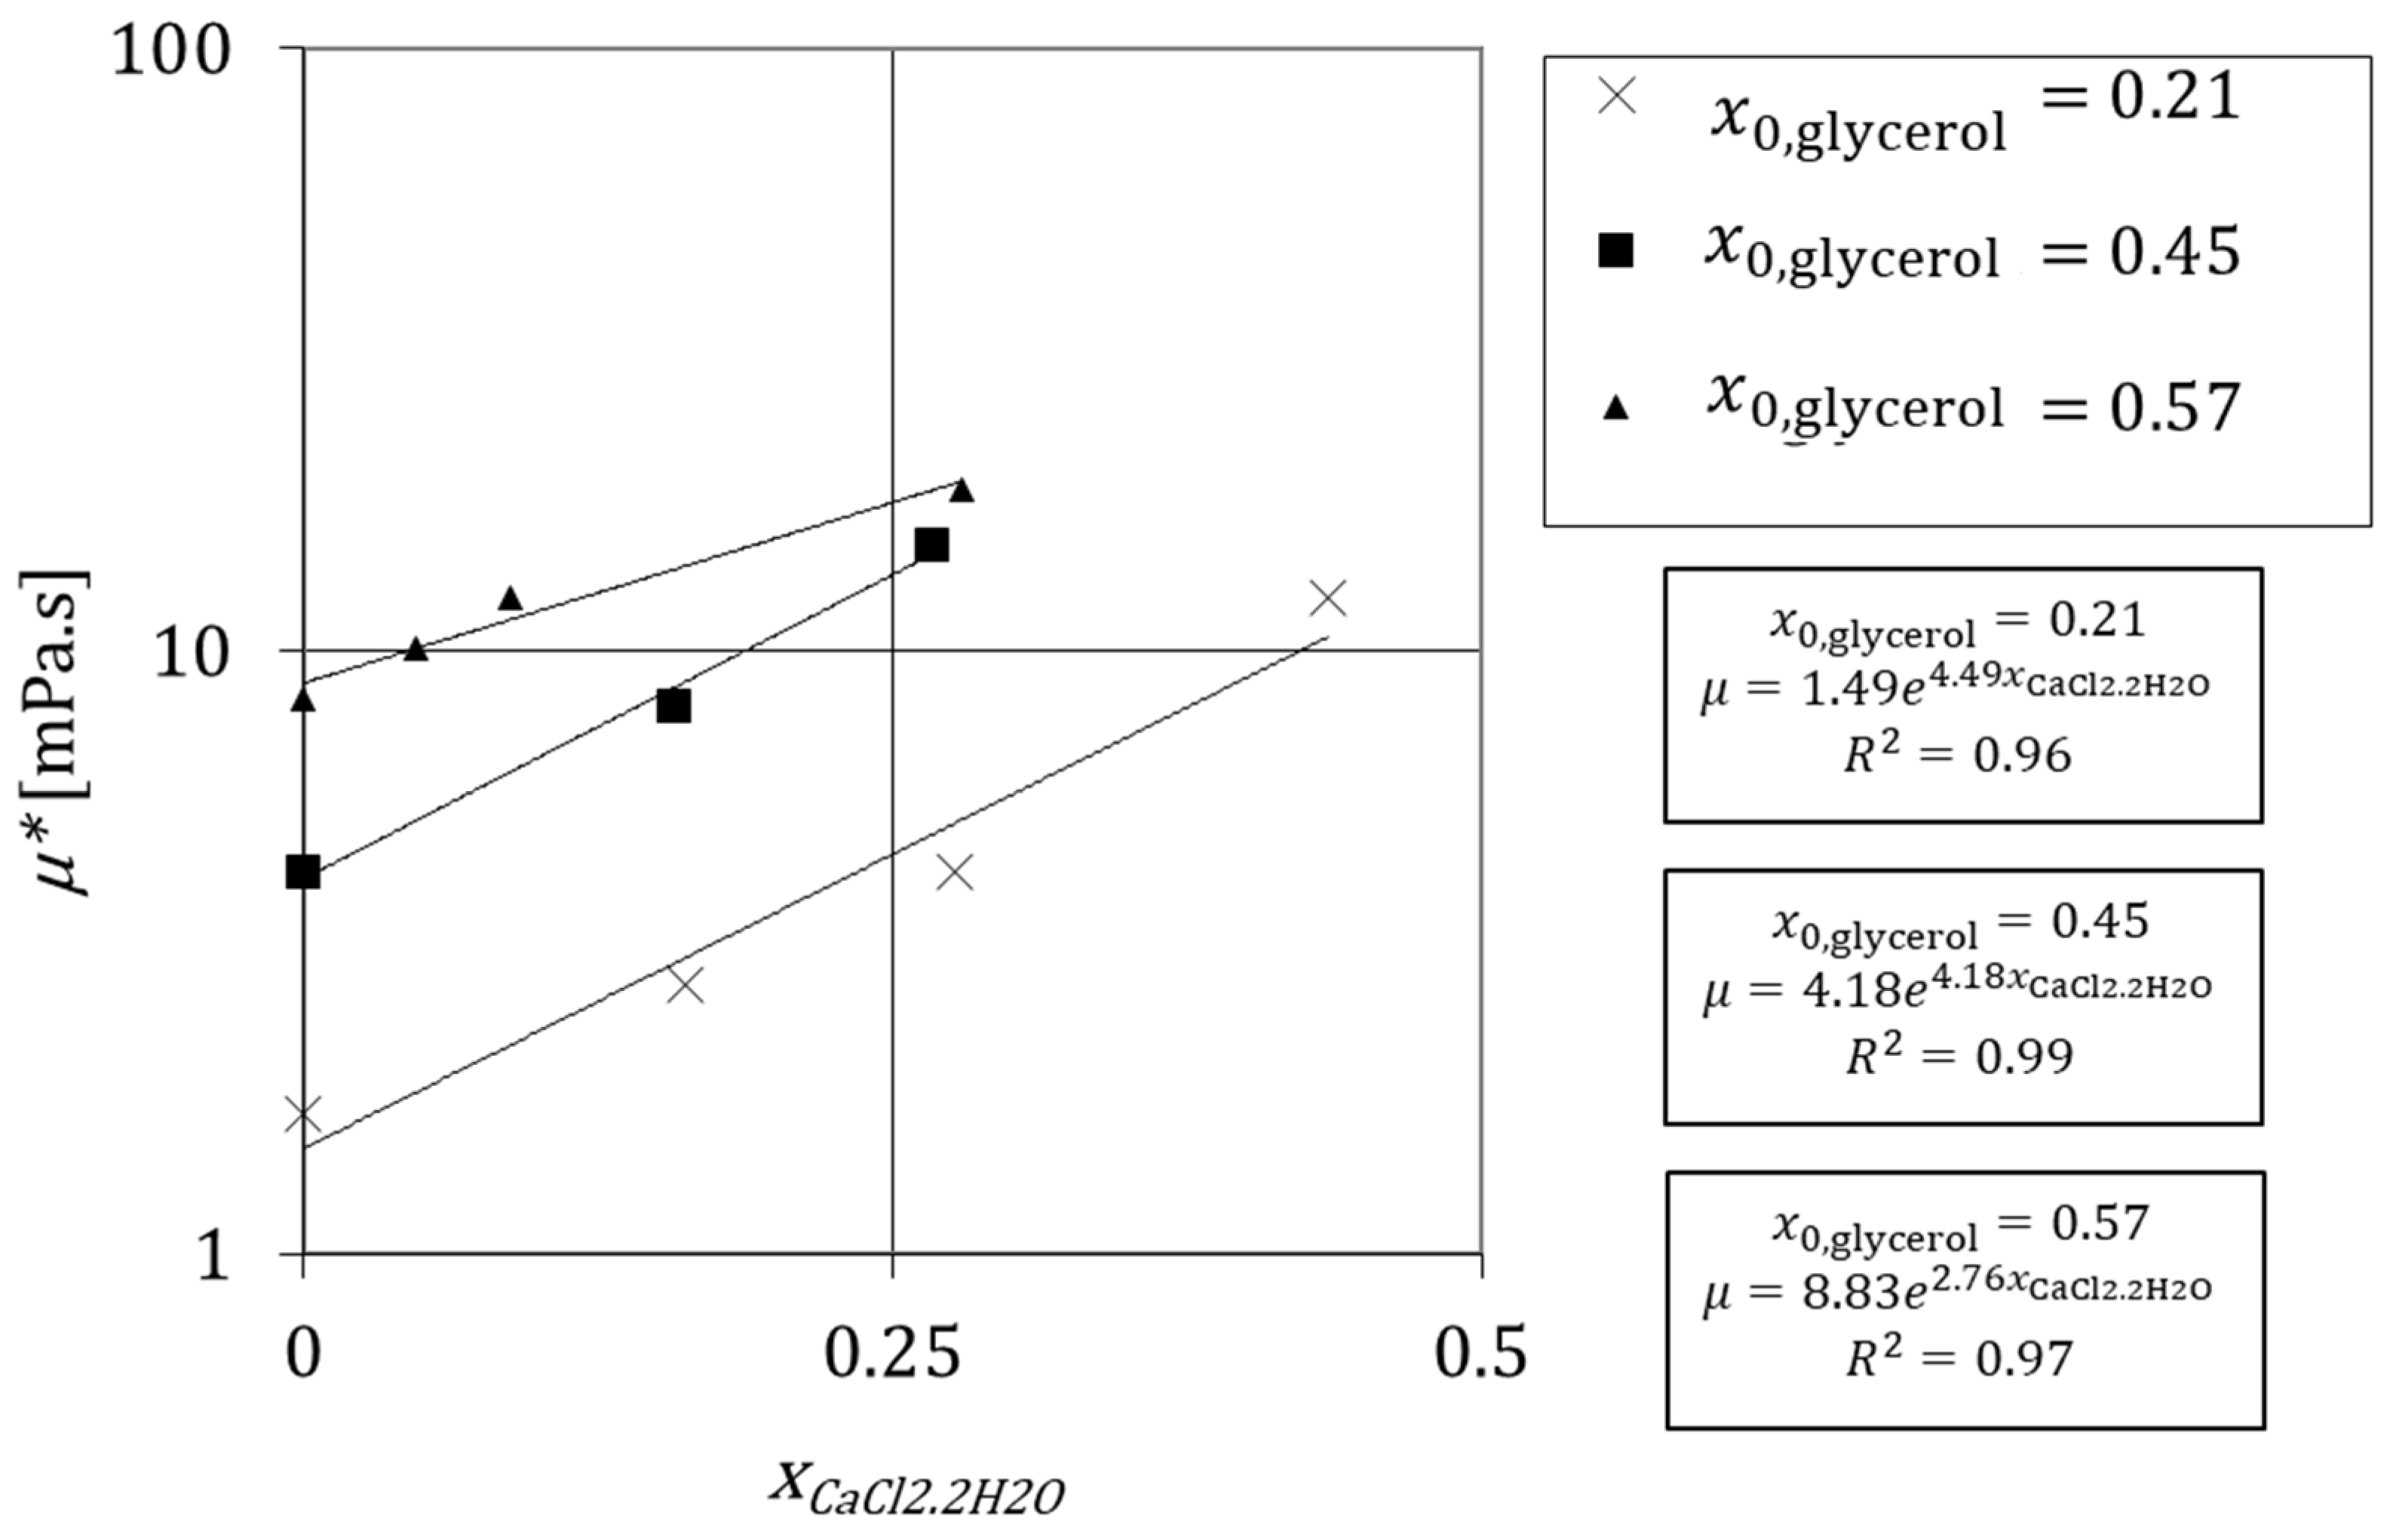
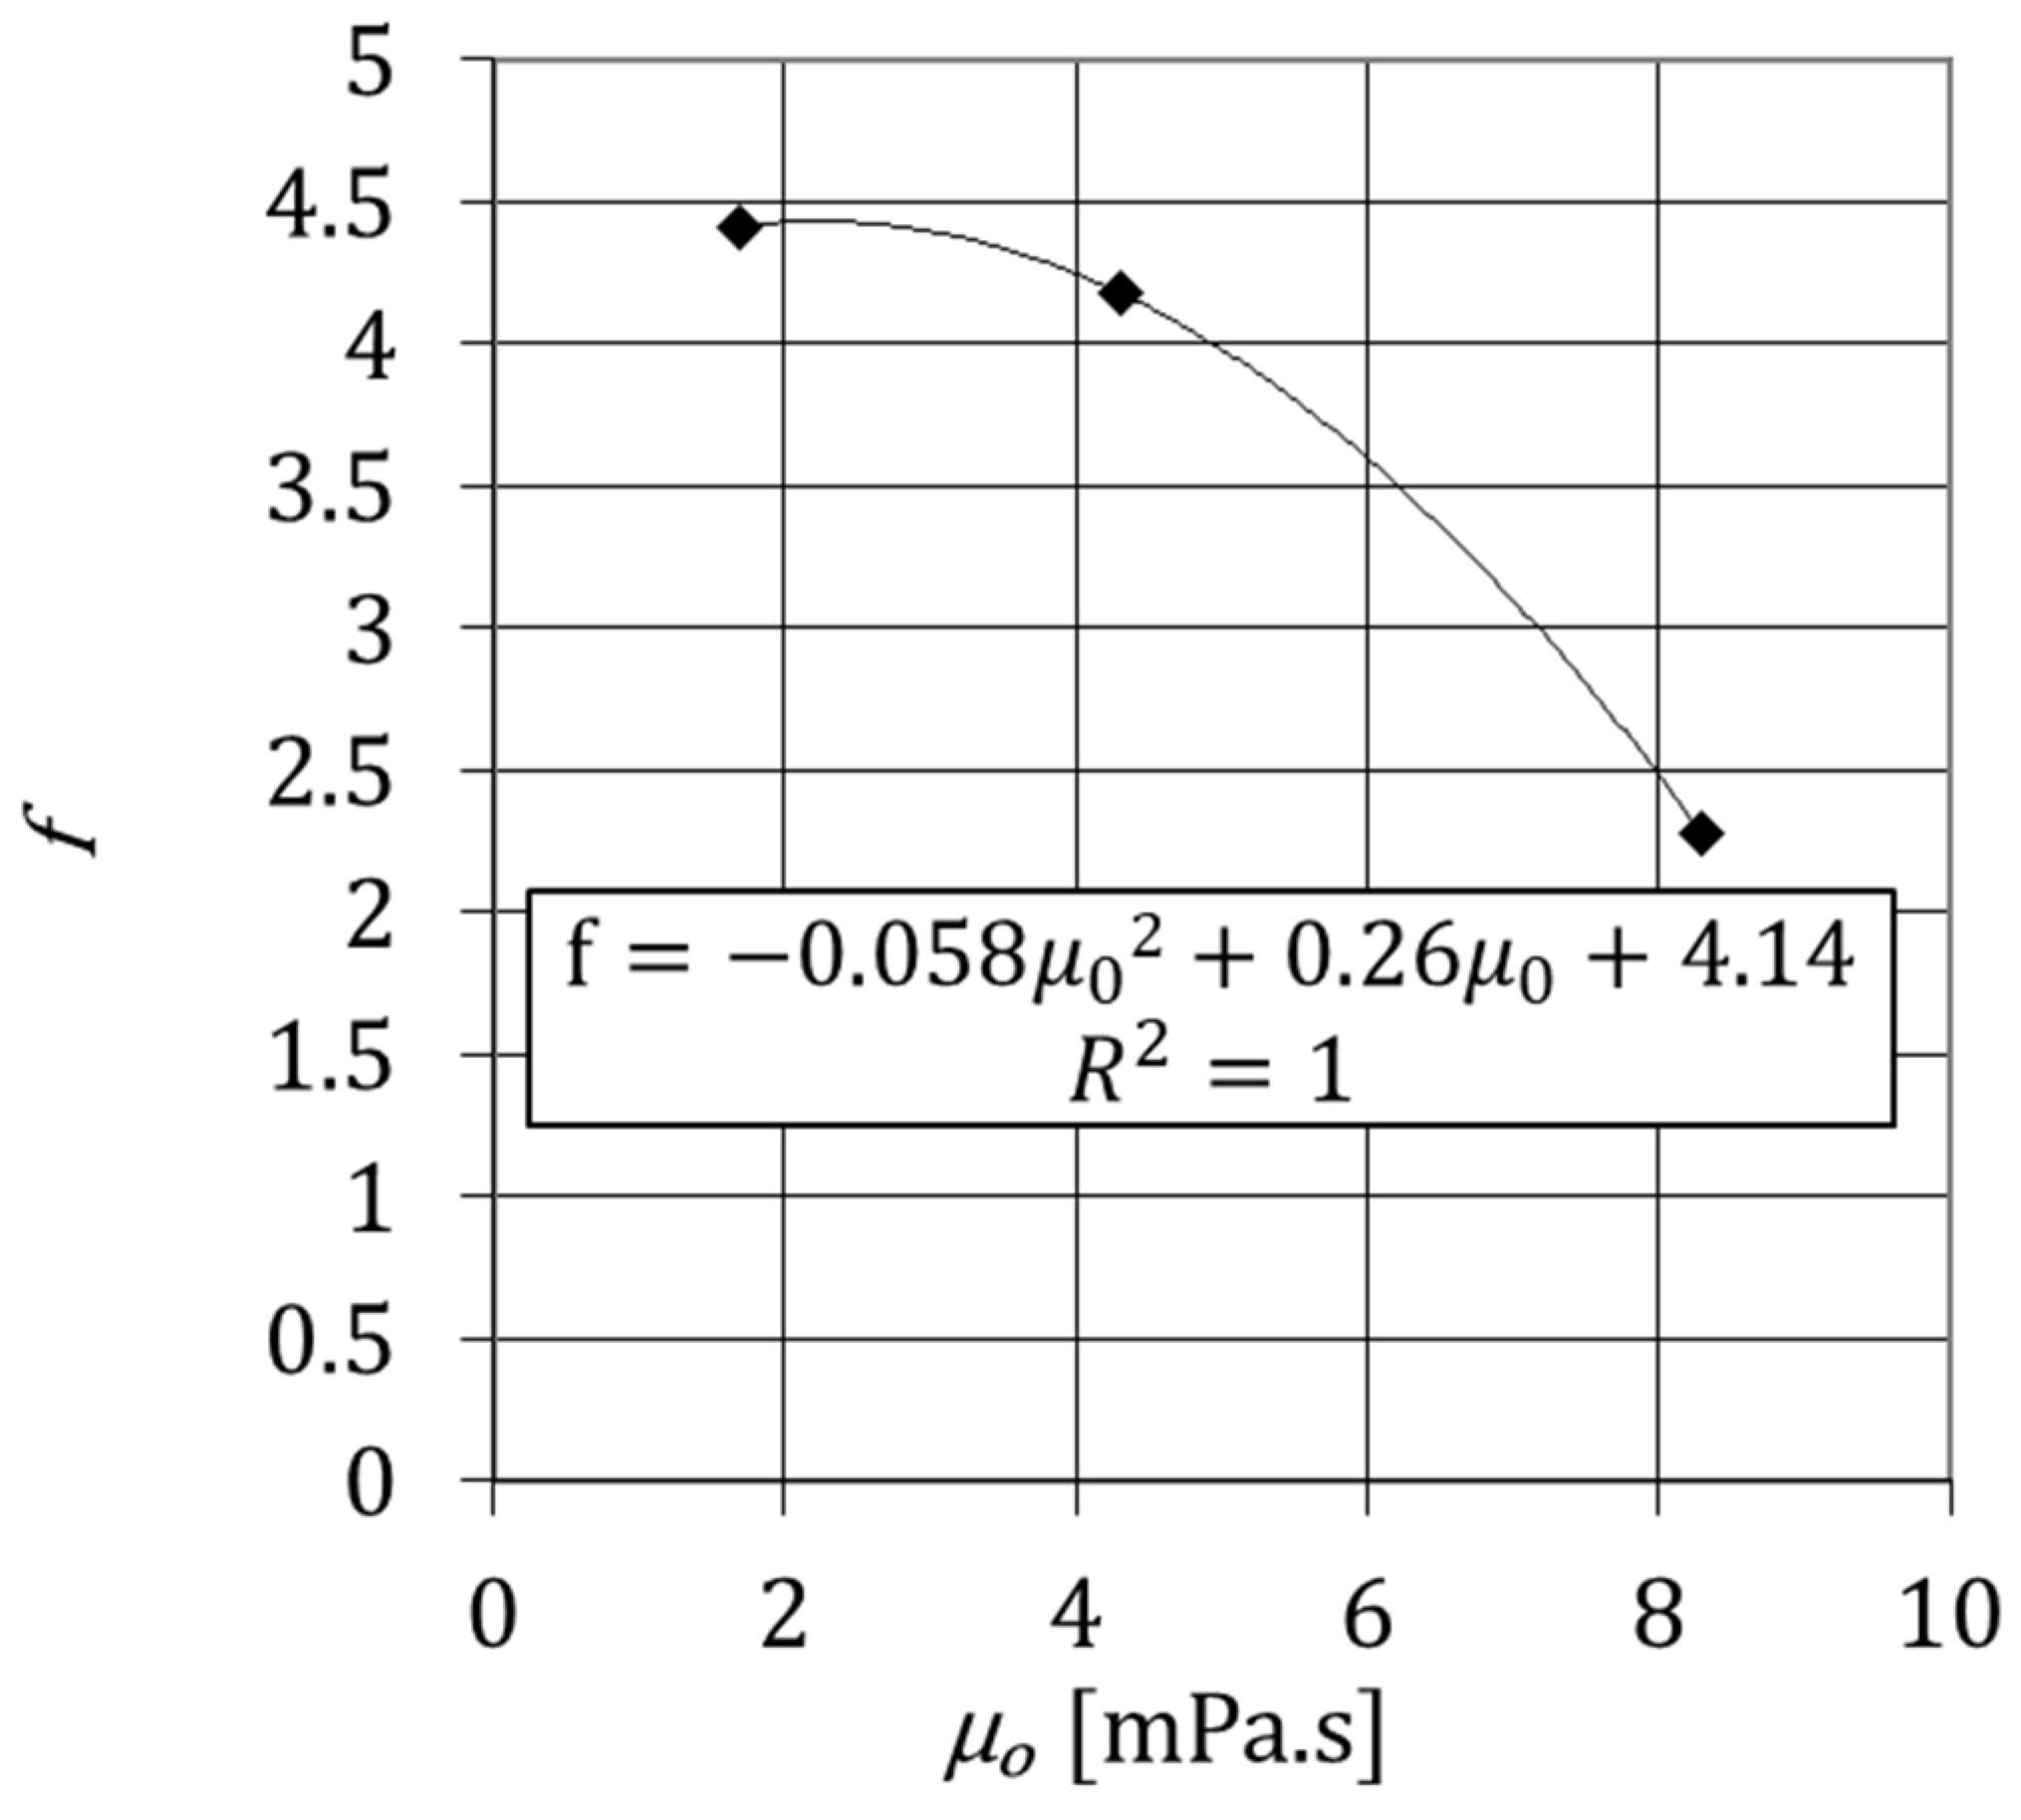
8. Viscosity of Glycerol Solution and Calcium Chloride Dihydrate
9. Results Analysis
10. Conclusions
Supplementary Materials
Funding
Conflicts of Interest
Nomenclature
| c | Parameter for weighting factor calculation |
| cL | Speed of light in vacuum (m s−1) |
| d | Parameter for weighting factor calculation |
| f | Factor that depends on (mPa2·s−4) |
| h | Factor that depends on |
| Mass of calcium chloride (kg) | |
| Mass of glycerol in solution (kg) | |
| Total mass in solution (kg) | |
| Parameter for the calculation of water’s viscosity (mPa·s) | |
| Parameter for the calculation of glycerol’s viscosity (mPa·s) | |
| Parameter for the calculation of water’s viscosity (K) | |
| Q | The temperature dependent coefficient |
| Parameter for the calculation of glycerol’s viscosity (K) | |
| RI | Refractive index of a system water–glycerol |
| Refractive index of water | |
| Refractive index of glycerol | |
| RI* | Refractive index of the mixture of an aqueous solution of glycerol and calcium chloride dihydrate |
| RI0 | Refractive index of a glycerol–water system where the concentration of calcium chloride is 0 |
| V | Volume of an aqueous solution of glycerol and calcium chloride [m3] |
| Mass fraction of glycerol | |
| Initial mass fraction of a glycerol–water system where the concentration of calcium chloride is 0 | |
| Mass fraction of calcium chloride in a glycerol–water system | |
| mass fraction of glycerol in the more viscous fluid | |
| Greek Letters | |
| α | Weighting factor |
| θ | Temperature (K) |
| κ | Volume contraction |
| μ | Viscosity (mPa·s) |
| μi | Viscosity of i component (mPa·s) |
| μj | Viscosity of j component (mPa·s) |
| μ* | Viscosity of the mixture of an aqueous solution of glycerol and calcium chloride dehydrate (mPa·s) |
| μ0 | Initial viscosity of a glycerol–water system where the concentration of calcium chloride is 0 (mPa·s) |
| Speed in a specific medium (m s−1) | |
| ρ | Density of mixture (kg m−3) |
| Density of glycerol (kg m−3) | |
| Density of water (kg m−3) | |
| ρ* | Density of the mixture of an aqueous solution of glycerol and calcium chloride dehydrate (kg m−3) |
| Density of calcium chloride (kg m−3) | |
| Volume fraction | |
| Volume fraction of the dispersed particles at which the viscosity reaches an infinite value |
References
- Amini, N.; Hassan, Y.A. An investigation of matched index of refraction technique and its application in optical measurements of fluid flow. Exp. Fluids 2012, 53, 2011–2020. [Google Scholar] [CrossRef]
- Azimi, N.; Rahimi, M.; Abdollahi, N. Using magnetically excited nanoparticles for liquid–liquid two-phase mass transfer enhancement in a Y-type micromixer. Chem. Eng. Process. 2015, 97, 12–22. [Google Scholar] [CrossRef]
- Bai, K.; Katz, J. On the refractive index of sodium iodide solutions for index matching in PIV. Exp. Fluids 2014, 55, 1704. [Google Scholar] [CrossRef]
- Barthès-Biesel, D. Motion and Deformation of Elastic Capsules and Vesicles in Flow. Annu. Rev. Fluid Mech. 2016, 48, 25–52. [Google Scholar] [CrossRef]
- Borrero-Echeverry, D.; Morrison, B.C.A. Aqueous ammonium thiocyanate solutions as refractive index-matching fluids with low density and viscosity. Exp. Fluids 2016, 57, 123. [Google Scholar] [CrossRef] [Green Version]
- Brito, M.S.C.A.; Barbosa, I.S.O.; Fonte, C.P.; Dias, M.M.; Lopes, J.C.B.; Santos, R.J. Effective mixing of dissimilar fluids in asymmetric Confined Impinging Jets mixers. Chem. Eng. Sci. 2022, 258, 117756. [Google Scholar] [CrossRef]
- Brito, M.S.C.A.; Esteves, L.P.; Fonte, C.P.; Dias, M.M.; Lopes, J.C.B.; Santos, R.J. Mixing of fluids with dissimilar viscosities in Confined Impinging Jets. Chem. Eng. Res. Des. 2018, 134, 392–404. [Google Scholar] [CrossRef]
- Budwig, R. Refractive index matching methods for liquid flow investigations. Exp. Fluids 1994, 17, 350–355. [Google Scholar] [CrossRef]
- Cadillon, J.; Saksena, R.; Pearlstein, A.J. Transparent, immiscible, surrogate liquids with matchable refractive indexes: Increased range of density and viscosity ratios. Phys. Fluids 2016, 28, 127102. [Google Scholar] [CrossRef]
- Chen, J.; Wang, Y.; Zheng, W.; Qiu, L.; Zhang, X. Theoretical Prediction of Flooding Velocity in an Inclined Tube Based on Viscous Kelvin-Helmholtz Instability. Chem. Eng. Sci. 2016, 144, 395–403. [Google Scholar] [CrossRef]
- Chen, Y.; Xu, W.; Zeng, G.; Liu, W. Shear-thickening behavior of precipitated Calcium Carbonate particles suspensions in glycerine. Appl. Rheol. 2015, 25, 1–8. [Google Scholar]
- Cheng, N.-S. Formula for the Viscosity of a Glycerol−Water Mixture. Ind. Eng. Chem. Res. 2008, 47, 3285–3288. [Google Scholar] [CrossRef]
- Chenlo, F.; Moreira, R.; Pereira, G.; Bello, B. Kinematic viscosity and water activity of aqueous solutions of glycerol and sodium chloride. Eur. Food Res. Technol. 2004, 219, 403–408. [Google Scholar] [CrossRef]
- Clément, S.A.; Guillemain, A.; McCleney, A.B.; Bardet, P.M. Options for refractive index and viscosity matching to study variable density flows. Exp. Fluids 2018, 59, 32. [Google Scholar] [CrossRef]
- Daviero, G.J.; Roberts, P.J.W.; Maile, K. Refractive index matching in large-scale stratified experiments. Exp. Fluids 2001, 31, 119–126. [Google Scholar] [CrossRef]
- Forte, G.; Brunazzi, E.; Alberini, F. Effect of residence time and energy dissipation on drop size distribution for the dispersion of oil in water using KMS and SMX+ static mixer. Chem. Eng. Res. Des. 2019, 148, 417–428. [Google Scholar] [CrossRef]
- Fradette, L.; Tanguy, P.; Li, H.Z.; Choplin, L. Liquid/Liquid Viscous Dispersions with a SMX Static Mixer. Chem. Eng. Res. Des. 2007, 85, 395–405. [Google Scholar] [CrossRef]
- Galletti, C.; Arcolini, G.; Mauri, R. Mixing of binary fluids with composition-dependent viscosity in a T-shaped micro-device. Chem. Eng. Sci. 2015, 123, 300–310. [Google Scholar] [CrossRef] [Green Version]
- Galletti, C.; Brunazzi, E.; Mauri, R. Unsteady mixing of binary liquid mixtures with composition-dependent viscosity. Chem. Eng. Sci. 2017, 164, 333–343. [Google Scholar] [CrossRef]
- Glycerine Producers, A. Physical Properties of Glycerine and Its Solutions; Glycerine Producers’ Association: New York, NY, USA, 1963. [Google Scholar]
- Grecco Zanotti, M.A.; Gonçalves dos Santos, R. Thixotropic Behavior of Oil-in-Water Emulsions Stabilized with Ethoxylated Amines at Low Shear Rates. Chem. Eng. Technol. 2019, 42, 432–443. [Google Scholar] [CrossRef]
- Häfeli, R.; Rüegg, O.; Altheimer, M.; Rudolf von Rohr, P. Investigation of emulsification in static mixers by optical measurement techniques using refractive index matching. Chem. Eng. Sci. 2016, 143, 86–98. [Google Scholar] [CrossRef] [Green Version]
- Håkansson, A.; Chaudhry, Z.; Innings, F. Model emulsions to study the mechanism of industrial mayonnaise emulsification. Food Bioprod. Process. 2016, 98, 189–195. [Google Scholar] [CrossRef]
- Helmers, T.; Kemper, P.; Mießner, U.; Thöming, J. Refractive index matching (RIM) using double-binary liquid–liquid mixtures. Exp. Fluids 2020, 61, 64. [Google Scholar] [CrossRef] [Green Version]
- Herzog, S. The Large Scale Structure in the Near-Wall Region of turBulent Pipe Flow; Cornell University: Ithaca, NY, USA, 1986. [Google Scholar]
- Larin, K.; Akkin, T.; Esenaliev, R.; Motamedi, M.; Milner, T. Phase-Sensitive Optical Low-Coherence Reflectometry for the Detection of Analyte Concentrations. Appl. Opt. 2004, 43, 3408–3414. [Google Scholar] [CrossRef]
- Laurent, J.L.; Janmey, P.A.; Ferry, J.D. Dynamic Viscoelastic Properties of Gelatin Gels in Glycerol-Water Mixtures. J. Rheol. 1980, 24, 87–97. [Google Scholar] [CrossRef]
- Laven, J.; Stein, H.N. The Einstein coefficient of suspensions in generalized Newtonian liquids. J. Rheol. 1991, 35, 1523–1549. [Google Scholar] [CrossRef] [Green Version]
- Lemmon, E.W.; McLinden, M.O.; Friend, D.G. Thermophysical Properties of Fluid Systems. In NIST Chemistry WebBook, NIST Standard Reference Database Number 69; Linstrom, P.J., Mallard, W.G., Eds.; National Institute of Standards and Technology: Gaithersburg, MD, USA, 2021. [Google Scholar]
- Liu, G.; Wang, X.; Wang, K.; Tostado, C.P.; Luo, G. Effect of surface wettability on internal velocity profile during droplet formation process in microfluidic devices. Int. J. Multiph. Flow 2016, 80, 188–193. [Google Scholar] [CrossRef]
- Marcos, S.; Santos, R.J.; Kilzer, A.; Petermann, M. On the experimental investigation and numerical fluid dynamic simulation of L-L water-in-oil dispersions in Y-junctions under the presence of dissolved CO2. J. Supercrit. Fluids 2019, 146, 65–77. [Google Scholar] [CrossRef]
- Mori, Y.H. Dynamic interfacial tension in water/n-pentane system: An experimental study using the oscillating-jet method. Chem. Eng. Sci. 2016, 143, 130–138. [Google Scholar] [CrossRef]
- Najjari, M.R.; Hinke, J.A.; Bulusu, K.V.; Plesniak, M.W. On the rheology of refractive-index-matched, non-Newtonian blood-analog fluids for PIV experiments. Exp. Fluids 2016, 57, 96. [Google Scholar] [CrossRef]
- Perry, R.H.; Chilton, C.H. Chemical Engineer’s Handbook; McGraw-Hill: New York, NY, USA, 1973. [Google Scholar]
- Piroozian, A.; Hemmati, M.; Ismail, I.; Manan, M.A.; Rashidi, M.M.; Mohsin, R. An experimental study of flow patterns pertinent to waxy crude oil-water two-phase flows. Chem. Eng. Sci. 2017, 164, 313–332. [Google Scholar] [CrossRef]
- Polyanskiy, M. Refractive Index Database. 2008. Available online: https://refractiveindex.info/ (accessed on 14 January 2020).
- Ramsay, J.; Simmons, M.J.H.; Ingram, A.; Stitt, E.H. Mixing of Newtonian and viscoelastic fluids using “butterfly” impellers. Chem. Eng. Sci. 2016, 139, 125–141. [Google Scholar] [CrossRef] [Green Version]
- Reid, R.C.; Prausnitz, J.M.; Poling, B.E. The Properties of Gases and Liquids, 4th ed.; McGraw-Hill: New York, NY, USA, 1987. [Google Scholar]
- Renardy, Y. Instabilities in steady flows of two fluids. Rocky Mt. J. Math. 1988, 18, 455–478. [Google Scholar] [CrossRef]
- Saksena, R.; Christensen, K.T.; Pearlstein, A.J. Surrogate immiscible liquid pairs with refractive indexes matchable over a wide range of density and viscosity ratios. Phys. Fluids 2015, 27, 087103. [Google Scholar] [CrossRef]
- Santos, R.J.; Erkoç, E.; Dias, M.M.; Teixeira, A.M.; Lopes, J.C.B. Hydrodynamics of the mixing chamber in RIM: PIV flow-field characterization. AIChE J. 2008, 54, 1153–1163. [Google Scholar] [CrossRef]
- Sarbanha, A.; Sobhanian, F.; Movahedirad, S. Mixing of the Immiscible Liquids in the Entrance Region of a T-Type Chamber Using Laser Induced Fluorescence (LIF) Method. Iran. J. Chem. Chem. Eng. 2016, 13, 32–42. [Google Scholar]
- Sato, A.C.K.; Perrechil, F.A.; Cunha, R.L. Rheological Behavior of Suspensions Dispersed in Non-Newtonian Matrix. Appl. Rheol. 2013, 23, 24–33. [Google Scholar]
- Segur, J.B.; Oberstar, H.E. Viscosity of Glycerol and Its Aqueous Solutions. Ind. Eng. Chem. 1951, 43, 2117–2120. [Google Scholar] [CrossRef]
- Shankar, P.N.; Kumar, M. Experimental determination of the kinematic viscosity of glycerol-water mixtures. Proc. R. Soc. 1994, A444, 573–581. [Google Scholar]
- Takamura, K.; Fischer, H.; Morrow, N.R. Physical properties of aqueous glycerol solutions. J. Pet. Sci. Eng. 2012, 98–99, 50–60. [Google Scholar] [CrossRef]
- Takamura, K.; Van De Ven, T.G.M. Comparisons of modified effective medium theory with experimental data on shear thinning of concentrated latex dispersions. J. Rheol. 2010, 54, 1–26. [Google Scholar] [CrossRef]
- Tsaoulidis, D.; Angeli, P. Liquid-liquid dispersions in intensified impinging-jets cells. Chem. Eng. Sci. 2017, 171, 149–159. [Google Scholar] [CrossRef]
- Van de Ven, T.G.M. Colloidal Hydrodynamics; Colloid science; Academic Press: London, UK, 1989. [Google Scholar]
- Volk, A.; Kähler, C. Density model for aqueous glycerol solutions. Exp. Fluids 2018, 59, 75. [Google Scholar] [CrossRef] [Green Version]
- Weast, R.C.; Astte, M.J. CRC Handbook of Chemistry and Physics: A Ready-Reference Book of Physical and Chemical Data; CRC press: Boca Raton, FL, USA, 1974. [Google Scholar]
- Wright, S.F.; Zadrazil, I.; Markides, C.N. A review of solid–fluid selection options for optical-based measurements in single-phase liquid, two-phase liquid–liquid and multiphase solid–liquid flows. Exp. Fluids 2017, 58, 108. [Google Scholar] [CrossRef]
- Yang, L.; Dietrich, N.; Loubière, K.; Gourdon, C.; Hébrard, G. Visualization and characterization of gas–liquid mass transfer around a Taylor bubble right after the formation stage in microreactors. Chem. Eng. Sci. 2016, 143, 364–368. [Google Scholar] [CrossRef] [Green Version]
- Zhang, D.F.; Zumbrunnen, D.A. Chaotic mixing of two similar fluids in the presence of a third dissimilar fluid. AIChE J. 1996, 42, 3301–3309. [Google Scholar] [CrossRef]


| Work | Materials | Observations |
|---|---|---|
| RIM of fluids and the walls of the flow geometry | ||
| Amini and Hassan [28] | RIM of dibutyl phthalate and acrylic RIM of P-Cymene and acrylic 2H2O (63% by weight) and fused quartz. | RIM of aqueous solutions and organic fluids with solid boundaries (acrylic and fused quartz). Temperature curves of RI for the fluids. |
| Bai and Katz [29] | and transparent materials. | concentrations and temperature. |
| Borrero-Echeverry and Morrison [30] | and fused quartz, borosilicate glass, and acrylic. | RIM of aqueous solutions keeping low viscosity and density with solid boundaries (fused quartz, borosilicate glass, and acrylic). |
| RIM of two fluids in the same flow | ||
| Daviero, Roberts and Maile [36] | RIM of aqueous salt (NaCl) solutions and aqueous ethanol solutions. | RIM of low-viscosity fluids for large-scale experiments of stratified fluids. These experiments are usually conducted under turbulent flow regime. |
| Saksena, et al. [37] | RIM of aqueous solutions of 1,2-propanediol and cesium bromide (CsBr) and silicone oils with 1-bromooctane. | RIM for immiscible model fluids with viscosity and density ratios. |
| Cadillon, et al. [38] | and high- and low-viscosity silicone oils with 1-bromooctane. | Silicone oil used inSaksena, Christensen and Pearlstein [37] is replaced by oil with a twentyfold higher viscosity. Another working fluid is used, replacing the silicone oil used in Saksena, Christensen and Pearlstein [37] by oil with fivefold lower viscosity. |
| Najjari, et al. [39] | . | RIM of aqueous solutions with solid boundaries for blood analogue fluids. |
| RIM of two fluids in the same flow | ||
| Clément, Guillemain, McCleney and Bardet [32] | First pair: RIM of isopropanol and an aqueous solution of NaCl . | RIM for two fluids systems with different densities. First pair of fluids with larger viscosity difference than second pair of fluids. |
| Helmers, Kemper, Mießner and Thöming [33] | RIM of an aqueous phase with dimethyl sulfoxide (DMSO) or glycerol and binary mixtures of hexane with anisole or sunflower oil. | RIM of aqueous and organic phases for microscopic multiphase flows. |
| Chemicals | CAS Number | Supplier | Density (kg/m3) | Viscosity (Pa·s) | Refractive Index | Purity 2 |
|---|---|---|---|---|---|---|
| Propane-1,2,3-triol (glycerol) | 56-81-5 | Analytical: Pharmacy Industrial: Sociedade Portuguesa de Química | 1004 1 at θ = 293.15 K | 1.41 1 at | 1.471 3 at θ = 293.15 K | Analytical: ≥99.9% Industrial: ≥99.5% |
| Calcium chloride dihydrate | 10035-04-8 | VWR | 1850 3 at θ = 293.15 K | - | - | ≥97% |
| θ (K) | Models | δ (%) |
|---|---|---|
| 288.16 | Equation (1) | 0.34 |
| Equation (3) | 0.14 | |
| 298.16 | Equation (1) | 0.38 |
| Equation (3) | 0.15 | |
| 303.16 | Equation (1) | 0.42 |
| Equation (3) | 0.16 |
| xglycerol | θ (K) | RI | RI(θ = 293.15 K) − RI(θ = 303.15 K) |
|---|---|---|---|
| 0.20 | 293.15 | 1.3585 | 0.0009 |
| 303.15 | 1.3576 | ||
| 0.41 | 293.15 | 1.3878 | 0.0002 |
| 303.15 | 1.3876 |
| xglycerol | ρ* (kg/m3) | |
|---|---|---|
| 0.05 | 0.49 | 1371 |
| 0.12 | 0.43 | 1339 |
Publisher’s Note: MDPI stays neutral with regard to jurisdictional claims in published maps and institutional affiliations. |
© 2022 by the author. Licensee MDPI, Basel, Switzerland. This article is an open access article distributed under the terms and conditions of the Creative Commons Attribution (CC BY) license (https://creativecommons.org/licenses/by/4.0/).
Share and Cite
Brito, M.S.C.A. Design of Model Fluids for Flow Characterization Experiments Involving Mixing of Dissimilar Fluids—Refractive Index Matching and Physical Properties. Processes 2022, 10, 1260. https://doi.org/10.3390/pr10071260
Brito MSCA. Design of Model Fluids for Flow Characterization Experiments Involving Mixing of Dissimilar Fluids—Refractive Index Matching and Physical Properties. Processes. 2022; 10(7):1260. https://doi.org/10.3390/pr10071260
Chicago/Turabian StyleBrito, Margarida S. C. A. 2022. "Design of Model Fluids for Flow Characterization Experiments Involving Mixing of Dissimilar Fluids—Refractive Index Matching and Physical Properties" Processes 10, no. 7: 1260. https://doi.org/10.3390/pr10071260