1. Introduction
The European Union’s waste management policy, which has been implemented for more than a decade [
1], continues to influence the actions of the EU member states, with increasingly ambitious targets being set over the years. One of the main objectives is to move towards a sustainable development model known as the circular economy [
2]. In France, the National Waste Prevention Program (Programme National de Prévention des Déchets—PNPD) guides the strategies for the public policy of waste prevention and plans to reduce household and similar waste by 15% for the 2021–2027 edition [
3]. In the reduction of waste quantities and the circular economy model, the recovery of non-avoidable wastes is a priority, and material recovery is prioritized before energy recovery. Among the material recovery routes, composting and methanization are often considered for urban organic waste (bio-waste, green waste, sludge from sewage treatment plants, etc.).
The composting process is an aerobic transformation of fermentable materials under controlled conditions. Two phases follow one another during composting: a bio-oxidation and hygienization phase with a rise in temperature, and a maturation phase with a drop in temperature, which makes it possible to obtain a stable material rich in humic compounds. Stabilized compost is mainly used as an organic amendment [
4] and also in bioremediation [
5]. This technique thus enables a large proportion of fermentable organic waste to be valorized via material recovery.
Sewage sludge, the final residue of urban wastewater treatment, is well-suited to this type of recovery. The MIATE (materials of agronomic interest derived from water treatment) compost in France, which is generally obtained by a joint treatment with green waste, can be used in agriculture according to the NFU 44-095 quality standard of AFNOR (Association Française de Normalisation) [
6]. This standard specifies the thresholds for certain physico-chemical and biological parameters in order to guarantee the quality of the compost produced for an organic soil amendment. In particular, the total phosphorus in P
2O
5 must be less than 3% by raw weight (RW), the dry weight (DW) expressed as raw weight must be greater than or equal to 50%, the sum of seven monitored PCBs (polychlorinated biphenyls) must not exceed 0.8 mg kg
−1 DW, and limit values are given for some PAHs (polycyclic aromatic hydrocarbons) (4 mg kg
−1 DW for fluoranthene, 2.5 mg kg
−1 DW for benzo(b)fluoranthene, and 1.5 mg kg
−1 DW for benzo(b)pyrene) and for some trace metal elements (TMEs) (300 mg kg
−1 DW for Cu, 180 mg kg
−1 DW for Pb, and 3 mg kg
−1 DW for Cd).
Regardless of the method used (mixture of several substrates or not), the composting process leads to the production of leachates, or compost juices, resulting from the percolation of water (process and metabolic water) in the materials treated mainly during the bio-oxidation phase. Several organic (dissolved and particulate organic matter, volatile fatty acids) and inorganic (ammonium, nitrates, phosphates) compounds are present in leachates, as well as pathogens (
Salmonella spp.,
Listeria monocytogenes, etc.) and, potentially, inorganic and organic pollutants (PCBs, cadmium, copper, lead, etc.) [
7]. Leachate production amounts vary between 5 and 170 L t
−1 of waste, according to the literature [
8]. In France, these liquids have to be treated and/or eliminated, according to Article 22 of the Decree of 22 April 2008, governing the Classified Installations for the Protection of the Environment (ICPE) [
9]. The choice of draining leachates by returning them to a wastewater treatment plant (WWTP), which is often the least technically restrictive option, generally represents a high cost, and regulatory constraints compromise this solution. Among the most widely used alternative techniques to treat leachates are reverse osmosis [
10], evaporation [
11], and electrochemical oxidation [
12]. These technologies require a heavy investment for the acquisition and the daily operating cost. Other more rustic techniques are used to treat leachates, such as reed filters [
13,
14] and agro-industrial materials [
15]. Concerning the reed filter, this method requires a substantial layout to support the continuous flow of effluent and a highly optimized sizing in order to limit the saturation of the system, which is highly conducive to odor pollution and problematic for sites in urban areas. For the other rustic methods, their application on an industrial scale deserves further investigation.
The aim of this research was to evaluate a low-cost alternative procedure to treat, and reuse on site, the compost leachates produced during the bio-oxidation phase of composting, in accordance with a circular economy approach and its economic and environmental issues. For this purpose, we worked on a platform producing MIATE compost, which generates leachates with a high organic matter content.
The treatment process was based on the spraying of leachates at regular time intervals on selected green waste biopiles in order to favor the liquid retention and biodegradation of the organic load of the leachates coming from the sewage sludge bio-oxidation step of composting (mixed with green wastes). The potential degradation of a specific biopile and the assessment of the potential risk of its enrichment with certain tracked pollutants or unwanted compounds were investigated through physico-chemical analysis, microbiological activity, and microbiological diversity studies. The obtained results could hypothetically validate the ultimate the valorization of biopile substrates in the composting process in a circular economy way, respecting the quality standards of use for MIATE composts.
2. Materials and Methods
2.1. Study Site: Setting up of the Biopile and Trial Progress
The study was performed at the SARL Biotechna composting platform (43°22′37.4″ N 5°11′27.8″ E) located in Ensues-la-Redonne, France. Biotechna has been an ICPE site since 2004 and treats up to 30,000 t of green waste and 30,000 t of WWTP sludge each year to produce MIATE compost according to the French standard (NFU 44-095). During the industrial composting process, between 2000 and 3000 m3 of leachates (derived from the bio-oxidation step) are produced each year. These leachates are stored in a watertight tank before their treatment in WWTPs.
The biopiles were composed of a mixture of 80% crushed green waste (size: 80–110 mm) and 20% green waste compost (size: 20 mm) favorable to leachate retention and treatment conditions. This composition was selected after optimization pre-studies, considering the materials that are available on site in a self-centered circular economy (results not presented here). These pre-studies consisted of various mesocosm tests with different mixtures of crushed green waste (with or without sieving—20 mm) and green waste compost, through which the composition was optimized to guarantee the retention capacity and biodegradation of the leachate (a majority of crushed green waste allowed structuration of the biopile and a good aeration to favor biological activity). The dimensions of the experimental biopiles were 5 m long, 4 m wide, and 2.3 m high. The total surface area covered was 20 m
2, for a total volume of 46 m
3. Watering was carried out on a surface of 12 m
2 at the top of the biopile to avoid rapid percolation in the peripheral areas and the loss of leachates. A sprinkler system with 6 sprinklers (Ref. Sprinkler head—Pendent K80 DN 15 ½ Male—68°—TY325) overhung the windrow and sprayed 1.5 m
3 (flow rate = 37.5 L min
−1) during each watering (the equivalent of 5.4% of the sprayed volume of the biopile). Furthermore, these watering conditions ensured an optimal retention capacity and avoided percolation at the bottom of the biopile and potential olfactory disturbances due to bad odors. The experiment was undertaken over 8 weeks, for a total of 4 waterings, to examine the potential for biopile enrichment with tracked pollutants or unwanted compounds. A watering frequency of 2 weeks allowed for the observation of the potentially significant evolutions of the monitored analytical parameters. The different steps and sampling campaigns carried out during the trial are presented in the
Supplementary Materials, Table S1. For each watering step, 3 sampling campaigns were defined: sampling after the supply was completed (“after supply”), sampling one week after watering (“after 1 week”), and sampling two weeks after watering (and before the next watering) (“after 2 weeks”). During each watering step, samples were systematically collected before and after watering. A control biopile was monitored during the experiment, with the same characteristics (composition and size) and conditions of spraying as the test biopile, but with clean water instead of compost leachate.
The analyses of the liquid fractions (water extracts and leachates) were carried out on the quantification of dissolved organic carbon, total dissolved nitrogen, phosphate, nitrate, volatile fatty acids, and the monitoring of some spectroscopic indices, such as specific ultraviolet absorbance at 254 nm (SUVA254) and the E2/E3 index (ratio of Abs 250 nm/Abs 365 nm, with Abs meaning absorbance). For the solid phase, the total carbon, total nitrogen with nitrogen isotopy (δ15 N), total trace metal elements, and total phosphorus, as well as some PAHs and PCBs of interest, were monitored.
2.2. Sampling and Pretreatment of Solid Samples
During each sampling campaign, 3 solid samples were collected randomly from the windrow at a depth between 30 and 80 cm, in order to accommodate the sampling variability of such a heterogeneous substrate. Two were located oppositely and at the periphery of the sprayed area, and one was located in the center of this area. Each sample was sieved using a 50 mm mesh sieve before 3 successive quarterings to obtain a representative sample of about 1 kg, which was distributed into bags and stored at 4 °C for further analysis.
The dry-solid samples obtained after oven drying at 105 °C were grinded in 3 steps: 2 successive grindings in a Fristch mill with a sieve size of 2 mm followed by a sieve size of 0.25 mm, and a final grinding in an RM 200 mortar grinder to obtain fine particles for the analysis of the solids.
2.3. Sampling and Pretreatment of Liquid Samples
During each watering campaign, 6 L of leachate was sampled and stored in amber glass bottles in darkness at 4 °C prior to analysis.
The water extracts [
16] obtained from fresh samples were carried out according to the following protocol: 6 g of fresh solid was mixed with 60 mL of ultra-pure water produced by a Millipore water system (Milli-Q
® Direct, Darmstadt, Germany). The samples were shaken at 125×
rpm for 2 h and then centrifuged at 8000×
rpm for 15 min at 20–22 °C. Both the supernatants and the leachate samples were filtered through 0.45 µm PolyEtherSulfone filters before the analysis.
For each sampling campaign, the obtained analytical values corresponded to the average and confidence interval for the 3 collected samples (
n = 3). The result for each compound (i) analyzed in the water extracts was expressed using the following Equation (1):
where the dry weight (DW) is the exact mass obtained after drying at 105 °C, C is the measured concentration of a physico-chemical value in solution, and V is the volume of the ultra-pure water used for the water extraction, which corresponds to 0.06 L.
2.4. Sample Treatment and Analysis
2.4.1. Measurements of pH, Conductivity, Temperature and Humidity
The pH and conductivity were measured in the water extracts and leachate samples using multi 3420 portable probes provided by WTW.
Temperature measurements were obtained on site using a TCK mobile probe during the sampling campaigns in the biopile at a depth of 50 cm. To evaluate the humidity of the samples, approximately 200 g of fresh (raw) sample was placed in an oven at 105 °C. The drying was monitored for 72 h, and the weight was measured regularly until a stable dry weight was reached.
The moisture X was calculated according to the following Equation (2):
2.4.2. Water Extract (WE) Analysis
Dissolved Organic Carbon (DOC) and Total Dissolved Nitrogen (TDN) Analysis
The measurements of the DOC and TDN were carried out with a multi N/C
® 2100 S [
17]. This method allowed for the simultaneous determination of the carbon and nitrogen content in the water extract samples. Each sample (250 µL) was injected twice, and the average was reported as the DOC (mgC L
−1) or TDN (mgN L
−1). The detection limits were 3.19 mgC L
−1 for DOC and 1.16 mgN L
−1 for TDN.
Ammonium (NH4+) and Volatile Fatty Acid (VFA) Analysis—Fluorescence Microplate
The reagents used in this work were: o-phthaldialdehyde (OPA), N-acetylcysteine (NAC), N′-(3-dimethylaminopropyl)-N-ethylcarbodiimide (EDC), N-(1-naphthyl)ethylenediamine (EDAN), 7-aza-1-hydroxybenzotriazole (HOAT), and absolute ethanol (EtOH).
Ammonium was assayed using a microplate method with fluorescence detection (top configuration), following the formation of a fluorescent derivative (isoindole) by the reaction of the ammonium ions, OPA and NAC [
18]. After preheating the microplate reader (Synergy™ HTX Multi-Detector Microplate Reader—BioteK) to 30 °C, 100 μL of the sample was dropped into the well; then, 20 μL of NAC (20 mM) was added, followed by 30 μL of OPA (13 mM). After shaking inside the reader (orbital mode with an amplitude of 3 mm), the fluorescence was measured at λ
exc = 415 nm and λ
em = 485 nm.
The volatile fatty acids were analyzed in the same microplate reader with a fluorescence detection method [
19]. The reader was preheated to 40 °C before depositing the following: 150 μL of HOAT (6 g L
−1) and EDAN (1 g L
−1) at a pH of 5; 30 μL of the sample; and 20 μL of EDC at 100 g L
−1 in EtOH. After first shaking for 5 min, 25 μL of KH
2PO
4 (250 mM) in NaOH (0.35 M) was added before a second shaking for 2 min. Finally, 20 μL of OPA (60 g L
−1) in EtOH was added before a third shaking for 5 min. The readings were taken at λ
ex = 335 nm and λ
em = 442 nm.
Anion Analysis—Nitrate (NO3−) and Phosphate (PO43−)
The anions were analyzed using ion chromatography on an ICS-3000 HPLC system (Dionex) equipped with an AG11-HC guard column, an AS11-HC analytical column (4 × 250 mm), a Dionex CD-25 conductivity detector, and a 200 μL injection loop. The analyses were performed in isocratic mode (22.5 mM NaOH in helium-purged deionized water) at 30 °C, with a flow rate of 1.5 mL min
−1. An external electrochemical suppression system (ACRS 500 4 mm) was added to improve the signal-to-noise ratio [
20]. The system control and data processing were performed using the Chromeleon7
® software (ThermoFisher Scientific, Waltham, MA, USA). The quantification limits were 0.06 mgN L
−1 for NO
3− and 0.16 mgP
2O
5 L
−1 for PO
43−.
Monitoring of Spectroscopic Indices
The molecular properties of the dissolved organic material were monitored by UV-visible absorption. The spectra were performed on a Shimadzu UV-1800 spectrometer over a wavelength range of 200 to 1000 nm using a 10 mm quartz optical cell—3 mL volume. We calculated two spectroscopic indices to evaluate the evolution of the organic matter contained in the water extracts, representing WEOM (water-extractable organic matter) [
16,
21,
22].
The E
2/E
3 ratio was used to monitor the degree of aromaticity of the organic matter and the molecular size [
23]. It was calculated as follows:
E2/E3 = Abs 250 nm/Abs 365 nm
Abs: Absorbance
The SUVA
254 was measured to determine the abundance of aromatic carbons and provide a quantitative value of their content per unit concentration of dissolved organic carbon [
24,
25]. The SUVA
254 was obtained by dividing its absorbance at 254 nm by its DOC value (mgC L
−1) and the cell path length (m), and was expressed in L mgC
−1 m
−1.
2.4.3. Analysis of Solid Substrates
Total Carbon (TC) and Total Nitrogen (TN) Analysis
Elemental and isotopic analyses were performed using a coupled elemental analyzer (EA Flash HT Plus, Thermo Fisher Scientific, USA) with a mass spectrometer (IrMS Delta V Advantage, Thermo Fisher Scientific). Stable nitrogen analyses were performed via a combustion reactor (1000 °C) under a carrier gas flow (helium: 100 mL min
−1) with the sample sealed in a tin capsule and introduced via an automatic injector. The gases were separated on a chromatographic column before being quantified via the catharometric detector, and were then introduced into the mass spectrometer for isotopic analysis. The δ
15 N ratio (15 N/14 N = δ
15 N) analyses were expressed relative to atmospheric nitrogen [
26,
27,
28].
Analysis of Persistent Organic Pollutants (POPs)
The solid samples for PAH and PCB analysis, stored at −80 °C, were freeze-dried before being ground to obtain particles of 0.25 mm. The extraction was performed in an ultrasonic bath for 15 min on 1 g of sample spiked with deuterated standards, which was placed in 40 mL of a solvent mixture of 1/1 hexane (n-Hexane ≥ 97%, HiPerSolv CHROMANORM® for HPLC) and dichloromethane (Dichloromethane ≥ 99.8%, HiPerSolv CHROMANORM® for HPLC). The supernatant was filtered through a 0.45 µm PTFE (polytetrafluoroethylene) filter. The extract was concentrated to a volume of 5 mL under a gentle stream of N2 with Turbovap® II at 35 °C. The extract was finally purified on a Florisil SPE cartridge (1 g 6 mL) provided by Restek using a two-step elution with hexane (25 mL) and dichloromethane (5 mL).
A GC–MS method for PAH and PCB identification and quantification was modified from a previous study [
32]. The GC–MS system was a Clarus 600/600 C from Perkin Elmer, equipped with a programmable temperature-vaporizing (PTV) injector programmed from 50 to 250 °C at 200 °C min
−1. This enabled the identification and quantification of 7 PCBs (PCB 28, PCB 52, PCB 101, PCB 118, PCB 138, PCB 153, and PCB 180) and 3 PAHs (fluoranthene, benzo(b)fluoranthene, and benzo(a)pyrene). However, benzo(b)fluoranthene and benzo(k)fluoranthene could not be separated with the analytical method and thus, the compound analyzed was benzo(b,k)fluoranthene. A Perkin Elmer DB-5 MS column (30 m × 0.25 mm × 0.25 μm) was used and 1 μL was injected in the splitless mode. A specific oven temperature program from 60 to 280 °C was developed to separate all compounds: 60 °C for 1 min, heated to 150 °C at 40 °C min
−1, then heated to 280 °C at 6 °C min
−1 and held for 20 min. Helium was used as the carrier gas at a constant flow rate of 1 mL min
−1. The ion source temperature was fixed at 250 °C and compound ionization was performed by electron impact ionization (70 eV). The quadrupole mass spectrometer operated with the simultaneous collection of a full scan and selected ion recording (selected ion full ion mode, or SIFI mode). The limits of detection (LOD) for the PCBs and PAHs ranged from 2.45 to 19.11 µg kg
−1 DW and 2.13 to 11.70 µg kg
−1 DW, respectively.
2.4.4. Microbiological Analyses
The functional diversity of bacterial communities was studied using Ecoplate
TM biolog microplates, which contained 96 wells corresponding to three repetitions each of 31 carbon sources and three wells containing water as controls [
17,
33]. After a respiratory process, the use of a carbon source led to the reduction of triphenyltetrazolium (TTC) to formazan, absorbing at 590 nm.
A fresh sample equivalent to 5 g of dry weight, stored for 24 h at 4 °C after collection, was added to 100 mL of 0.1% sodium pyrophosphate and stirred at 80× rpm for 2 h. An amount of 2 mL of the “S1” supernatant was placed in an Eppendorf tube, then centrifuged at 500× rpm for 10 min to obtain the “S2” supernatant. The organic matter was standardized by measuring the absorbance of the “S2” supernatant at 600 nm, diluted ten times with sterile 0.85% NaCl solution. When necessary, the “S2” supernatant was re-diluted with sterile 0.85% NaCl to obtain a final volume of 40 mL with an Abs = 0.03.
Two indices were calculated after measuring the absorbances after 48 h of incubation at 40 °C: The Shannon–Weaver index, H′, which provided information on the diversity of the bacterial communities in the sample [
34], and the AWCD (average well color development) index, which provided information on the overall microbial catabolic activity present in the sample [
35].
H’ = −∑Pi lnPi, where Pi = Abs(i)/∑Pi, where Abs(i) is the optical density for each positive well i and ∑Pi is the sum of the color development of all positive wells.
AWCD = ∑Abs(i)/31, where Abs(i) is the optical density for each positive well (i), and 31 is the number of wells.
2.5. Data Clustering for Statistical Analysis
The objectives were to study the potential abatement and fate of certain compounds and physico-chemical parameters of the leachate after several inputs into the biopile. As seen before, after each leachate addition, three sampling steps were investigated (
Section 2.1). For each measured parameter, the average values calculated on all watering steps according to these three sampling steps led to statistical comparisons between these three steps, in order to evaluate the abatement over a period of 2 weeks after spraying the biopile with compost leachate. The first watering was discarded from the dataset for statistical processing because the obtained values corresponded to an anomaly. The non-parametric Kruskal–Wallis test with Dunn’s procedure was applied to evaluate significant differences between the measured averages. The statistical analyses were performed using XLSTAT statistical and data analysis solutions (Paris, France;
https://www.xlstat.com).
The Ecoplate
TM biolog values (AWCD values obtained for each well) were also analyzed by principal component analysis (PCA) to explain the variance between the different microcosms. For each treatment, the barycenter of the 3 replicates was calculated. The PCA approach, carried out on AZURAD
® (
http://www.azurad.fr/logiciel-plans-experiences.php), made it possible to project the quantitative variables (substrates consumed) and the individuals (sampling campaigns) measured from the biologs.
3. Results and Discussion
3.1. On-Site Characteristics of the Biopile
The average temperatures were, respectively, 74.0 ± 4.6 °C (
n = 8) and 75.0 ± 5.3 °C (
n = 8) for the biopile watered with clean water (control biopile) and for the biopile watered with leachate (test biopile). The humidity was equal to 53.0 ± 3.4% on average for the control biopile and 48.0 ± 4.5% for the test biopile. These values corresponded to optimal conditions for microbial growth during the thermophilic phase [
36,
37].
3.2. Physico-Chemical Characteristics of the Leachates
During the entire experimentation period, the physico-chemical characteristics were determined in the different leachates sprayed on the biopile; the results are presented in
Table 1. A high nitrogen content was noticed, mainly attributed to ammonium ions (more than 80%) and a high ionic strength with an average conductivity value of 49 mS cm
−1. The conductivity ranges of the leachates were in the range of other values reported in the literature (1.4 to 82.6 mS cm
−1) [
8].
3.3. Water Extract Analysis
Table 2 shows the values obtained after the physico-chemical analysis of the water extracts (WEs) throughout the experiment in the test biopile. The results show that the biopile WEs were impacted by the different leachate inputs. Although the pH remained close to neutral (7.8), we noted a strong increase in the average conductivity. The latter doubled at the end of the trial to 4 mS cm
−1, compared to 2 mS cm
−1 before the first addition of leachate. In addition, the detection of volatile fatty acids was only achieved in two samples that were collected 2 weeks after watering (
Supplementary Materials, Table S2). Their presence suggests that anaerobic areas could sometimes exist in the biopile [
38], but that most of the time, aerobic conditions are predominant.
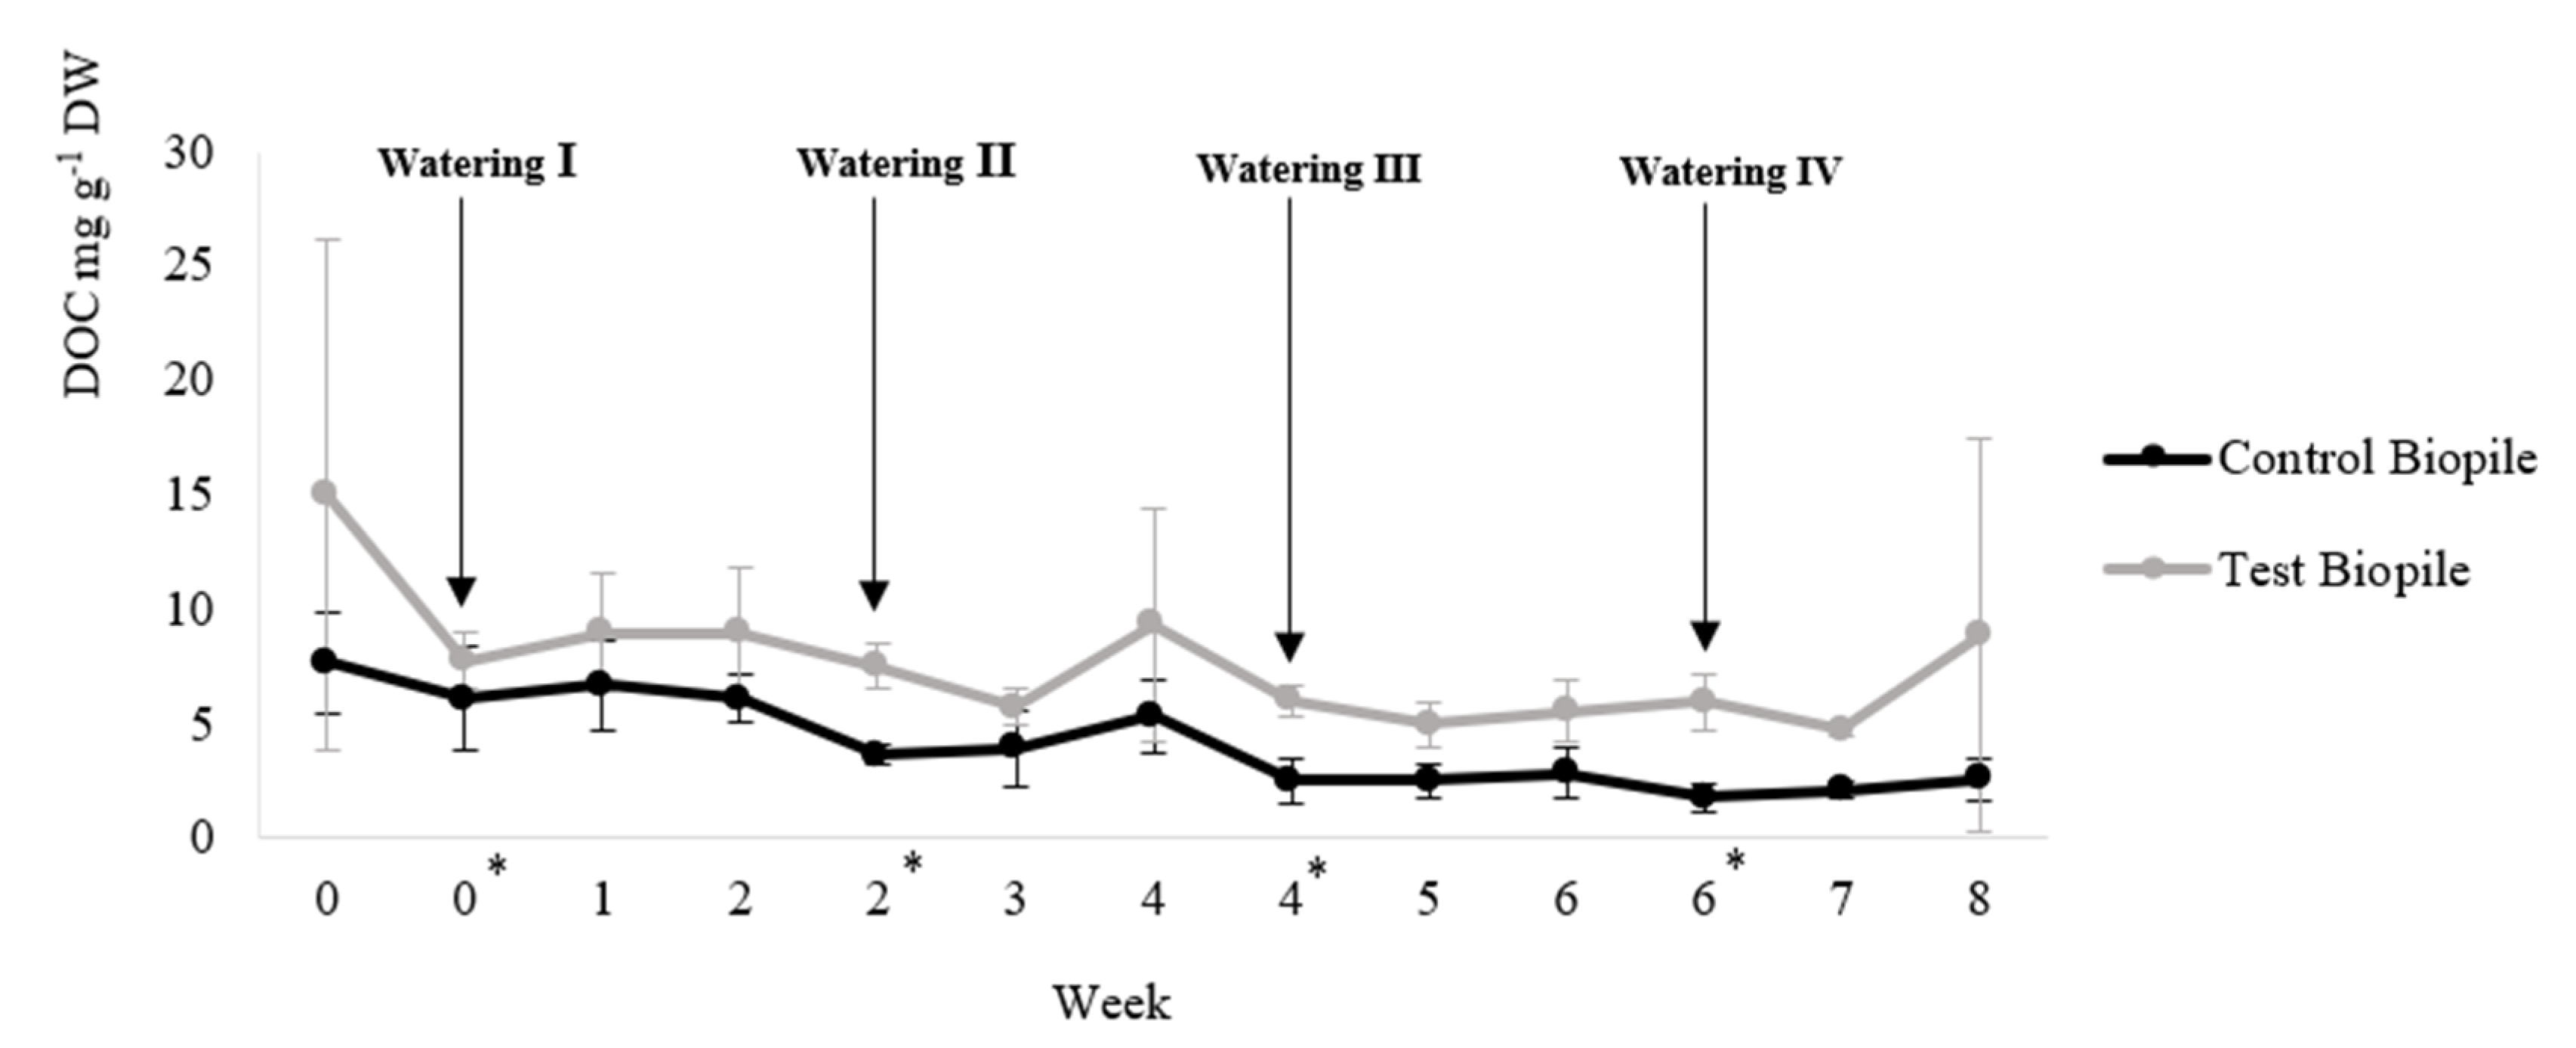
The weak variation in the DOC values in
Figure 1 shows that biopile enrichment with leachate spraying is negligible, although the leachates contained a high organic carbon content (average concentration equal to 2953 mg L
−1,
Table 1). No significant differences were demonstrated between the initial and final DOC values for the test biopile, thus demonstrating a lack of accumulation of organic matter (non-parametric Mann–Whitney test,
p > 0.05), as well as between both biopiles (non-parametric Mann–Whitney test,
p > 0.05). Furthermore, a decrease in the DOC values was observed after watering with water or leachate, which suggests that hydrosoluble organic compounds present in the biopiles could be washed off during the watering. Indeed, during the biodegradation phase of the organic matter from both the substrate and leachate present in the biopile, some organic compounds such as simple sugars and organic acids were produced [
39] and could then be brought into the biopile core during watering. Moreover, the concentrations of nitrate and phosphate ions were not affected by the leachate additions.
From the qualitative indices determined by spectrophotometry, an evolution of the organic matter quality during the 8 weeks of testing could be observed. Indeed, the E2/E3 index varied differently for the watering steps: a non-significant decrease took place immediately after the waterings and a slight increase was observed during the following 2 weeks. Such behavior could be correlated with the previous results on DOCs, with the leaching of simple organic compounds resulting in higher E2/E3 index values during the waterings, and the following production of organic compounds by biodegradation leading to a slight increase in this ratio.
The SUVA
254 index did not vary significantly during the experiment. This index is mainly related to the degree of aromaticity and the molecular weight of the organic matter, and therefore the stabilization of humic substances [
40]. It is quite normal that, at this stage of evolution, after 8 weeks of testing and with still-active biodegradation in the biopile, no trend could be observed.
These results demonstrate the very low impact of the leachate on the overall composition of the biopile. They also demonstrate that it is possible to implement a simple process on site that is capable of optimally processing leachate without considerably enriching the green waste mixture.
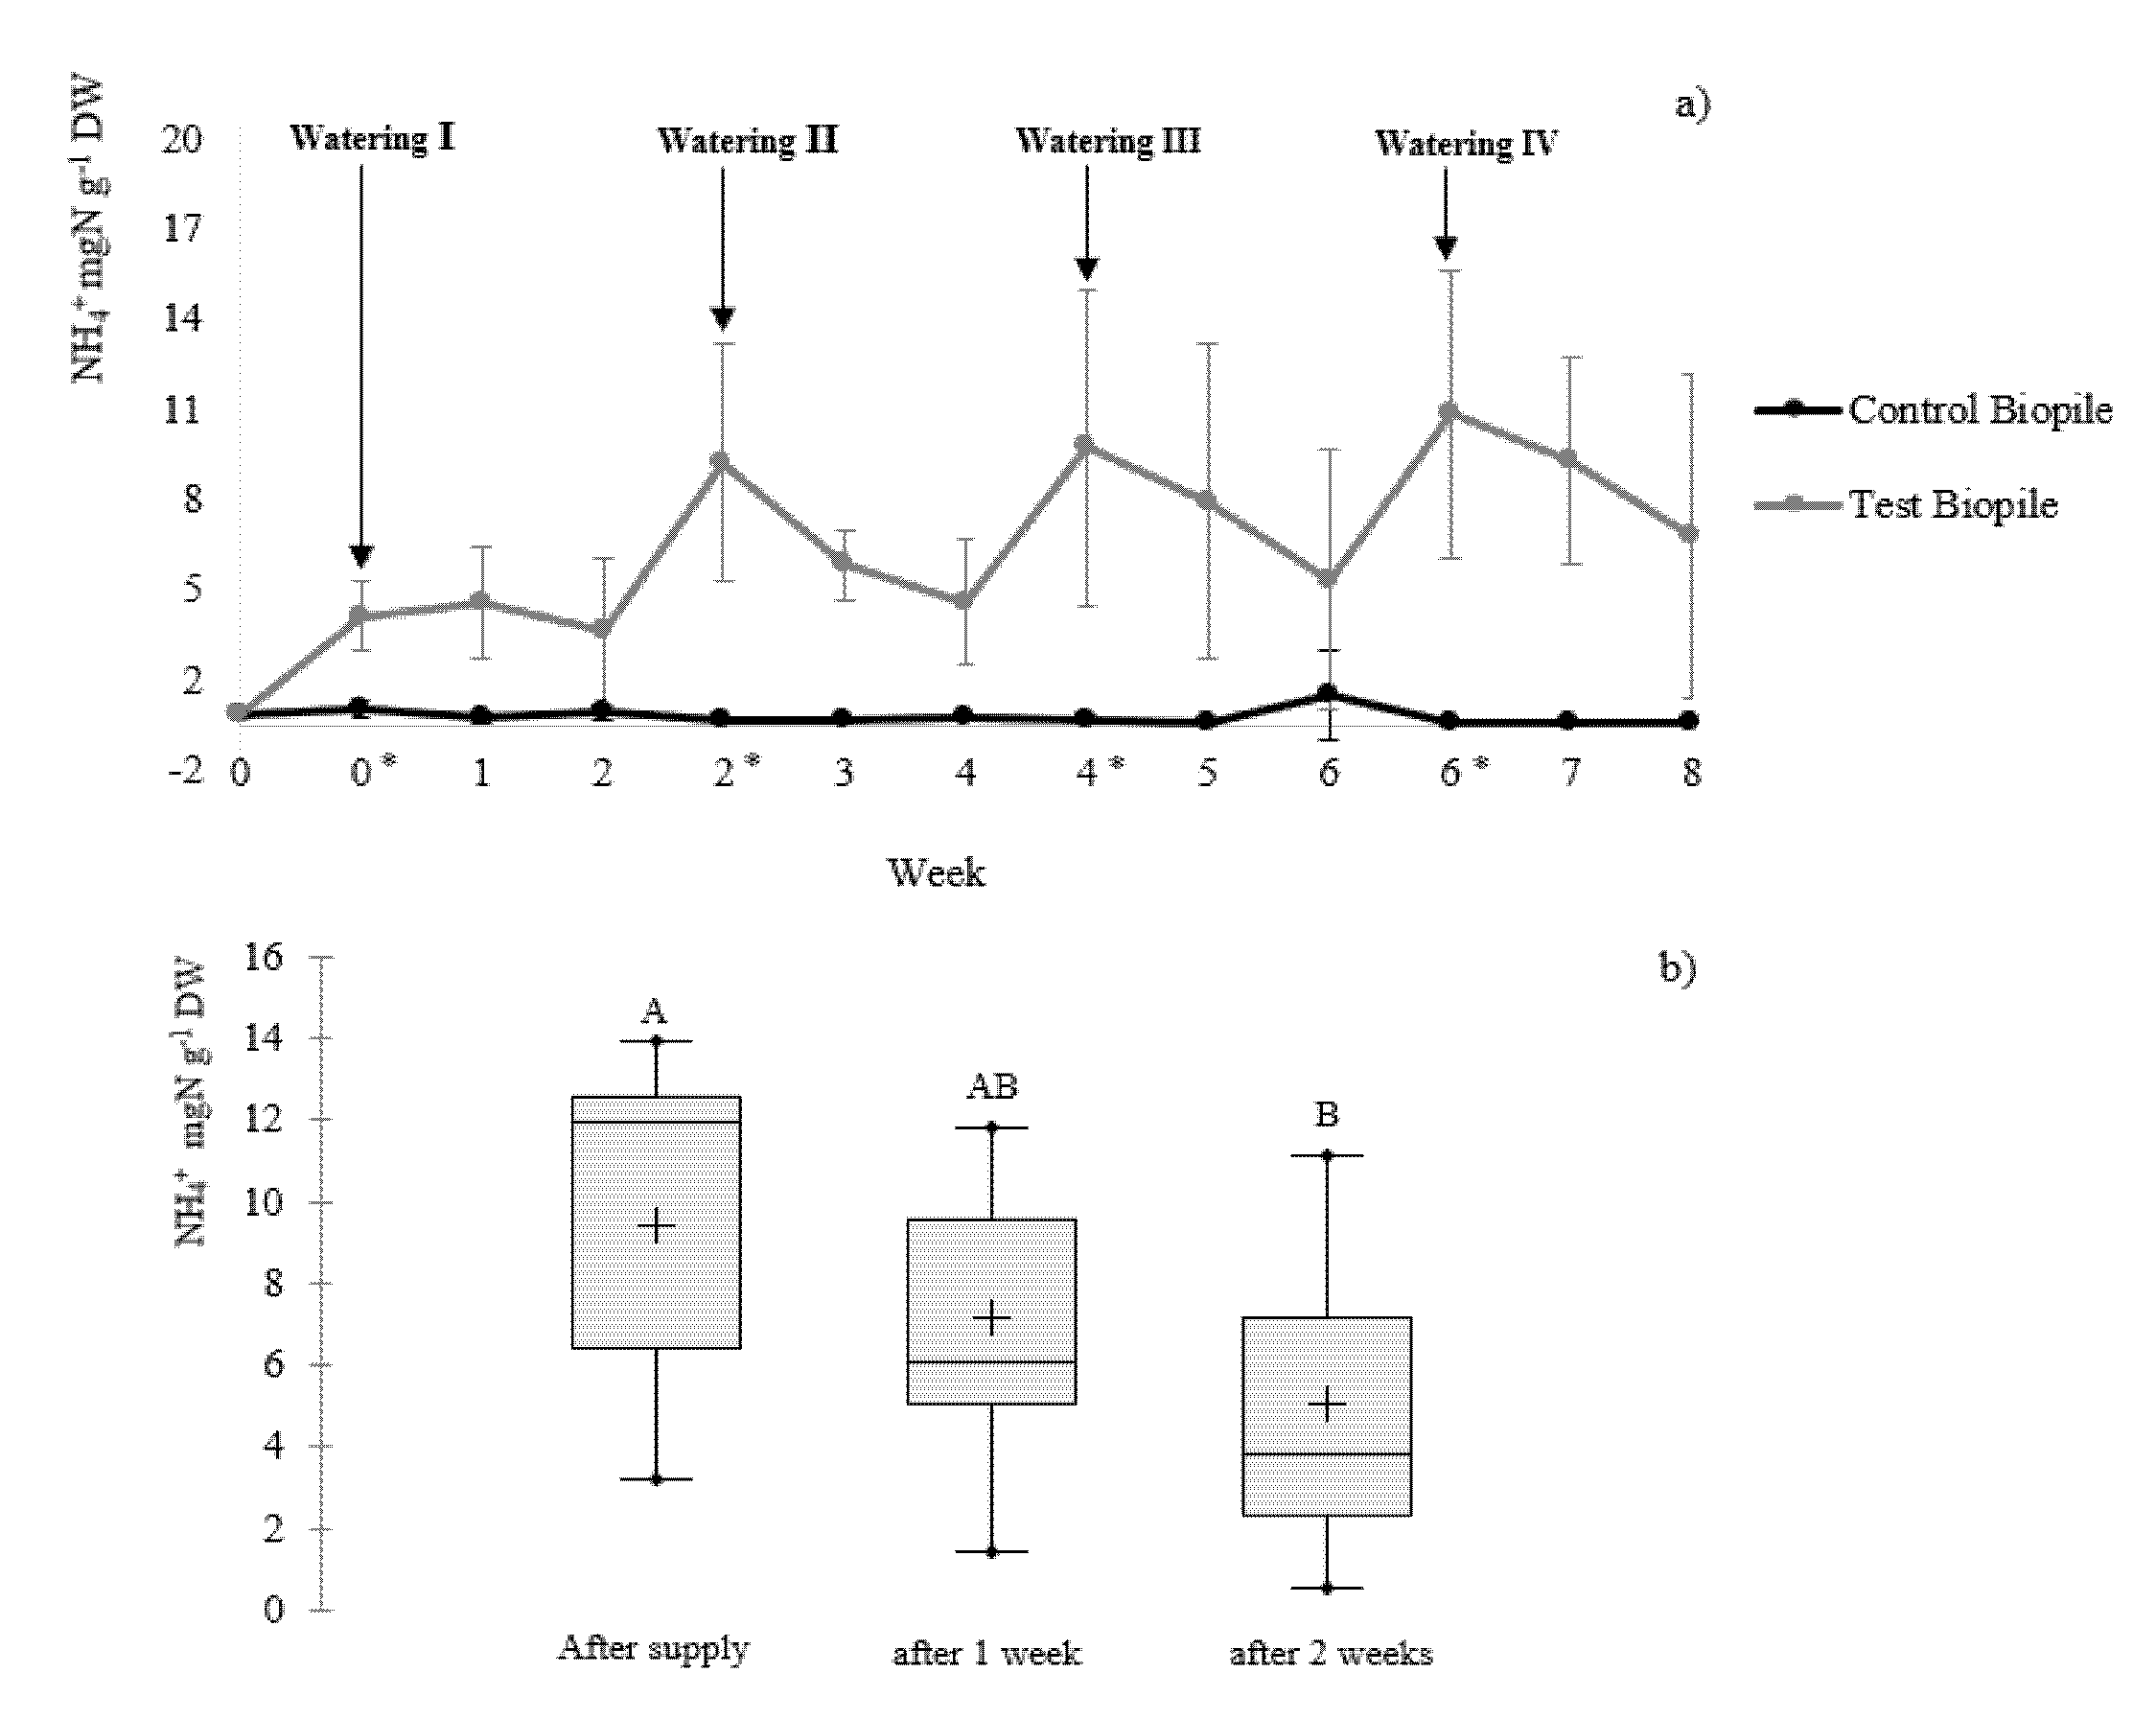
Nitrogen compounds, and particularly ammonium ions, are of great interest due to their major contributions to the treatment of sewage sludge compost leachates. Indeed, more than 80% of the nitrogen introduced by the leachate corresponded to ammonium ions (
Table 1).
Figure 2a represents the temporal evolution of ammonium during the trial. We observed that the control biopile, watered with clean water, contained very little TDN. The test biopile, watered with leachate, was impacted by successive supplies of leachate with a high ammonium load. The evolution of ammonium during the experiment showed a decrease during the two weeks following a watering.
To underline the effects of successive leachate additions on the ammonium ion concentrations, a Kruskal–Wallis test with Dunn’s procedure was undertaken; the results are presented in
Figure 2b (except for the first one, as explained previously). Thus, the reduction in the ammonium nitrogen load is very significant 2 weeks after each watering. This decrease can be explained either by: (1) biological effects related to the microbial growth conditions inside the windrow (
Section 3.1), or (2) the loss of ammonia nitrogen by volatilization linked to the elevated temperatures (>75 °C) reached in the biopile (
Section 3.4).
3.4. Solid Sample Analysis
Table 3 presents the physico-chemical parameters measured in the solid samples collected in the test biopile during the entire experiment. The DW decreased with each successive watering, from 69% RW to 52% RW on average during the whole campaign. No specific enrichment of the biopile with metallic trace elements was noticed during the trial, with the initial concentration values (before supply) being very close to those measured after 8 weeks. This phenomenon was also observed for the total phosphorus.
Concerning the total carbon, its concentration remained the same during the study. This was expected, since the organic carbon input from the leachate in a green waste windrow was negligible compared to the organic carbon already present in green waste substrates. The measured carbon was essentially organic compounds derived from fresh plant waste.
The C/N ratio was followed, as it is usually indicative of the stabilization and maturation of the composting product [
41] and it gives a qualitative evaluation of the organic matter decomposition [
42]. Herein, the C/N ratio remained constant with an average of 13, which was suitable for further composting conditions even after the leachate inputs [
43].
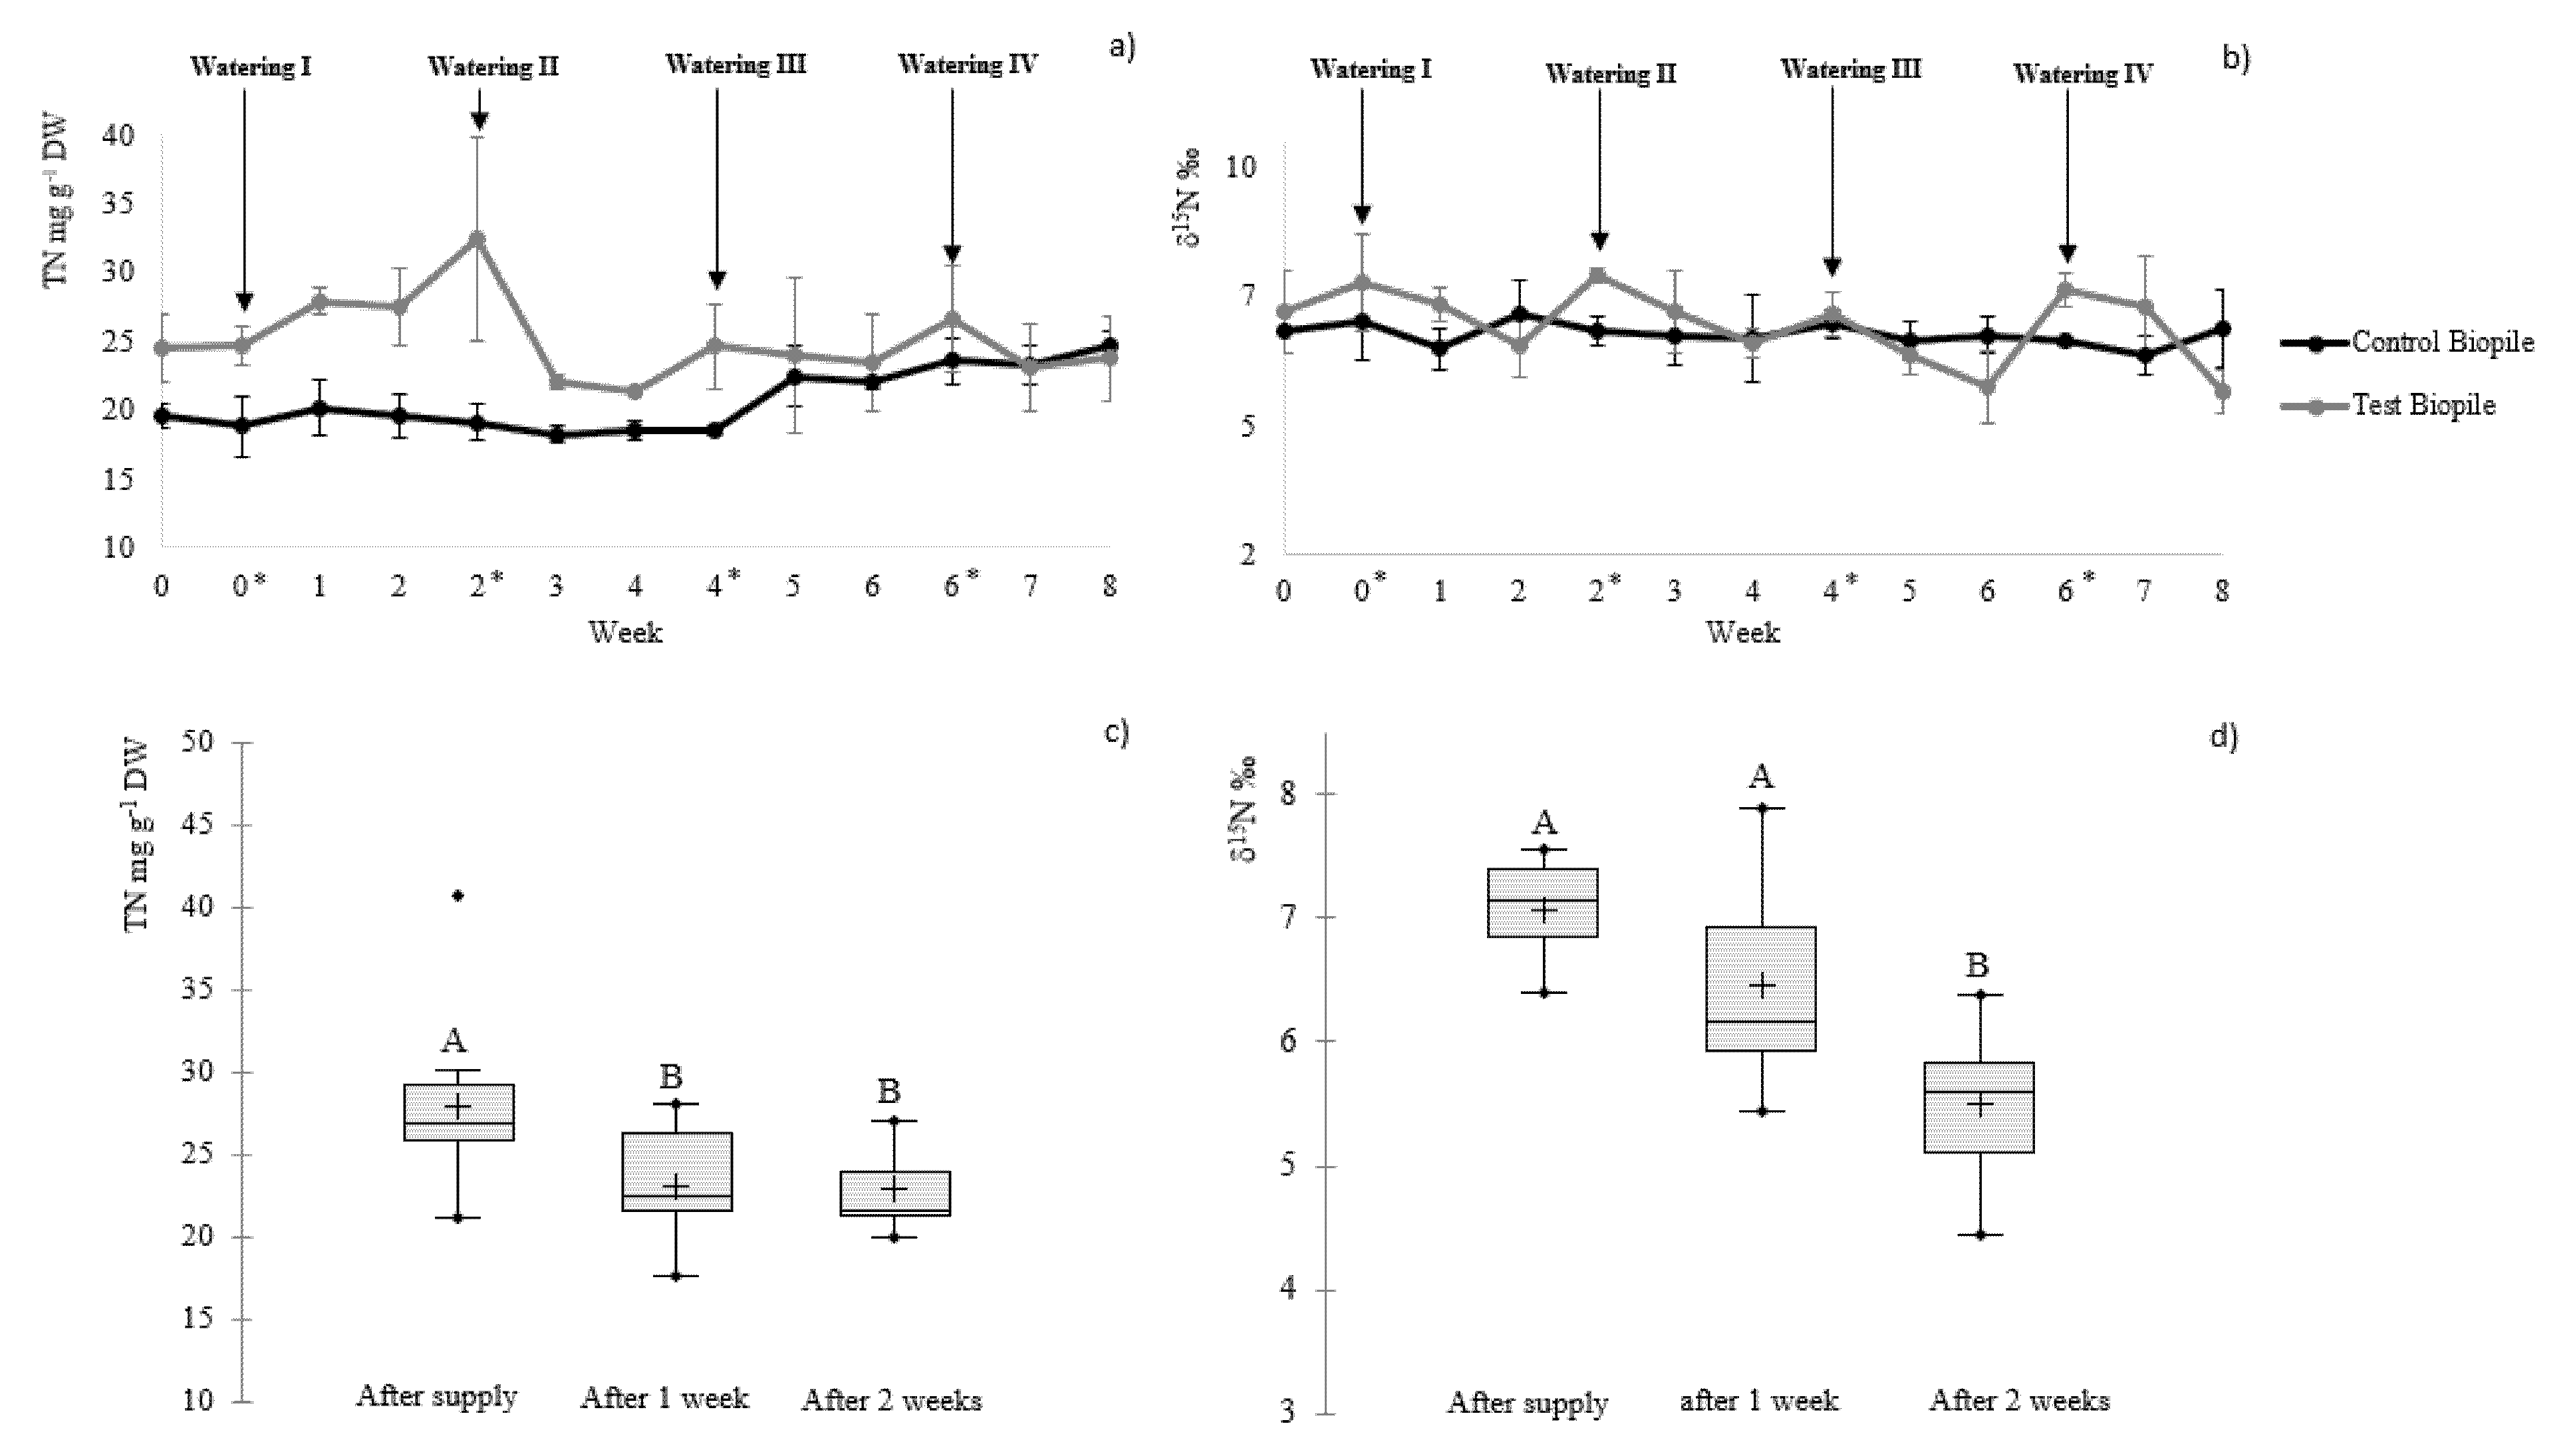
The evolution of the total nitrogen concentration in the test biopile showed an increase immediately after the leachate inputs (
Figure 3a) and a significant decrease 1 week later (
Figure 3c), except after the first watering. Moreover, in
Figure 3b,d, the nitrogen isotopic signature (δ
15 N) confirmed this trend by increasing after the leachate inputs (average value 7.1‰), and decreasing 2 weeks later (average value 5.5‰) (
Supplementary Materials, Table S3).
The change in the isotope ratio of the total N clearly suggests that a loss occurred from the liquid pool of N, since a loss from solids is not affected by Rayleigh isotope enrichment in the remining pool.
The loss of nitrogen decreased with ammonium nitrogen. Our calculation with the PHREEQC model (
Supplementary Materials, Figure S1) showed that, at a biopile temperature of 75 ± 5 °C, NH
3 accounted for about one third of the total ammonia and that this percentage reached 40% at 85 °C. The volatilization of NH
3 from an aqueous solution is a process that is known to cause fractionation of δ
15 N [
44]. Therefore, the loss of total nitrogen following the two weeks after watering was probably caused mainly by the volatilization of NH
3 [
45]. It should be noted that losses of nitrogen in its gaseous form (NH
3) occur in the various nitrogen transformation processes [
46].
The analysis of seven PCBs and three PAHs in the solid phase of the test biopile, monitored with the French standard (NFU 44-095), showed low levels of organic pollutants before and after 8 weeks. Regardless of the sample, no detectable PCBs were observed (all concentrations were under the detection limits). All three PAHs were detected, but only two of them were quantified, with benzo(a)pyrene being present under its quantification limit (
Supplementary Materials, Table S4). The total concentration of fluoranthene and benzo(b,k)fluoranthene before and after 8 weeks of spraying were approximately the same—around 120–130 µg kg
−1. The concentration levels determined for the PAHs were equivalent to those found in the scientific literature [
47]. These results demonstrate that the biopile was not contaminated by PAHs or PCBs from the leachate spraying.
3.5. Microbiological Analyses
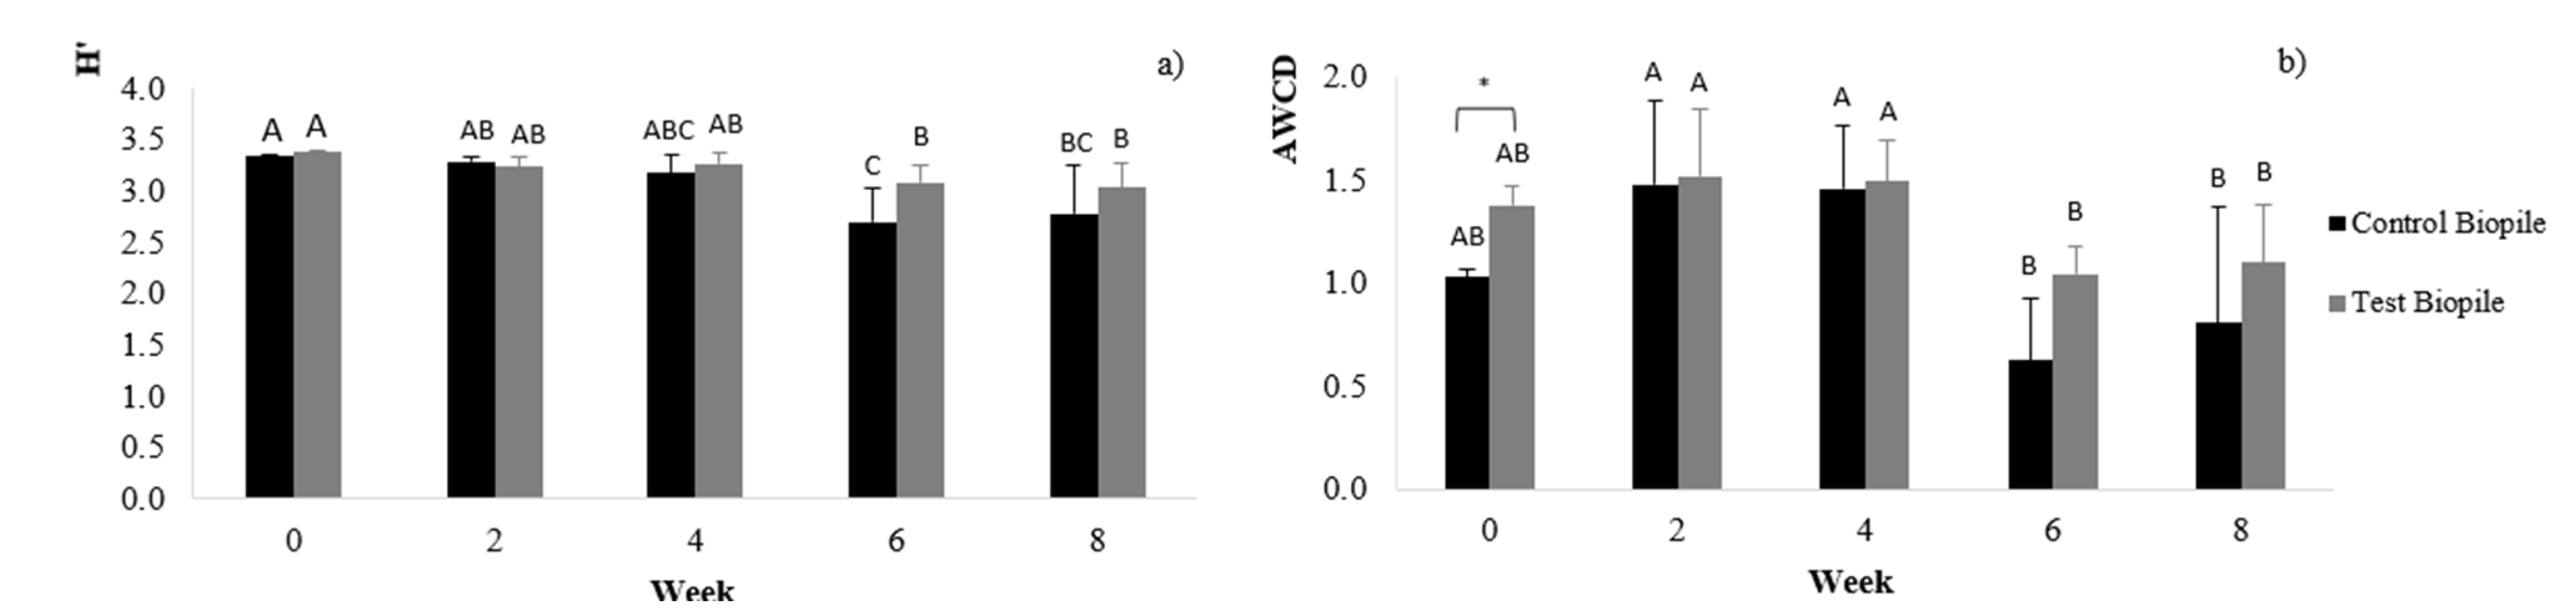
The microbiological analyses showed no temporal evolution from week 0 (W0) to week 4 (W4), with a similar catabolic diversity (
Figure 4a). This suggests that the leachate inputs did not significantly modify the catabolic diversity in the biopile for these first 4 weeks. From the fourth week onwards, the diversity significantly decreased compared to W0 in the control biopile. In addition, the diversity in the test biopile significantly decreased by the sixth week compared to W0. This could be related to the addition of organic matter from week 0 (W0) to week 4 (W4), which may favor the maintenance of certain microbial communities in the test biopile.
The overall microbial activity (
Figure 4b) in week 6 decreased significantly from that measured at week 4 for both types of biopiles. However, there was no change in the global trend of microbial activities from the beginning to the end of the experiment. A significant difference at W0 between the control and test biopiles was noted before the first watering. The windrows that were put in place a few days before the start of the test could explain this result. However, after the first watering, the respective microbial activities of the two biopiles were similar. We can therefore identify two evolutionary trends during our campaign: a first phase, with high catabolic diversity and microbial activities, and a second, with lower catabolic diversity and microbial activities.
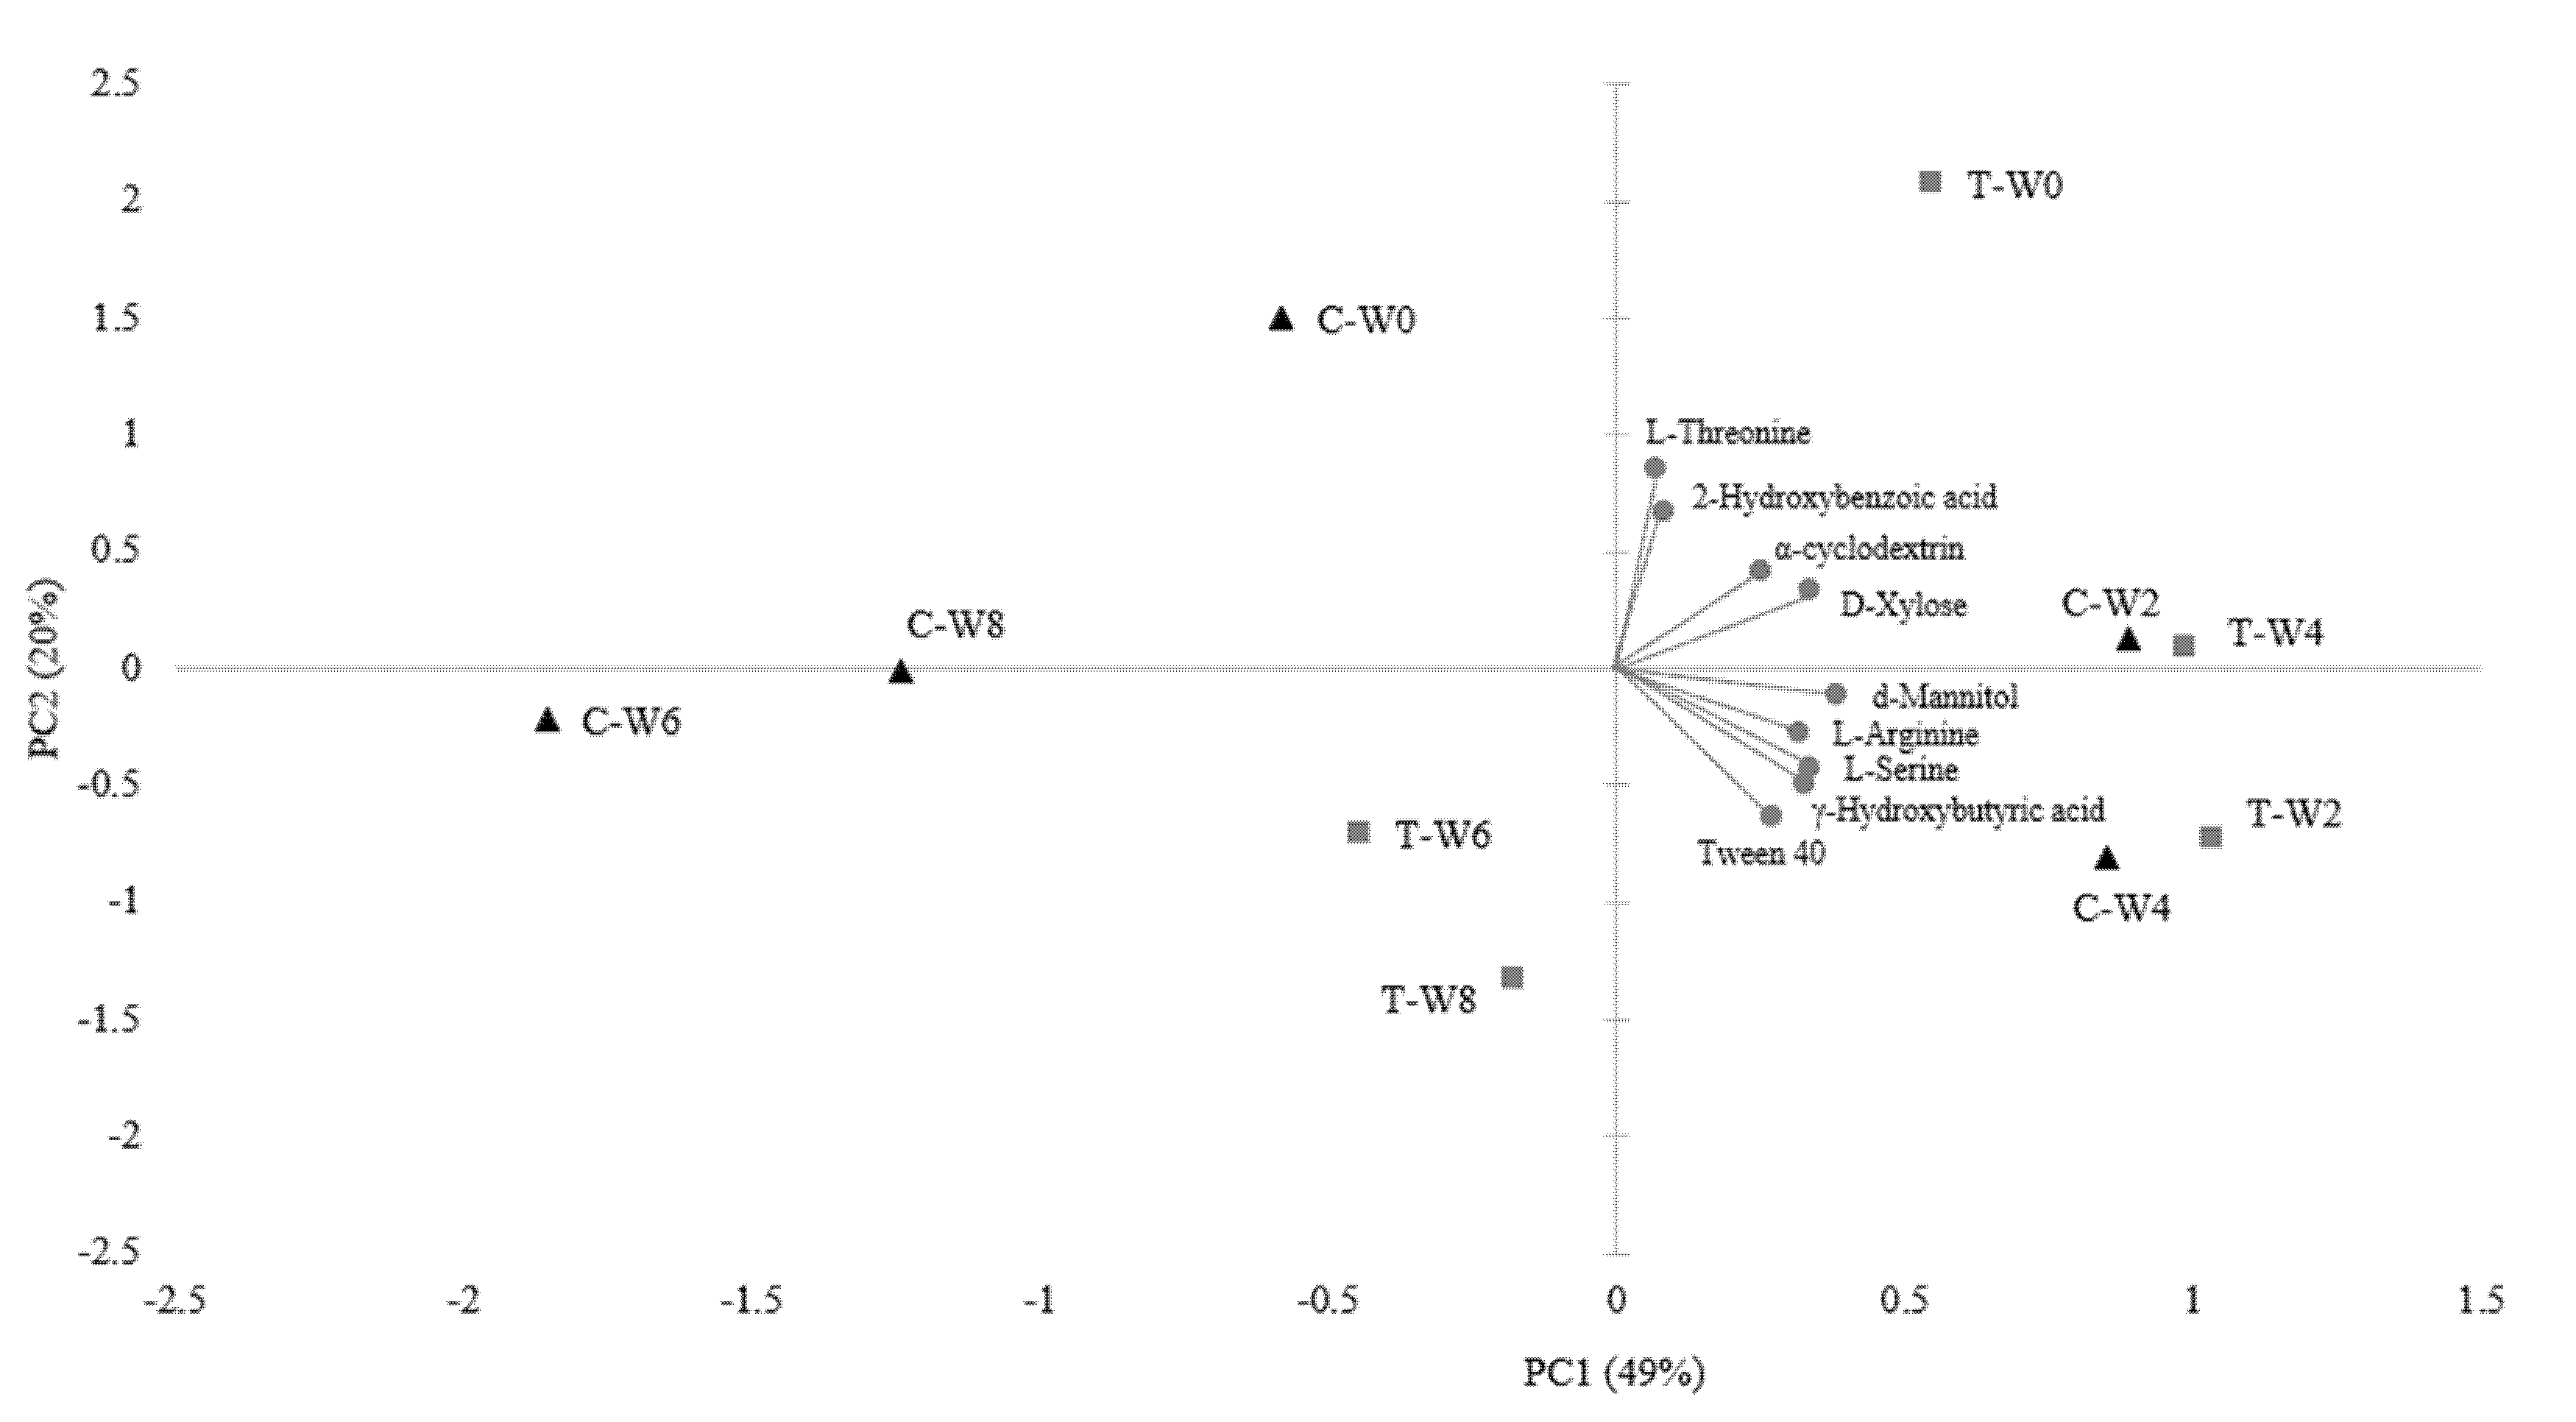
A principal component analysis [
48,
49] of the biological data is presented in
Figure 5 according to PC1 and PC2, which supported 69% of the variance. The PCA clearly shows a difference in the catabolic profiles of the microbial communities [
50] for both the control and test biopiles, depending on the time of incubation (W0 to W8) and according to PC1 (49% of variance). The projections from the four first weeks of incubation (on the positive part of the axis) were indeed discriminated from the projections of W6 and W8 (on the negative part of the axis). Moreover, it should be noted that the microbial catabolic profiles between the control and test biopiles also differed according to PC1. At W0, the microbial communities present in the test biopile were involved in the transformation of substrates such as 2-hydroxybenzoic acid, which is typical of a lignocellulosic substrate. However, after spraying, it was mainly compounds from carbohydrate families and amino acids which were the most degraded during campaigns W2 and W4. The microbial communities involved in the degradation of labile substrates in the biopile were potentially introduced and/or favored by the leachates. No marker was strongly and positively correlated to the projections from campaigns W6 and W8. This can be explained by a lower catabolic diversity and microbial activity.
3.6. Assessment of Biopile Efficiency in the Perspective of Its Valorization
The evolution of microbial populations during the trial indicated that indigenous micro-organisms, which are responsible for the biological degradation within the biopiles (
Figure 4), are well-adapted to degrade the available substrates and those potentially introduced by the leachates.
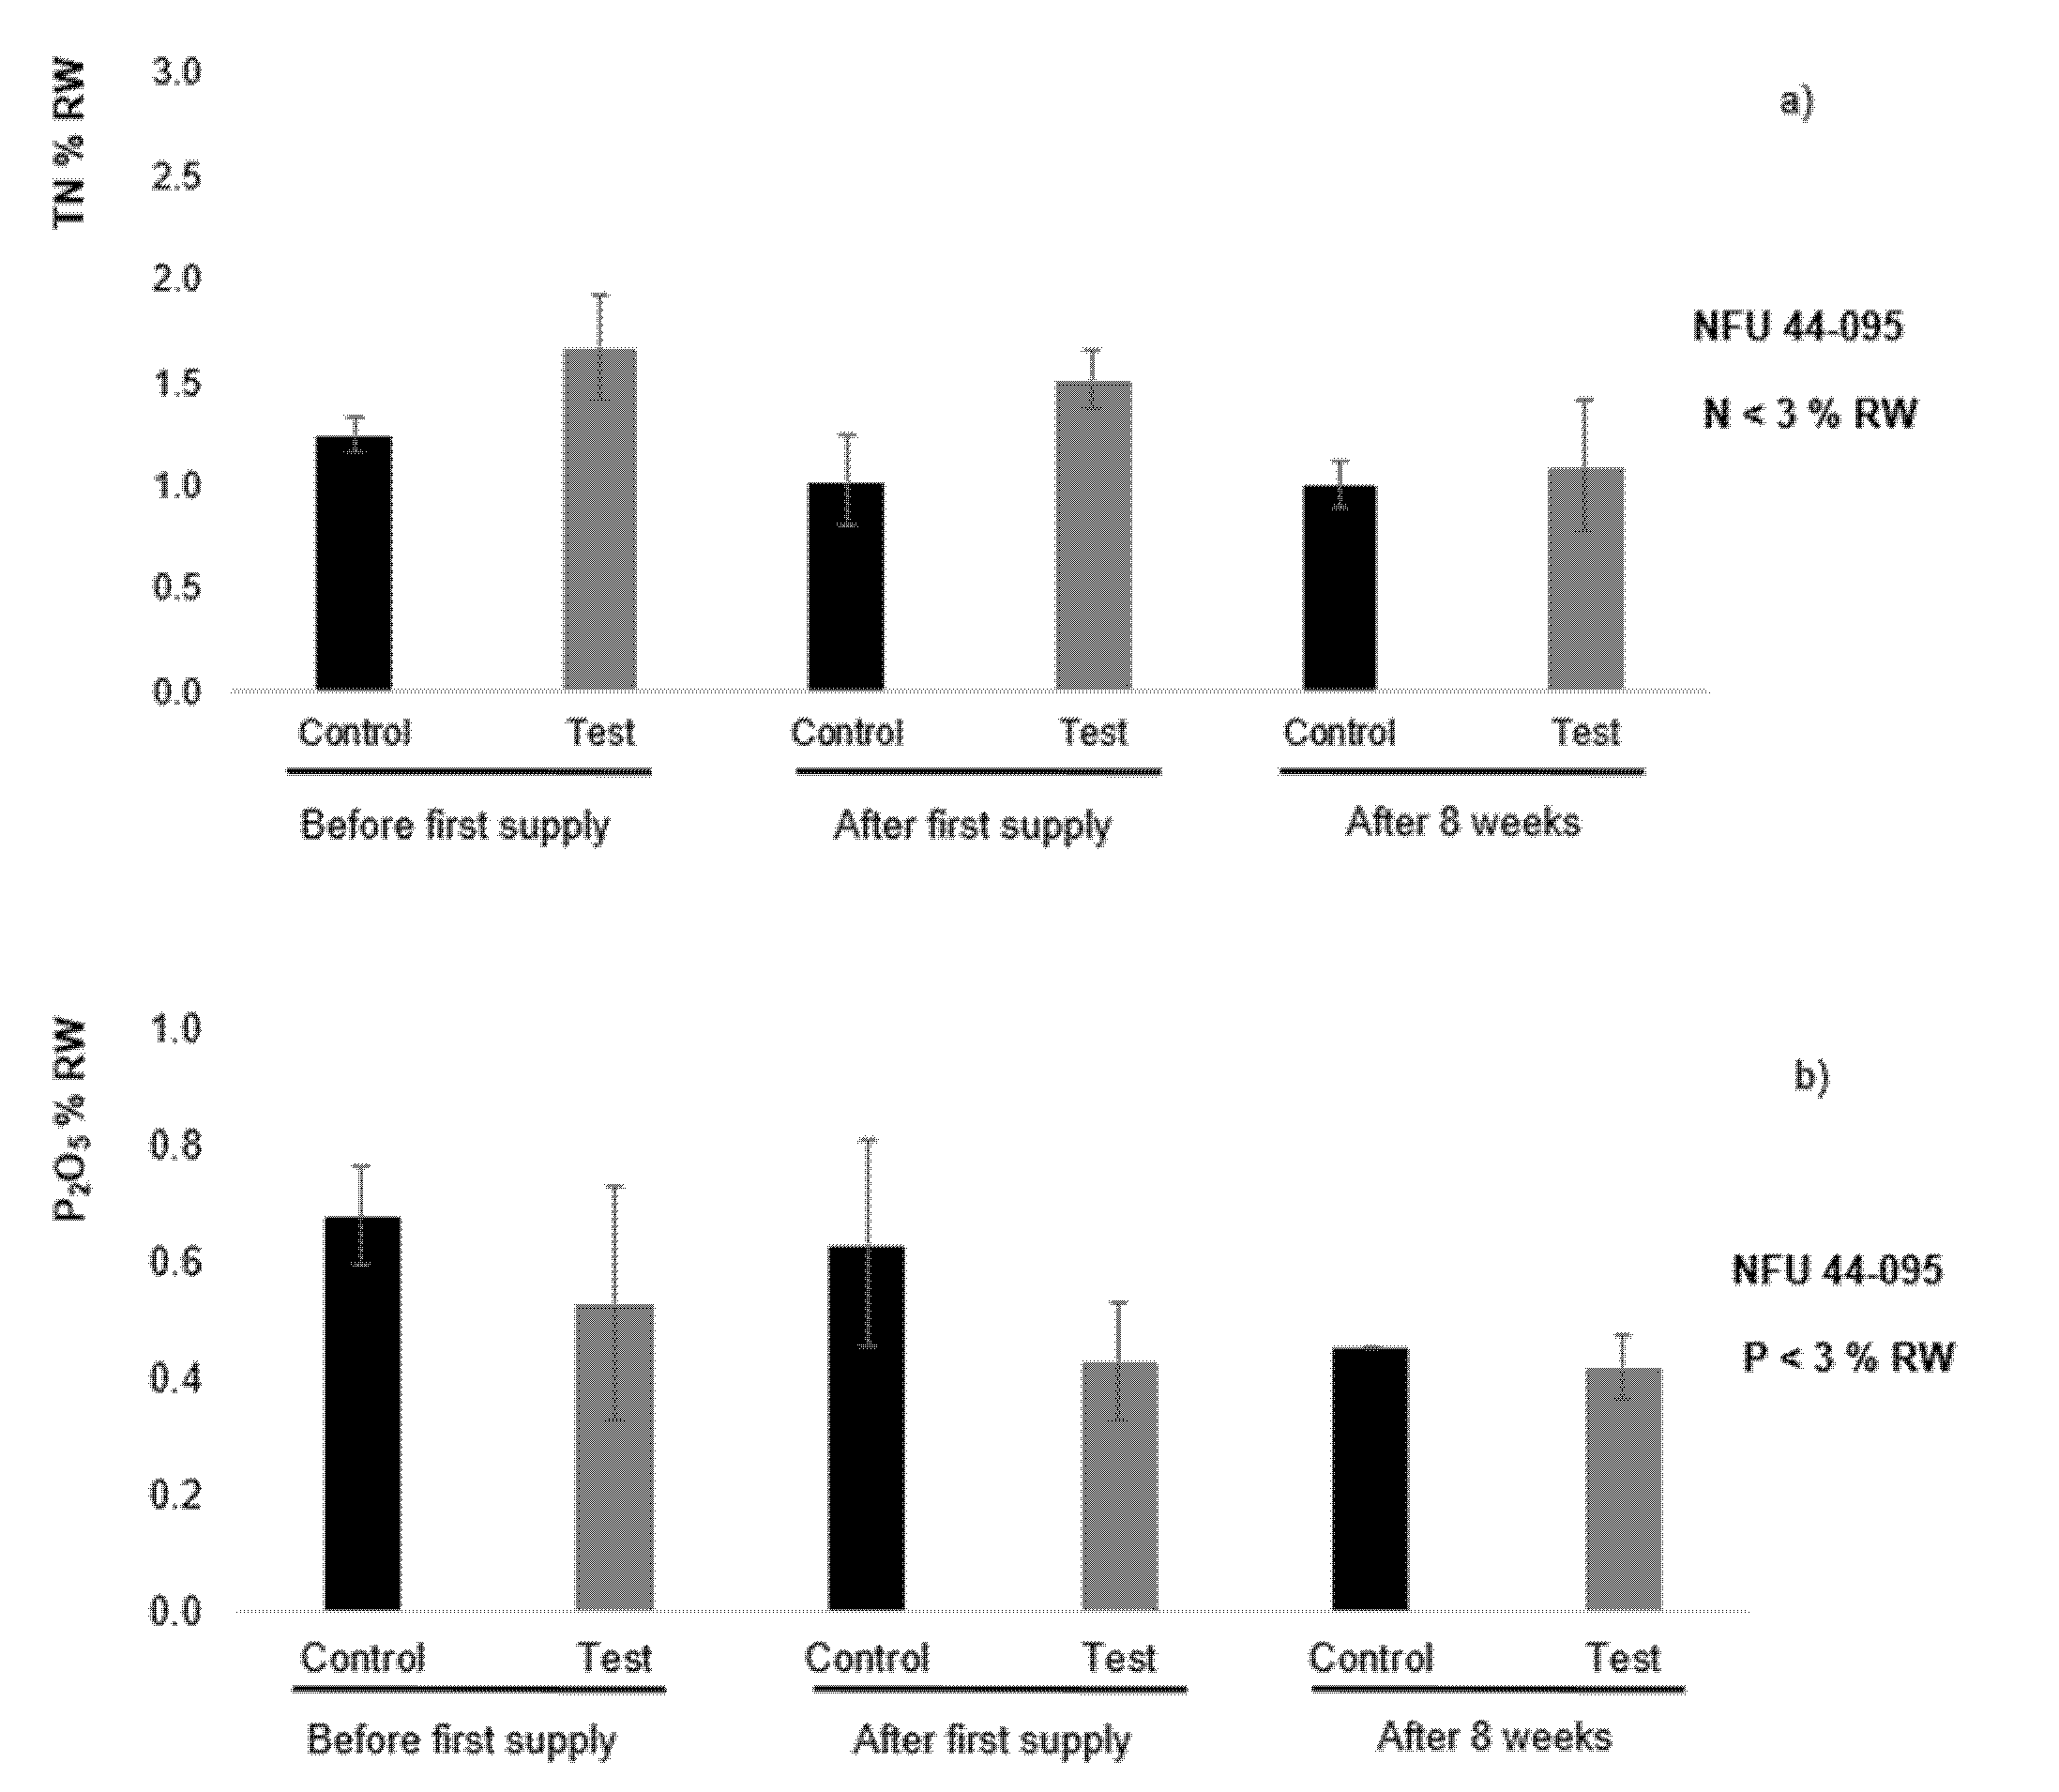
In the solid phase, among the physico-chemical parameters monitored in the French standard (NFU 44-095) which governs the production of sewage sludge composts, the TME and POP results showed that the biopile was not enriched by leachate additions (
Supplementary Materials, Tables S3 and S4). In terms of agronomic criteria, the total nitrogen and total phosphorus thresholds measured in the leachate-watered biopile were similar to those measured in the control biopile (
Figure 6).
These results validate the process of the elimination of compost leachates by spraying them on a green waste biopile. As the biopile substrate must ultimately join the composting process for its on-site valorization in a circular economy, it has been shown to meet the standards of use for MIATE composts (i.e., in accordance with the NFU 44-095 standard for monitored pollutants and agronomic parameters).
From an economical point of view, the current annual cost for the composting platforms used to treat leachates in a sewage treatment plant is around EUR 130,000. The alternative process described in this study would have a much lower cost, essentially equaling the cost of purchasing the leachate sprinkling device (EUR 20,000 for an autonomous watering device for a biopile). The material used as a substrate for the biopile is available on the composting platform, and the completion of the biopile would be carried out by staff internal to the company and would require only the completion time (about one day every 2 months for the management of a biopile).
4. Conclusions
This study allowed us to propose an on-site alternative approach for the treatment of leachates from sewage sludge composts on a green waste biopile with zero discharge (no percolate). The microbiological analysis indicated that the microbial populations already present in the biopile were able to ensure the biodegradation, and that the leachate input did not significantly modify the catabolic diversity of the biopile. The monitoring of the physico-chemical parameters showed that the leachate inputs did not significantly enrich the biopile with organic or inorganic elements or compounds (total organic carbon, phosphate, total phosphorus, TMEs, or POPs). A significant total nitrogen abatement in the solid phase was observed after each leachate addition every 7 days, and in the water extracts every 15 days, resulting in ammoniacal nitrogen loss.
The duration of the leachate treatment on a biopile could be improved and increased while respecting the MIATE compost product standards of use, as the biopile substrate should ultimately reach the composting process for its on-site valorization from a circular economy perspective. Another point of interest for this method of valorization is the optimization of the composting process. Future work should involve experiments with the introduction of the biopile substrate at the start of the bio-oxidation process in a certain proportion, in order to determine the potential impacts of the microbiological input on the effectiveness of the biodegradation of organic matter. We hope that the maturation phase would also be impacted and reduced over time, which would be a positive point in the management of the composting platform.
Thus, composting platforms could treat their leachates on site with a simple and rustic method that is economically viable and sustainable, and this could be expanded to other waste-composting process (household, agricultural, or industrial biowastes) that produce leachates.


 ,
, 


