Article

Investigation of the Relation between Temperature and M13 Phage Production via ATP Expenditure

1
Center for Bionano Intelligence Education and Research, Department of Bionano Engineering, Hanyang University, 55 Hanyangdaehak-ro, Sangnok-gu, Ansan 15588, Korea
2
Department of Chemistry, The University of Hong Kong, Pokfulam Road, Hong Kong, China
*
Author to whom correspondence should be addressed.
Processes 2022, 10(5), 962; https://doi.org/10.3390/pr10050962
Submission received: 12 April 2022 / Revised: 6 May 2022 / Accepted: 8 May 2022 / Published: 11 May 2022
(This article belongs to the Special Issue Bioprocess Design and Optimization)

Abstract

:
M13 bacteriophage is a promising biomolecule capable of various bionano and material science applications. The biomaterial can self-assemble into matrices to fabricate bioscaffolds using high phage concentration and high phage purity. Previous studies aimed to acquire these conditions in large-scale phage production and have identified the optimal culture temperature range at 28–31 °C. However, explanations as to why this temperature range was optimal for phage production is absent from the work. Therefore, in this study, we identified the relation between culture temperature and M13 phage production using ATP expenditure calculations to comprehend the high yield phage production at the optimal temperature range. We extended a coarse-grained model for the evaluation of phage protein and ribosomal protein synthesis with the premise that phage proteins (a ribosomal protein) are translated by bacterial ribosomes in E. coli through expenditure of ATP energy. By comparing the ATP energy for ribosomal protein synthesis estimated using the coarse-grained model and the experimentally calculated ATP expenditure for phage production, we interpreted the high phage yield at the optimal temperature range and recognized ATP analysis as a reasonable method that can be used to evaluate other parameters for phage production optimization.

1. Introduction

M13 bacteriophage (M13 phage) is a versatile biomolecule that is capable of various bionano and material science applications. M13 phage is constructed from a few copies of minor coat proteins p3, p6, p7, and p9, located at the ends of the phage and ~2700 copies of major coat protein p8, constituting the main body, which create a high aspect ratio of the phage, ~880 nm in length and 6 nm in diameter [1,2]. This high aspect ratio provides liquid crystalline properties that enable spontaneous ordering of the phage, termed self-assembly [3,4]. Matrices of self-assembled M13 phage have unique properties (e.g., biopiezoelectricity, coloration) that can be used for several applications, such as biopiezoelectric systems [5,6], tissue regeneration [3], and colorimetric matrix sensors [7]. To facilitate the fabrication of bioscaffolds through self-assembly, high concentration and high purity (95% or above) of the M13 phage are required [8].
For large-scale production of M13 phage, it is essential to optimize certain production processes. Previous studies have investigated the optimal conditions for phage production through adjustment of various parameters, such as culture temperature, medium, incubation time, pH, and initial concentration of phage and/or E. coli [9,10,11,12,13]. However, detailed explanations on why these optimal conditions produce high yields of M13 phage are not provided in these studies. There is also a lack of information regarding the actual optimized conditions for M13 phage production, and even the little information on filamentous phages like M13 is relatively less than studies using lytic phages [14,15,16]. Nevertheless, of all the conditions, temperature was considered as a major factor in every study for phage production regardless of the phage type [9,10,11,12,13,17,18,19]. Particularly, 28–31 °C was suggested as the optimal temperature by most study groups, but an analysis on why the specific temperature was optimal for phage production was not disclosed [16,20]. Therefore, we investigated the underlying factor that accounted for the high yield phage production at the specific temperature range.
In our study, we used adenosine triphosphate (ATP) expenditure as an index for evaluating M13 phage production with temperature changes. In general, viruses, especially influenza and T4 phage, have been deeply studied regarding the ATP expenditure during infection [21,22]. Nevertheless, ATP expenditure for M13 phage has not been sufficiently investigated, and we aimed to examine the ATP expenditure based on previous observations. Similar to other viruses, ATP molecules produced in E. coli are partially used for phage DNA replication, phage protein translation, and phage assembly/extrusion [23,24,25,26,27]. After E. coli is infected with phage, various bacterial polymerases consume ATPs to replicate phage DNA and translate M13 phage proteins using ribosomes in the E. coli [28]. Since a portion of the ATP in infected E. coli is allocated to M13 phage protein translation/phage DNA replication and higher production of E. coli increases the amount of ATP available, we examined the relationship between phage production and E. coli growth at different culture temperatures by estimating the energy used for phage production and comparing it to ATP expenditure measurements to identify the cause of high yield phage production at the specific optimal temperature range.
We analyzed the results of the E. coli growth and phage production correlation at different culture temperatures via ATP expenditure by extending a coarse-grained model (originally used for evaluation of E. coli protein synthesis) to phage protein synthesis [29]. E. coli growth was measured for the log phase, which is an interval of fermentation that produces the highest number of cells in a short period of time (highest growth rate). The course-grained model states that the synthesis of ribosomal proteins, phage proteins and E. coli proteins translated by ribosomes (including the E. coli ribosomes themselves), is most advantageous at this log phase and non-ribosomal protein translation levels can be ignored [30,31,32]. Therefore, higher growth rates at the log phase enable more production of ribosomal proteins (higher mass fraction and ribosomal efficiency), which could directly enhance phage protein synthesis and ultimately phage production [30,33,34,35]. Because a portion of the ATP in E. coli is used by the bacterial ribosomes for phage protein translation [36], we hypothesized that log phases of E. coli fermentation with higher growth rates enabled higher percentages of ATP molecules used for ribosomal protein synthesis, and for E. coli infected with phage, enabled higher amounts of ATP for M13 phage production. Growth rates of E. coli batches fermented with phage infection at different temperatures were compared to identify if the optimal temperature range produced the highest growth rate for maximum ribosomal protein synthesis. Additional comparisons between E. coli batches fermented with and without phage infection at different temperatures were conducted to estimate the energy percentage used for ribosomal protein synthesis, excluding the energy used for cell growth. The estimated energy percentages were further compared to ATP expenditure percentages produced from experimental measurements of intracellular ATP levels of E. coli produced with and without phage to identify if the estimated energy percentage was actually used for phage production.
Based on previous studies, the optimal temperature for analysis that was selected to represent the optimal culture temperature range was 30 °C for our system. Analysis results using the 30 °C optimal temperature and control temperatures (25 °C and 37 °C) showed that 30 °C produced the highest growth rate and enabled the highest percentage of energy to be used for ribosomal protein synthesis (highest mass fraction of all ribosomal proteins and ribosomal efficiency), which was identified to be significantly similar to the ATP expenditure percentage for phage production. Therefore, it was confirmed that the high yield phage production observed at the optimal temperature range was attributed to the high growth rate of E. coli that enabled higher portions of ATP to be used for ribosomal protein synthesis, specifically for phage production. We examined the correlation between temperature and ATP expenditure and identified ATP expenditure analysis as a critical method for confirmation of optimal conditions. Furthermore, we considered various possibilities of ATP expenditure analysis for verification of the optimum values of other parameters such as pH, ionic environment and E. coli strain.

2. Materials and Methods

2.1. Preparation for M13 Phage Production

XL1-Blue (Agilent, XL1-Blue Competent Cells, Santa Clara, CA, USA) was used as the host E. coli strain. Wild-Type (WT) M13KE bacteriophage was selected as the phage for production and was genetically engineered to display the 4E (glutamate; EEEE) and Y3E (tyrosine; YEEE) peptide sequences at the N terminus of the major coat protein p8 (Figure S1). Luria broth (LB, Sigma-Aldrich, for molecular biology, Seoul, Korea) was dissolved in distilled H2O (4.2 L) to prepare the LB medium and was autoclaved before use.

2.2. M13 Phage Production

All fermentation was conducted in a pre-autoclaved stirred tank bioreactor with two 6-plate turbines (Sartorious, Biostat B, Göttingen, Germany) filled with LB medium (4.2 L). E. coli and M13 phage were mixed and preincubated in a flask containing LB medium (50 mL) for 12 h at 37 °C. After incubation, the E. coli-phage solution was centrifugated at 4 °C, 12,100× g, for 20 min to obtain the phage stock. Fresh E. coli and phage stock were inoculated in the bioreactor LB medium with 1.25 × 10⁹ colony-forming unit per milliliter (cfu/mL) E. coli stock concentration and 3.90 × 10⁹ plaque-forming unit per milliliter (pfu/mL) phage stock concentration, in average. The bioreactor parameters for M13 phage production were set at 3 lpm (liters per minute) air injection and 220 rpm (revolutions per minute) stirring speed to mix the contents at specific temperatures (25 °C, 30 °C, and 37 °C) for 16 h. The pH value for fermentation was maintained at ~7.4 pH.

2.3. M13 Phage Purification via Polyethylene Glycol (PEG) Precipitation

E. coli culture fermented with M13 phage was purified via polyethylene glycol (PEG) precipitation using a PEG-NaCl solution [2], prepared with PEG (Fisher BioReagents, Polyethylene Glycol 8000, H(OCH2CH2)nOH, Pittsburgh, PA, USA) and sodium chloride (Fisher BioReagents, Pittsburgh, PA, USA), mixed in deionized water (Merck, DI water, Milli-Q Direct Water Purification System, Seoul, Korea). After PEG precipitation, the phages were dissolved in 1X tris buffered saline (Fisher BioReagents, TBS, pH 7.4, Pittsburgh, PA, USA). Absorbance of purified M13 phage was measured using a UV-vis spectrophotometer (Shimadzu, UV-1990I, Kyoto, Japan) [37]. The phage concentration using the measured absorbance was calculated using the following equation [11]:
mg   of   phage / mL = Dilution   Factor × A 269 A 320 / 3.84
A269 and A320 represents the M13 phage absorbance at 269 nm wavelength and the background absorbance at 320 nm wavelength.

2.4. E. coli Growth Level Analysis via Optical Density Measurements

E. coli culture samples were extracted every three hours from the bioreactor during the 16 h fermentation process and were subjected to optical density (OD600) measurements at 600 nm wavelength using a UV-vis spectrophotometer (Shimadzu, UV-1800, Kyoto, Japan), with the LB medium used as the background.

2.5. Intracellular ATP Analysis via Luminescence Assay

Intracellular ATP levels of E. coli were measured using a cell viability luminescent assay reagent (Promega, Bactiter-Glo Microbial Cell Viability Assay Reagent, Madison, WI, USA), which produced luminescent signals proportional to ATP content [38]. Pre-treatment solution was prepared by adding methanol (Sigma-Aldrich, ~50%, pH 7.4, Seoul, Korea) to 20 mM Tris-HCl (LPS solution, pH 7.4, Daejeon, Korea), 50 mM MgSO4 (Sigma-Aldrich, Seoul, Korea), and 4 mM EDTA (Sigma-Aldrich, (HO2CCH2)2NCH2CH2N(CH2CO2H)2, Seoul Korea) [39,40,41]. E. coli culture samples were extracted from the bioreactor during fermentation were extracted every three hours and centrifuged at 4 °C, 16,500× g, for 5 min. The supernatants were discarded, and the collected pellets were stored at 4 °C until use. Pre-treatment solution (100 μL) was poured into the E. coli pellets, mixed thoroughly, and incubated in a water bath for 30 min at 70 °C. After incubation, the mixtures were centrifuged at room temperature, 10,000× g, for 5 min. The supernatants (50 μL) were separated and mixed with an equal volume of cell viability luminescent assay reagent in a 96-well plate and mixed gently on an orbital shaker for 5 min at room temperature. After shaking, luminescence was analyzed using a microplate reader (BioTek, Synergy Mx Microplate Reader SMA, Winooski, VT, USA). The intracellular ATP level per E. coli was standardized by dividing the obtained ATP level by the OD600 of the corresponding E. coli sample.

2.6. M13 Phage Titer Calculation via Titration

Titer of M13 phage was measured using plaque forming assay [42]. X-Gal/IPTG solution was prepared by mixing isopropyl β-D-thiogalactoside (0.625 g, Sigma-Aldrich, C9H18O5S, IPTG, Seoul, Korea), bromo-4-chloro-3-indolyl-β-D-galactopyranoside (0.5 g, Roche, C14H15BrClNO6, X-Gal, Seoul, Korea), and N, N-Dimethylformamide (12.5 mL, Sigma-Aldrich, HCON(CH3)2, DMF, Seoul, Korea). X-Gal/IPTG plates were made by mixing X-Gal/IPTG solution with LB and agar (Sigma-Aldrich, (C12H18O9)n, microbiologically tested, Seoul, Korea). Top agar was made by mixing LB (25 g), agar (7 g), and magnesium chloride hexahydrate (1 g, Fisher BioReagents, MgCl2∙6H2O, ≥99.0%, Seoul, Korea). Bacterial culture samples were extracted after 16 h of incubation and centrifuged at 4 °C, 16,000× g, for 5 min. The supernatants (phage stock) were transferred to clean 1.5 mL microtubes and diluted into different concentrations via serial dilution. Diluted solution (10 μL) with a specific dilution factor was mixed with E. coli solution (200 μL) in a monodisperse manner. The mixture was added to top agar and applied evenly on an X-Gal/IPTG plate. The plate was left to cool until the agar solidified and was incubated O/N at 37 °C. The measured number of plaques were converted to PFU (plaque forming units)/mL using the following equation [43]:
PFU / mL = Dilution   Factor × N p l a q u e × V s a m p l e
Nplaque represents the number of plaques and Vsample represents the volume of the sample.

3. Results and Discussion

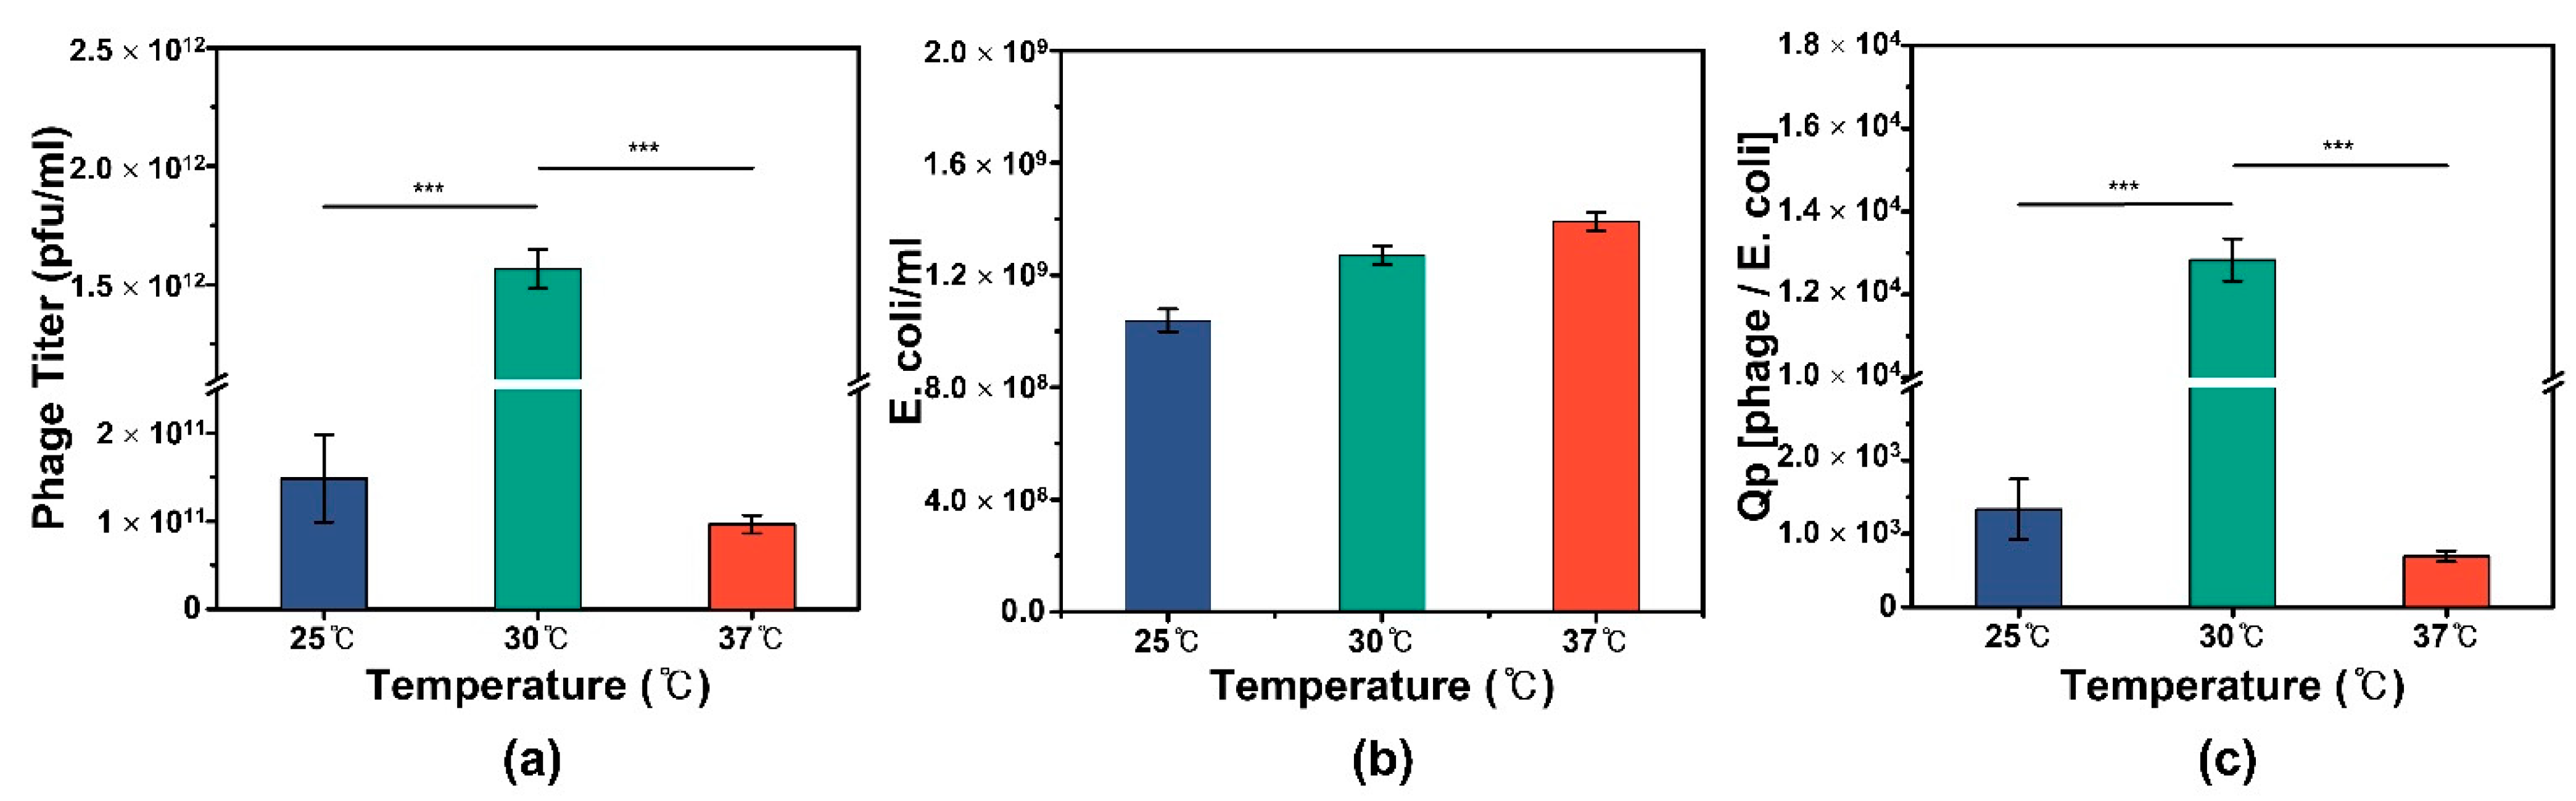
3.1. Comparison between Optimum and Control Temperatures for M13 Phage Production

Five liter-scale production of M13 phage was conducted at different culture temperatures (25 °C, 30 °C, and 37 °C) during batch culture fermentation to confirm that the optimum culture temperature (30 °C) produced the highest the phage yield in our system as shown in previous studies [20] (Figure 1). These temperature variations were selected due to the following reasons: 21–49 °C is the conventional temperature range that is capable of E. coli production, which all three selected temperatures fell within. Among previous studies, the temperature range of 28–31 °C was identified as the optimal range regarding the temperature parameter for M13 phage production [20]. Therefore, 30 °C was selected as the representative temperature of the optimal temperature range. We selected 25 °C, and 37 °C as the control temperatures, because 37 °C is generally known as the optimal temperature for E. coli growth [44,45,46] and 25 °C represents no temperature alteration (room temperature). Among these temperature variations, M13 phage production at 30 °C produced the highest phage titer as shown in previous studies (Figure 1a), with batches at 25 °C and 37 °C producing significantly lower phage titers. To ensure the reliability of the measurements produced from our system and validate the parameters for production, we applied an amplification ratio value to the titer results (Table 1). The values in Table 1 were selected based on studies which disclosed the initial phage titer at 0 h and final phage titer at 16 h of fermentation in their articles. The amplification ratio was calculated by dividing the final phage titer by the initial phage titer. Comparison of the amplification ratios showed that our system produced the highest value. Based on the parameters, this result was produced under general conditions (LB medium, 7.4 pH, XL1-Blue E. coli, etc.) with no additives, emphasizing the performance of our system that produces high phage yield while lowering the dependence of external substances. Furthermore, the results also indicated that the applied conditions were optimal for phage production including the optimal temperature shown in previous studies (between 28–31 °C) [11,13,20].
The phage titers for each temperature were also in accordance with the specific productivity (Qp) values, which indicated the phage production efficiency of the E. coli expressed as the level of phage production per individual E. coli cell (= the ratio of phage titer to E. coli cell number [13]). Phage titer (Figure 1a) and cell growth at 16 h fermentation (Figure 1b) for each temperature were identified and titer was divided by E. coli cell number to calculate Qp. The overall Qp values were higher than normal (Figure 1c) due to larger amounts of production (five-liter scale) [13]. In addition, Qp and phage titer values showed a similar trend over the entire temperature range, which implies the proportional relationship of Qp with phage titer (Figure 1a,c). Contrary to the cell growth measurements where E. coli cell number increased with the temperature (Figure 1b), phage titer and Qp did not show positive correlations with temperature. These results suggest that the effect of culture temperature on phage production is not straightforward like with E. coli growth, implying a more complex relationship with various interrelated factors between M13 phage production, E. coli growth, and culture temperature.

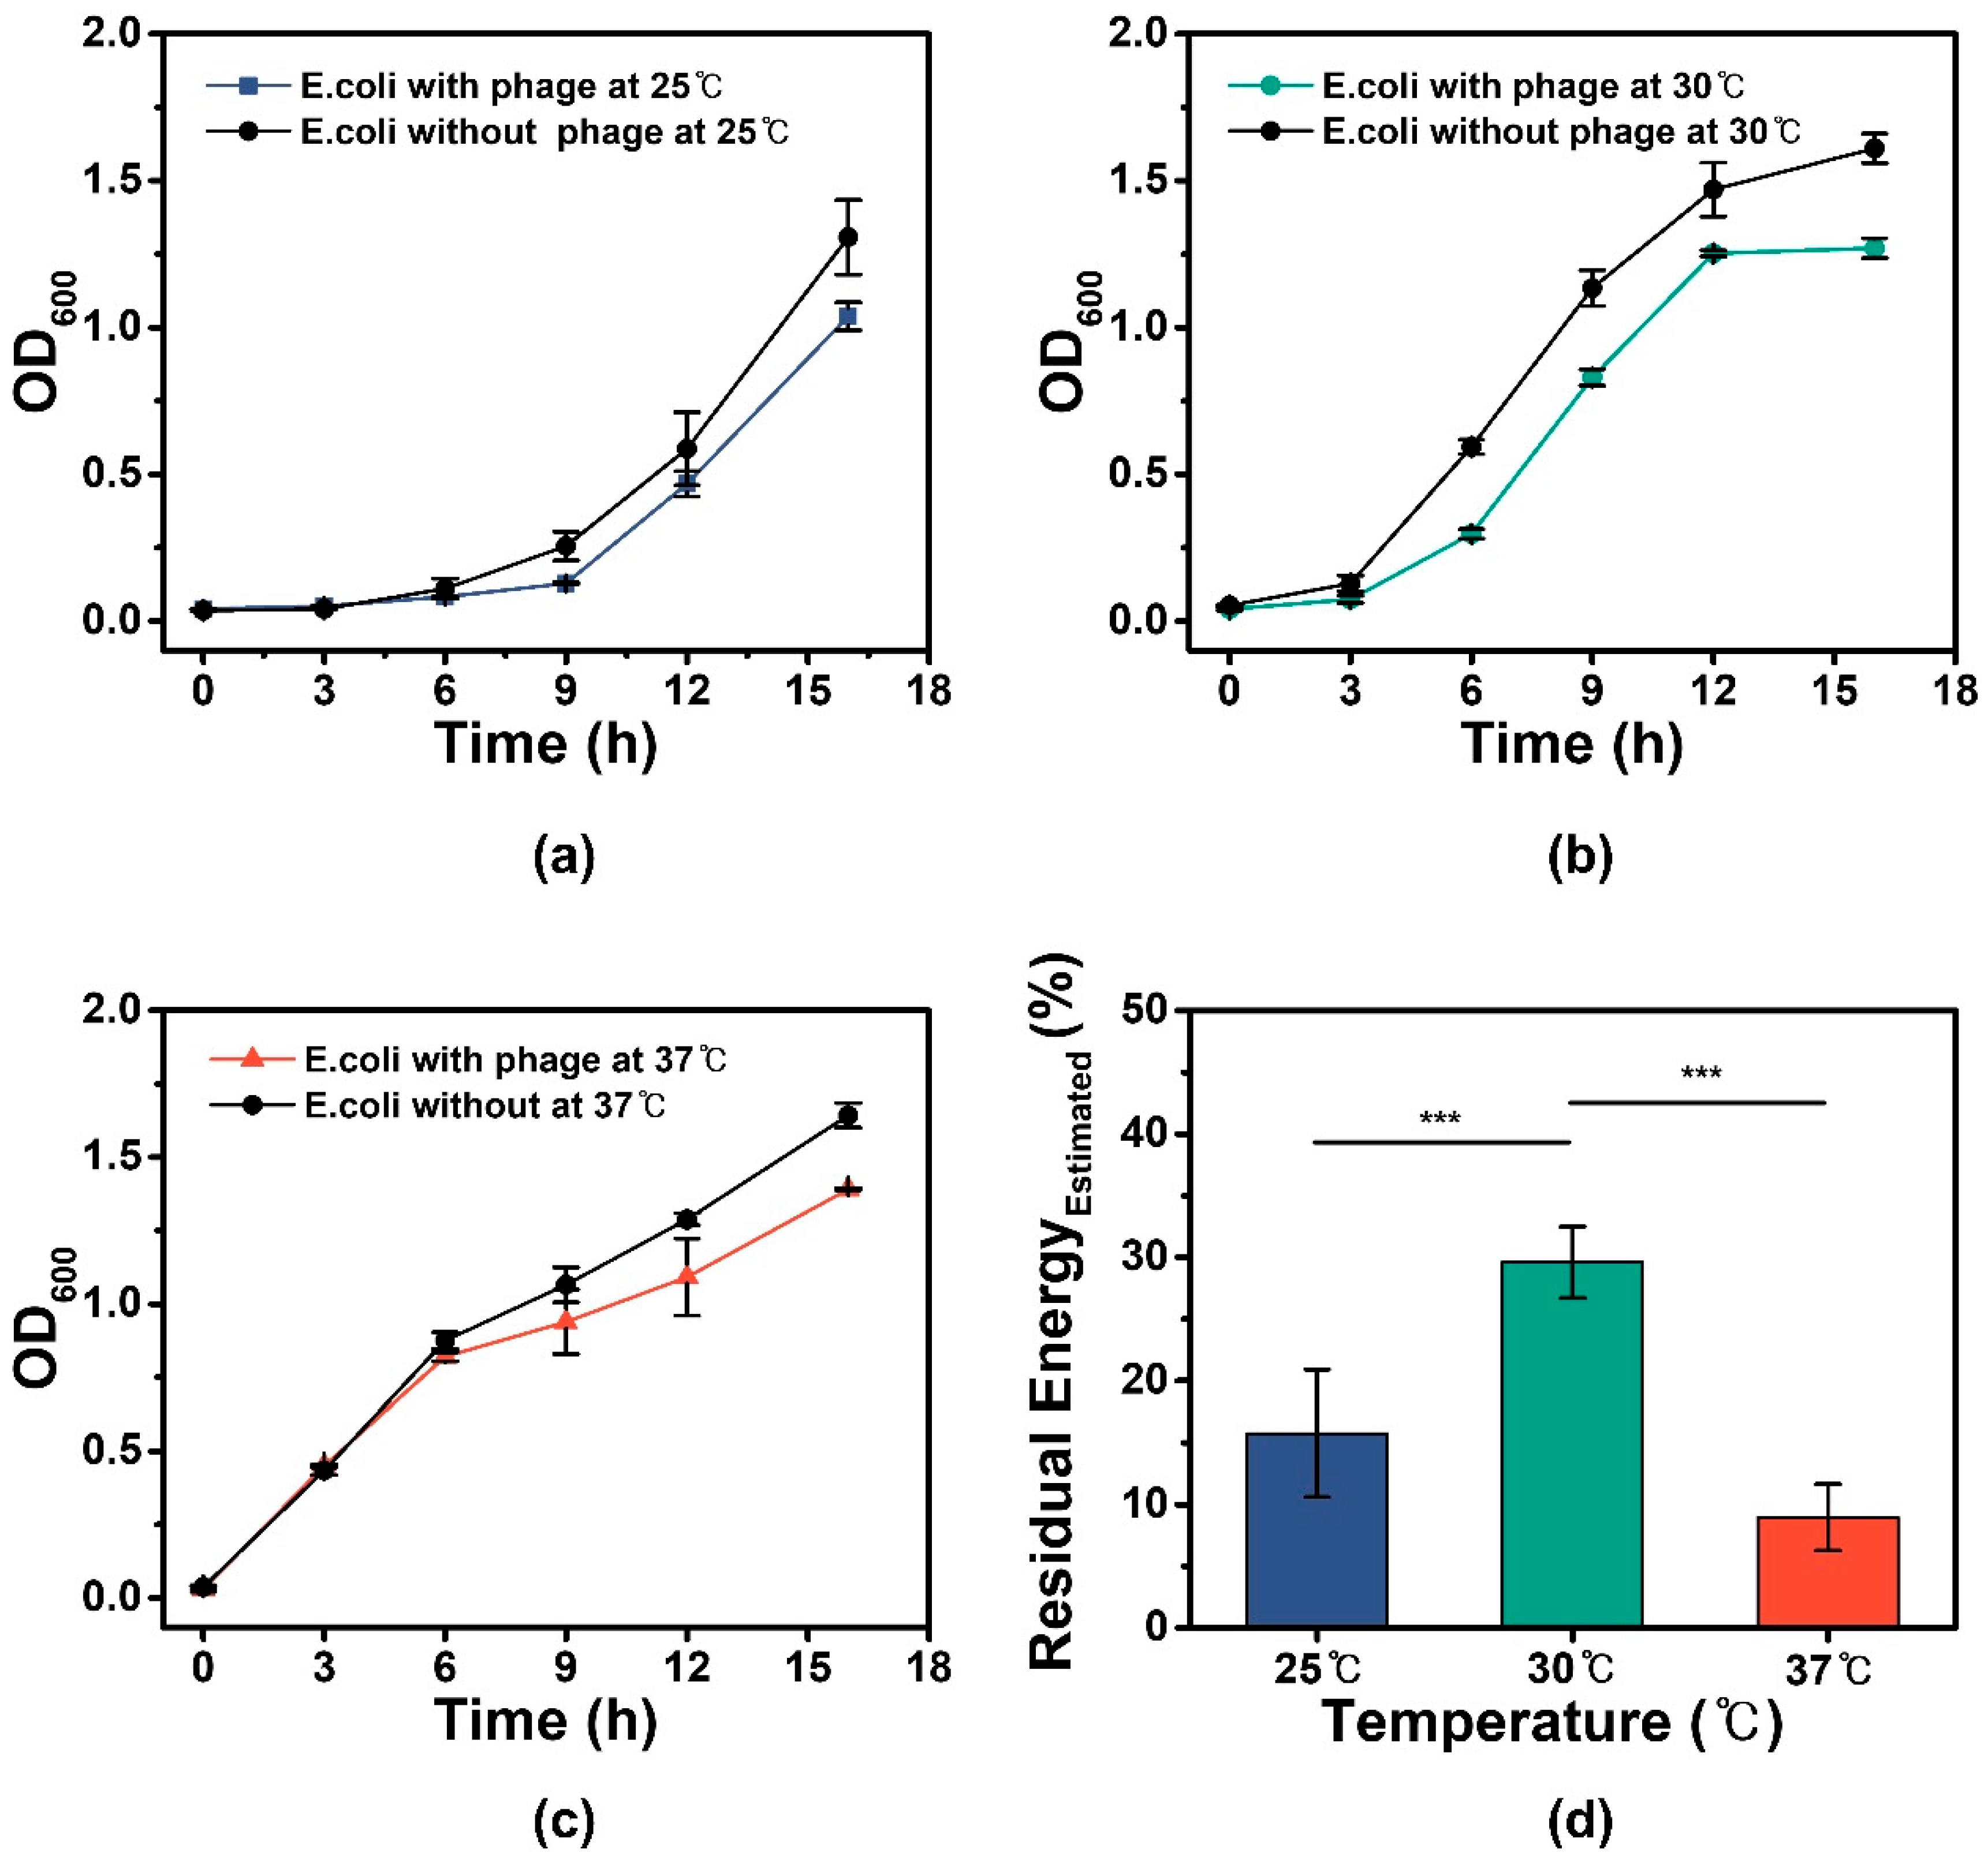
3.2. E. coli Specific Growth Rate Analysis and Estimation of Residual Energy for M13 Phage Production

To comprehend the high phage yield at 30 °C culture temperature (Figure 1), we observed how the growth rates of E. coli changed as culture temperatures varied. The coarse-grained kinetic model was used to identify how the growth rates of E. coli affected production of ribosomal proteins, phage proteins and E. coli proteins translated by ribosomes, including the E. coli ribosomes themselves [29]. According to this model, the energy efficiency used for ribosomal protein production is much higher during the log phase of E. coli fermentation, which uses a maximum 80% of total ATP for production of ribosomal proteins and ribosomal RNA (rRNA) (Equation (S1)) [30,31,32]. Since M13 phage proteins are synthesized by ribosomes in E. coli [6], a faster growth rate in the log phase is much more advantageous for liter-scale production of phage (Table S1, Equations (S1) and (S2)). Therefore, we predicted that the optimal temperature (30 °C) induced a faster growth rate of the log phase to maximize the expenditure of ATP for ribosomal protein synthesis, enabling a significant enhancement of phage production.
To evaluate this hypothesis, growth curves of E. coli batch cultures fermented with and without phage infection were constructed by conducting OD600 measurements of E. coli samples extracted at different fermentation intervals (Figure 2a–c). The log phase (exponential phase) is a period of fermentation that produces the highest growth rate, in which the number of E. coli cells increase exponentially over a certain amount of time [47]. The growth rates (specific growth rates) during the exponential phase at different culture temperatures were calculated using a specific method for comparison (Equation (3)). The growth rate corresponds to the change in the number of cells per minute, which can be calculated using the change in OD600 of the cells per minute. The equation is as follows [47]:
ln ( N x N y ) = α ( t x t y )
The x and y values were designated as the end and start of the exponential phase for each culture temperature batch, respectively. A represents the specific growth rate between x and y hours of fermentation, tx and ty represent x and y hours of fermentation, Nx represents the OD600 of E. coli cells at x hours of fermentation, and Ny represents the OD600 of E. coli cells at y hours of fermentation. For 25 °C and 30 °C culture temperature batches fermented with and without M13 phage, the measured OD600 at different fermentation periods all produced logarithmic curves, which enabled the calculation of specific growth rates using Equation (3) (Figure 2a,b). However, the 37 °C culture temperature OD600 produced broken lines, which restricted the calculation of specific growth rates to the average slope of the two lines in the broken line (Figure 2c). The relatively sharp increase in OD600 of the 37 °C sample at the early fermentation (0–6 h) can be attributed to the conventional optimized culture temperature and batch conditions of our culture system, enabling the E. coli to grow more rapidly at initial stages compared to batches with deviated temperatures deviating from 37 °C. As shown in Table S1, 30 °C produced the highest specific growth rate for batches produced with phage as predicted, which provided the most optimal condition for ribosomal protein synthesis as expressed in the mass fraction values of all ribosomal protein and the ribosomal efficiency values in the table. The OD600 graphs of each batch produced without phage at each temperature showed similar trends to the phage infected batches but with overall higher levels at each exponential phase, indicating higher specific growth rates of E. coli without phage infection (0.225, 0.286, and 0.1 for 25 °C, 30 °C, and 37 °C).
The differences in specific growth rates between batches fermented with and without phage implied that the energy from ATP that was used for E. coli cell growth in batches fermented without phage was partially used for other applications in batches fermented with phage, which was assumed to restrict E. coli growth while promoting phage production [24,25]. Therefore, it was perceived that phage production increased with the amount of ATP energy that was not used for cell growth. This energy was termed residual energy and was defined as the amount of ATP energy for cell growth consumed for purposes other than cell growth, which in terms of the coarse-grained model, was mostly for phage protein synthesis. The average percentage of the estimated residual energy for each culture temperature was calculated with Equation (S3) using the OD600 differences between E. coli fermented with and without phage over the entire 16 h fermentation process. As shown in Figure 2d, the average percentage of ATP used to produce phage proteins for each culture temperature was 15.89%, 29.60%, and 8.96% for 25 °C, 30 °C, and 37 °C, respectively. These results were proportional to the specific growth rates of batches fermented with phage for each culture temperature (Figure 2a–c). Of all the culture temperatures, 30 °C produced the largest portion of residual energy for phage protein synthesis, which indicated the optimum temperature for phage production. Because the 30 °C culture temperature induced the highest specific growth rate with batches infected with phage and the highest average percentage of estimated residual energy (Figure 2a–d), along with the observation that average estimated residual energy percentages of the three temperatures were proportional to the specific growth rate values of batches produced with phage at each temperature, it was reasonable to hypothesize that the specific growth rate of E. coli infected with phage at 30 °C culture temperature created the most optimal condition for ribosomal protein synthesis and enabled larger amounts of residual energy to be used for phage protein synthesis, producing the highest phage yield at 30 °C shown in Figure 1.

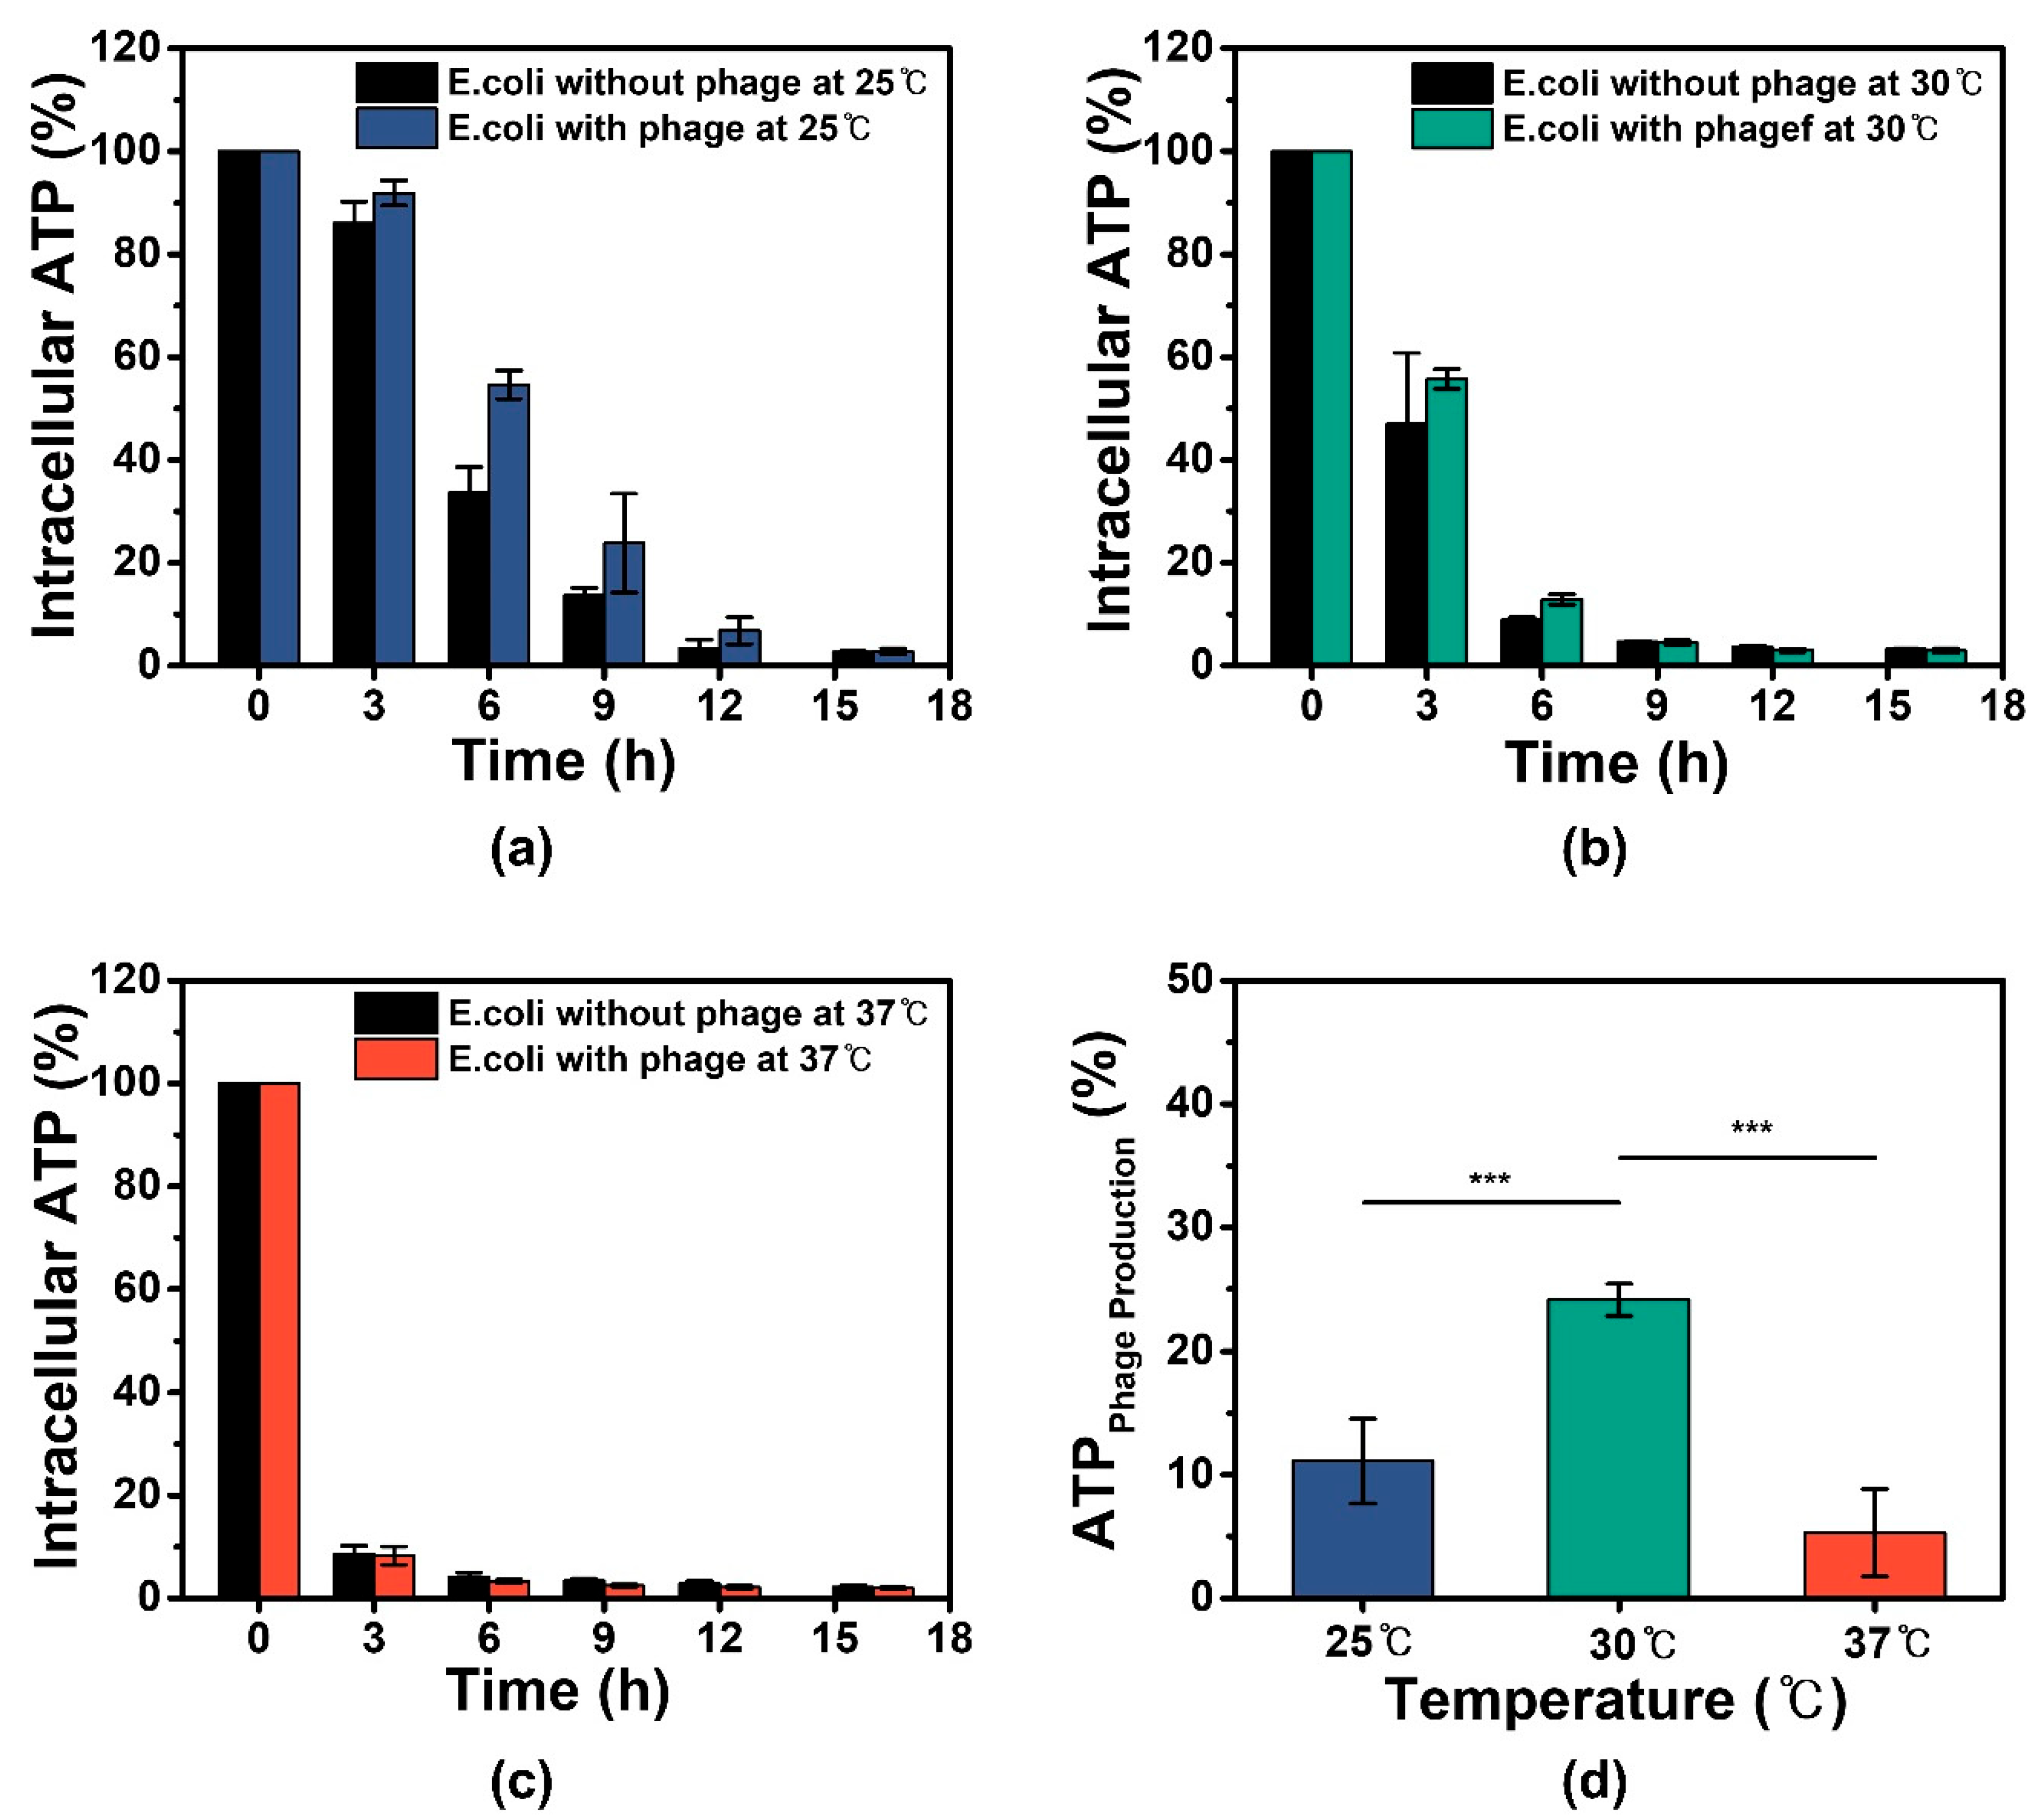
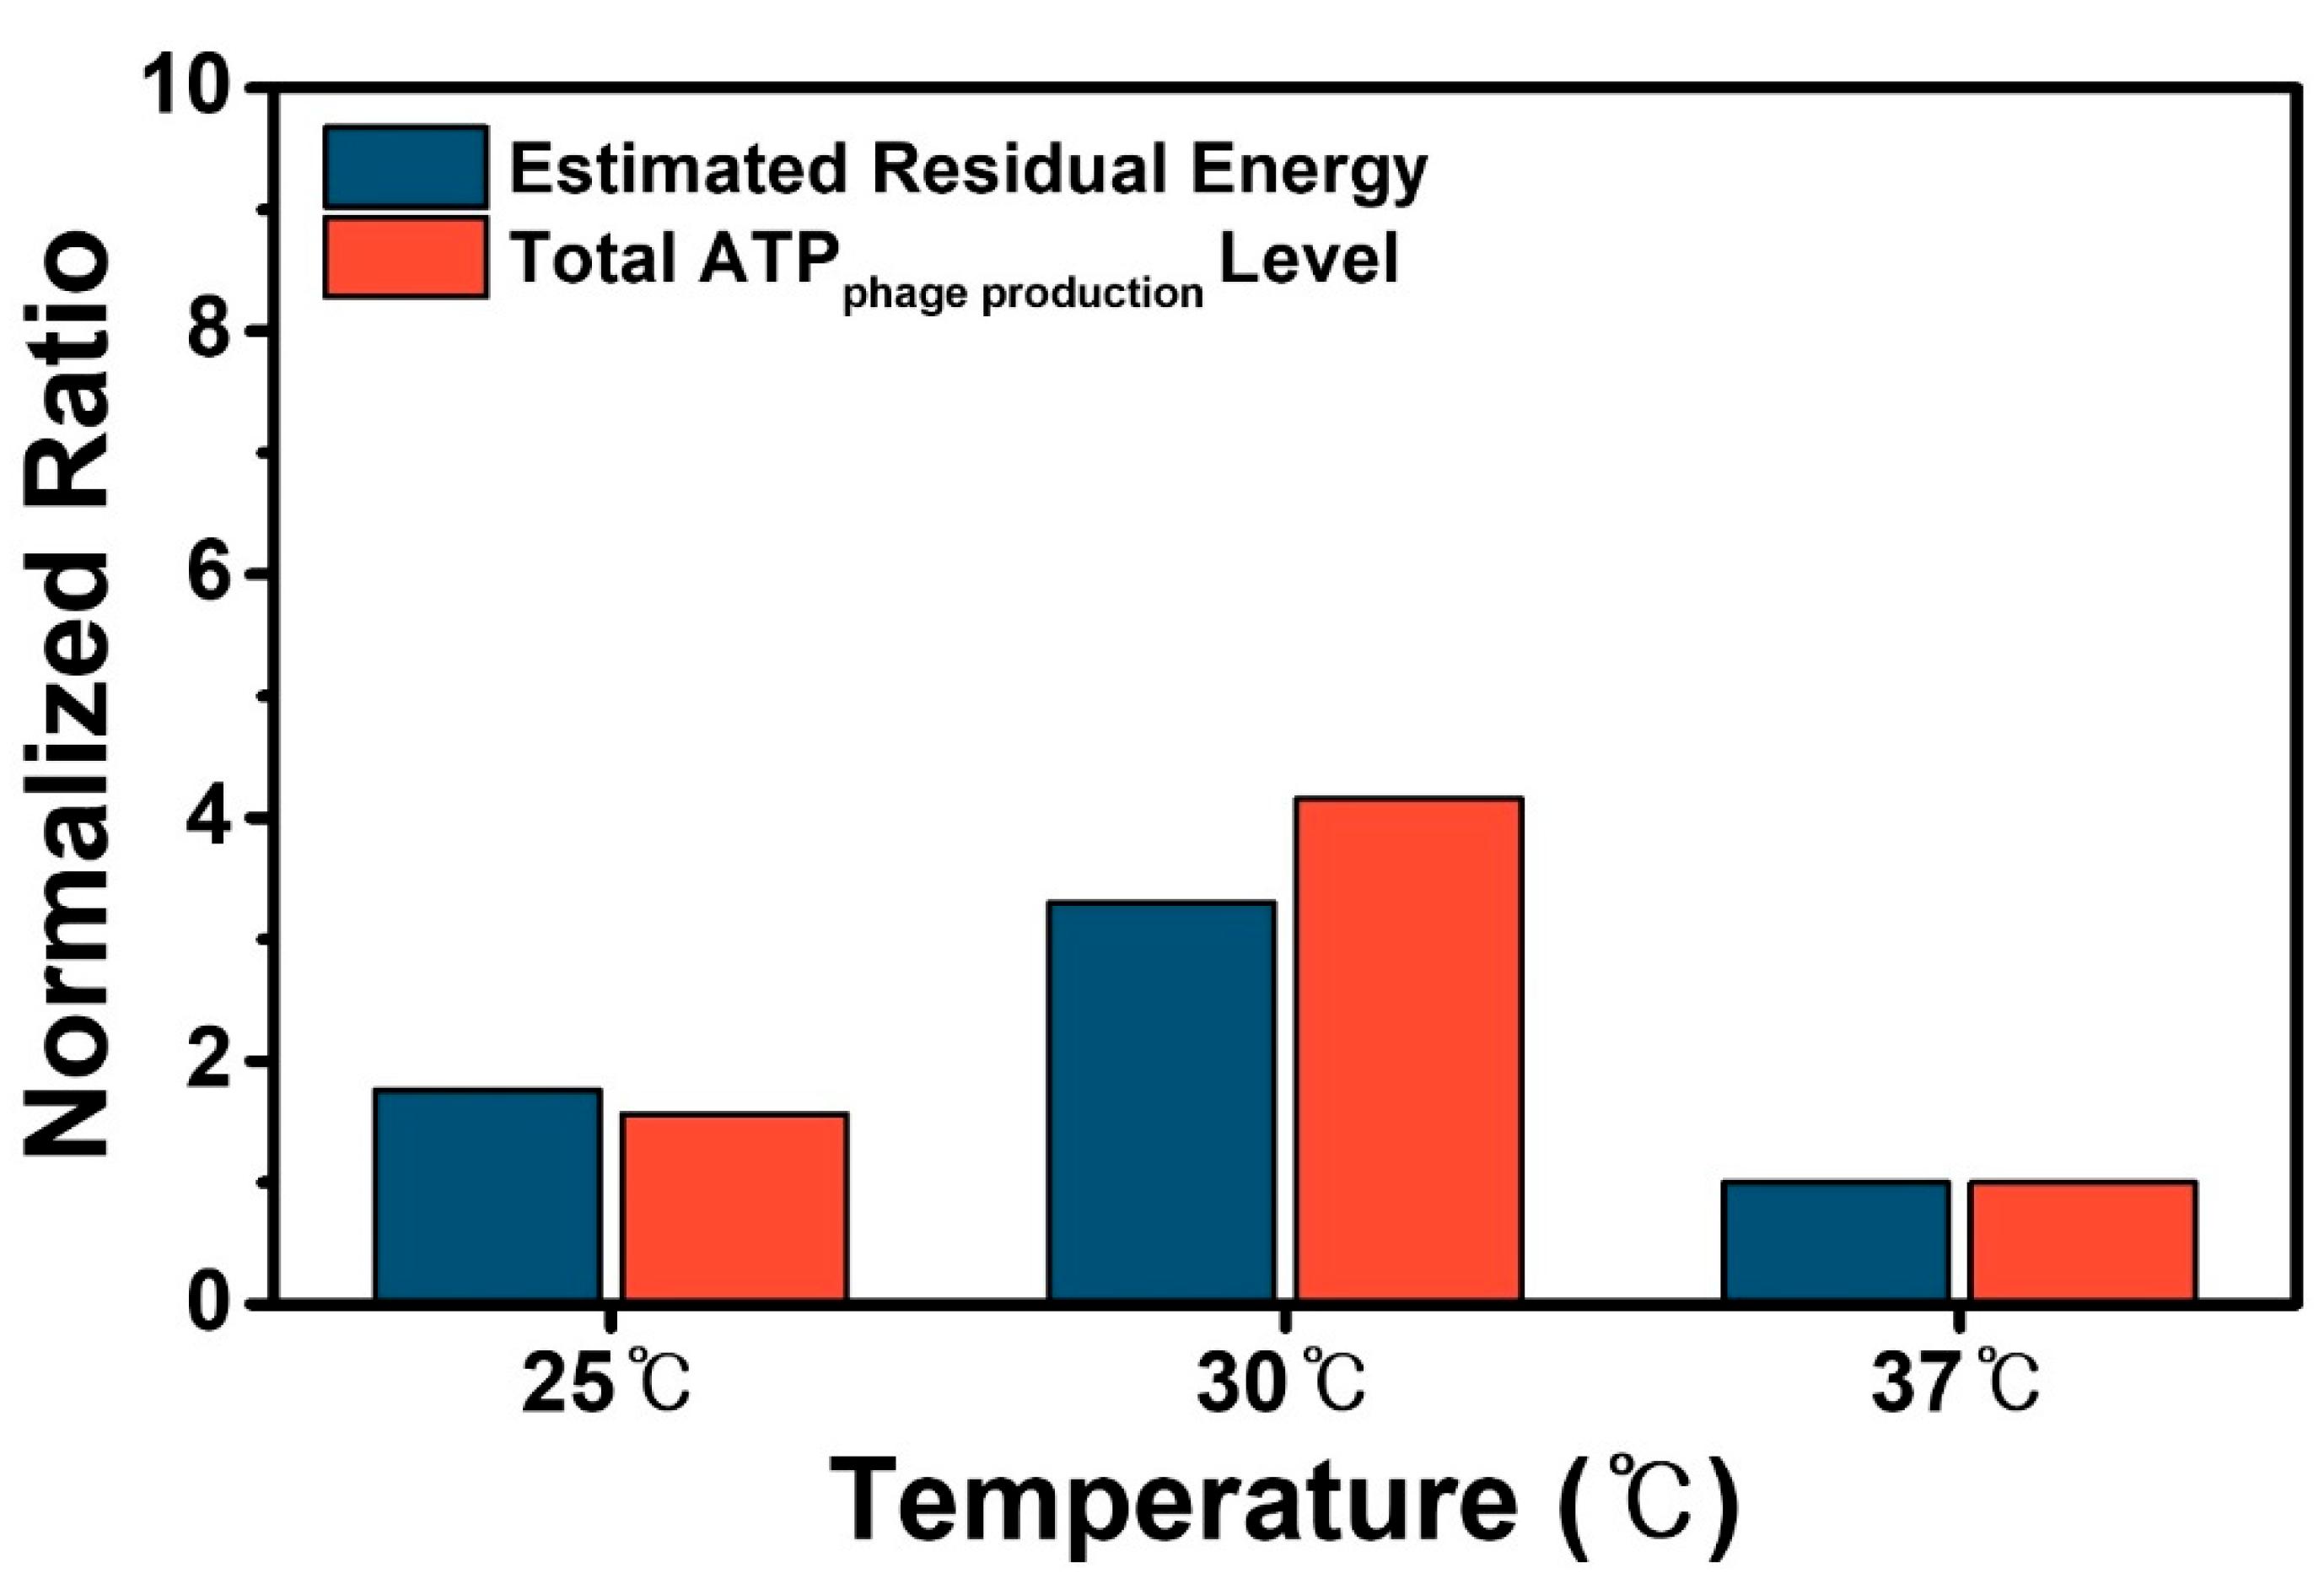
3.3. ATP Expenditure Analysis and Comparison with Residual Energy for M13 Phage Production

From the residual energy calculations, we hypothesized that the optimal culture temperature of 30 °C produced the highest phage yield because it enabled a larger portion of ATP energy to be used as residual energy for phage protein synthesis. To confirm this hypothesis, we experimentally investigated the detailed expenditure of the ATP produced in E. coli and the percentage of the ATP expenditure for phage production. Considering the inter-relationship between the translation system of E. coli, M13 phage replication, culture temperature, and other elements of phage production, we established ATP as the main intersecting factor that most significantly affects phage production. As mentioned before, a portion of ATP in phage-infected E. coli is used for phage DNA replication, phage protein translation, and phage assembly/extrusion, with phage protein synthesis requiring the largest amount of ATP [23,24,25,26,27]. Particularly, the expenditure of ATP for p8 major coat protein monomer synthesis is ~8 × 10⁵ ATP molecules per monomer while ~1.6 × 10⁴ ATP molecules are required per phage assembly [24]. Therefore, the ATP expenditure for phage production was represented as the ATP expenditure for phage protein synthesis when applying the coarse-grained model. Using this model, we investigated the correlation of estimated residual energy with ATP expenditure of phage protein synthesis to confirm that the large residual energy produced with 30 °C culture temperature was indeed used for phage production.
Initially, the ATP expenditure of the E. coli for ribosomal protein synthesis was analyzed to verify the previous model-derived residual energy estimations. To experimentally identify the portion of ATP used for ribosomal protein synthesis, and particularly, the proportion of ATP expenditure for M13 phage production, the intracellular ATP percentages of E. coli fermented with and without phage infection during the exponential phase at each culture temperature were measured via ATP luciferase assay (Figure 3a–c). In the case of E. coli fermented without phage, the majority of intracellular ATP is naturally used for cell doubling (single cell scale: cell doubling, bulk batch scale: cell growth) and not phage production. The ATP expenditure percentage of the intracellular ATP used for cell doubling at a specific time of fermentation was calculated using Equation (S4). The ratio of OD600 of E. coli without phage infection to OD600 of E. coli with phage infection was applied to the ATPDoubling (E. coli w/o phage), t values to induce the Intracellular ATP expenditure percentage for cell doubling per E. coli fermented with phage and was calculated using Equation (S5). As previously mentioned, the relatively lower specific growth rates of batches fermented with phage were attributed to the expenditure of intracellular ATP for uses other than cell growth (residual energy), particularly phage protein synthesis in terms of the coarse-grained model [24]. Therefore, the percentage of intracellular ATP used for phage production (which was represented as the ATP expenditure for phage protein synthesis) was calculated by subtracting the percentage of ATP for cell doubling from the total ATP expenditure percentage of E. coli fermented with phage (Equations (S6) and (S7)). The total intracellular ATP expenditure percentage for M13 phage production calculated using Equation (S7) for 25 °C, 30 °C, and 37 °C culture temperatures were identified as 11.68%, 24.14%, and 5.30%, respectively (Figure 3d). The data in Figure 3d were similar and proportional to the percentages of the model-based estimated residual energy derived from E. coli specific growth rate measurements (Figure 2d), with percentage differences of only ~5% (presumably due to the limitation of modeling [29]). The similarity between the data further confirmed our hypothesis that the superior specific growth rate at 30 °C culture temperature enabled higher ribosomal protein mass fraction and ribosomal efficiency for ribosomal protein synthesis (Table S1) and larger portions of energy to be used for phage protein production and not cell growth.
For further accurate comparison of the theoretically calculated residual energy and experimentally measured ATP expenditure in the same bulk batch scale, we normalized the 25 °C, and 30 °C data in Figure 2d and Figure 3d with the 37 °C data because ATP luciferase assay was conducted at a single cell scale while residual energy was analyzed using measurements from a bulk batch scale (Figure 4). For normalization, the 25 °C and 30 °C data in Figure 2d was divided by the 37 °C data, whereas the 25 °C, 30 °C, and 37 °C data in Figure 3d were multiplied by the corresponding cell number of E. coli in Figure 1b and subsequently divided by the multiplied 37 °C value. The normalized data sets were matched and analyzed for similarity. The two normalized ratio datasets at 25 °C showed ~89% similarity, while the data at 30 °C produced ~79%. These minor discrepancies between the data sets are generated from the limitation that non-infected E. coli cells can exist in batches of E. coli fermented with phage. Nevertheless, the results proved that the estimated residual energy values sufficiently matched the experimental values and were able to represent the ATP expenditure for phage production. Therefore, it was confirmed that the ATP for phage production originated from the ATP of E. coli used for ribosomal protein synthesis, and that 30 °C culture temperature provided the conditions to maximize the proportion of ATP for the synthesis of ribosomal proteins. In comparison, T4 phage consumes only 1% of the host’s energy budget, while the calculated ATP expenditure of M13 phage was identified as ~30%. Energy for replication, translation, and packaging of M13 phage was shown as ~0.26%, ~0.7%, and ~0.006% of the host’s total energy, respectively [21].
Similar to the relationship of temperature-dependent ATP expenditure and M13 phage production, other major parameters for phage production such as pH and ionic condition of medium could also be interpreted in the same manner. M13 phage assembly/extrusion is considered as a significant process for phage yield and is affected by many parameters such as pH and ionic environment, despite the relatively lower ATP expenditure proportion compared to phage protein synthesis [20,48,49]. The gp1/gp11 complex expressed by M13 phage is used for phage assembly/extrusion as an ATPase for ATP hydrolysis. The Walker A and Walker B motif in the gp1 protein is known to bind and hydrolyze ATP to assemble and extrude phage [24]. We compared the optimal parameters for ATPase activity of structures containing Walker A and Walker B motifs like the gp1/gp11 complex (Table 2). The overall optimum pH value for ATPase activity was identified to be 7.5 pH, which is close to the pH value in our study. In the case of the ionic environment, especially the divalent magnesium cation (Mg2+) in particular was found to affect the activity of ATPase, which was consistent with a study which produced large amplification ratio results by applying Hanawalt medium [19]. The Hanawalt medium, which contains MgCl2∙H2O, is suggested to enhance phage production as shown in Table 1 No.2, indicating the role of Mg2+ as an agonist for ATPase activity [50]. Based on these parameters, we interpreted the optimal parameter values by estimating the ATP expenditure for phage production. In addition, the regular of ribonuclease activity A (rraA) gene, which is activated in M13 phage infected E. coli, stimulates phage production by inhibiting activity of RNase E [51,52,53]. The rraA gene in infected E. coli is activated ~1.5-fold compared to non-infected E. coli. Inhibition of RNase E leads to stabilization of the primary phage transcript RNA, which enhances mRNA transcription and protein translation of phage. Thus, the ATP expenditure proportion for phage production is expected to be higher than other E. coli at the same condition.

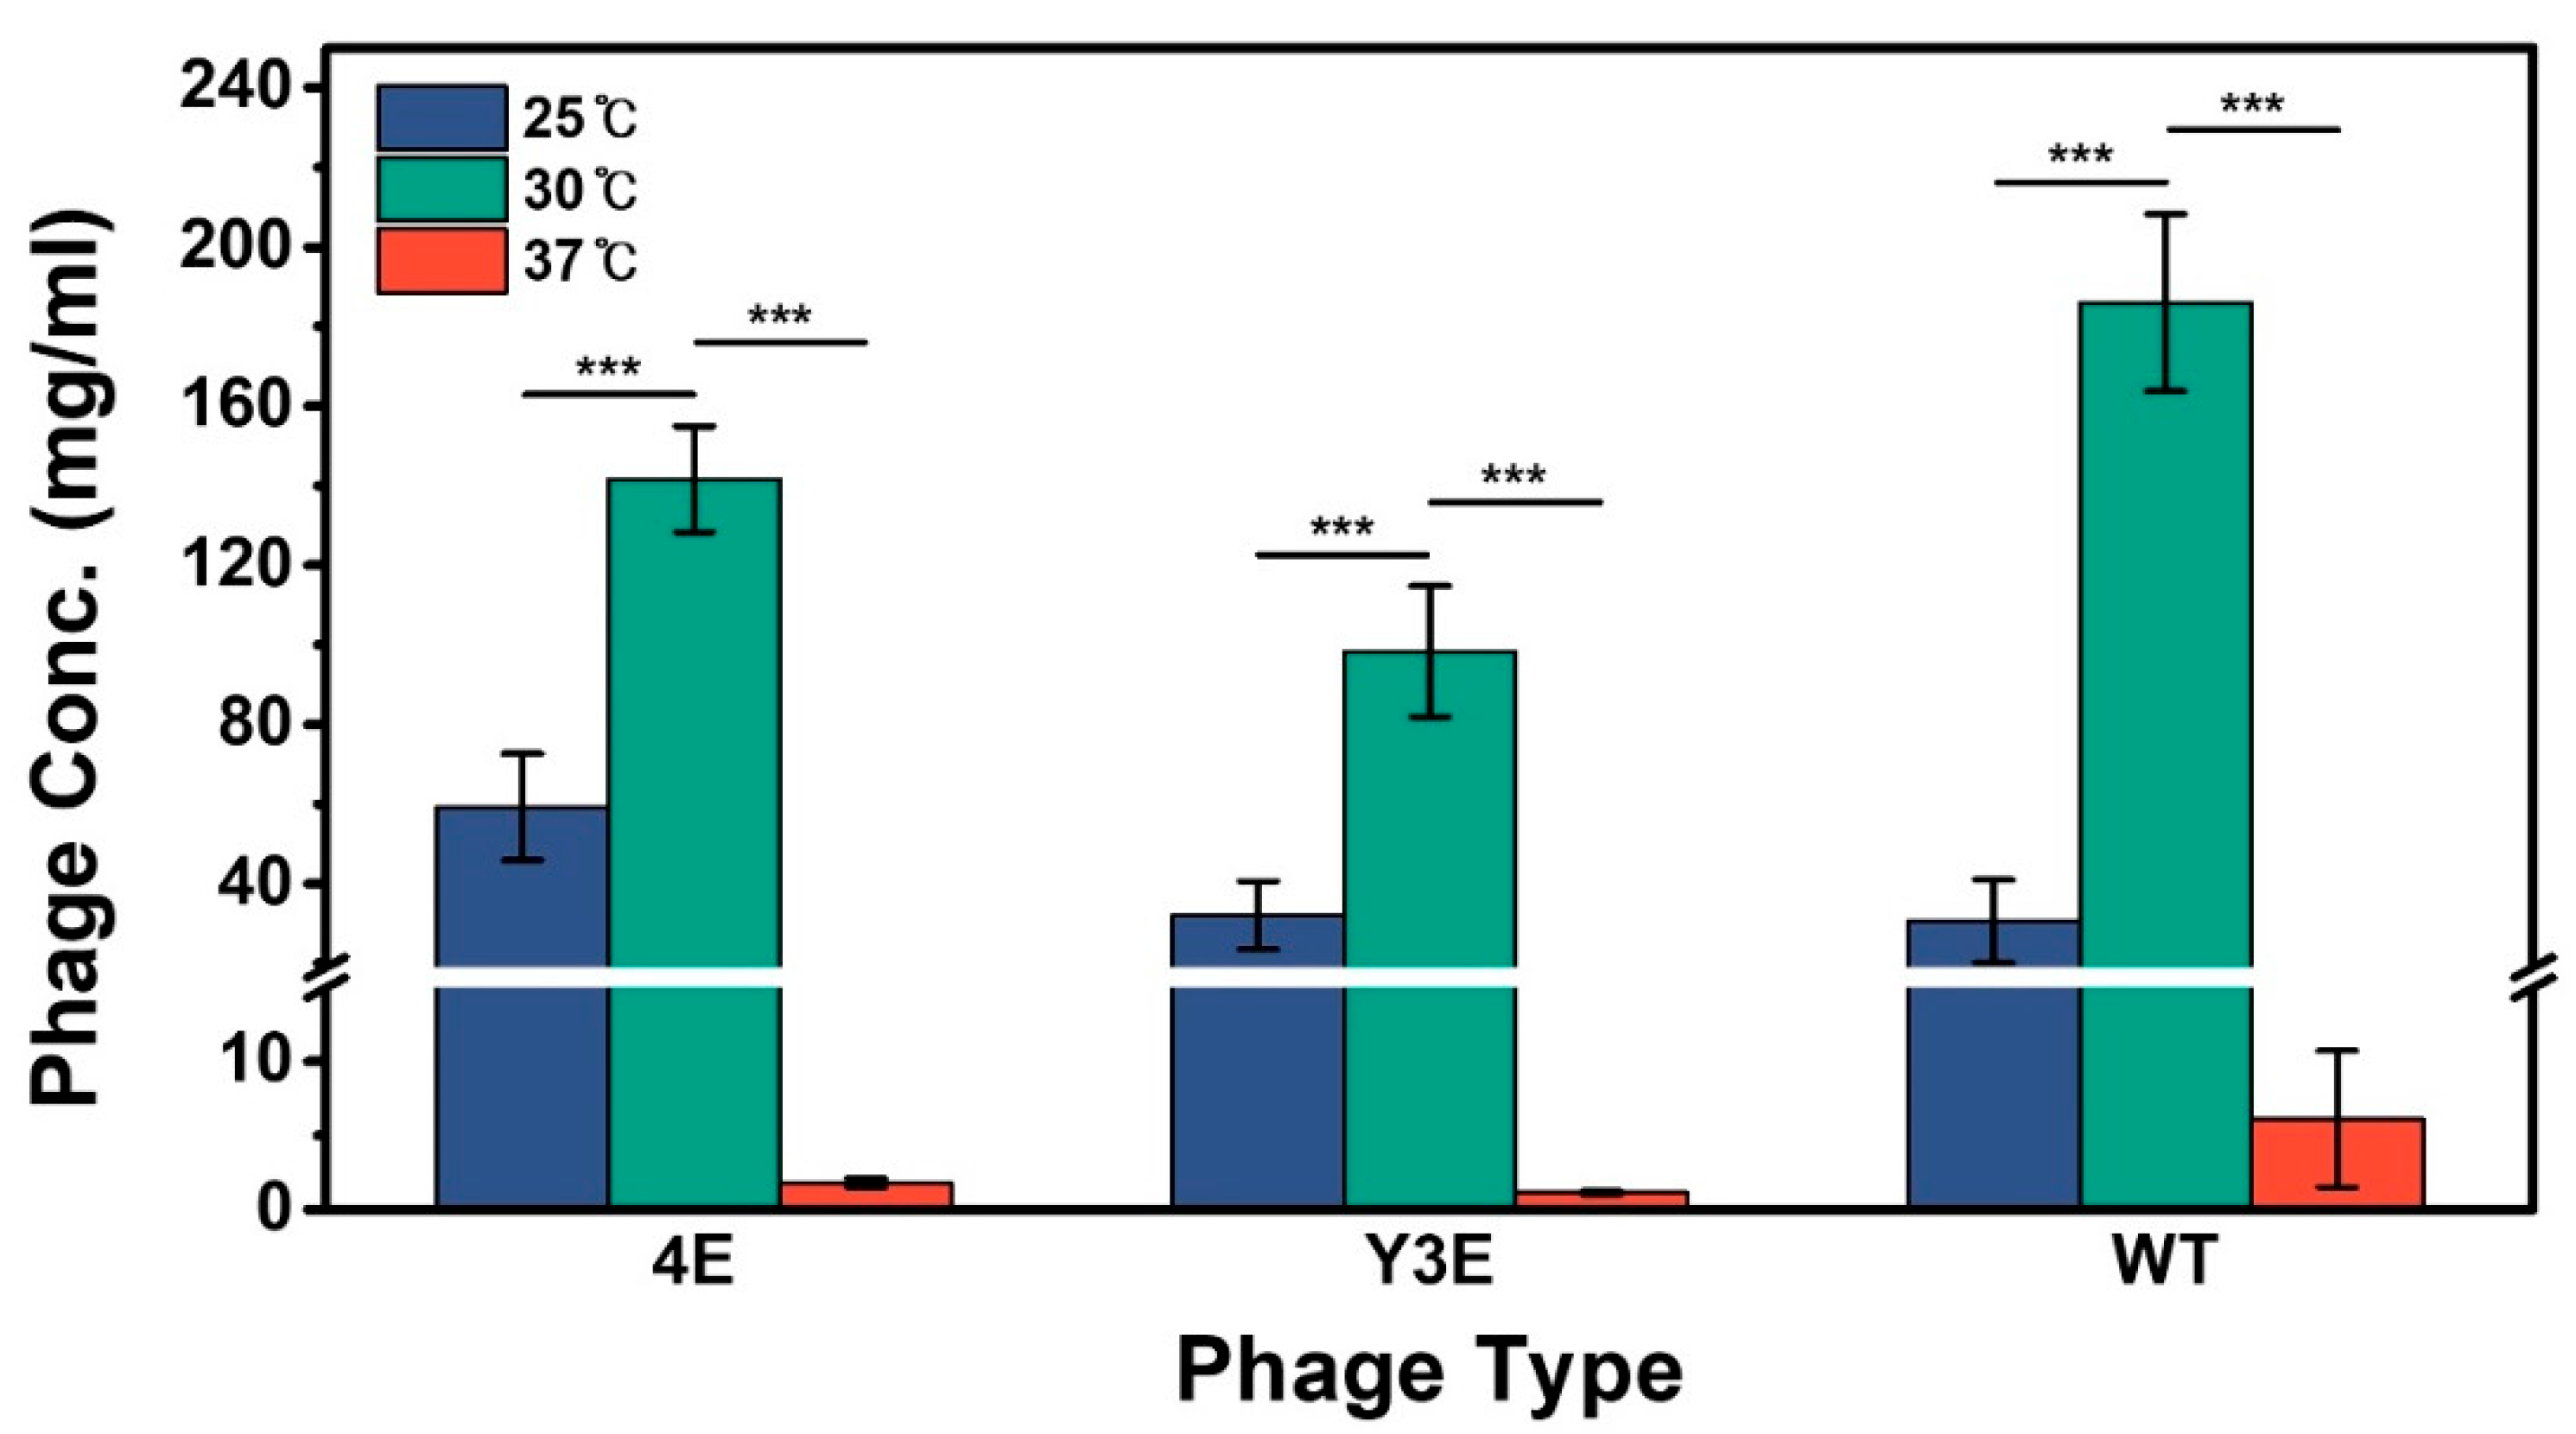
3.4. Verification of the Optimum Culture Temperature for Genetically Engineered M13 Phage Production

As previously mentioned, high concentration and purity are essential conditions needed for application of M13 phage. Other types of M13 phage, such as genetically engineered M13 phages, must also acquire these concentration and purity levels to be used for bionano and material science applications. The modified physical and chemical properties of major coat protein p8 on genetically engineered phage can react differently to temperature alterations [2], but the phage itself should maintain a concentration and purity level comparable to WT phages under the same temperature conditions. Therefore, to optimize phage concentration and purity of genetically engineered phages for application, we examined whether the optimal 30 °C culture temperature that produced the highest yield for WT phage could also produce high yields of genetically engineered phage. To verify the effect of temperature on the production yield for genetically engineered phages, WT phage and phages with 4E and Y3E peptides expressed at the ends of the major coat protein p8 were fermented with E. coli at different culture temperatures and subsequently analyzed for phage concentration (Figure 5). WT phage concentration at 25 °C, 30 °C, and 37 °C were identified as 30.54 mg/mL, 186 mg/mL, and 6.12 mg/mL, respectively. Y3E-expressed phage produced the highest phage concentration at 30 °C with 98.3 mg/mL, followed by 32.1 mg/mL at 25 °C and 1.14 mg/mL at 37 °C. For 4E-expressed phage, the highest concentration of 142 mg/mL was produced at 30 °C, with 59.2 mg/mL at 25 °C and 1.8 mg/mL at 37 °C. The overall phage concentration of 4E and Y3E genetically engineered phage were lower than WT phage at all culture temperatures excluding 25 °C, possibly because of the effect of temperature on p8 protein. Although a difference in the overall concentration existed between the phage types, it was confirmed that phage production was affected by culture temperature regardless of genetic modification and that 30 °C temperature produced the highest yield for both types of genetically modified phage. Regarding the purity of the phage, we identified that M13 phages of high concentration also express high levels of purity (Figure S2), which was observed via gel electrophoresis of each type of phage.

4. Conclusions

In this study, we investigated that enhancement of M13 phage production at the 30 °C optimal culture temperature in five liter-scale E. coli fermentation using the coarse-grained model to identify the ATP expenditure for phage production. Because M13 phage uses ATP and ribosomes of the E. coli host cells to produce phage proteins, we identified the relationship of the optimal culture temperature and high yield phage production by examining the ATP expenditure of E. coli in terms of the coarse-grained model. The optimal temperature provided a more advantageous condition for phage production by increasing the specific growth rate of the E. coli cells, which enhanced the mass fraction of ribosomal proteins and ribosomal efficiency in E. coli to maximize ribosomal protein synthesis. Further investigation regarding the residual energy showed that the highest percentage of energy for ribosomal protein synthesis that was not used for cell growth was produced at the optimal temperature, which suggested that most of the energy was used for phage protein synthesis. This hypothesis was examined by comparing the theoretically estimated energy values derived from specific growth rate analysis and the experimentally measured ATP expenditure percentages for M13 phage production derived from intracellular ATP expenditure analysis which showed that the highest values for both data sets were at 30 °C temperature (24–29%) with 3–5% discrepancy between the two values. These results identified that the experimentally calculated ATP expenditure percentages were proportional to the estimated residual energy values using the coarse-grained model, which confirmed that 30 °C culture temperature maximized the residual energy for ribosomal protein synthesis that was indeed used for production of phage mostly by expenditure of ATP for phage protein synthesis. The culture temperature addressed in this study is a relatively simple, easy-to-control parameter that can be altered to produce large amounts of phage at the laboratory level without additives and with fewer restrictions. Through the various measurements conducted in this study, we recognized a specific method that can be used to identify certain optimal conditions for M13 phage production. In addition to comparison with T4 phage, further studies regarding the ATP expenditure of M13 phage is needed due to the ambiguity of the energetic cost. We anticipate that this method can be used to investigate other optimal parameters of phage production that were not discussed in this study, such as pH (another major factor) or ionic environment of medium, and E. coli strain. Furthermore, by identifying these optimal conditions, we can produce M13 phage solutions with high concentration and high purity that enable construction of hierarchically self-assembled bioscaffolds that can be used for various bionano and material science field applications such as in bone and cartilage for regeneration of tissues.

Supplementary Materials

The following supporting information can be downloaded at: https://www.mdpi.com/article/10.3390/pr10050962/s1, Figure S1: Comparison at the N terminus of the major coat protein p8 genetic sequence among genetically engineered M13 phages, Table S1: Comparison factors of M13 phage production affected by temperature alteration. Equation (S1): Calculation of the mass fraction of all ribosomal cellular proteins, Equation (S2): Calculation of the ribosomal efficiency based on specific growth rates, Equation (S3): Calculation of the average estimated residual energy for M13 phage production, Equation (S4): Calculation of ATP expenditure for E. coli cell doubling without phage infection, Equation (S5): Calculation of ATP expenditure for E. coli cell doubling with phage infection, Equation (S6): Calculation of total ATP expenditure E. coli with phage, Equation (S7): Calculation of experimental ATP expenditure for phage production, Figure S2: Gel electrophoresis results of M13 phage purity.

Author Contributions

Conceptualization, S.M.L.; Methodology, S.M.H. and S.M.L.; Validation, Y.K.C., S.M.H. and S.K.L.; Formal Analysis, S.M.L.; Investigation, Y.K.C. and S.M.H.; Resources, S.M.H. and S.M.L.; Writing—Original Draft Preparation, J.H.L., Y.K.C. and S.M.L.; Writing—Review and Editing, S.M.H., J.O.S., S.K.L. and J.H.L.; Visualization, Y.K.C.; Supervision, J.H.L.; Project Administration, J.H.L.; Funding Acquisition, J.H.L., Y.K.C., S.M.H. and S.M.L. made equal contributions to this study. All authors have read and agreed to the published version of the manuscript.

Funding

This research was funded by Ministry of Science and ICT, South Korea, grant numbers 2020R1C1C1012122 and 2020R1A4A1016840.

Acknowledgments

The authors would like to thank the laboratory team that optimized the conditions and all the students who volunteered to participate in the experiment. Graphical abstract was created with BioRender.com (accessed on 1 April 2022) GelAnalyzer 19.1 (www.gelanalyzer.com (accessed on 1 April 2022)) by Istvan Lazar Jr. and Istvan Lazar Sr., CSc was used for Figure S1.

Conflicts of Interest

The authors declare no conflict of interest.

References

  1. Smeal, S.W.; Schmitt, M.A.; Pereira, R.R.; Prasad, A.; Fisk, J.D. Simulation of the M13 life cycle I: Assembly of a genetically-structured deterministic chemical kinetic simulation. Virology 2017, 500, 259–274. [Google Scholar] [CrossRef] [PubMed]
  2. Lee, J.H.; Warner, C.M.; Jin, H.-E.; Barnes, E.; Poda, A.R.; Perkins, E.J.; Lee, S.-W. Production of tunable nanomaterials using hierarchically assembled bacteriophages. Nat. Protoc. 2017, 12, 1999–2013. [Google Scholar] [CrossRef] [PubMed]
  3. Chung, W.J.; Oh, J.W.; Kwak, K.; Lee, B.Y.; Meyer, J.; Wang, E.; Hexemer, A.; Lee, S.W. Biomimetic self-templating supramolecular structures. Nature 2011, 478, 364–368. [Google Scholar] [CrossRef] [PubMed]
  4. Onsager, L. The effects of shape on the interaction of colloidal particles. Ann. N. Y. Acad. Sci. 1949, 51, 627–659. [Google Scholar] [CrossRef]
  5. Lee, B.Y.; Zhang, J.; Zueger, C.; Chung, W.J.; Yoo, S.Y.; Wang, E.; Meyer, J.; Ramesh, R.; Lee, S.W. Virus-based piezoelectric energy generation. Nat. Nanotechnol. 2012, 7, 351–356. [Google Scholar] [CrossRef] [PubMed]
  6. Bhattacharjee, S.; Glucksman, M.J.; Makowski, L. Structural polymorphism correlated to surface charge in filamentous bacteriophages. Biophys. J. 1992, 61, 725–735. [Google Scholar] [CrossRef] [Green Version]
  7. Lee, J.H.; Fan, B.; Samdin, T.D.; Monteiro, D.A.; Desai, M.S.; Scheideler, O.; Jin, H.E.; Kim, S.; Lee, S.W. Phage-Based Structural Color Sensors and Their Pattern Recognition Sensing System. ACS Nano 2017, 11, 3632–3641. [Google Scholar] [CrossRef]
  8. Gibaud, T.; Barry, E.; Zakhary, M.J.; Henglin, M.; Ward, A.; Yang, Y.; Berciu, C.; Oldenbourg, R.; Hagan, M.F.; Nicastro, D.; et al. Reconfigurable self-assembly through chiral control of interfacial tension. Nature 2012, 481, 348–351. [Google Scholar] [CrossRef]
  9. Ferrara, F.; Kim, C.-Y.; Naranjo, L.A.; Bradbury, A.R.M. Large scale production of phage antibody libraries using a bioreactor. mAbs 2015, 7, 26–31. [Google Scholar] [CrossRef] [Green Version]
  10. Grieco, S.H.; Lee, S.; Dunbar, W.S.; MacGillivray, R.T.; Curtis, S.B. Maximizing filamentous phage yield during computer-controlled fermentation. Bioprocess Biosyst. Eng. 2009, 32, 773–779. [Google Scholar] [CrossRef]
  11. Grieco, S.H.; Wong, A.Y.; Dunbar, W.S.; MacGillivray, R.T.; Curtis, S.B. Optimization of fermentation parameters in phage production using response surface methodology. J. Ind. Microbiol. Biotechnol. 2012, 39, 1515–1522. [Google Scholar] [CrossRef] [PubMed]
  12. Kick, B.; Hensler, S.; Praetorius, F.; Dietz, H.; Weuster-Botz, D. Specific growth rate and multiplicity of infection affect high-cell-density fermentation with bacteriophage M13 for ssDNA production. Biotechnol. Bioeng. 2017, 114, 777–784. [Google Scholar] [CrossRef] [PubMed]
  13. Warner, C.M.; Barker, N.; Lee, S.-W.; Perkins, E.J. M13 bacteriophage production for large-scale applications. Bioprocess Biosyst. Eng. 2014, 37, 2067–2072. [Google Scholar] [CrossRef] [PubMed]
  14. Bijlenga, R.K.L.; Aebi, U.; Kellenberger, E. Properties and structure of a gene 24-controlled T4 giant phage. J. Mol. Biol. 1976, 103, 469–498. [Google Scholar] [CrossRef]
  15. Groman, N.B.; Suzuki, G. Temperature and lambda phage reproduction. J. Bacteriol. 1962, 84, 431–437. [Google Scholar] [CrossRef] [Green Version]
  16. Krueger, A.P.; Fong, J. The relationship between bacterial growth and phage production. J. Gen. Physiol. 1937, 21, 137–150. [Google Scholar] [CrossRef] [Green Version]
  17. Lopez, J.; Webster, R.E. fipB and fipC: Two bacterial loci required for morphogenesis of the filamentous bacteriophage f1. J. Bacteriol. 1985, 163, 900–905. [Google Scholar] [CrossRef] [Green Version]
  18. Mitra, S.; Stallions, D.R. Role of dna genes of Escherichia coli in M13 phage replication. Virology 1973, 52, 417–424. [Google Scholar] [CrossRef]
  19. Olsen, W.L.; Staudenbauer, W.L.; Hofschneider, P.H. Replication of bacteriophage M13: Specificity of the Escherichia coli dnaB function for replication of double-stranded M13 DNA. Proc. Natl. Acad. Sci. USA 1972, 69, 2570–2573. [Google Scholar] [CrossRef] [Green Version]
  20. Speck, J.; Arndt, K.M.; Müller, K.M. Efficient phage display of intracellularly folded proteins mediated by the TAT pathway. Protein Eng. Des. Sel. 2011, 24, 473–484. [Google Scholar] [CrossRef] [Green Version]
  21. Mahmoudabadi, G.; Milo, R.; Phillips, R. Energetic cost of building a virus. Proc. Natl. Acad. Sci. USA 2017, 114, E4324–E4333. [Google Scholar] [CrossRef] [PubMed] [Green Version]
  22. Serwer, P.; Wright, E.T. ATP-Driven Contraction of Phage T3 Capsids with DNA Incompletely Packaged In Vivo. Viruses 2017, 9, 119. [Google Scholar] [CrossRef] [Green Version]
  23. Hay, I.D.; Lithgow, T. Filamentous phages: Masters of a microbial sharing economy. EMBO Rep. 2019, 20, e47427. [Google Scholar] [CrossRef] [PubMed]
  24. Loh, B.; Kuhn, A.; Leptihn, S. The fascinating biology behind phage display: Filamentous phage assembly. Mol. Microbiol. 2019, 111, 1132–1138. [Google Scholar] [CrossRef] [Green Version]
  25. Loh, B.; Haase, M.; Mueller, L.; Kuhn, A.; Leptihn, S. The Transmembrane Morphogenesis Protein gp1 of Filamentous Phages Contains Walker A and Walker B Motifs Essential for Phage Assembly. Viruses 2017, 9, 73. [Google Scholar] [CrossRef] [Green Version]
  26. Feng, D.-F.; Cho, G.; Doolittle, R.F. Determining divergence times with a protein clock: Update and reevaluation. Proc. Natl. Acad. Sci. USA 1997, 94, 13028–13033. [Google Scholar] [CrossRef] [Green Version]
  27. Feng, J.N.; Model, P.; Russel, M. A trans-envelope protein complex needed for filamentous phage assembly and export. Mol. Microbiol. 1999, 34, 745–755. [Google Scholar] [CrossRef]
  28. Smeal, S.W.; Schmitt, M.A.; Pereira, R.R.; Prasad, A.; Fisk, J.D. Simulation of the M13 life cycle II: Investigation of the control mechanisms of M13 infection and establishment of the carrier state. Virology 2017, 500, 275–284. [Google Scholar] [CrossRef]
  29. Maitra, A.; Dill, K.A. Bacterial growth laws reflect the evolutionary importance of energy efficiency. Proc. Natl. Acad. Sci. USA 2015, 112, 406–411. [Google Scholar] [CrossRef] [Green Version]
  30. Bremer, H.; Dennis, P.P. Modulation of Chemical Composition and Other Parameters of the Cell at Different Exponential Growth Rates. EcoSal Plus 2008, 3, 1–48. [Google Scholar] [CrossRef]
  31. Stouthamer, A.H.; Bettenhaussen, C. Utilization of energy for growth and maintenance in continuous and batch cultures of microorganisms. A reevaluation of the method for the determination of ATP production by measuring molar growth yields. Biochim. Biophys. Acta 1973, 301, 53–70. [Google Scholar] [CrossRef]
  32. Tempest, D.W.; Neijssel, O.M. The status of YATP and maintenance energy as biologically interpretable phenomena. Annu. Rev. Microbiol. 1984, 38, 459–486. [Google Scholar] [CrossRef] [PubMed]
  33. Scott, M.; Gunderson, C.W.; Mateescu, E.M.; Zhang, Z.; Hwa, T. Interdependence of cell growth and gene expression: Origins and consequences. Science 2010, 330, 1099–1102. [Google Scholar] [CrossRef] [PubMed]
  34. Kepes, A.; Beguin, S. Peptide chain initiation and growth in the induced synthesis of β-galactosidase. Biochim. Biophys. Acta Nucleic Acids Protein Synth. 1966, 123, 546–560. [Google Scholar] [CrossRef]
  35. Young, R.; Bremer, H. Polypeptide-chain-elongation rate in Escherichia coli B/r as a function of growth rate. Biochem. J. 1976, 160, 185–194. [Google Scholar] [CrossRef] [Green Version]
  36. Barbas, C.F.; Burton, D.R.; Silverman, G.J. Phage Display: A Laboratory Manual; Cold Spring Harbor Laboratory Press: Spring harbor, New York, USA, 2004; ISBN 978-087969740-2. [Google Scholar]
  37. Crookes-Goodson, W.J.; Slocik, J.M.; Naik, R.R. Bio-directed synthesis and assembly of nanomaterials. Chem. Soc. Rev. 2008, 37, 2403–2412. [Google Scholar] [CrossRef]
  38. Lee, S.K.; Lee, J.H.; Park, C. Rapid and concise quantification of mycelial growth by microscopic image intensity model and application to mass cultivation of fungi. Sci. Rep. 2021, 11, 24157. [Google Scholar]
  39. Zhang, W.; Chen, X.; Sun, W.; Nie, T.; Quanquin, N.; Sun, Y. Escherichia coli Increases its ATP Concentration in Weakly Acidic Environments Principally through the Glycolytic Pathway. Genes 2020, 11, 991. [Google Scholar] [CrossRef]
  40. Sun, Y.; Fukamachi, T.; Saito, H.; Kobayashi, H. ATP Requirement for Acidic Resistance in Escherichia coli. J. Bacteriol. 2011, 193, 3072–3077. [Google Scholar] [CrossRef] [Green Version]
  41. Mempin, R.; Tran, H.; Chen, C.; Gong, H.; Kim Ho, K.; Lu, S. Release of extracellular ATP by bacteria during growth. BMC Microbiol. 2013, 13, 301. [Google Scholar] [CrossRef] [Green Version]
  42. Kaufmann, S.H.; Reimann, J. Immunology of infection. In Vaccines; Springer: Berlin/Heidelberg, Germany, 1999; pp. 21–42. ISBN 3540647406 9783540647409. [Google Scholar]
  43. Au-Baer, A.; Au-Kehn-Hall, K. Viral Concentration Determination Through Plaque Assays: Using Traditional and Novel Overlay Systems. JoVE 2014, 4, e52065. [Google Scholar] [CrossRef]
  44. Green, M.R.; Sambrook, J. Molecular Cloning: A Laboratory Manual; Cold Spring Harbor Laboratory Press: Spring harbor, New York, USA, 2014; ISBN 978-1-936113-41-5. [Google Scholar]
  45. Farewell, A.; Neidhardt, F.C. Effect of temperature on in vivo protein synthetic capacity in Escherichia coli. J. Bacteriol. 1998, 180, 4704–4710. [Google Scholar] [CrossRef] [PubMed] [Green Version]
  46. Gant Kanegusuku, A.; Stankovic, I.N.; Cote-Hammarlof, P.A.; Yong, P.H.; White-Ziegler, C.A. A Shift to Human Body Temperature (37 °C) Rapidly Reprograms Multiple Adaptive Responses in Escherichia coli That Would Facilitate Niche Survival and Colonization. J. Bacteriol. 2021, 203, e0036321. [Google Scholar] [CrossRef] [PubMed]
  47. Hall, B.G.; Acar, H.; Nandipati, A.; Barlow, M. Growth rates made easy. Mol. Biol. Evol. 2014, 31, 232–238. [Google Scholar] [CrossRef] [PubMed] [Green Version]
  48. Son, J.; Lee, K.H.; Park, C. Enhanced Production of Bacterial Cellulose from Miscanthus as Sustainable Feedstock through Statistical Optimization of Culture Conditions. Int. J. Environ. Res. Public Health 2022, 19, 866. [Google Scholar] [CrossRef]
  49. Kim, H.; Son, J.; Park, C. Improved production of bacterial cellulose through investigation of effects of inhibitory compounds from lignocellulosic hydrolysates. Glob. Chang. Biol. Bioenergy 2021, 13, 436–444. [Google Scholar] [CrossRef]
  50. Maaløe, O.; Hanawalt, P.C. Thymine deficiency and the normal DNA replication cycle. I. J. Mol. Biol. 1961, 3, 144–155. [Google Scholar] [CrossRef]
  51. Karlsson, F.; Malmborg-Hager, A.C. Genome-wide comparison of phage M13-infected vs. uninfected Escherichia coli. Can. J. Microbiol. 2005, 51, 29–35. [Google Scholar] [CrossRef] [Green Version]
  52. Lee, K.; Zhan, X.; Gao, J. RraA: A Protein Inhibitor of RNase E Activity that Globally Modulates RNA Abundance in E. coli. Cell 2003, 114, 623–634. [Google Scholar] [CrossRef]
  53. Lee, S.Y. Systems Biology and Biotechnology of Escherichia Coli; Springer: Berlin/Heidelberg, Germany, 2009; ISBN 978-1-4020-9393-7. [Google Scholar]
  54. Schoenhofen, I.C.; Li, G. Purification and Characterization of the N-Terminal Domain of ExeA: A Novel ATPase Involved in the Type II Secretion Pathway of Aeromonas hydrophila. J. Bacteriol. 2005, 187, 6370–6378. [Google Scholar] [CrossRef] [Green Version]
  55. Huang, S.W.; Liu, H.P. Dual ATPase and GTPase activity of the replication-associated protein (Rep) of beak and feather disease virus. Virus Res. 2016, 213, 149–161. [Google Scholar] [CrossRef] [PubMed]
  56. Leigh, R.A.; Walker, R.R. ATPase and Acid Phosphatase Activities Associated with Vacuoles Isolated from Storage Roots of Red Beet (Beta vulgaris L.). Planta 1980, 150, 222–229. [Google Scholar] [CrossRef] [PubMed]
  57. Rocak, S.; Emery, B. Characterization of the ATPase and unwinding activities of the yeast DEAD-box protein Has1p and the analysis of the roles of the conserved motifs. Nucleic Acids Res. 2005, 33, 999–1009. [Google Scholar] [CrossRef] [PubMed] [Green Version]
Figure 1. Phage titer, E. coli cell number (16 h fermentation), and specific productivity (Qp) at each culture temperature. (a) Phage titer was measured via Blue-White screening after 16 h of fermentation in an XL1-Blue E. coli batch culture. The highest value was identified at 30 °C culture temperature, which was 10-fold the value at 25 °C and 16-fold the value at 37 °C. (b) E. coli cell number after 16h of fermentation was estimated OD600 measured using UV-vis spectroscopy with the correlation of 1 OD600 = 1 × 10⁹ cells per mL culture. (c) Qp was calculated by dividing E. coli cell number per mL culture from phage titer at each temperature and multiplying the values by ten to identify phage production efficiency per each E. coli. The highest Qp value was identified at 30 °C culture temperature, which was 9.6-fold the value at 25 °C and 18.5-fold the value at 37 °C. n = 3 for each data point. *** p < 0.001.
Processes 10 00962 g001
Figure 2. Growth curves and residual energy estimations of E. coli fermented with and without phage infection. Fermentation was conducted with the following conditions: 220 rpm stirring speed, 3 lpm of air injection, and 16 h fermentation term at each culture temperature (25 °C, 30 °C, and 37 °C). The OD600 of XL1-Blue E. coli fermented with and without phage infection was measured through UV-vis spectroscopy at each culture temperature. Contrasts between OD600 of E. coli produced with and without phage under the same conditions at (a) 25 °C, (b) 30 °C, and (c) 37 °C culture temperature. (d) Percentage of estimated residual energy at each culture temperature was obtained as mentioned in the main text, with the highest percentage at 30 °C culture temperature and 25 °C and 37 °C. n = 3 for each data point. *** p < 0.001.
Processes 10 00962 g002
Figure 3. Intracellular ATP comparison and ATP expenditure for phage production at each culture temperature. Overnight cultures of XL1-Blue E. coli infected with and without M13 phage were fermented at different culture temperatures for 16 h. Samples of cells were extracted at 0, 3, 6, 9, 12, and 16 h of fermentation to calculate intracellular ATP percentages residing in the cells measured via ATP luciferase assay (a) at 25 °C, (b) 30 °C, (c) and 37 °C culture temperature. The ATP percentages were normalized by OD600 of each sample. (d) Percentage of ATP expenditure for phage production was obtained using Equation (S7), which was highest at 30 °C culture temperature, followed by 25 °C and 37 °C. n = 3 for each data point. *** p < 0.001.
Processes 10 00962 g003
Figure 4. Normalized comparison between model-based estimated residual energy and experimentally calculated ATP expenditure for M13 phage production. Data of each culture temperature was normalized with the data at 37 °C to compare the similarity of the estimated residual energy and experimentally calculated ATP expenditure for phage production in the same bulk scale. Total ATP expenditure level for phage production was calculated by multiplying the ATP percentage for phage production with E. coli cell number per mL at each temperature followed by normalization. In a bulk dimension, the normalized ratio of the two data sets at 25 °C produced 89.1% similarity while data at 30 °C showed 79.3% similarity.
Processes 10 00962 g004
Figure 5. Concentration of genetically engineered M13 phage (4E and Y3E) and WT phage fermented at each culture temperature. Genetically engineered M13 phages were produced from 16 h of fermentation with XL1-Blue E. coli and were measured using UV-vis spectroscopy after concentration/purification via PEG precipitation to identify phage concentrations. Similar to WT, both Y3E and 4E phages produced the highest concentrations at 30 °C culture temperature, followed by 25 °C and 37 °C. n = 3 for each data point. *** p < 0.001.
Processes 10 00962 g005
Table 1. Amplification ratios of various M13 bacteriophage production-related studies.
No. aAmplification Ratio bTemperature (°C)pHMediumAdditivesE. coli
Strain
Ref.
12.50 × 103307.4LBN/A cXL1-BlueOur Study
22.00 × 10334N/A cHanawaltVitamin B1
Thymidine
HfrH 165/70[19]
31.76 × 10329N/A cLB dTetracyclineXL1-Blue[13]
41.00 × 10332→44→33N/A cLB dN/A cBT100[18]
51.40 × 10231N/A c2xYT dChloramphenicol
Tetracycline
Glucose
XL1-Blue[20]
61.30 × 102377.4NZY dTetracyclineK91[10]
a Results of studies numbered in the order of high to low amplification ratio. b Amplification ratio is defined as ratio of final plaque forming units (pfu) to initial pfu for comparison of the optimal phage production temperature of each study. c These parameters were not considered in these studies. d LB: Luria broth, YT: yeast extract and Tryptone, NZY: NZ amine (casein hydrolysate) and yeast extract.
Table 2. Optimal conditions of ATPase with Walker A and Walker B structure from bacterial hosts.
No. bTemperature (°C)pHIonic ConcentrationATPase TypeFunctionRef.
137~427~85 mM Mg2+ ExeASecretion of exotoxins[54]
2567.52.5 mM Mg2+Rep cInitiation of replication[55]
3N/A a7.5~8.53 mM Mg2+
50 mM KCl
ATPase of Beta vulgaris L.Transport of solutes[56]
4N/A6.51.5~2.0 mM MgCl2Has1pRemodel macromolecular interaction[57]
a N/A: not available. b Results of studies numbered in the order of high to low amplification ratio. c Rep: replication associated protein.
Publisher’s Note: MDPI stays neutral with regard to jurisdictional claims in published maps and institutional affiliations.

