1. Introduction
Because of continuous efforts to reduce the costs of machining processes, increased energy efficiency has become a priority in modern machining workshops. In successful machining workshops, careful energy management for increasingly sustainable manufacturing friendly to the environment is intensively promoted and monitored. In the end, according to European standards [
1], the state governments are obliged to prepare protocols and make strategies to increase energy efficiency and minimize CO
2 emissions and environment print-outs. The only way to realize those targets is to modernize equipment and infrastructure [
2]. It was estimated that within 13 years, it would be necessary to invest EUR 3 billion to achieve at least a 20% reduction in CO
2 emissions [
1]. Thus, in addition to the growing prices of energy products, government directives also affect further technological development and investment in machining workshops. Pervaiz et al. [
3] concluded that the sustainability of the machining process can only be improved by incorporating different innovative approaches related to energy and tool-workpiece material consumption.
The most innovative approach to modernizing machining workshops is the introduction of cloud technologies into machining processes [
4]. Cloud technologies are the most innovative key technologies in the introduction of Industry 4.0 into the manufacturing industry [
5]. According to paradigm I4.0, digital technologies have the potential to transform machining processes to a new, more efficient level [
6]. A literature review reveals recent studies related to energy efficiency improvements in machining based on the Internet of Things (IoT). Chen et al. [
7] introduced a framework for the energy monitoring of machining workshops based on IoT. Chen et al. [
8] designed an IoT-based energy efficiency management system for machining workshops. Zheng et al. [
9] introduced a framework of smart energy consumption monitoring in machining.
The rapid growth of cloud technologies was triggered by the extensive development of technologies. In the last five years, the number of machines communicating with other systems has been increased by 300%. Similarly, the rapidity of data transfers in networks have been increased by 200%, sensor prices have been reduced by 80%, and the power consumption of sensors has been reduced so that they can function 100% without a main power supply [
10].
Modern machine tools are most often over-engineered with many advanced functions, additional sub-systems and numerous advanced sensors allowing connectivity with other geographically distributed manufacturing systems. In addition, they can acquire, pre-process and transport great quantities of data about the operation of particular sub-systems through internet network infrastructure up to cloud monitoring applications [
11].
Cloud technologies provide an ecosystem-common platform with a common language for linking and sharing machining data (sources), know-how, analytical and software tools, IoT applications and physical devices [
12]. The platform integrates the data from numerous devices and uses analytical methods for sharing the most important data with IoT control applications related to specific needs of the machining workshop [
5]. The IoT applications use the information of the observed devices to offer the technologist the required solution and a suitable time for process improvement, or they automatically perform the process corrections. This indicates a logical development path where cloud technologies are used for IoT applications regarding the monitoring and control of machining processes.
Control systems with the potential to monitor the machining process in automated machining systems (AMS) could completely replace the traditional duties of the machine operator. In those control systems, monitoring tool conditions is the key component for machining without errors [
13].
One innovative way to solve tool wear and tool failure problems is the automatic identification of tool wear based on artificial intelligence [
14]. Pimenov et al. [
15] suggested the use of artificial intelligence methods for real-time prediction of surface roughness deviations in face milling depending on the main drive power and tool wear. They developed models to predict the roughness of machined surfaces in a complex correlation between tool wear and cutting power. The random forest (RF) model was shown to have the highest accuracy. Kuntoglu et al. [
16] reviewed sensors mostly used in indirect tool condition monitoring systems (TCMS) and their correlations between tool wear to summarize the literature in this field for the last two decades. Furthermore, data acquisition and signal processing methods were evaluated considering decision-making approaches such as artificial neural networks, fuzzy logic, the hidden Markov model, support vector machines and ANFIS. Pimenov et al. [
17] analyzed methods of using traditional sensor systems and various methods of artificial intelligence for monitoring the state of the tool in turning operations, identifying the advantages and disadvantages of using these methods in modern production.
Zhang et al. [
18] proposed a milling parameter optimization method for efficient rough machining by combining the off-line optimization and real-time monitoring of tool wear based on the spindle current. Experimental results showed that a numerical optimization method based on random vector search increased the machining efficiency by 118.2%. Zhou and Xue [
19] reported that cutting tool breakage contributes around 7% to the downtime of machine tools. Vetrichelvan et al. [
20] stated that up to 20% of machine stoppages occur in modern machine centres due to tool failure, resulting in reduced productivity and economic losses. The cost of the tool and the cost of tool changes represent up to 12% of processing costs [
21]. Karandikar et al. [
22] summarized that an accurate and reliable TCM system in milling could prevent these problems and reduce costs by 10–40%. Furthermore, the introduction of tool condition monitoring systems (TCM) will certainly increase competitiveness, shorten downtimes, minimize scrapping, and prevent damage. Rehornet et al. [
23] pointed out that an accurate tool condition monitoring system can increase the spindle speed up to 50%. Salonitis and Kolios [
24] stated that, typically, only 50–80% of the tool service life is utilized. Karandikar et al. [
22] stated that less than 80% of tool life expectancy is used in modern machining systems.
The above statements show that there exists a practical need for the utilization of cloud applications for monitoring cutting tool conditions that will favourably affect the modernization of machining workshops from the viewpoint of increased energy efficiency.
The literature review reveals that, recently, only a few concepts of IoT platforms for machining process monitoring have been presented. Teti [
13] gathered the most important achievements in the field of advanced monitoring of machining processes and presented four basic functions of cognitive monitoring systems. Teti [
25] introduced the architecture of a cloud platform for monitoring cutting tool conditions in turning. Tapoglou [
26] worked out a cloud-based platform for the selection of optimal machining parameters based on real-time monitoring. Quite a few studies on the development of cloud platforms for monitoring the energy efficiency of machining processes are available. Chen et al. [
7] proposed an energy efficiency monitoring system for a workshop supported by IoT technology. Chen et al. [
8] proposed an IoT-based energy monitoring and management system for machining workshops. The efficiency of the proposed system is demonstrated in industrial applications. Further, a cloud-based system for the real-time monitoring of the availability of machining systems [
27], a system for machine prognosis [
28], a system for the automatic detection of damage and planning of machine tool maintenance [
29] and a system for the adaptive planning of processes, taking into account the capacity of machine tools [
30], have been worked out. Saif et al. [
31] developed a machine vision inspection system based on IoT architecture for detecting and inspecting the dimension of the holes in the cloud. The system was designed for milling machines and is based on a camera system to ensure product quality.
Li et al. [
32] proposed a cloud-computing-based approach to predict cutting tool wear status by effectively processing the huge amount of data produced in a machine tool. Wu et al. [
33] presented a fog-computing-based architecture for data-driven machine tool health and on-line process monitoring in cyber-manufacturing. Many wireless sensors have been installed on CNC machines to collect real-time status data.
Herwan et al. [
34] conceived the architecture of a cyber-physical system for the design of an adaptive and autonomous machining line. The proposed architecture allows the monitoring of tool wear and damage and the monitoring of the quality of the surface on the line. Jiao et al. [
35] made an RBF cloud neural network model for tool wear identification.
In the literature, it is not possible to detect research efforts for the creation of control applications based on the detection of chip size. Researchers [
36] have classified chips using AE spectrum components. Researchers have developed a method for monitoring the disposal state of chips in drilling [
37]; furthermore, researchers have recognized chip shapes based on analysis of cutting force signals [
38] and automatically detected the breakage of chips by the use of cutting force-frequency analysis [
39]. Zhang et al. [
40] investigated tool wear and chip formation for milling difficult-to-machine materials. They developed a relationship between tool wear and chip morphology to monitor tool wear. Finally, Pagani et al. [
41] proposed a deep learning method to indirectly identify tool wear in turning using the color of produced cutting chips.
Cutting parameters and the cutting tool’s condition affect the chip size and, consequentially, the cutting force magnitude. The literature reveals that the cutting force signals are most frequently used for the determination of tool conditions. Despite that, in this research, an expensive and impractically located dynamometer is replaced by a considerably cheaper, smart optical system. Therefore, the current chip surface size is used as an indicator for the determination of tool conditions.
To the best of our knowledge, there are no studies that consider the monitoring of cutting tool conditions through the detection of cutting chip size in machining. Furthermore, after a perusal of the existing studies, it can be found that there is still no system for the monitoring of cutting tool conditions in end milling based on the IoT. Therefore, this paper attempts to fill the gap and proposes a cloud-based system for the on-line monitoring of tool conditions through a combination of visual detection of cutting chip surface size and identifying cutting force trends in end milling, aiming to improve the efficiency of the machining process by adapting cutting parameters.
The research hypothesis is that the proposed system where the cloud computing services are linked with the machine tool and the optical system for detecting cutting chip size is feasible and could be implemented to monitor tool conditions during milling operations.
The scientific novelty of the approach presented here is the integration of the cloud-based platform, the IoT applications, the optical monitoring of cutting chip size and the neural network-based identification of cutting force trends to produce a centralized, cloud-based tool condition monitoring system. In addition, the novelty of this research is the use of current chip surface size as an indicator for the determination of the cutting tool’s condition. The novelty is also the neural network-based identification model for the TCM, which achieves high accuracy. The above-mentioned concept is new from a scientific viewpoint with respect to other actual research.
Another advantage of this research is the reduction of investment costs in the development of a monitoring system due to the replacement of an expensive and impractically located cutting force sensor (dynamometer) with a considerably cheaper, smart optical system. The practical significance of the research is the developed prototype of the cloud-based system for optical monitoring of tool conditions during milling, which ensures savings, an increase in machined surface quality in the industry and the future centralized simultaneous monitoring of all processes in the workshop.
Therefore, this article presents a unique cloud-made system for monitoring cutting tool conditions in the milling of hardly machinable materials, where abrupt wear and frequent damage to tools occur. With the use of artificial intelligence, the system monitors the cutting tool’s condition through the identification of cutting force trends and, by process correction, protects the tool against excessive loading. During the identification of tool breakage, the system momentarily stops the process by reducing the feed rate to 0 and warns the machine operator by luminous indicators of tool breakage. In this study, the measured chip geometry is used as an indicator for changes in tool wear.
The paper is organized as follows.
Section 2 presents the proposed cloud-based cutting tool condition and process monitoring system. The next six subsections describe the IoT applications of the monitoring platform. In
Section 3, the results of an experiment with variable cutting depths are analyzed and discussed.
Section 4 gives the concluding remarks.
2. Materials and Methods
2.1. Cloud-Based Cutting Tool Condition Monitoring System
The diagrammatic principle of functioning of the cloud-based cutting tool condition monitoring system is shown in
Figure 1. The algorithm shown in
Figure 1 consists of four steps. In step 1, detection, identification and capture of the chip surface size are performed. Then, chip surface size extraction, CSA calculation, recognition of cutting force patterns, and process correction are performed on the cloud platform.
During machining, the optical system detects, identifies and acquires the current chip surface size. The diagnostic bus in the terminal for communication and data acquisition (TCDA) gathers the signals from the optical sensor, pre-processes them and transports them in the form of signal packages up to the IoT communication gateway on the cloud platform. The IoT communication gateway of the platform receives the signal packages and grades them to the extent required for the control of tool conditions. In this way, the platform builds historical records in the form of protected data collection. Then, the platform executes monitoring of the tool’s condition and corrects the process with the logic and rules inserted into the platform via IoT applications.
From the pre-processed signals of the optical sensor, the IoT applications single out the current surface of the chip acquired. They then determine the average size of the chip surface (CSA—chip size average) and, with the obtained values, calculate and display the cutting force sizes in a time diagram. Then, the artificial neural network capable of recognizing patterns continuously analyzes the cutting force-time flow and, in real time, identifies one of the five typical trends (flows) of cutting force. The result of this identification is used for the execution of process correction. Process correction prevents tool overloading. The requests for the correction of cutting parameters are transmitted from the cloud via the IoT communication gateway and TCDA back to machine tool controls. When the tool breakage pattern has been identified, the request for process stoppage is transmitted. The user interface with tool condition monitoring results is accessible with a system of passwords on geographically distributed units through IoT applications on the internet.
The structure of the cloud-based system for monitoring the cutting tool’s condition and the milling process is shown in
Figure 2. The lower part of
Figure 2 shows the local process part with the machine tool, the optical system, and the data acquisition system. The collected data are transported via the IoT communication gateway to five cloud applications on the IoT platform for TCM, which is shown in the upper part of
Figure 2. In the processing part, the machine tool, the optical sensor and the communication and data acquisition terminal are connected to the local area network (LAN). Physical devices are connected through the IoT communication gateway to the platform on the private cloud inside the machining workshop. The IoT cloud platform uses analytical services in real time for the execution of tool condition monitoring and possible process corrections. The communication and data acquisition terminal links the manufacturing system, cloud services and machine tool operator. The internet analytics can be shared with other geographically distributed machining systems in the machining workshop.
The monitoring process starts with the transmission of sensor signals via LAN to the communication and data acquisition terminal. This is followed by the pre-processing of signals, including acquiring, reducing, transforming and conveying signal packages up to the IoT platform. The IoT communication gateway of the platform receives the signal packages and safely collects, protects, saves, filters, and extracts the values and transforms them into a form allowing rapid insight into great quantities of data. The data are reduced to the extent required for tool condition monitoring. Then, the first analytical application is used to single out the current surface of the acquired chip from the pre-processed optical sensor signals. The next IoT application calculates the average chip surface size and transmits the obtained values to the application to extract features from the cutting force signals.
By considering the CSA and specific cutting force kc, the algorithm for the last mentioned application calculates the average cutting force F in the first step and displays it in a graph with a time axis. In the next step, the algorithm continuously analyzes the flow of the cutting force, F, and identifies the current typical cutting force trend. It transmits the identification result together with the currently calculated cutting force magnitude to the process correction application. By adapting the cutting parameters, the process correction application prevents the cutting tool from being overloaded and controls the indicators for warning the machine tool operator about the cutting tool’s condition and the cutting process. The decisions about process correction are sent from the private cloud back into the processing level, where TCDA generates the command telegrams and makes the machine tool controls execute them.
The tool condition and process monitoring application graphically and numerically displays the monitoring results. The application serves as a control panel of the system.
2.2. Application for Singling out Important Features of a Detected Chip
In this IoT application, within a time domain, the statistical features containing important information about the cutting process and, particularly, the current condition of the cutting tool are singled out from pre-processed optical sensor signals sent from the tool server. The most important selected feature of the sensor signal is the current surface of the chip acquired. The core of the application is the algorithm for determining the current chip surface. The algorithm is conceived in Vision Builder (VB); it consists of 5 steps, presented in
Figure 3 and described in detail in the research [
14].
In the first algorithm step, the picture acquisition method and the coordinate system orientation are defined, and the picture is calibrated. During the calibration procedure, the ratio required for the execution of precision measurements of the chip surface with up to 15µm accuracy is determined. The result of the first step is shown in
Figure 3a.
Figure 3b shows the result of picture processing. During processing, in the second step, the 32-bit RGB picture is converted into a greyscale HTL image; by adjustment of picture parameters, the differences between the chip acquired and the background are stressed.
In the third step, the 8-bit greyscale image is converted into a binary picture by the image thresholding method. The method classifies all pixels in the interval from 0 to 40 as dark background or noise and assigns them the logical value 0. All remaining pixels are classified as white particles and/or objects for analysis with an assigned logical value of 1. The result of picture thresholding is shown in
Figure 3c.
Figure 3d shows the effect of the two-phase picture filtering process with the use of a Median filter (3 × 3) and morphological operator (step 4). In step 5, the algorithm determines the positions, orientation, dimensions and size of the surface of detected chips in mm
2 and classifies them from the smallest to the largest. The obtained values of all chips are transferred to other IoT applications through system variables.
2.3. Application for the Calculation of Chip Size
The mathematical algorithm of the application with shift registers calculates the running average of the chip surface size for every 30 successively acquired chips. The number of chips considered in the calculation of the CSA (short for chip size average) is determined to be 2 to 100 on the user interface of the application for tool condition monitoring and data visualization. The CSA stands for the average surface area of chip projections at a right angle to the optical axis of the camera and depends strongly on the chip geometry. Studies state [
20,
23] that the chip geometry changes with progressive tool wear; therefore, the CSA may be associated with tool wear. The calculated values of CSA are used in the algorithm for cutting force calculation in the process correction application and are displayed in the user interface on the application for tool condition monitoring and data visualization.
2.4. Application for the Extraction of Features from the Cutting Force Signal
The algorithm in this application calculates the average cutting force, F, containing most information about the cutting tool condition and machining process. The average cutting force is calculated by considering the CSA and specific cutting force kc.
The cutting force k
c is adopted from the study [
42], where it is experimentally determined by considering the workpiece material properties, the milling method, cutting parameters, tool geometry and contact conditions between the tool and workpiece.
The calculated average cutting force depending on the machining time is graphically displayed in a graph.
Then, using an artificial neural network capable of pattern recognition, the algorithm of the IoT application continuously monitors and analyzes the cutting force F_ flow. The trained neural network is capable of identifying the six typical and most frequent flows of cutting force. When it has identified the typical cutting force trend, it transmits the result to the process correction application. The neural network capable of recognizing the cutting force trend is shown in
Figure 1. In the process of training, it stores five typical reference samples of the cutting force flow, as indicated in
Figure 1.
The most favorable trend with constant cutting forces and a non-worn tool is shown in
Figure 1a.
Figure 1b shows the ramp trend of the cutting force, which is a consequence of milling with linearly growing and decreasing axial milling depth.
The third reference trend (
Figure 1c) shows the cutting force flow occurring at the step change of the axial cutting depth. It appears in the typical case when a non-worn tool hits a stair material with a constant feed rate. When the maximum cutting force is exceeded, a feed rate correction is required.
Figure 1d shows the cutting force trend in the machining of corners, where a characteristic cutting force jump occurs due to the increased tool and workpiece contact surface. A process correction in the form of feed rate reduction is required to prevent breakage and excessive tool wear.
Figure 1e shows the cutting force jump typical of a tool hitting a hard inclusion in the material, whether a burr or other incorrectness on the workpiece surface. When the maximum cutting force has been exceeded, feed rate correction is required.
When the cutting edge is damaged or broken, the cutting force is strongly increased for a moment; then, it drops to zero. A damaged cutter generates a small jump in the cutting force, as it is loaded with a smaller chip. The next undamaged tooth generates a greater jump in the force, as it must also remove the part of the material not removed by the previously damaged cutting edge. The maximum cutting force jump for a damaged tool is, thus, greater than in the case of an undamaged tool.
Figure 1f shows the typical trend in the cutting force with a broken cutting tooth. The feed rate must be reduced, or the process must be stopped.
The neural system for the recognition of cutting force trends was made in four steps. In the first step, the neural network structure was defined. The neural network used contains three hidden levels. The input vector consists of five normalized inputs. The input vector is comprised of the cutting force (F_flow) (1) and cutting conditions; (2) cutting speed (v
c); (3) feed rate (f); (4) and the axial depth of the cut (A
D) and radial depth of the cut (R
D). The output vector consists of only one neuron representing the cutting force trend flow. The output neuron assumes values from 0.01 to 0.99. The output neuron is apportioned with a value of 0.01 for the case of normal cutting conditions with the cutting force trend in
Figure 1a and 0.99 for the case of tool breakage with the cutting force trend in
Figure 1f. The intermediate values of the output neuron represent the force trends shown in
Figure 1b–e.
In the second step, the learning rate, momentum factor and number of neurons in the hidden levels of the neural network were defined. The learning rate was set to 0.9, the number of hidden neurons was set to 10, the momentum factor was set to 0.3, and the number of training/testing cycles was set to 1500.
In the third step, the data for neural network training and testing were prepared.
Real-time machining data, including cutting conditions, cutting chip size measurements and tool paths, from serial production in Štore Steel Ltd. were used for neural network training and testing. Data were collected continuously over a period of 10 days in February 2021. Serial machining of the 16MnCr5 workpieces was performed on an NHX5500 machining center with an NI 1772 C optical high-speed camera installed. During this period, 250 identical pieces were machined. Ball-end milling tools (R216-16B20-040) of 16 mm diameter with two cutting inserts (R216-16-03M-M) were used. Collected raw data were transferred to the company’s local terminal and stored there in the big database. Based on this collected data, a neural network for identifying cutting force trends was developed. All 3120 data points collected were divided into training and testing sets. A total of 2400 data points were directly used for neural network training and testing. In addition, 102 data points were used to verify the accuracy of the predicted values.
In the fourth step, the process of setting neural network weights was executed with the purpose of correctly classifying the cutting force trends. After completion of training, in the last step, the neural network was ready and was used for analyzing and classifying the cutting force trends.
2.5. Application for Process Correction
The application for process correction continuously monitors the current cutting force trend and, by adapting cutting conditions, compensates for the cutting errors caused by trouble in the process and tool damage. The algorithm of the application has a case structure and is capable of adapting the process parameters. The algorithm adapts the on-line feed rate and, thus, maintains the accuracy of machining without reducing the production capacity. When the reference cutting force has been exceeded, irrespective of the cutting force trend, the process correction is effected within 4 ms after the occurrence of the event. The command for the correction of feed rate is transferred by a telegram through the IoT router and local terminal up to the machine tool controls. The correction of the feed rate is effected through a feed rate override function (DNCFRO), in which the step regulator incrementally increases or decreases the feed rate until the cutting force signal is below the value of the reference force. Simultaneously, with the execution of the milling process correction, the machine operator is warned in the application for tool condition and process monitoring by alarm and error visualization.
The input into the algorithm of the application is the identified cutting force trend transmitted by the neural system in the feature extraction application from the cutting force signal.
When the output of the neural system exceeds 0.81 (identified tool breakage), the algorithm of the application for process correction sends a telegram with a command for process stopping (DNCFRO = 0%) and signals “tool breakage” into the application for tool condition and process monitoring.
2.6. Application for Tool Condition and Milling Process Monitoring
This application provides the machine tool operator and control personnel with a graphic interface for tool condition and process monitoring. In graphical and numerical form, it displays the results of analytical methods acquired on the cloud, the results of the condition of the identified tool and process, the executed control actions for process correction and warnings for necessary human intervention. By entering the field, the operator influences the process by defining the maximum allowable cutting forces and reference chip surface sizes. The output of the application is the information about the tool condition and possible required process correction in the form of a change of the value of the DNCFRO function.
Figure 4 shows the graphical user interface of the application for tool condition and milling process monitoring. The monitoring window of the application shown in
Figure 4 consists of a part for monitoring cutting forces and identifying cutting force trends, a part for setting the reference cutting force and cutting chip surface size limits, a part for monitoring cutting chip size, the main control part of the system and a part for process correction. At the top of the monitoring window of the application, the current flow of calculated cutting force is recorded. At the left of the graph, the identified cutting force trend and the identified cutting tool status are recorded. Below the force graphs, the control part is located, where the maximum allowable cutting force and the reference chip surface size are set. With three graphic indicators, the operator is informed of the correctness of cutting force and chip size. In the central part of the monitoring window, the information about the number of acquired chips and their properties, including CSA, is displayed.
The extreme bottom part contains pushbuttons and switches for energizing the entire control system and setting the optical measuring system parameters. On the left, the executed feeding speed corrections are recorded. The monitoring window of the application is also projected onto the communication and data acquisition terminal.
2.7. Terminal for Communication and Data Acquisition
On the terminal, the monitoring window of the application for tool condition and process monitoring is projected to the machine operator. The principal duty of the terminal with software for data acquisition is acquiring, pre-processing and transferring sensor signals from the optical system to the IoT gateway on the cloud. To that end, the hypertext transfer method is used. Another duty of the terminal is receiving the decisions taken on the correction of the process on the cloud and generating and transmitting the command telegrams with DCFRO function values up to the CNC machine tool controls.
2.8. Statistical Methods
Precision, recall, F1 score and accuracy were calculated and reported in a confusion matrix to evaluate the performance of the multi-output classification model [
14]. All analyses were performed using the SPSS software version 28.0. The results of the classification are shown in
Table 1.
3. Experimental Results and Discussion
To demonstrate the feasibility of the cloud-based platform for tool condition and process monitoring, a simple experiment with variable axial cutting depth is introduced below.
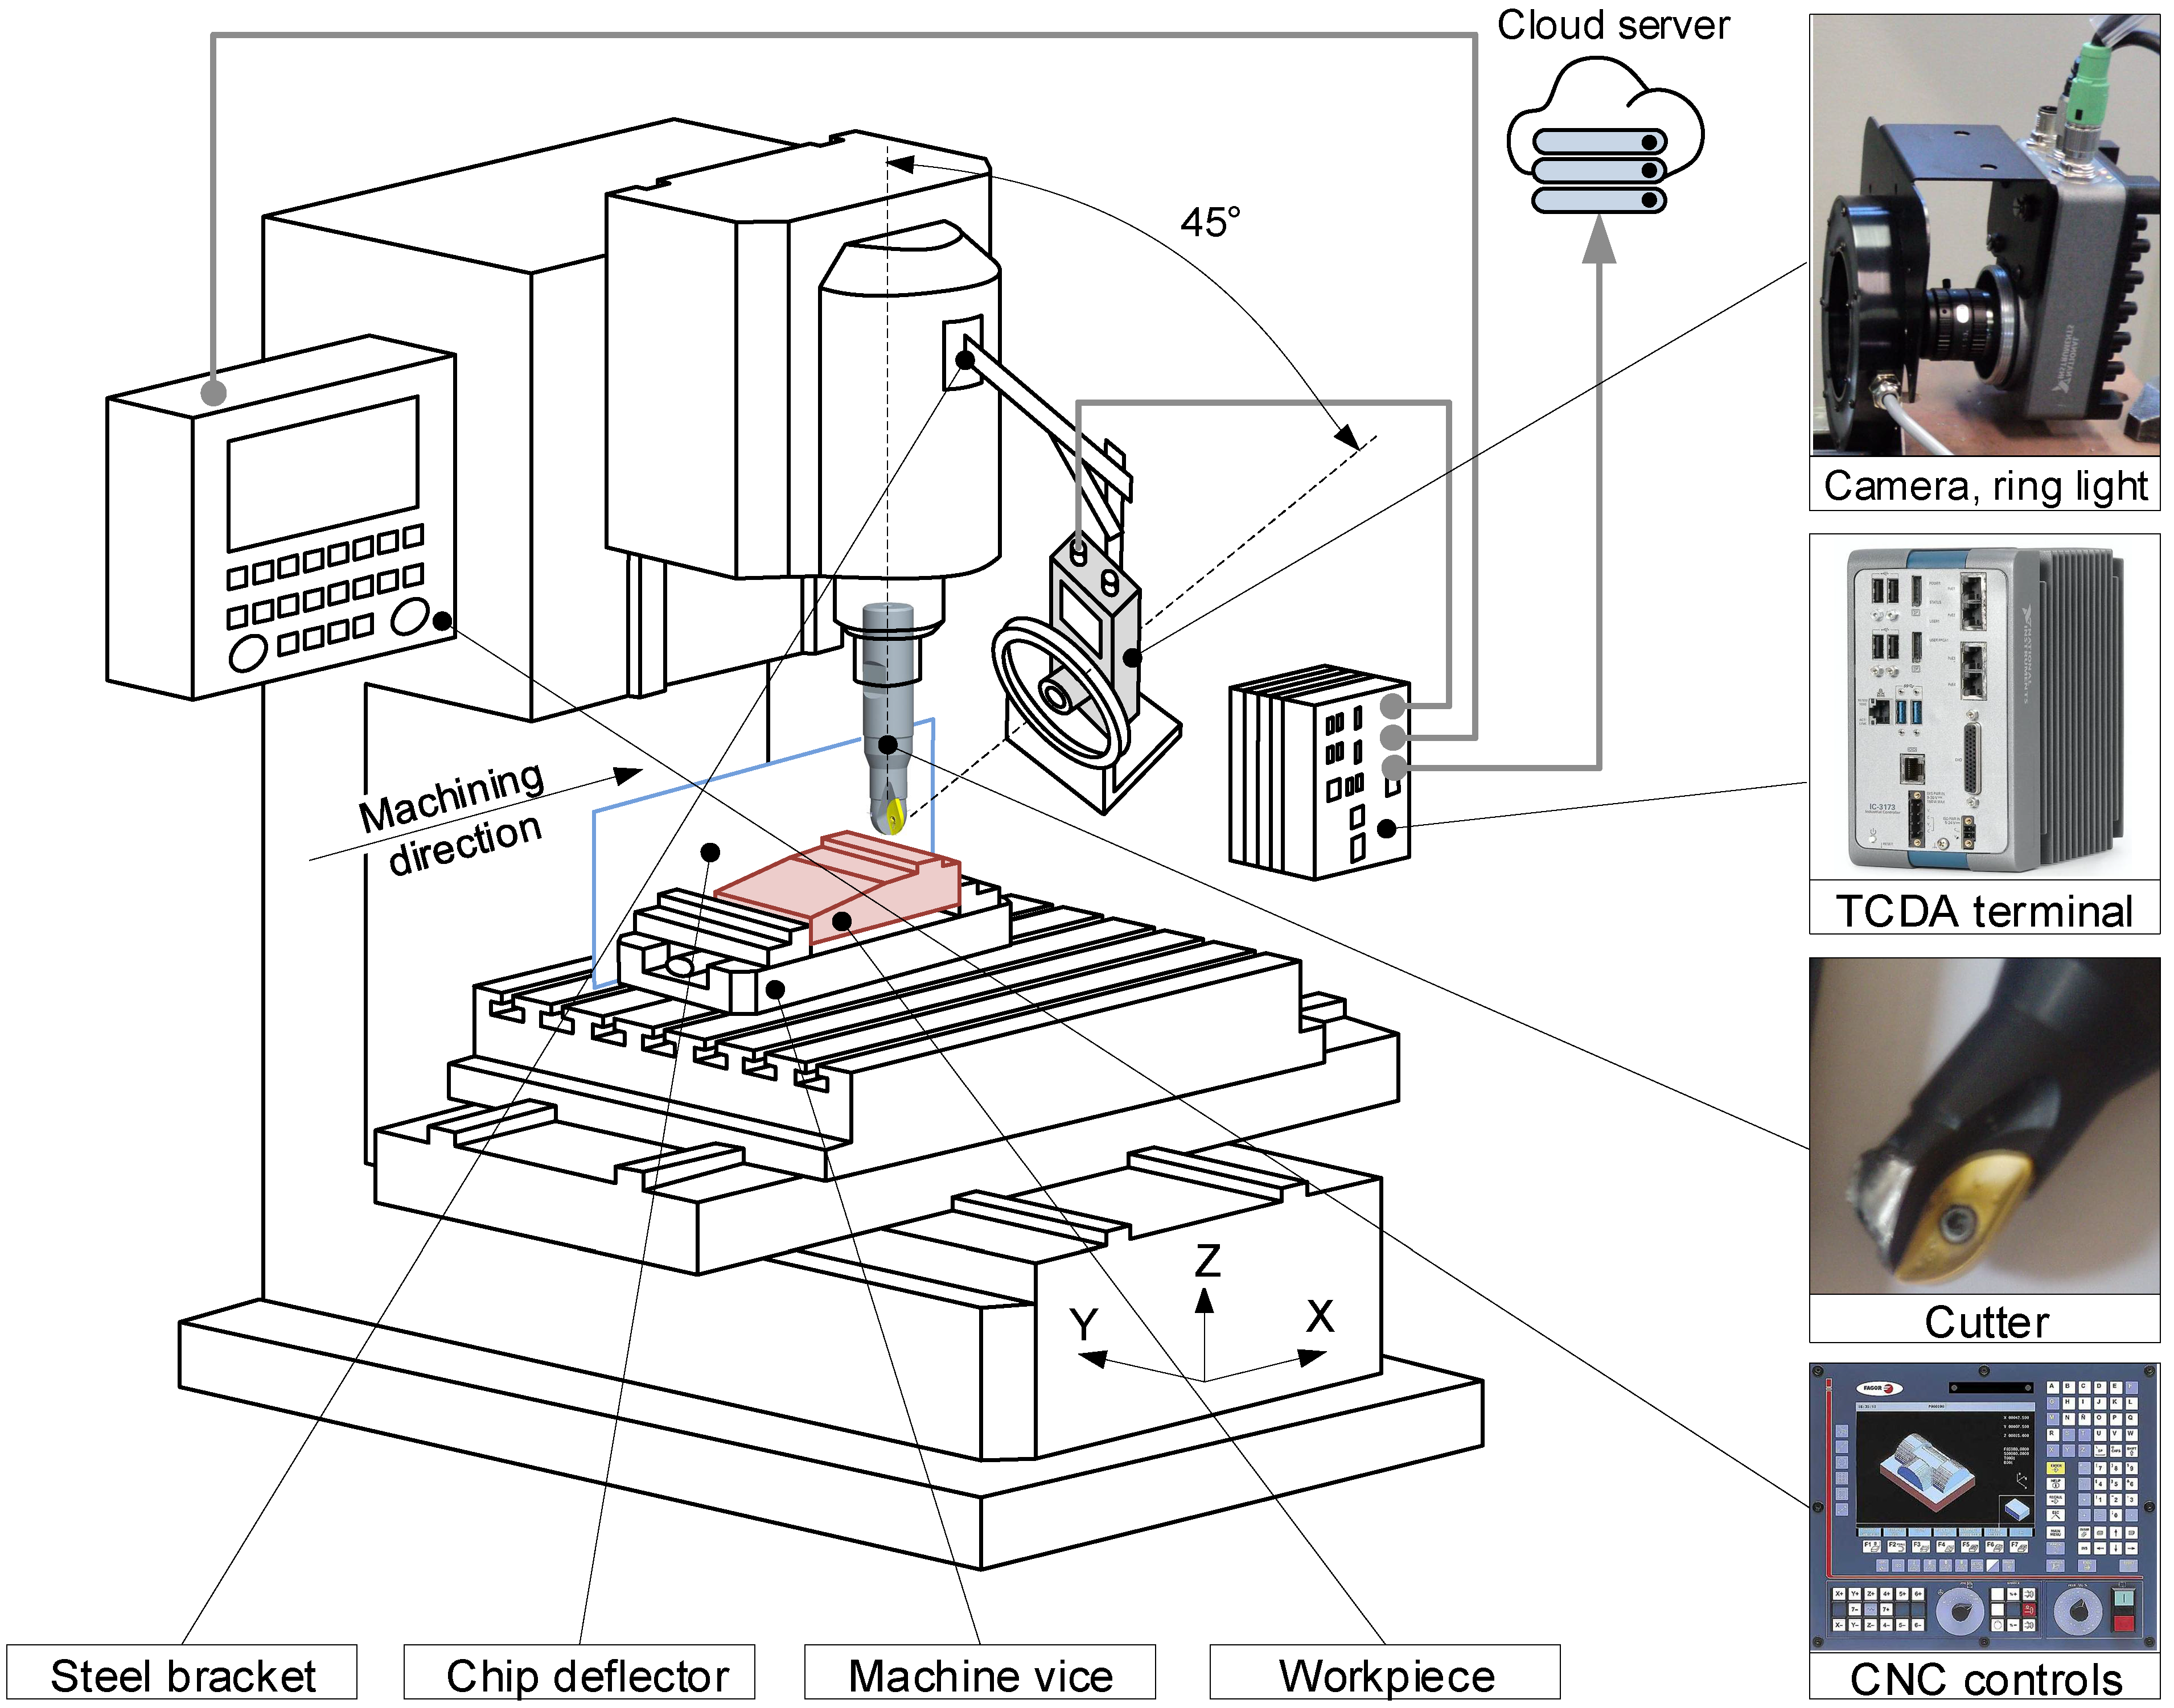
Figure 5 shows the experimental setup and its main components. The experimental setup included a prismatic workpiece (16MnCr5), machining center (Heller BEA1), Fagor CNC controls (8040-M), high-speed camera (NI 1772 C) with an adjustable steel bracket, ring LED illuminator (LTRN024NW), TCDA terminal (IC-3173) with data acquisition software, cloud server (E-2174G), ball-end milling tool (R216-16B20-040), machine vice (NC 100 M) and a glass chip deflector.
The workpiece from 16MnCr5 constitutes the prismatic part, where the axial cut depth continuously increases from 2.5 mm to 4 mm. The other workpiece part contains a short stair of 6 mm in height, simulating a burr or hard inclusion. The profile of the workpiece with dimensions of 210 mm × 250 mm × 60 mm is shown in
Figure 6. The chemical composition of the stock is shown in
Table 2. The workpiece hardness of 163 HB was measured by a DigiRock BRV3 digital universal hardness tester with automatic dwell time and loading control.
The machining experiment of the monitoring of cutting tool conditions was conducted on the Heller BEA1 machining center with 8040-M Fagor CNC controls and the installed NI 1772 C optical high-speed camera. The camera acquired the information about chip surface size and transmitted it via a gigabit ethernet cable up to the data acquisition and communication terminal.
A high-performance IC-3173 industrial computer was used as a terminal. The IC-3173 performed individual processing of captured images, data transport to sensor applications, data merging into a cloud, data segmentation, A/D conversion and handling of input and output signals in real time. It transferred the segmented and buffered signals via hypertext transfer protocol to the private cloud server of the University of Maribor (UM). The buffer size was 64 samples, and the latency for this buffer size was 1.45 ms. The UM cloud server contains standard web applications with artificial intelligence-based algorithms. The IC-3173 contains a Vision assistant and Vision Builder application for setting up, calibrating, and monitoring the high-speed camera. The sensor signals from the optical system were pre-processed and filtered using LabVIEW software. LabVIEW and DNC functions were used to transfer machining parameters and control commands from the Fagor CNC controls to the IC-3173. All real-time machining data and data from the optical sensor were assigned a unique ID. The data was converted into XML files with the attached time label. The IC-3173 transferred XML files to cloud web applications based on received HTTP requests over the TCP/IP protocol. The values of machining data were updated every 100 ms. The terminal operates as a web server. Thus, TCM is easily performed on mobile devices by calling XML files directly from the IC-3173 and presenting them on smartphones or tablets.
In the experiment, a sharp ball-end milling tool of 16 mm diameter and 10° helix angle was used. The tool has two cutting inserts with a 12° rake angle and an outside coating from TiN, designated GC 1025. The cutting insert material is P10–20. The information about the geometry of the cutting tool is listed in
Table 3. The tool geometry and the principal angles of the taper ball-end mill cutter are shown in
Figure 7.
The feed direction of the cutting tool was always parallel to the
X-axis of the work machine table and is shown in
Figure 6. The
X-axis of the optical system was parallel to the machine tool
X-axis. The
Z-axis was parallel to the spindle axis.
A standard machine vice NC 100 M with a clamping force indication was used for mounting the workpiece on the horizontal machine table with dimensions 500 mm × 500 mm.
A camera with a 15.6 W ring LED illuminator (LTRN024NW; 17,500 lux; white) was attached to the spindle housing with an adjustable bracket. The camera moved with the spindle housing. The horizontal working distance (300 mm) between the camera and the tip of the cutting tool remained constant during the experiment. The camera was aimed at a 45° angle to the axis of the main spindle towards the tip of the tool.
A glass chip deflector mounted on the machine workbench increased the number of detected chips by 500%. The task of the deflector was to direct the chips in front of the camera.
The machining tests were carried out with the down milling (climb milling) method of milling operation. Therefore, the workpiece was fed with the direction of the cutting tool rotation. The machining process was carried out from point A to point E (
Figure 6). After the first tool pass, the damaged cutting inserts were replaced, and further identical tool passes with the same cutting parameters followed. The experimental tests were carried out for one chosen set of cutting parameters.
The cutting chip size was continuously measured during the tool pass with the high-speed camera. The camera was set to enable the measurement of the chip size to an accuracy of 7 µm. The camera pixel size was 7.4 µm × 7.4 µm. It captured 56 frames per second during the experiment. The resolution of the images captured was 2048 × 2048. On average, the camera simultaneously detected 9 chips of different sizes per frame. To determine the average chip size, 20 repetitions of the chip size measurements were required.
Then, the sensor signals were transported to the IC-3173 for data pre-processing, and after that, they were sent via the IoT gateway to the first cloud application for singling out the chip surface size. Based on the calculated average chip surface size and the specific cutting force, the average cutting forces, F, were calculated and displayed in the graph. Then, an artificial neural network with pattern recognition capability was employed to continuously monitor the cutting force flow and determine the status (condition) of the cutting tool based on the identified cutting force trend. In the last phase, the process correction application responded to the identified cutting force trend and the state of the cutting tool by adjusting the feed rate. The monitoring loop was thus completed and repeated throughout the experiment.
The target of the experiment was to monitor the condition of the tool through identifying the cutting force trend and to prevent excessive tool loading by adapting the tool feeding speed. The experiment started by entering the maximum allowable cutting force 2.90 kN into the monitoring window of the application (
Figure 4). The initial feed rate was set to 860 mm/min with an option of adaption in the range from 120% to 0%. The spindle speed (n) was set to 1000 rpm, and the radial depth of cut (R
D) was set to 14 mm.
The experiment result is shown in
Figure 6. The experiment started with milling the prismatic workpiece part with uniformly increasing axial cutting depth, with the chip surface area changing from 1.2 mm
2 to 1.7 mm
2. The neural system for the recognition of cutting force trends identified the ramp trend of cutting force with an output neuron value of 0.22 and displayed it in the monitoring window of the application. Machining from point A to point B occurred with a constant feed rate. The cutting force calculated in point B exceeded the maximum allowable force; therefore, a correction of the milling process correction via diminished feed rate was triggered. The result of the correction was a constant chip surface area size of 1.7 mm
2 and a constant cutting force. The cutting force response to the feed rate correction is shown in
Figure 6b.
Figure 6f shows the flow of adaption of the tool feeding speed, which was reduced to 670 mm/min in sections B to C.
During machining of the workpiece section from point C to point D, the neural network identified and signalled a constant cutting force trend (
Figure 6c) with an output neuron value of 0.1 and kept the indicator for the non-work tool energized.
In point D, the tool hit the stair at a non-reduced speed, such that a great jump of cutting force occurred. The system responded with a feed rate reduction, as shown in
Figure 6h. The neural network first identified the force trend “step increase of axial milling depth” with a neuron value of 0.41. Then, it changed the trend into tool breakage (CFT 6; 0.87) with an immediate reduction of the feed rate to 0% (
Figure 6h) and activation of luminous indicator for tool breakage. The machining process was stopped.
The following system performance is determined from the results of the experiment:
The system correctly identifies tool damage within 2 ms;
The system stops the process within 35 ms after the identified tool damage;
The time between the tool breakage detection and the feed stop of the machining process depends on the signal processing time (2 ms), the signal delivery time to the cloud (minimum 1 ms), the tool status identification time (2 ms), the time to transmit the cloud correction command back to the local terminal (minimum 1 ms), signal transmission time from the terminal to the CNC controller (maximum 1 ms) and time to stop the feed drive (25 ms);
Previous pre-processing of signals on the communication and data acquisition terminal increased the speed of data transfer on the internet network, which allowed the successful and continuous execution of analyses in applications on the cloud;
The system successfully identifies a step increase in the axial depth of milling and, after 2 ms, triggers the process of reducing the load on the cutting edge by decreasing the feed rate. Therefore, the ANN is efficiently employed for the timely identification of the cutting force trend;
The system successfully identifies the linear increase of the axial milling depth and warns the machine operator with the indicator on the monitoring window;
The system identifies the exceeded maximum allowable cutting force on the tool and triggers a feed rate reduction;
The system manages to ensure a constant chip cross-section and thus a constant tool load by adjusting the feed rate in the range of 670 to 860 mm/min;
Identification of tool breakage with the ANN in the form of cloud internet service proved to be reliable;
The cutting chip size proved to be a suitable indicator for determining the condition of the cutting tool;
The proposed TCM can be used for dry machining only;
In addition, continuous applications monitor machine tools and look for ways to improve TCM system concepts.
In the experiment, it is shown that the cloud monitoring application can monitor the tool’s condition by identifying the trend of the cutting force and can protect the tool against excessive loadings. In addition, sensor data collected by the monitoring system, information about tool damage and emergency machine stoppages are jointly accessible on the cloud to search for samples and prepare analytical methods allowing the elaboration of recommendations to technologists for ordering the required number of tools for a specific machining process. Furthermore, the cloud concept of a monitoring system with geographically distributed and parallel implementation of analytical methods strongly reduces data processing times, which was of critical importance for more efficient execution of on-line tool condition monitoring.
Evaluation of the ANN for the Recognition of Cutting Force Trends
The performance of the ANN for the recognition of cutting force trends was evaluated using a confusion matrix. The confusion matrix shows the classification of 102 cutting force trends into 6 classes according to the actual real-time machining data and according to the ANN prediction. Each class represents one cutting force trend. Classes 1 to 6 represent the following cutting force trends: normal cut, ramp cut, A
D step change, corner cut, hard inclusion and tool breakage (
Figure 1). In the matrix, the actual values (real-time machining data) are written in rows, and the values specified by the ANN model are in the columns. In the matrix, a cutting force trend symbol is added to the name of each class.
The correct classifications lie on the diagonal of the matrix, and the incorrect classifications lie outside the diagonal. The evaluation of the results is reported in
Table 1.
Table 1 shows the confusion matrix for a six-class classification problem.
The ANN learned to recognize various cutting force trends successfully and achieved a macro average classification accuracy for all 6 classes (102 classifications) of 85.29%. The number of correct classifications was 87. The best recall was reached for class 5 (100%), and the best precision was reached for class 6 (tool breakage). The ANN successfully recognized all four occurrences of tool breakage, which is a fundamental advantage. The ANN made the most mistakes in classifying the trend of cutting force step change (class 3). The macro-average F1 score measure and the average recall of the ANN model are 85.90% and 85.54%, respectively.
The classification results are highly useful for the tool condition monitoring process in milling. These results show a very promising opportunity for automatic tool condition monitoring in milling processes.
The results were compared with a study conducted by Wu et al. [
33]. They used a classical camera and a convolutional neural network (CNN) for automatic cutting tool wear and tool breakage determination. The achieved accuracy was 96.20%. Our system presented in this article turned out to be less effective (worse accuracy) but faster, simpler and more practical to use. Therefore, the special interest of future activities is to improve the efficiency of the proposed system.
4. Conclusions
This article presents the structure of a novel cloud-based system for on-line monitoring of tool conditions in end milling. The system is carried out by connecting the IoT platform for tool condition monitoring (TCM) in the cloud to a machine tool with an integrated optical system, and this represents the novelty of this research. The optical system is employed to acquire and transfer the signals of the cutting chip size to the IoT platform, where analytical tools and artificial neural networks are used to perform TCM and process adaptation.
The novelty of the approach presented here is the combination of the cloud-based platform, the IoT applications, the detection of the size of the optical cutting chips and the neural network-based ability to identify cutting force trends to produce a cloud-based tool condition monitoring system. In addition, the novelty of this research is the use of current chip surface size as an indicator for the determination of the cutting tool’s condition.
The research objective was to develop an ANN to identify the six typical and most frequent flows of cutting force. The real-time machining data were used to train, test and validate the ANN. The results show that the ANN learned to recognize six cutting force trends successfully and achieved a macro average classification accuracy of 85.29%. Although the classification accuracy of the ANN is lower than the CNN for automatic cutting tool wear and tool breakage determination (96.20%) developed by Wu et al. [
33], the training time and classification time are shorter with lower hardware consumption.
The second research objective was to practically demonstrate that the proposed cloud-based monitoring system is feasible and could be implemented to monitor tool conditions during the end milling operation. A machining test was performed to verify the feasibility of the monitoring system. The experimental results demonstrate that the proposed monitoring system successfully monitors the cutting tool condition, reliably detects tool breakage, and protects the tool against overload by adapting process parameters. Momentary process stopping after the identification of tool breakage was executed within 35 ms. Process corrections were started in less than 3 ms and completed within 135 ms after identifying an excessive tool load. The TCM performs a tool status diagnosis every 2 ms.
The practical significance of the research is that it provides a developed prototype for fast tool condition monitoring, which ensures savings, improves machining efficiency, enables feed rate optimization, prevents tool damage, prolongs tool life, enables data visualization with analyses, allows remote real-time process monitoring on mobile devices, and enables cloud-based decision-making support with advanced human-machine interactions.
The main advantage of the cloud monitoring system is the ability to centrally store large amounts of real-time machining data and the ability to centrally analyze, visualize and remotely access this data from mobile devices. The advantage of this system is also the reduction of investment costs in the development phase of the monitoring system due to the replacement of an expensive and impractically located cutting force dynamometer with a cheaper optical system.
Future activities will be carried out to evolve transmissible TCM services that will be remotely accessible through the web. In the future, more machining tests with different tool-workpiece pairs must be performed to validate the proposed TCM. The special interest of future activities will be to connect the cloud-based TCM system with the IoT platforms for surface roughness monitoring and energy consumption monitoring in order to modernize machine tool workshops in terms of increasing energy efficiency. The extension of TCM services to other machine tools will enable centralized simultaneous monitoring of all processes in the workshop. Moreover, future activities will be carried out to upgrade the IoT application for process correction by including a computational intelligence algorithm, such as the earthworm optimization algorithm (EWA) [
43], elephant herding optimization (EHO) [
44], moth search (MS) algorithm [
45], slime mould algorithm (SMO) [
46], Hunger Games search (HGS) [
47], Runge–Kutta (RUN) optimizer [
48], colony predation algorithm (CPA) [
49], or Harris hawks optimization (HHO) [
50].
The developed monitoring system with the capacity to detect cutting chip size and identify cutting force trends provides a new method for TCM monitoring to be carried out through cloud technologies.


