1. Introduction
Material handling is the activity of moving, storing, protecting, and controlling materials inside a facility and is more popularly known as internal logistics [
1]. The storage and retrieval of materials can take place during the manufacture, distribution, consumption, and disposal phases. A major component of the warehouse system is the automated storage and retrieval system (AS/RS). AS/RS technology has undergone many advancements since its first appearance last century. Computerized (AS/RSs) are material handling systems that can store and/or retrieve loads automatically from a pre-defined storage/retrieval location [
2]. In the literature, different definitions can be found. According to [
3], the term AS/RS refers to a storage system that uses fixed-path storage and retrieval machines running on one or more rails between fixed arrays of storage racks. Currently, logistics companies use them extensively to streamline processes and improve production efficiencies [
4].
1.1. Crane Based Mini-Load AS/RS
AS/RS technology has advanced dramatically since the 1950s. There are many types of AS/R systems, categorized according to their options. This article is particularly interested in crane-based mini-load AS/RS. Typically, these systems consist of the following main components illustrated in
Figure 1, which are designed to handle parts that are often loaded into totes:
A, and B: staker Cranes and carriage are moving in both directions (x, y) simultaneously.
C: an input/output point or station (I/O-point) is a location where retrieved loads are deposited, and where incoming loads are picked up for storage.
D, E, F, and G: rack dimentions (Length, Hight, and width) for maintaining unit loads (e.g., tote boxes).
H: aisles in which cranes can move.
I, J, and K: storage location (row and bay).
L: Width of AS/RS.
1.2. Controlling and Managing Stacker Crane Transactions
A stacker crane control is a program that controls the servomotors of the stacker crane in response to orders for storing and retrieving. Therefore, it is essential to have a warehouse management system in order to operate and control the stacker crane. Warehouse management systems (WMSs) are software applications that control all the processes of the warehouse, including the flow of materials and the availability of resources. In the WMS, the stacker crane control is also responsible for transmitting updated data to the database in order to keep the database up to date. In addition, it announces that certain orders will be handled by them. Essentially, the concept begins at the intersection between “stacker crane buffers” and “stacker crane”. It is assumed that there is a buffer from which the stacker crane can take new loads to be stored, and there is another buffer in which retrieved loads are deposited. In addition, the systems provide real-time information on bin utilization so that stocks can be directed and optimized. In order to efficiently monitor product flow, auto ID data capture (AIDC) technology, such as barcode scanners, mobile computers, wireless LANs (local area networks), and possibly radio-frequency identification (RFID) is used.
1.3. AS/RS Performance Metrics and Storage Policies
Several factors affect the performance of the storage system, including storage capacity (i.e., initial rack utilization), storage policies, level of automation, and others. In the past several years, a variety of studies have been conducted concerning storage assignments (policies). The storage policies can be configured for randomized storage, class-based storage, and dedicated storage [
5]. The storage policy of assigning arriving unit loads randomly to open storage locations in a warehouse is called randomly assigned storage (RAN) [
6]. On the other hand, class-based storage divides items into several groups, typically according to their turnover rates. Then, a set of storage locations is assigned to each group [
7], where the storage policy of assigning the arriving units to a dedicated location or fixed slots is called dedicated storage [
7].
The dwell-point in an AS/RS has long been the subject of many research studies. For instance, [
8] defines the dwell-point as the point where the stacker crane will stay when idle (i.e., no storage or retrieval orders to perform). By selecting the dwell-point appropriately, the expected travel time to the first transaction after the idle period (currently unconfirmed) is minimized [
9]. To determine the optimal pick tour, [
10] developed an efficient dynamic programming algorithm that calculates the shortest travel distance between a set of pick locations.
The warehouse management system manages the orders of upcoming transactions as well as provides data about the confirmed and the expected storage and retrieval orders. The upcoming storage and/or retrieval requests can be managed and classified according to the stacker crane’s operating mode. In most traditional AS/RS, the operating mode is divided into main two categories: dual command cycle (DCC) and single command cycle (SCC). During the entire dual command cycle, storage and retrieval are performed following each other in one route to reduce the distance traveled and, consequently, reduce the transaction time. As an alternative, the single command cycle concerns only one transaction per route, either storage or retrieval.
Figure 2 illustrates the three operation modes of AS/RS.
1.4. Simulation Based Efficient Optimisation
Materials handling systems are considered a non-added value; this includes storage and retrieval systems. Numerous simulation studies have been conducted in order to reduce the expected operating costs associated with using these components as well as improve their efficiencies by reducing the stacker cranes
’ travel time, which is considered to be one of the main warehouse performance indicators. The performance of a storage and retrieval system at different dwell point’s strategies was modeled and measured by [
11]. Different storage policies and design parameters in simulations were tested by [
12] to better understand travel times using SCC. In order to evaluate the design and control rules of an AS/RS, several performance measures were reviewed [
3]. Therefore, this article suggests a reallocation methodology for evaluating the performance of the stacker crane machine when the machine is idle. Based on single and dual command cycle times and two different policies for assigning storage space (e.g., random and class-based), this algorithm was derived. The effects of the reallocation method will be evaluated through simulation.
1.5. Problem Statement
In this article, we described the AS/RS operating mode as well as its basic components. Due to the limitations inherent in their mechanical design and associated control architecture, stacker cranes have reached their maximum performance [
2]. Consequently, many researchers have tried to develop algorithms that apply different storage policies to optimize the service time, thus improving the system efficiency [
12,
13,
14,
15]. Others have tried to develop the system operating mode using the concept of a dwell point, where the stacker crane would stop when no new orders are available [
16,
17]. To the best of the author’s knowledge, there are no research articles on reallocating tote bins when storage or retrieval orders are not needed.
The purpose of this paper is to present an algorithm to control the movement of a stacker crane in an automatic small-parts warehouse (mini-loads). With this algorithm, orders will be processed at a fast and efficient pace by combining storage and retrieval requests intelligently. This includes mechanisms that regulate the execution of all combinations of orders. Initially, the tote bins are arranged randomly in the ABC zones. Storage is performed for the closest empty storage compartments (locations) to the I/O station. In the first step of the preparation process, the algorithm checks if each compartment should be evacuated based on certain conditions. Based on the expected retrieving orders, some of the far tote bins are moved closer to the I/O station in the second step. By using the first-come-first-serve (FCFS) rule, this can be accomplished.
2. Methodology
The system used was a stacker crane. The methodology of this study depends on simulation using R software of the AS/RS system. This software is free and is flexible for manipulating the model. More information about the open-source software can be found in R Core Team [
18]. The simulation model will examine the effect of reallocating some tote bins in idle time of AS/RS on the service time during normal shift work. Both SCC and DCC are considered service time or cycle time in this study. Two reallocation steps are performed:
The first one is to make space for the coming storage orders near the I/O station. The expected retrieved tote bins are kept in their positions in this step.
The second step is the reallocation of the expected retrieved load units to be closer to the I/O station.
Storage/retrieval compartments in this paper are called storage keeping units (SKU) or cells. Simulation is done in several steps according to the flow chart drawn in
Figure 3. Method 1 defined in the block number 6.1 is when there is not any preparation before the working shift. On the other hand, method 2 (block number 6.2) and the later blocks until the block with the number 6.2.4 are for the case in which there is the two-step method proposed in this study. The last step with the number 8 is performed to make the comparison between the two methods more solid by having more trials of simulation with more possible random initial locations of storage. The input parameters are as follows:
Initial rack utilization UR
Rack dimensions (number of horizontal cells (L), number of vertical cells (H), cell length (l), cell height (h)). SKUs’ length and height contain unit load dimensions plus allowance designed into each storage compartment to provide clearance. The total number of SKUs is HL.
Number of transactions (T). For each DCC, there are two transactions, and there is one transaction for each SCC, either storage or retrieval.
Stacker–crane horizontal speed (vh) and vertical speed (vv)
Pickup-and-deposit time (loading/unloading time) (Tpd)
Storage retrieval percentages (to determine the number of storage orders (S), retrieval orders (R), dual cycle orders (DC))
ABC allocation (Rack is divided into three zones, (i.e., class based) and the coming orders are classified based on their turnover A, B or C class)
Storage retrieval time utilization (Usr) (e.g., Stacker crane is 90% in use and 10% waiting for coming orders)
Far cells: when the cell is considered far from the dwell point, the load in it can move to a closer position in step 2. Cells are numbered from the closest to the dwell point to the furthest from the dwell point.
Table 1 shows the initial values of these parameters. Single and dual command cycle times are calculated as follows based on [
17]:
where
xj and
yj are the Cartesian locations for the cell and the small letters l and h are the cell length and height as previously defined. The idea here is to divide the total traveled distance by the lift crane in two directions (to the cell and from the cell) by the speed. Since the horizontal speed is faster than the vertical one, the minimum time should be considered. This is why it is possible to find several adjacent cells with the same service time. The loading and unloading times are considered in the second part of the equation. DCC time can be found using the following equation
where
xj1 and
yi1 are the Cartesian locations for the storage cell and
xj2 and
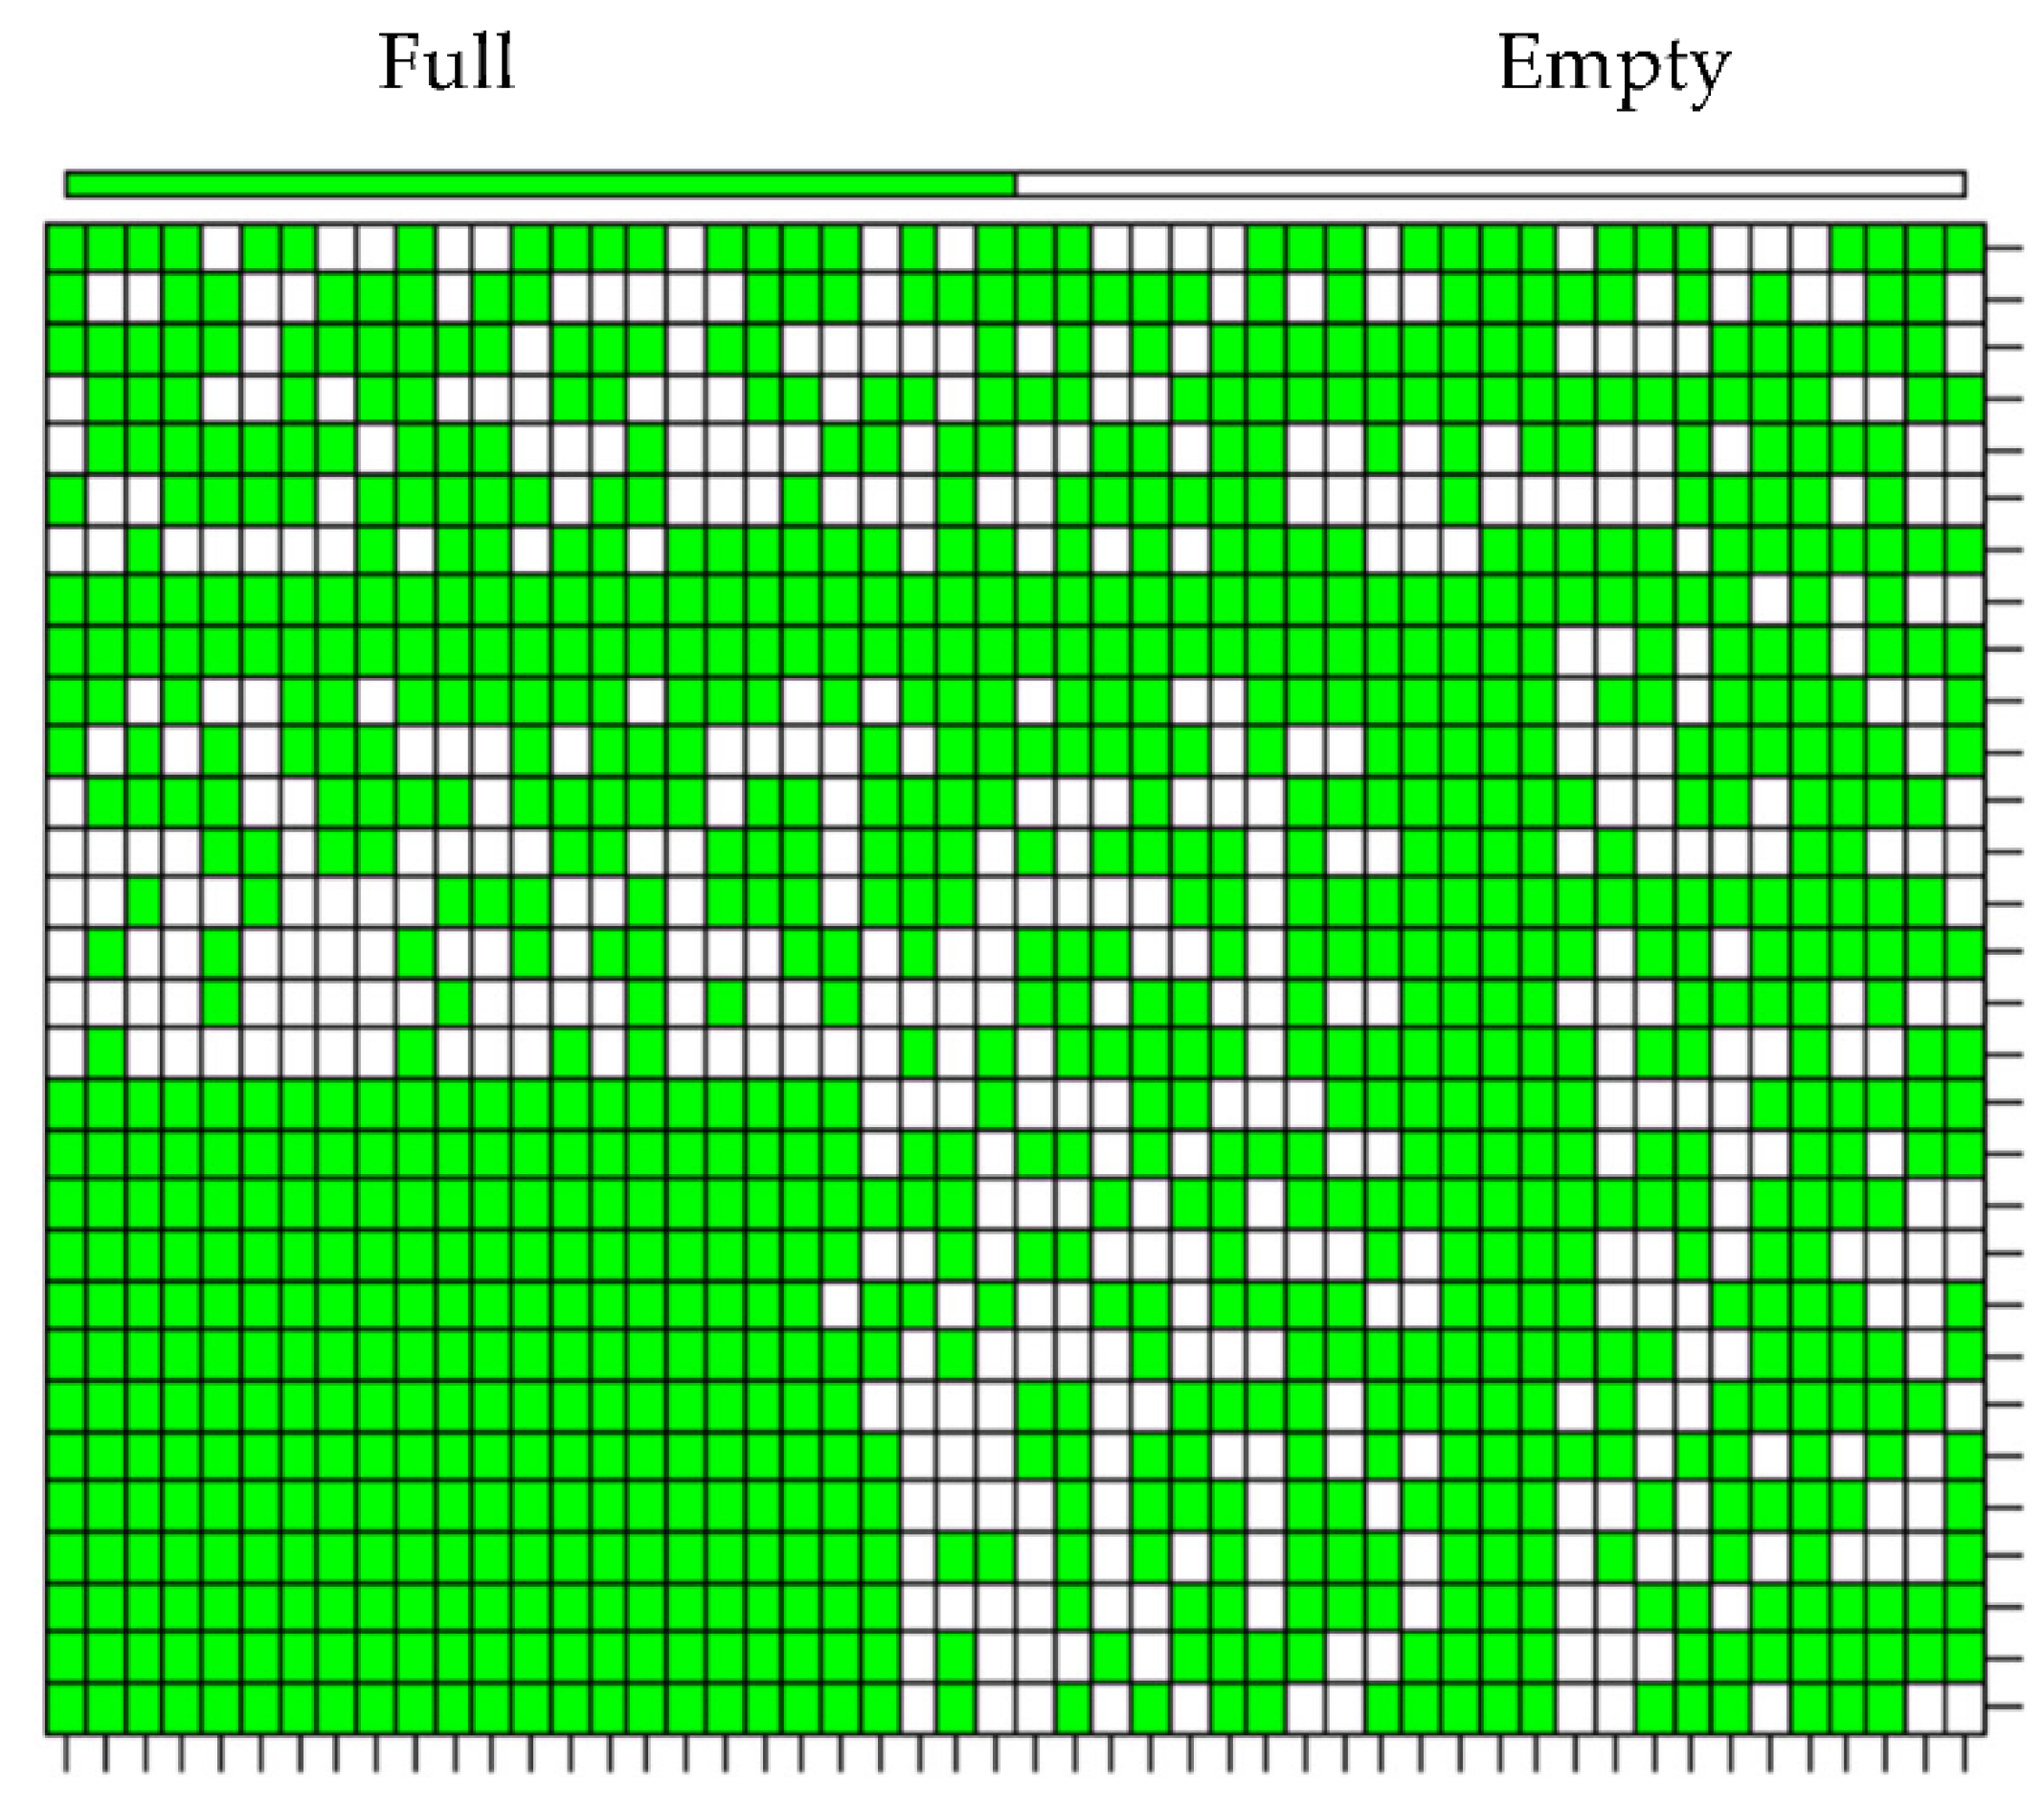
yi2 are the Cartesian locations for the retrieval cell. The loading and unloading movements in the case of DCC are four: two for the storage order and two for the retrieval order. An example for initial allocation of full and empty cells can be found in
Figure 4. It also shows the ABC allocation based on the input parameters and Equation (1). For step 1, the empty space size near to dwell point was determined in this paper to be as follows:
The size of the empty space should be enough for the moved retrieval loads in step 2, plus the coming storage orders. Since both of the order types occur randomly, retrieval can be done in a cell, and then storage can be done on the same cell. This size was found using try and error. However, future research can find the optimal empty space. Initially, the tote bins that need to be served later are kept in their SKUs (in step one). The evacuation process is limited to parts of the highest turnover area (class A). The movement is only done if the new suggested cell position is considerably further than the current position. To illustrate that,
Figure 5 shows a part of the rack with cell numbers and travel durations. These numbers are from the lowest service time to the longest service time. In other words, the cell next to the dwell point (0, 0) has the number 1, and the farthest cell is with the maximum number. The shaded part in the left-hand side is magnified in the right-hand side of the figure. The arrow is to show that. Thus, all the figure on the right side is just a small part of the figure on the left side. The service time found using Equation (1) is written inside the parentheses. There are some adjacent cells with the same service time. According to Equation (1), for instance, the adjacent cells with numbers 19 to 24 have the same travel time to the I/O station. Therefore, relocating tote bins within this group of cells is not useful during the preparation period. The average number of cells with the same travel time (ANCST) can be determined using Formula (4)
This formula was developed by the authors. The nominator is used to find the total number of cells in the rack, and the denominator is used to find how many times there is a change in the service time. The distance between the SKUs that need to be evacuated and the new storage locations should be double the ANCST to prevent movement without impacting the throughput time. Reallocations should only be made if they save a substantial amount of time as measured by the difference in the cell numbers.
The step 1 preparation time can be measured using Equation (2) in the same way of measuring DCC service time. The assumption is that every movement starts from the I/O station. However, in the case where the dwell point is the last position of the previous movement, a new Equation must be applied:
where
xj1 and
yj1 are the coordinates for the cell needed to be evacuated, and
xj2 and
yj2 are the coordinates for the suggested cell to receive the tote bin.
x(j−1)2 and
y(j−1)2 are the coordinates for the last step for the previous movement.
There are two reasons why the first preparation step alone is not enough to reduce time, which are:
A large percentage of demand is for storage, which is not directly affected.
A considerable percentage of time is for loading/unloading, which is not changed.
To find possible new locations for step 2 for the needed loads, some conditions must hold. For example, the movement should be for an empty cell with a lower cell number (with shorter service time) by at least ANCST. Some cells are excluded to keep some empty spaces for the storage orders. The number of empty spaces was found using trial and error. Future research can find the optimal number of empty spaces and their locations. In this paper, any cell with a number divisible by 4 was excluded.
The following assumptions are:
Some of the loaded bins to the AS/RS in a day can be loaded later from the AS/RS in the same day
Simulation is for one aisle
Single depth system
There is enough idle time for reallocation
The crane moves only one-unit load at a time
The start for any movement is from the dwell point (0, 0)
The demand for the next few hours is known
The initial assignment of the bins is random.
The ASRS is sorted in ABC form
Storage is usually done into the closest cells, or randomly if needed
The closest cell is recognized by time
3. Results and Analysis
The initial results for the case without initial reallocation are summarized in
Table 2, and storage locations is shown in
Figure 6 when SCC plus DCC = 600. In this case, the storage is assumed to be to the closest possible cell according to the FCFS principle. The total time is less than 3 h. The number of SCC and DCC is based on a random setting. Therefore, DCC is not exactly 50%. In the middle of the figure, the density of the loads is lower, because storage is assumed to be done for the closest cells. Then after the low-density area comes the B area.
Figure 7 shows the orders expected to be retrieved before the start of the working shift, after step 1, and after step 2. A considerable number of the existing bins is expected to be retrieved in the next few hours. Such bins are not affected in the first step in which non-needed bins are moved away from the area close to the dwell point to make some space for the movement in step 2. Expected retrieved bins are moved in step 2 to the area close to the dwell point, even if they are not classified as A-items. The effect of that on the new locations for A, B, and C items is shown in
Figure 8. At the first step, space is made by moving the non-needed A bins to a further place.
The percentage of expected retrieval currently available is about 77%. The rest come later during the work shift. In other words, about 23% of the retrievals come at first during the shift, then they are needed during the same shift in a later time. The first step took 0.6 h and the second one took 1.18 h.
Table 3 shows the results for the two steps.
The times in
Table 3 were calculated assuming that the initial position of each movement must be the dwell point. However, if this assumption was relieved then, with Equation (5), shorter times are obtained. The first step preparation time will 0.49 min, and the second step preparation time will be 0.85 min. The results after doing storage and retrieval during the working shift are shown in
Table 4, and storage locations are shown in
Figure 9.
The results in
Figure 9 assume that the utilization is still the same after using the reallocation strategy. This means that the system will compress the time between arrivals to keep the utilization of the process to be the same. If this assumption is relieved and the orders arrival times are kept the same, the new utilization is about 81%. Therefore, in this case, the savings are not only in the service time but also in the waiting time of orders. This waiting time can be estimated if the nature of the distribution of service time is known.
Figure 10 shows the effect of the preparation process on the service time in another run of the simulation model. There is a difference in the average service time per order of about 0.03 min. This accounts for about 12% reduction in the average service time. Using queueing theory modeling [
19], to get the utilization of 90% in the initial case, the inter-arrival time must be about 0.29 min. In this case, the average waiting time per order will be 1.25 min. If the inter-arrival time of 0.29 min is kept in method 2, then the waiting time per order will be 0.49 min. Therefore, when the number of orders is 600, the total waiting time of all orders for method 1 is 750 min, and the total waiting time for method 2 is about 294 min.
In
Figure 9, compared to the time invested for the preparation process, the savings in-service time is less than the extra-added time of the preparation process (step one and step two). However, since the preparation time is in the period before the working shift starts, this preparation time does not waste any time during the shift. The percentage of total time reduction is 9.88% (from 2.61 h in
Figure 6 to 2.36 h in
Figure 9). This percentage is the same percentage obtained when a comparison is made between the average service time in method 1 and the average service time in method 2. This percentage is higher if the number of orders is lower.
Figure 11 shows the comparison between the total service time for the order groups, where each group is 50 orders. Since the number of orders is 600, there are 12 groups of orders. Savings are higher for the first groups, since the number of expected retrieval loads initially found in preparation is higher at the beginning of the working shift; it then starts to decrease with time.
To check the general effect of the preparation process on the savings of service time,
Table 5 shows the results. The number of replications is 5 for each scenario, and the shown values are the averages. There is no need for a larger number of replications because the difference among the results of replications were not big. The table shows different scenarios for shape of the rack and the number of orders. The preparation time was calculated in the model based on Equation (5).
Sometimes, the available time for preparation before the shift starts is short (for example around one hour for scenario 3 and one and half-hours for scenario 4). A possible way to reduce the preparation time is to consider that far cells are those with numbers greater than or equal to a number larger than the default value or 300 (for step 2). For step 1, a decrease in the value of number of SKUs to be evacuated can help to reduce preparation time. For example, far cells are considered to be those cells with numbers of at least 500. Moreover, a reduction of 50% of the number of evacuated SKUs found in Equation (3) can be selected. Based on that, the preparation times for the third and fourth scenarios were found to be as in
Table 6. Compared to
Table 5, the preparation time is less, but the savings are also less. However, the reduction in savings is not severe. This is because most of the savings in the service times come from the far movements. For example, the movement of a tote bin from the cell with the number of 600 to a closer cell to the I/O station is expected to save more service time than moving the tote bin in the cell with the number of 350 to a closer position to the I/O station. The optimal selection for the preparation-time reduction parameters can be investigated in future research.
To generalize the results,
Table 7 shows the effect of reductions in service time per order on the savings of total time per order (waiting time plus service time). Waiting time occurs because there is only one stacker crane to move the tote bins, and when the order comes, the stacker crane will usually be busy satisfying other previous orders. The parameters
Wq and
W are the expected time in the queue and the expected total time in the system, respectively. The initial service time was taken from
Figure 10 (0.26 min). The original utilization was 90%. The inter-arrival time was chosen to be 3.46 per min (1/(average service time/utilization) = 1/(0.26/0.9)). In this case,
Wq and
W are 1.249 min and 1.509, respectively. Any reduction in service time will lead to savings in W. Such savings are much larger than the preparation time per order. Even if the total preparation time is 2 h, the preparation time per order (when there are 600 order) is about 0.2 min, which is much lower than the reduction in total time per order.
Generally, the results of this study give an indication for decision-makers to consider reducing service time using the reallocation prior to the work shift. More savings are expected when the number of orders is not very large. In other words, savings are significant in the first few hours of the shift. Moreover, the shape of the rack affects the results. Higher racks can save larger percentages of service time. The study opens the door for future contributions in this regard, such as finding the optimal number of SKUs to be evacuated. In the case where the objective is to reduce the peak level of energy consumption during the shift, the reallocation strategy can be helpful, since it reduces the utilization and traveled distance by the stacker crane. During the preparation process, the energy consumption is increased; however, the total facility consumption of energy before the working shift starts is usually low because there are no other tasks to be done.


