Article

Determination of Cross-Directional and Cross-Wall Variations of Passive Biaxial Mechanical Properties of Rat Myocardia

1
Unisa Biomedical Engineering Research Group, Department of Mechanical Engineering, School of Engineering, College of Science Engineering and Technology, University of South Africa, Pretoria 0001, South Africa
2
Defence and Security, Council for Scientific and Industrial Research (CSIR), Pretoria 0001, South Africa
3
Cardiovascular Research Unit, Department of Surgery, University of Cape Town, Observatory 7925, South Africa
4
Department of Human Biology, Division of Biomedical Engineering, University of Cape Town, Cape Town 7925, South Africa
5
Centre for High Performance Computing, Rosebank 7700, South Africa
6
Bioengineering Science Research Group, Engineering Sciences, Faculty of Engineering and the Environment, University of Southampton, Southampton SO17 1BJ, UK
*
Author to whom correspondence should be addressed.
Processes 2022, 10(4), 629; https://doi.org/10.3390/pr10040629
Submission received: 11 February 2022 / Revised: 7 March 2022 / Accepted: 11 March 2022 / Published: 24 March 2022
(This article belongs to the Special Issue Mechanics of Biological Tissues and Biomaterials)

Abstract

:
Heart myocardia are critical to the facilitation of heart pumping and blood circulating around the body. The biaxial mechanical testing of the left ventricle (LV) has been extensively utilised to build the computational model of the whole heart with little importance given to the unique mechanical properties of the right ventricle (RV) and cardiac septum (SPW). Most of those studies focussed on the LV of the heart and then applied the obtained characteristics with a few modifications to the right side of the heart. However, the assumption that the LV characteristics applies to the RV has been contested over time with the realisation that the right side of the heart possesses its own unique mechanical properties that are widely distinct from that of the left side of the heart. This paper evaluates the passive mechanical property differences in the three main walls of the rat heart based on biaxial tensile test data. Fifteen mature Wistar rats weighing 225 ± 25 g were euthanised by inhalation of 5% halothane. The hearts were excised after which all the top chambers comprising the two atria, pulmonary and vena cava trunks, aorta, and valves were all dissected out. Then, 5 × 5 mm sections from the middle of each wall were carefully dissected with a surgical knife to avoid overly pre-straining the specimens. The specimens were subjected to tensile testing. The elastic moduli, peak stresses in the toe region and stresses at 40% strain, anisotropy indices, as well as the stored strain energy in the toe and linear region of up to 40% strain were used for statistical significance tests. The main findings of this study are: (1) LV and SPW tissues have relatively shorter toe regions of 10–15% strain as compared to RV tissue, whose toe region extends up to twice as much as that; (2) LV tissues have a higher strain energy storage in the linear region despite being lower in stiffness than the RV; and (3) the SPW has the highest strain energy storage along both directions, which might be directly related to its high level of anisotropy. These findings, though for a specific animal species at similar age and around the same body mass, emphasise the importance of the application of wall-specific material parameters to obtain accurate ventricular hyperelastic models. The findings further enhance our understanding of the desired mechanical behaviour of the different ventricle walls.

1. Introduction

Experimental testing remains the most common modality of obtaining the material properties of biological tissues [1,2,3,4,5,6] and other soft materials [7]; however, biaxial testing enables a more comprehensive understanding of these materials’ mechanical behaviour, which is also necessitated by the fact that heart muscle is spatially heterogenous. Li et al. [8] stated that the myocardium possesses a hierarchical structure that results in complex three-dimensional (3D) mechanical behaviour, forming a critical aspect of the function of the ventricle tissue. The physiological functioning of myocardial muscles involves a complex force pattern in which biaxial tensile and compressive forces during diastole and systole phases are combined with forces in the third dimension [8,9]. Therefore, it is important that the study of myocardial muscle behaviour be carried out along more than a single dimension. Some researchers [8,10] recommended the use of multiaxial analysis of cardiac tissue due to the intrinsic anisotropy and variation of myocyte fiber orientation and mechanical properties of myocardial tissues. It is stated that biaxial cardiac in vitro models can precisely represent the mechanobiological behaviour of cardiac tissue [11]. Besides, other studies [12] further recommended that, for cardiac tissue, constitutive modelling, more uniaxial or biaxial tensile tests, the identification of viscoelastic properties in various time scales, and the use of pressure–volume curves be carried out, and that there is need for correlating the passive biomechanical cardiac tissue properties with microstructural observations.
Previous studies have been conducted to understand the tissue mechanics of healthy myocardia [13] to assist in the advancement of heart-specific computational models [1,3,14,15,16,17,18] and development of new materials for use in diagnosing and treatment of coronary illnesses. This study is aimed at investigating cross-direction and cross-wall variations in infarcted rat myocardia. Despite many studies that show that the myocardium tissue is complex, nonlinear, anisotropic, and heterogeneous, not enough study has been conducted on the nature of these complexities across the heart’s three main walls, namely, the left ventricle (LV), cardiac septum (SPW), and the right ventricle (RV) [19]. In order to accurately bioengineer the heart muscle, it is essential that the passive mechanical behaviour of the real tissue of the entire heart be correctly understood and profiled. In addition, it is hard to accurately model the heart’s mechanical response without sufficiently understanding its walls’ mechanical properties, but those studies have been rare largely due to a lack of sufficient research on the right ventricle and soft tissues on the right side of the heart [20,21,22]. Kakaletsis [23] and Valdez-Jasso [24] reported that studies of the biomechanics of the right ventricle had been neglected despite having its own distinct mechanical anisotropy. Valdez-Jasso [24] further observed that the apex-to-outflow tract direction was consistent and exhibited increased mechanical stiffness. Besides, the myofiber and collagen fiber orientation were remarkably uniform throughout the entire thickness of the myocardium. The more muscular left ventricle has dominated most of the research on the heart due to its role in supplying blood to the entire body rather than that of the right ventricle, which merely supplies blood to the lungs. In the following, we highlight a few studies that have attempted to address different regions of the heart.
The mechanical properties data of the right ventricle free wall and its constitutive relationship were reported for the first time in the published literature in 1993 [25]. They studied regional differences by excising tissue specimens from the conus and sinus regions of mongrel dogs’ hearts. They found that the myocardium was more anisotropic in the conus direction with greater stiffness along the fiber direction. They further found that both anisotropy and fiber direction stiffness were greater in the RV than in the LV. Much later, Golob et al. [26] found that different regions of the heart exhibited differences in material properties due to different sarcomere lengths. They also added that the RV is embryonically, structurally, and functionally different from the LV, and further recommended that heart muscle research should, among other areas, focus on studies of tissues from different wall layers and ventricles in order to better understand its behaviour. Other works [27] observed the differences in material behaviour among all six regions of the heart valves with the central region exhibiting more anisotropy and being more extensible toward the annulus than the edge regions. The authors further pointed out that it is difficult to model the heart valves correctly with models that assume material homogeneity over different regions when it is known that they are spatially heterogeneous. At a functionally macroscopic scale, another study [23] has noted that the differences between the RV and LV myocardia are in terms of their stiffness in the fiber direction as well as the orientation and distribution of their fibers. Hill et al. [28] and Avazmohammadi et al. [29] found that pulmonary arterial hypertension exerts substantial pressure overload on the right ventricle free wall, which leads to myofiber hypertrophy and remodeling of its collagen fiber architecture. Hill et al. [28] further noted that the increased degree of anisotropy along the longitudinal direction resulted in increased longitudinal stiffness compared to circumferential stiffness.
This paper is a sequel to an earlier study on an investigation of regional dependencies on porcine myocardium [30], where it was reported that the material parameters obtained from fitting the Fung and Choi-Vito models to the myocardial biaxial tensile test data showed some regional dependencies. Therefore, in this study, we focus on examining the nature of these differences by conducting a single-factor analysis of variance on tissue elastic moduli (stiffness), precondition stress, and stress at 40% strain. These significance tests are specifically applied in cross-direction and cross-wall sense in order to detect both directional-dependent and regional-dependent variances.

2. Materials and Methods

2.1. Tissue Acquisition and Preparation

Fifteen (N = 15) Wistar rats (200–250 g) aged between 8 and 10 weeks [30] were euthanised by inhalation of 5% halothane. This is in accordance with animal welfare regulations in South Africa concerning animal sacrifice [31]. Once breathing and heartbeat had stopped, the heart was dissected out. The atria, pulmonary and vena cava trunks, the valves, and all soft tissues above the short axis of the heart were dissected away. The fresh rat hearts were then packaged in a temperature-controlled box maintained at between 0 °C to 6 °C and delivered for testing in less than 3 h. The outflow direction was marked as the longitudinal direction (0°), while that aligned with the heart wall’s shorter diameter was denoted as the circumferential direction. Full cross-sections measuring approximately 5 × 5 mm were dissected from three different walls of the heart, namely, the LV, SPW, and RV. Sharp and sterilised surgical knives were used during the dissection to avoid overly pre-straining the specimens [32,33]. The mechanical tests were then conducted immediately after receipt of the samples.

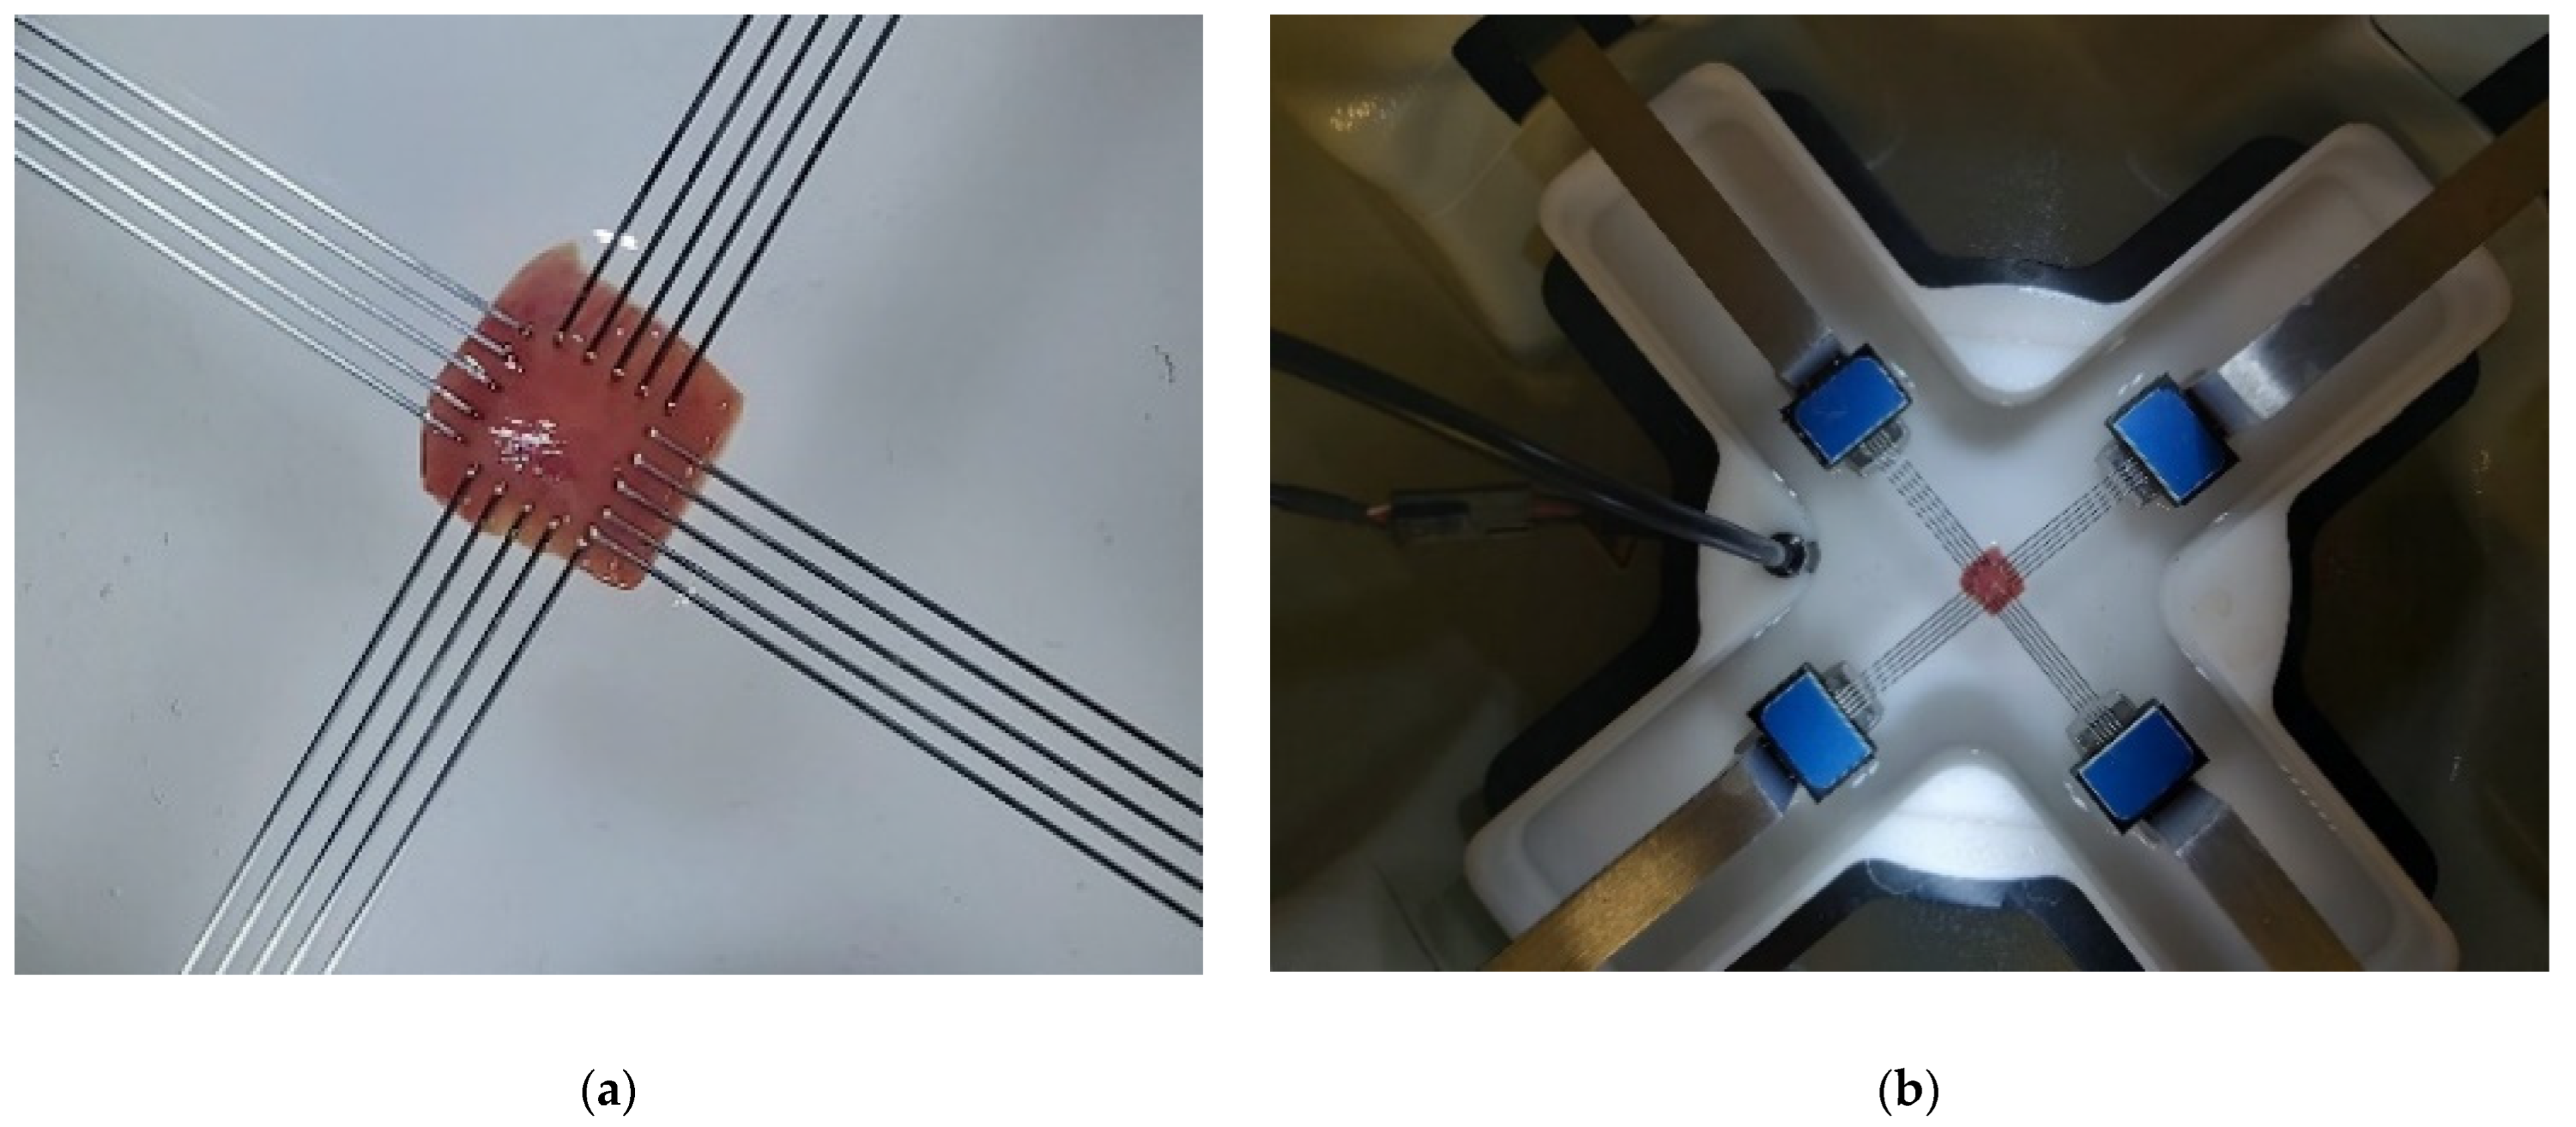
2.2. Biaxial Mechanical Testing

CellScale Biaxial testing system was used to measure the tensile response of all tissue samples. All prepared tissue samples were mounted in the custom biaxial tensile material testing apparatus (BioTester 5000 CellScalle, Wateroo, ON, Canada®) specifically designed for soft tissue mechanical testing. The BioTester 5000 biaxial system is installed with a unique system that uses rakes for piercing the tissue. In this test, the four rakes (see Figure 1) are utilised to clamp the tissue sample for biaxial tensile testing. A total of 15 samples were harvested from the LV, SPW, and RV and subjected to equi-biaxial tensile testing. The major dimensions such as length, width, and the thickness of each sample were measured using a Vernier caliper. To ensure the accuracy of the measurement, each dimension was measured four times, and average dimensions were then utilised for further processing. Before collecting data, the precondition was conducted by applying a 10% strain on the sample at a strain rate of 0.001/s. A preload of 5 mN was applied for 0.53 s. To maintain hydration and mimic the body temperature, saline 0.91% w/v of NaCl was placed in the bath, heated to 37 °C, and maintained for the duration of testing. Each sample was subjected to 40% biaxial strain in the fiber and cross-fiber direction simultaneously at a strain rate of 40% strain/5 s. The 40% strain was selected to be the physiological magnitude of rat heart.

2.3. Tissue Stress–Strain Analysis

In this study the stresses were calculated using the first Piola–Kirchoff stress T i j then converted into the Cauchy stress σ i j via the relationship [25,34]
σ i j = λ i T i j
where i   and   j denote tensorial indices (refer to Figure 2), which for practical purposes in this case may be interpreted as the two different directions; λ denotes the stretch ratio, λ i denotes the stretch ratio in the circumferential and longitudinal direction, and T i j = F i j / A i j where F is the normal force and A is the undeformed cross-sectional area. The finite strains in the two directions were determined as functions of the stretch ratio between deformed and undeformed lengths, which in this case are defined as the Lagrangian strain tensor:
E = 1 2 ( C I )
where C = [ λ i 2 0 0 λ j 2 ] denotes the Green–Cauchy deformation tensor, and I is the identity matrix.
It was assumed that there are no shear stresses on the outer edges of the specimen; therefore, only normal stresses are considered in this paper. The calculated stress results are cut-off at 40% strain (refer to Figure 2). These stress results, however, are noisy; therefore, they were further filtered with an 8-point moving average filter. The data were resampled and further smoothened using a quadratic filter.

2.4. Analysis of Variance

The statistical analysis involved the evaluation of the significance tests using one-way single factor variance in Excel on the tissues based on the variations of elastic moduli, toe-region upper limit stress (preconditioning stress), and the stresses at 40% strain between the two directions for each wall, with their cross-wall variations along a particular direction. The rationale behind the first set of significance testing is to establish any statistical significance in the variances between tissue behaviour in the two directions for each myocardial tissue while the second set of significance test were aimed at investigating any differences from one wall to another for the same direction.
In the analysis of variance, the significance of the differences between any two given sets of data containing elastic modulus values was evaluated. The statistic called the p-value is used to indicate levels of significance in the variances. In this study, the null hypothesis is such that the variance in the given two sets of data is statistically significant if the p-value is less than or equal to 0.05 [35].
The elastic moduli were determined from the elastic region for each heart wall being between 13 and 37% strain for the LV and SPW and between 24 and 37% strain for the RV; toe region peak stresses were picked at 12% strain for the LV and SPW and 24% strain for the RV. These investigations were conducted between the two different directions for all the three walls and between one wall and another for each of the two directions.

3. Experimental Results

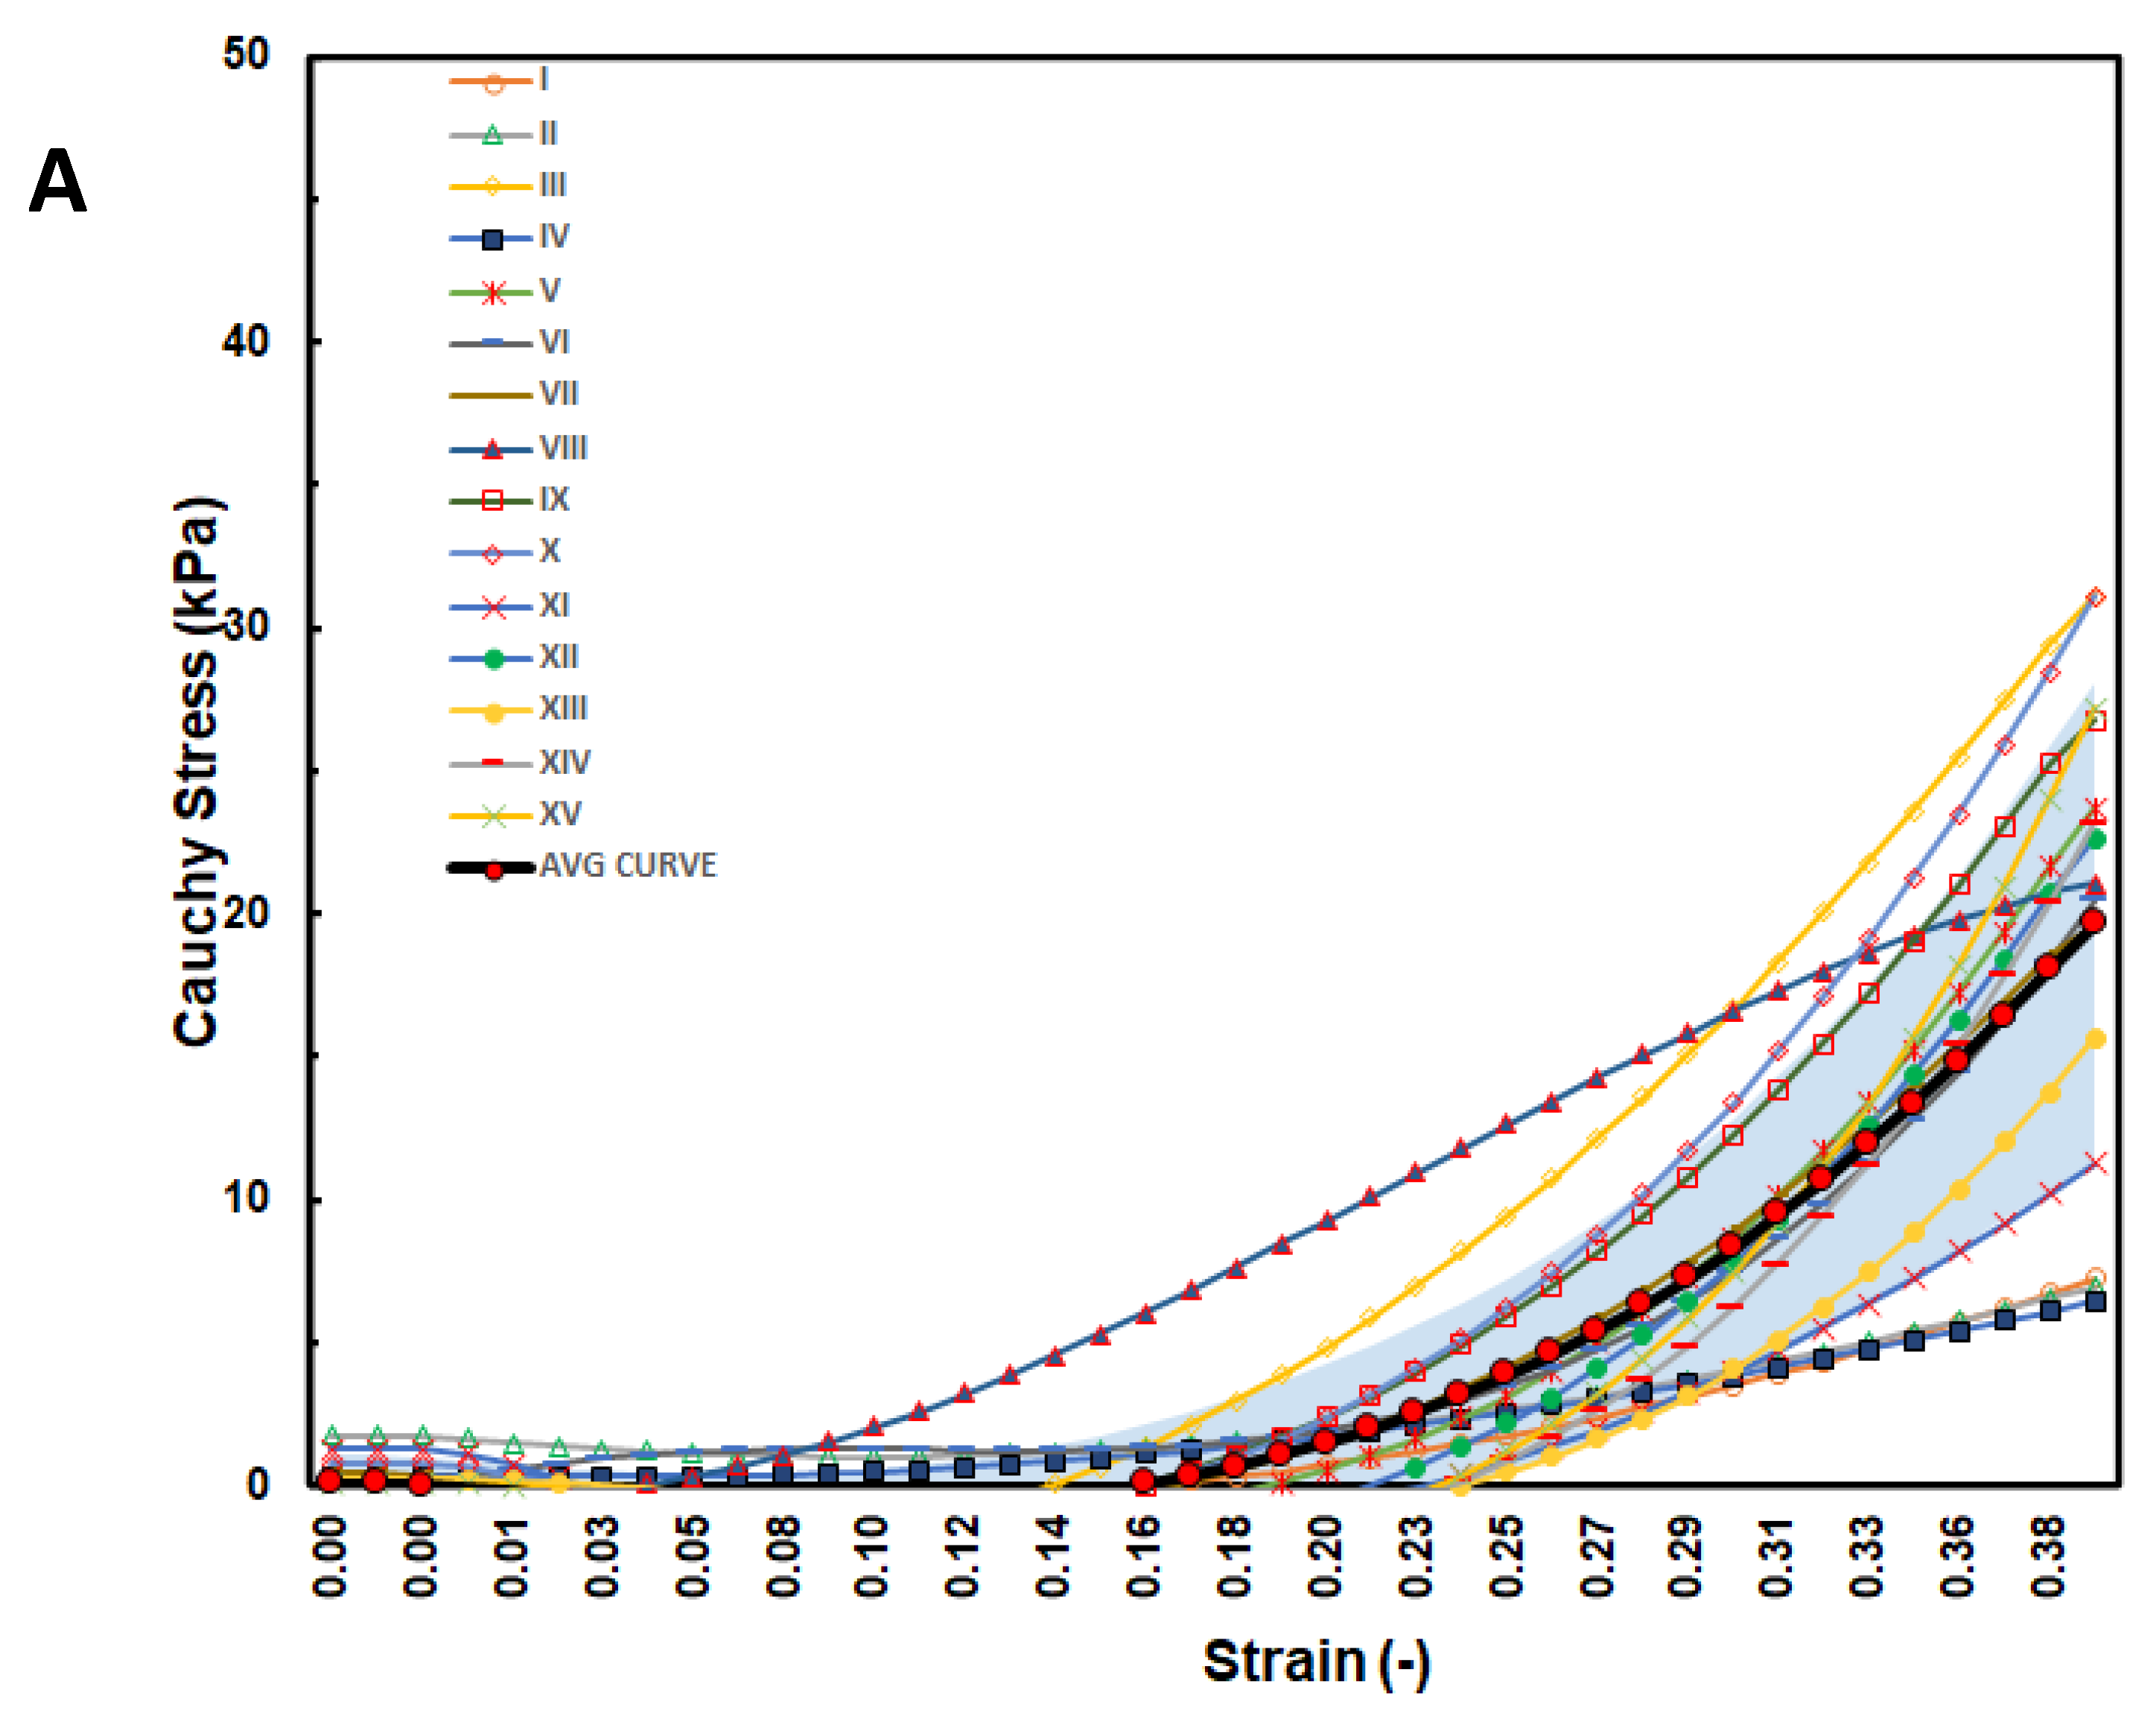
3.1. Stress–Strain Relationship

The stress–strain curves in Figure 3, Figure 4 and Figure 5 are overlayed with the standard deviation bounds to show how well the measured results lay within one-standard deviation bounds. Furthermore, average curves have been plotted over the same axes and for all the walls in both directions, and these curves lie mid-way. The stresses are plotted up to 40% strain in the longitudinal and circumferential directions for all three walls of the heart. There is a total of fifteen tests for each wall (Test I–XV). Though some of the stress–strain curves exhibit diminished toe regions probably due to differences in the preconditioning, the results show that the toe regions extend up to 12% strain for LV and SPW tissues and almost double as much for the RV. The plotted results show that the stress–strain curves divert away from the average curve upwards with increased strain within the linear region. Therefore, although almost all curves lie within the one-standard deviation margins, and about 30% lie outside those bounds in the upper ends of the linear region. Theoretically, it is expected that for normally distributed test data, 68% should be within the one-standard deviation bounds, which is in line with these test results [35]. This demonstrates the normality and quality of the test procedure in this study. There were not major differences in the test procedure from one test to another, and any differences might have arisen from unavoidable disturbances such as clamping conditions, temperature fluctuations during testing, differences in test times from the time of animal sacrifice, and different pre-strain histories [33,36].
To examine the exact trend of the stress–strain curves relative to the average curves, a standard error of the mean (SEM) was calculated and plotted in Figure 6. The SEM results also show that the errors from the average curve increase with increased strain in the linear region for both longitudinal and circumferential directions in all the three walls. Among the three walls, the largest SEM occurs in the RV wall. The circumferential direction consistently yields larger SEM than the longitudinal direction in all the three walls.

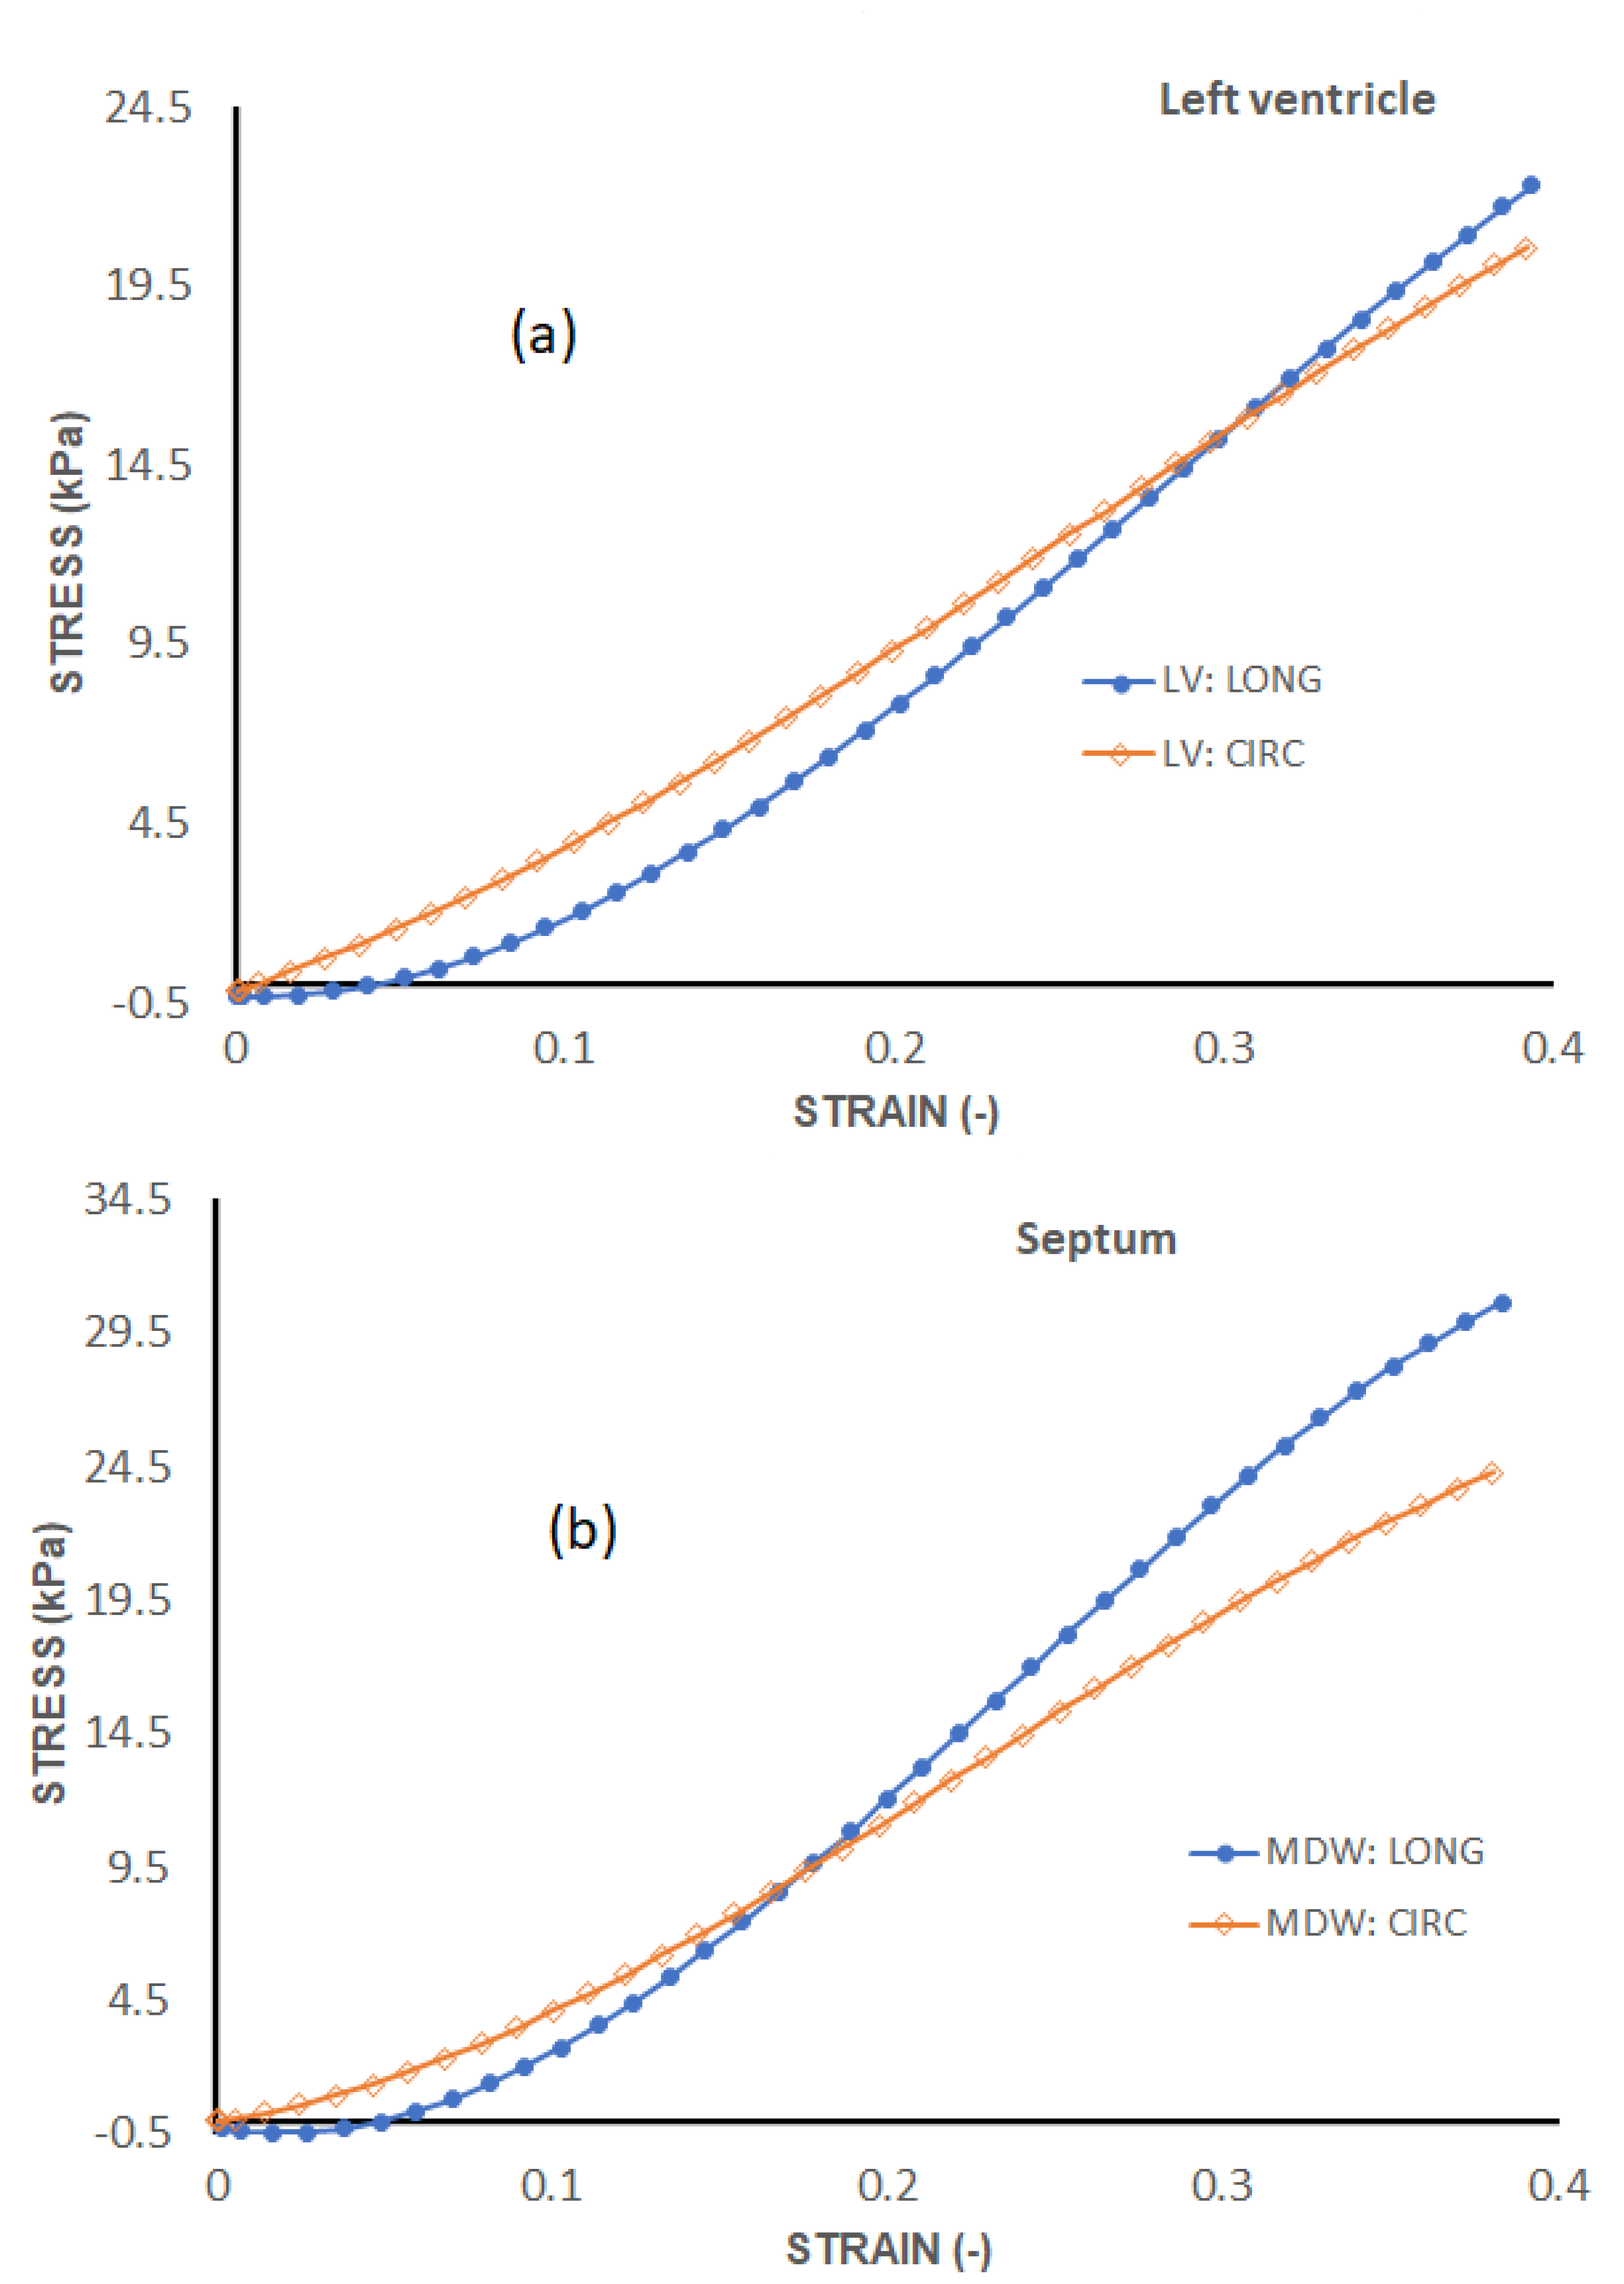
3.2. Cross-Directional Variation

Figure 7 shows the average stress–strain curves along the longitudinal and circumferential directions plotted on the same axes for each wall. For the LV and SPW, the tissues exhibit qualitatively similar trends between the longitudinal and circumferential directions. The tissues are on average more compliant along the longitudinal than the circumferential direction in the toe region. In the linear elastic phase, however, the tissues are stiffer along the longitudinal than the circumferential direction. The RV tissues do not show much difference in stiffness in the linear elastic phase. The toe region is much more elongated along the longitudinal than the circumferential direction in the RV tissue.
These differences are further qualitatively evaluated in this study by use of the single-factor analysis of variance. Table 1 summarises the results in terms of the cross-directional variation of elastic modulus, peak stress at toe region limit, and stress at 40% strain for each wall. The elastic modulus was determined from the linear elastic region for each heart wall specifically, from 12% to 37% strain for LV and SPW and between 24% and 37% strain for RV. The toe region peak stresses were those corresponding to 12% strain for LV and SPW and those corresponding to 24% strain for RV. The stresses at 40% strain were obtained from the closest strain level. It is assumed that for a displacement-controlled test such as the one used in this study, it makes more sense to monitor the differences in the peak stresses than in the strains. The peak stresses are therefore used to reveal some nuances in the differences in the material behaviour during the straining process.
The results show that the SPW of rat myocardium exhibits statistically significant variation in the elastic modulus between the longitudinal and circumferential directions. For the LV and RV, the variation is moderate, but the analyses of variance in the stresses yield significant variances in tissue responses at the toe region limit for the LV, and both at the toe region limit and at 40% strain for the RV.
Figure 8 shows indices of anisotropy, which are calculated by relating tissue elastic moduli in the longitudinal and circumferential directions for each test. The results show that the SPW has the highest anisotropy, averaged at around an index of 1.5. The LV and RV have average anisotropy indices of 1.3 and 0.9, respectively.

3.3. Cross-Wall Variation

The tissue behaviour in the linear region was different for all the three wall tissues. The elastic moduli for the three walls in the longitudinal and circumferential directions were 69 kPa and 58 kPa, respectively, for LV; 109 kPa and 77 kPa, respectively, for SPW; and 103 kPa and 129 kPa, respectively, for RV. In terms of stress values at 40% strain, the three tissue walls exhibited the following average values: 25 ± 7.5 kPa in longitudinal direction and 20 ± 5 kPa in circumferential direction for LV; 32 ± 7.5 kPa in longitudinal direction and 25 ± 5 kPa in circumferential direction for SPW; and 20 ± 7 kPa in longitudinal direction and 32 ± 10 kPa in circumferential direction for RV. These results show that the RV and SPW myocardial tissues in this study are stiffer than LV myocardial walls in both directions. The RV myocardial tissue is stiffest in the linear region in the circumferential direction. However, it is important to note that this is not the case in the toe region where the LV myocardial tissues are, on average, the stiffest in both directions.
Table 2 summarises the significance tests for cross-wall variations of elastic moduli, toe region peak stresses, and stress at 40% strain for each direction. For elastic moduli, the results show that the only non-significant differences occur between the SPW and RV along the longitudinal direction. All the other cross-wall relationships yield significant differences for the elastic moduli. The peak stress at the toe region does not yield any significant difference between the LV and RV along the longitudinal direction. The results in the table show that from one wall to another, the most significant differences occur along the circumferential direction. This shows that each wall of the rat heart has distinct mechanical properties since there is at least one parameter that is different from wall to wall.
Ratios of cross-wall elastic moduli for all tests are shown in Figure 9. The graphs clearly show that the heart walls are distinct from each other in either direction. There is no particular ratio that lies close to unity for all cross-wall relationships shown in the figure.

3.4. Stored Strain Energy

The passive response of the tissues can be linked to the amount of strain energy that can potentially be stored under load. In this study, the stored strain energy in the toe and linear regions along both directions were evaluated and are tabulated in Table 3. The stored strain energy is numerically calculated using the trapezoidal rule given by
U T = n = 1 N 1 1 2 ( σ i j n + 1 + σ i j n ) × ( ε i j n + 1 ε i j n )
where n is a sample point, and N is the total length of the measured data.
The results in Table 3 show that the SPW stores the largest amount of strain energy along both directions. Despite its higher stiffness and relatively long toe region, the RV myocardium does have the least amount of stored strain energy except along the circumferential direction in the toe region. The LV stores much higher strain energy than the RV in the linear region, which is beneficial when one considers its relatively higher pumping demands.

4. Discussion

The results show that the stress–strain curves divert much further away from the average curve for both longitudinal and circumferential directions in all walls of the rat heart. This trend is typical for many soft tissue test results [37]. It is, however, not clear what caused other specimens to exhibit trends that lie far away from the shaded regions in Figure 3, Figure 4 and Figure 5 or exhibit some earlier tissue softening than other specimens. It might be presumed that this could have been caused by some pre-treatment factors or tissue damage at the clamping points, which unfortunately were not immediately identified by the authors. The plotted SEM values demonstrate this diversion of the results with increased strain in the linear elastic phase. This is a cause for the difficulty with which myocardium tissue (or any soft tissue) behaviour can be estimated by any constitutive model. Another dimension to this problem is the difficulties in standardising stress–strain curves of the myocardial tissue across two different laboratory testing conditions. It is therefore almost impossible to apply model parameters obtained from tests conducted in one laboratory to those obtained in a different laboratory. Even for tests obtained within the same laboratory, it is only reasonable to correlate different tests by examining how well those different tests fall within acceptable error bounds as demonstrated in this study, possibly by examining how close the observed results are from the mean or average stress–strain curve. A similar argument may be pertinent in the application of constitutive or computational models for the prediction of stress–strain behaviour of myocardium tissue.
The results show that cross-directional variances in the elastic modulus are statistically significant in the SPW, moderately significant in the LV, and non-significant in the RV. Since the tested specimens were dissected from the middle section of each wall (about the sagittal plane), it might be interesting to investigate the nature of the variances in different regions of each wall especially towards the SPW. Studies on other soft tissues such as valves have shown that the anisotropy varies over different regions [27]. However, the p-value of 0.06 for the LV wall in this study may be interpreted differently with a slight adjustment to the confidence region. In terms of cross-wall variation in the elastic modulus, only the SPW-RV does not yield any statistically different results along the longitudinal direction.
The peak stresses in the toe region are extremely important, since it is known that soft tissues typically operate within this region under physiological conditions. For cross-direction variation, it is observed that both the LV and RV yield statistically significant variances. These differences in the toe region behaviour within the LV and RV myocardium may have some significant influences in the contribution of the passive properties of the heart muscle towards the heart’s pumping process. Cross-wall variation shows that only the longitudinal peak stresses between the LV and RV walls are statistically non-significant.
The behaviour of the myocardium tissue in the toe region along the longitudinal direction allows the heart to build up its volume without a corresponding increase in stress in the walls during diastole. The tissue in the circumferential direction develops a slightly higher strain to provide the necessary restitution force for pumping out of the blood during systole. The results in this study show that the behaviour of the tissue walls in the linear region makes the heart stiffer and hard to stretch in the longitudinal direction. On the other hand, the heart tissue is relatively more compliant in the circumferential direction and more so up to 20% strain. These differences are caused by the different stiffness configurations in the two directions, as statistically established in this study.
This study would have benefitted a great deal from histology studies of the rat myocardium at different times during the testing period to observe if there were other processes after tissue dissection that influenced its tensile behaviour. For example, some studies have reported the formation of fibrosis in the infarcted myocardium that eventually makes it stiff [37,38].
The tested specimens were dissected roughly from the middle section of each wall; it might be interesting to investigate the nature of the variance in different regions of each wall especially towards the SPW where the elasticity cross-direction variation is statistically significant.
The tissues were tested in a bath that was maintained at 37 °C to emulate the physiological conditions. However, it would be interesting to investigate the influence of different testing temperatures. Some of the test-related factors that were not considered in this investigation include the effect of the test specimen dimensions, clamping, different buffer solutions, and stress relaxation.

5. Conclusions

The main aim of the current study was to investigate cross-directional and cross-wall variations in infarcted rat myocardium’s passive tensile behaviour. These variations were investigated by examining any differences in the following parameters: anisotropy index, elastic moduli (stiffness), peak stress in the toe region, stress at 40% strain, and stored strain energy in the toe and linear regions. Anisotropy indices were only used for investigating cross-directional variations, as it would not make much practical sense to apply them across different directions. This study has three important findings: (1) LV and SPW tissues have relatively shorter toe regions of 10–15% strain as compared to RV tissue, whose toe region extends up to twice as much as that; (2) LV tissues have higher strain energy storage in the linear region despite being lower in stiffness than the RV; (3) the SPW has the highest strain energy storage along both directions, which might be directly related to its high level of anisotropy.
This paper shows that the myocardium tissue has both cross-directional and cross-wall variations. This may explain why constitutive models that implement anisotropy tend to yield a much better fit than their counterparts that assume isotropy. Thus, the application of models that implement both dependencies are recommended for the modelling of myocardium tissue. An equally important finding is that the passive behaviour of myocardium tissue under tensile testing may be hard to reproduce across different laboratory conditions. Even in a laboratory, it might be prudent to consider validating the repeatability of test results by examining how close they lie to the average stress–strain curve. Another important point is that there is a need to ensure that the specimens are harvested from hosts with similar age, sex, and physical properties (e.g., body mass) in order to eliminate the sources of variability in the experimental results.
The absence of histology studies of similar Wistar rat hearts against which these findings might have been correlated is considered the main limitation of this study. Microstructural studies would provide more insight into the understanding of the underlying features such as fiber orientations within different myocardia. This is the current research direction in our team.

Author Contributions

Conceptualization, F.N.; T.F. and N.D.; methodology, F.N. and H.N.; software H.N.; T.P. and F.N.; validation, F.N.; I.M.; T.P. and H.N.; formal analysis, T.P.; F.N. and H.N.; investigation, F.N. and H.N.; resources, N.D. and F.N.; data curation, F.N.; H.N.; I.M. and M.M.; writing—original draft preparation, F.N. and H.N.; writing—review and editing, M.M.; I.M.; T.P. and F.N.; visualization, F.N.; H.N. and T.P.; supervision, F.N.; N.D.; T.F. and H.N.; project administration, F.N. and H.N.; funding acquisition, N.D. and F.N. All authors have read and agreed to the published version of the manuscript.

Funding

This research was funded by National Research Foundation (NRF), grant number 129380.

Institutional Review Board Statement

The study was conducted according to the guidelines of the Declaration of Helsinki, and this study was approved by the Faculty of Health Sciences Animal Ethics Committee of the University of Cape Town on 6 May 2019 under reference number FHS AEC REF 019-019.

Informed Consent Statement

Not applicable.

Data Availability Statement

No supplementary data are available except data that are available here https://doi.org/10.17632/y753k82jt4.1 (accessed on 10 March 2022).

Acknowledgments

Support from the National Research Foundation (NRF) grant number (129380) is gratefully acknowledged. The Unisa CAPEX Programme supported the acquisition of the biaxial testing machine in the Department of Mechanical Engineering, School of Engineering, College of Science Engineering and Technology.

Conflicts of Interest

The authors declare no conflict of interest.

References

  1. Nemavhola, F. Mechanics of the septal wall may be affected by the presence of fibrotic infarct in the free wall at end-systole. Int. J. Med. Eng. Inform. 2019, 11, 205–225. [Google Scholar]
  2. Nemavhola, F. Fibrotic infarction on the LV free wall may alter the mechanics of healthy septal wall during passive filling. Bio-Med. Mater. Eng. 2017, 28, 579–599. [Google Scholar] [CrossRef] [PubMed]
  3. Nemavhola, F. Biaxial quantification of passive porcine myocardium elastic properties by region. Eng. Solid Mech. 2017, 5, 155–166. [Google Scholar] [CrossRef]
  4. Ndlovu, Z.; Nemavhola, F.; Desai, D. Biaxial mechanical characterization and constitutive modelling of sheep sclera soft tissue. Russ. J. Biomech./Ross. Zurnal Biomehaniki 2020, 24, 84–96. [Google Scholar]
  5. Ngwangwa, H.M.; Nemavhola, F. Evaluating computational performances of hyperelastic models on supraspinatus tendon uniaxial tensile test data. J. Comput. Appl. Mech. 2021, 52, 27–43. [Google Scholar]
  6. Nemavhola, F.; Ngwangwa, H.M.; Pandelani, T. An Investigation of Uniaxial Mechanical Properties of Excised Sheep Heart Muscle Fibre–Fitting of Different Hyperelastic Constitutive Models. Preprints 2021, 1, 2021080566. [Google Scholar] [CrossRef]
  7. Nemavhola, F.; Sigwadi, R. Prediction of hyperelastic material properties of Nafion117 and Nafion/ZrO2 nano-composite membrane. Int. J. Automot. Mech. Eng. 2019, 16, 6524–6540. [Google Scholar] [CrossRef]
  8. Li, D.S.; Avazmohammadi, R.; Merchant, S.S.; Kawamura, T.; Hsu, E.W.; Gorman III, J.H.; Gorman, R.C.; Sacks, M.S. Insights into the passive mechanical behavior of left ventricular myocardium using a robust constitutive model based on full 3d kinematics. J. Mech. Behav. Biomed. Mater. 2020, 103, 103508. [Google Scholar] [CrossRef]
  9. Martynenko, A.; Zozulya, V.V. Mathematical modeling of the cardiac tissue. Mech. Adv. Mater. Struct. 2021, 28, 1–17. [Google Scholar]
  10. Childers, R.C.; Trask, A.J.; Liu, J.; Lucchesi, P.A.; Gooch, K.J. Paired pressure-volume loop analysis and biaxial mechanical testing characterize differences in left ventricular tissue stiffness of volume overload and angiotensin-induced pressure overload hearts. J. Biomech. Eng. 2021, 143, 081003. [Google Scholar] [CrossRef]
  11. Jorba, I.; Mostert, D.; Hermans, L.H.; van der Pol, A.; Kurniawan, N.A.; Bouten, C.V. In Vitro Methods to Model Cardiac Mechanobiology in Health and Disease. Tissue Eng. Part C Methods 2021, 27, 139–151. [Google Scholar] [CrossRef] [PubMed]
  12. Li, W. Biomechanics of infarcted left Ventricle-A review of experiments. J. Mech. Behav. Biomed. Mater. 2020, 103, 103591. [Google Scholar] [CrossRef] [PubMed]
  13. Nemavhola, F. Pig sclera stress-strain dataset under biaxial tensile testing. Mendeley Data 2020, V1. [Google Scholar] [CrossRef]
  14. Masithulela, F.J. Computational Biomechanics in the Remodelling Rat Heart Post Myocardial Infarction. Ph.D. Thesis, University of Cape Town, Cape Town, South Africa, 2016. [Google Scholar]
  15. Masithulela, F. Bi-ventricular finite element model of right ventricle overload in the healthy rat heart. Bio-Med. Mater. Eng. 2016, 27, 507–525. [Google Scholar] [CrossRef]
  16. Masithulela, F. The Effect of Over-Loaded Right Ventricle during Passive Filling in Rat Heart: A Biventricular Finite Element Model. In Proceedings of the ASME International Mechanical Engineering Congress and Exposition, Houston, TX, USA, 13–19 November 2015. [Google Scholar]
  17. Masithulela, F. Analysis of Passive Filling with Fibrotic Myocardial Infarction. In Proceedings of the ASME International Mechanical Engineering Congress and Exposition, Houston, TX, USA, 13–19 November 2015. [Google Scholar]
  18. Nemavhola, F. Detailed structural assessment of healthy interventricular septum in the presence of remodeling infarct in the free wall–A finite element model. Heliyon 2019, 5, e01841. [Google Scholar] [CrossRef] [Green Version]
  19. Nemavhola, F.; Ngwangwa, H.; Davies, N.; Franz, T. Passive Biaxial Tensile Dataset of Three Main Rat Heart Myocardia: Left Ventricle, Mid-Wall and Right Ventricle. Preprints 2021, 1, 2021080153. [Google Scholar]
  20. Rigolin, V.H.; Robiolio, P.A.; Wilson, J.S.; Harrison, J.K.; Bashore, T.M. The forgotten chamber: The importance of the right ventricle. Catheter. Cardiovasc. Diagn. 1995, 35, 18–28. [Google Scholar] [CrossRef]
  21. Sheehan, F.; Redington, A. The right ventricle: Anatomy, physiology and clinical imaging. Heart 2008, 94, 1510–1515. [Google Scholar] [CrossRef]
  22. Mas, P.T.; Rodríguez-Palomares, J.F.; Antunes, M.J. Secondary tricuspid valve regurgitation: A forgotten entity. Heart 2015, 101, 1840–1848. [Google Scholar]
  23. Kakaletsis, S.; Meador, W.D.; Mathur, M.; Sugerman, G.P.; Jazwiec, T.; Malinowski, M.; Lejeune, E.; Timek, T.A.; Rausch, M.K. Right ventricular myocardial mechanics: Multi-modal deformation, microstructure, modeling, and comparison to the left ventricle. Acta Biomater. 2021, 123, 154–166. [Google Scholar] [CrossRef]
  24. Valdez-Jasso, D.; Simon, M.A.; Champion, H.C.; Sacks, M.S. A murine experimental model for the mechanical behaviour of viable right-ventricular myocardium. J. Physiol. 2012, 590, 4571–4584. [Google Scholar] [CrossRef] [PubMed]
  25. Sacks, M.S.; Chuong, C.J. A constitutive relation for passive right-ventricular free wall myocardium. J. Biomech. 1993, 26, 1341–1345. [Google Scholar] [CrossRef]
  26. Golob, M.; Moss, R.; Chelser, N. Cardiac Tissue Structure, Properties, and Performance: A Materials Science Perspective. Ann. Biomed. Eng. 2014, 42, 2003–2013. [Google Scholar] [CrossRef] [Green Version]
  27. Laurence, D.; Ross, C.; Jett, S.; Johns, C.; Echols, A.; Baumwart, R.; Towner, R.; Liao, J.; Bajona, P.; Wu, Y. An investigation of regional variations in the biaxial mechanical properties and stress relaxation behaviors of porcine atrioventricular heart valve leaflets. J. Biomech. 2019, 83, 16–27. [Google Scholar] [CrossRef] [PubMed]
  28. Hill, M.R.; Simon, M.A.; Valdez-Jasso, D.; Zhang, W.; Champion, H.C.; Sacks, M.S. Structural and Mechanical Adaptations of Right Ventricle Free Wall Myocardium to Pressure Overload. Ann. Biomed. Eng. 2014, 42, 2451–2465. [Google Scholar] [CrossRef] [PubMed] [Green Version]
  29. Avazmohammadi, R.; Hill, M.R.; Simon, M.A.; Zhang, W.; Sacks, M.S. A novel constitutive model for passive right ventricular myocardium: Evidence for myofiber–collagen fiber mechanical coupling. Biomech. Model. Mechanobiol. 2017, 16, 561–581. [Google Scholar] [CrossRef]
  30. Nemavhola, F. Study of biaxial mechanical properties of the passive pig heart: Material characterisation and categorisation of regional differences. Int. J. Mech. Mater. Eng. 2021, 16, 6. [Google Scholar] [CrossRef]
  31. South African Goverment. Animal Protection Index (API) 2020. 2020. Available online: https://api.worldanimalprotection.org/sites/default/files/api_2020_-_south_africa_0.pdf (accessed on 20 August 2021).
  32. Gardiner, J.C.; Weiss, J.A. Simple shear testing of parallel-fibered planar soft tissues. J. Biomech. Eng. 2001, 123, 170–175. [Google Scholar] [CrossRef]
  33. Viiidik, A. Biomechanics of tendons and other soft connective tissues. Testing methods and structure-function interdependence. In Biomechanics: Basic and Applied Research; Bergmann, G., Kolbel, R., Rohlmann, A., Eds.; Kluwer Academic Publishers Group: Dordrecht, The Netherlands, 1987; pp. 59–72. [Google Scholar]
  34. Fung, Y.C. A First Course in Continuum Mechanics for Physical and Biological Engineers and Scientists; Prentice Hall: Englewood Cliffs, NJ, USA, 1994. [Google Scholar]
  35. Montgomery, D.C.; Runger, G.C. Applied Statistics and Probability for Engineers (with CD); John Wiley & Sons: Hoboken, NJ, USA, 2007. [Google Scholar]
  36. Jiang, M.; Lawson, Z.T.; Erel, V.; Pervere, S.; Nan, T.; Robbins, A.B.; Feed, A.D.; Moreno, M.R. Clamping soft biologic tissues for uniaxial tensile testing: A brief survey of current methods and development of a novel clamping mechanism. J. Mech. Behav. Biomed. Mater. 2020, 103, 103503. [Google Scholar] [CrossRef]
  37. Sirry, M.S.; Butler, J.R.; Patnaik, S.S.; Brazile, B.; Bertucci, R.; Claude, A.; McLaughlin, R.; Davies, N.H.; Liao, J.; Franz, T. Characterisation of the mechanical properties of infarcted myocardium in the rat under biaxial tension and uniaxial compression. J. Mech. Behav. Biomed. Mater. 2016, 63, 252–264. [Google Scholar] [CrossRef] [Green Version]
  38. Martonová, D.; Alkassar, M.; Seufert, J.; Holz, D.; Dương, M.T.; Reischl, B.; Friedrich, O.; Leyendecker, S. Passive mechanical properties in healthy and infarcted rat left ventricle characterised via a mixture model. J. Mech. Behav. Biomed. Mater. 2021, 119, 104430. [Google Scholar] [CrossRef] [PubMed]
Figure 1. Experimental set-up of biaxial testing of rat heart passive myocardium: (a) shows the 5 × 5 mm LV myocardium sample and rake assembly for clamping, and (b) shows the BioTester system used for biaxial testing of rat LV myocardium including the water bath for mimicking the body temperature of 37 °C.
Processes 10 00629 g001
Figure 2. Illustration of deformed specimen under uniform stretching showing 10% strain during preload and 40% strain during actual testing. L and C denote the longitudinal and circumferential directions, respectively.
Processes 10 00629 g002
Figure 3. Stress–strain graphs for LV myocardium in the (A) longitudinal and (B) circumferential directions overlayed with one-standard deviation regions as well as an average curve.
Processes 10 00629 g003aProcesses 10 00629 g003b
Figure 4. Stress–strain graphs for SPW myocardium in the (A) longitudinal and (B) circumferential directions overlayed with one-standard deviation regions as well as an average curve.
Processes 10 00629 g004aProcesses 10 00629 g004b
Figure 5. Stress–strain graphs for RV myocardium in the (A) longitudinal and (B) circumferential directions overlayed with one-standard deviation regions as well as an average curve.
Processes 10 00629 g005aProcesses 10 00629 g005b
Figure 6. Standard error of the mean (SEM) for the three heart walls along each direction. (a) Standard error of the mean (SEM) of the LV, (b) Standard error of the mean (SEM) of Septum and (c) Standard error of the mean (SEM) of RV.
Processes 10 00629 g006aProcesses 10 00629 g006b
Figure 7. Longitudinal vs circumferential stress–strain curves for each heart wall’s myocardium. (a) Average stress–strain curves of LV, (b) Average stress–strain curves of Septum and (c) Average stress–strain curves of RV.
Processes 10 00629 g007aProcesses 10 00629 g007b
Figure 8. Anisotropy indices calculated over all tests for each heart wall.
Processes 10 00629 g008
Figure 9. Ratios of elastic moduli across different walls for all fifteen tests described as cross-wall variations in (a) for longitudinal-to-longitudinal directions of each wall and (b) for circumferential-to-circumferential directions for each wall.
Processes 10 00629 g009
Table 1. Statistical significance test results for axis-to-axis variations in biaxial mechanical parameters. All statistically significant results in bold type.
p-Values: Cross-Directional Variation in a Wall
LVSPWRV
Elastic Modulus0.06010.00010.1128
Peak stress at toe region limit0.00420.27910.0000
Peak stress at 40% strain0.95370.03420.0005
Table 2. Statistical significance test results for cross-wall variations in biaxial mechanical parameters. All statistically significant results in bold type.
p-Values: Cross-Wall Variation in a Particular Direction
LV-SPWLV-RVSPW-RV
LCLCLC
Elastic Modulus0.00000.00430.01420.00000.65520.0001
Peak stress at toe region limit0.00070.01110.88790.00010.00840.0033
Peak stress at 40% strain0.00210.21170.21190.00000.28640.0000
L and C, longitudinal and circumferential.
Table 3. Stored strain energy values calculated within the toe region and linear elastic region for each heart wall myocardium.
Wall of MyocardiumToe Region (Kj)Linear Elastic Region (Kj)
LongitudinalCircumferentialLongitudinalCircumferential
Left ventricle0.08030.22103.31303.4471
Septum0.19410.33594.53413.7879
Right ventricle0.07280.76971.32512.8569
Publisher’s Note: MDPI stays neutral with regard to jurisdictional claims in published maps and institutional affiliations.

