Article

Application of Nanodiamonds in Modelled Bioremediation of Phenol Pollution in River Sediments

1
Department of General and Applied Hydrobiology, Faculty of Biology, Sofia University “St. Kliment Ohridski”, 8, Dragan Tzankov Blvd., 1164 Sofia, Bulgaria
2
Center of Competence “Clean Technologies for Sustainable Environment—Water, Waste, Energy for Circular Economy”, 1000 Sofia, Bulgaria
*
Author to whom correspondence should be addressed.
Processes 2022, 10(3), 602; https://doi.org/10.3390/pr10030602
Submission received: 31 January 2022 / Revised: 14 March 2022 / Accepted: 17 March 2022 / Published: 19 March 2022

Abstract

:
The pollution of aquatic ecosystems is a big problem that has its impact on river sediments. In recent decades, an effective solution to this problem has been the application of bioremediation technologies. Nanoremediation is an innovative part of these technologies. We still know little about the efficiency of nanoparticles, especially nanodiamonds, in modelled conditions. The aim of the present study is to investigate the effect of nanodiamonds on the key parameters of modelled bioremediation of river sediments that are polluted with phenol, as well their effect on the structures and functions of microbial communities. An important indicative mechanism that was used is the application of fluorescent in situ hybridization for sediment microbial communities. The results of this study revealed the positive role of nanodiamonds that is associated with their intoxication with high concentrations of phenol. Readaptation was also found, in which the xenobiotic biodegradation potential evolved by increasing the relative proportions of non-culturable bacteria, namely Acinetobacter (at the 144th hour) and Pseudomonas (at the 214th hour). The results can help to find an effective solution to the question of how information from such precise molecular methods and the application of nanodiamonds can be translated into the accessible language of management and bioremediation technologies.

Graphical Abstract

1. Introduction

Sediments play an important role in the assessment of the condition of water systems [1,2,3,4,5]. Sediments consist of particles of different sizes that can be transported by a fluid stream and that precipitate as a layer of solid particles over the bed or the bottom of water basins [6]. The upper layers of the sediments in lake and river ecosystems have a higher content of organic compounds, which is a precondition for the presence of a large number of microorganisms. This is mostly due to the higher concentrations of carbohydrates, proteins, and amino acids that are in the interstitial water [7,8,9]. The microorganisms have a main role in the performance of the bio-transforming processes of organic compounds and nutrients. This also defines the key significance of the microbial communities for the realization of the self-purifying potential of water ecosystems. Therefore, an understanding of the functional structure of the microbial community would contribute to the better understanding of this potential. The study of the groups of microorganisms that are present, through separation that is based on a specific physiological process, would contribute to the study of the details of the bio-transformation processes [10,11].
An example in which the self-purification biotransformation processes that occur in river sediments can be studied in detail is the case of the cascade “Middle Iskar”, which includes five small hydro power plants (SHPPs) on the middle stream of the Iskar River in the region of the villages Rebrovo and Gabrovnitsa in Bulgaria. The river in this region is strongly anthropogenically impacted, mostly by the villages that are near it and by different productions that do not have built or well-functioning treatment plants. As a result, into the waters and the sediments of the river fall a large quantity of trivial and xenobiotic pollutants. Of the different xenobiotics polluting the river, the most critical ones are the heavy metals which have been accumulating for decades in the sediments of the river [12]. The SHPPs play the role of a filter, holding the river sediments and the domestic, industrial and naturally originated pollutants that have entered into them. These pollutants hinder the self-purification processes. The SHPP which was first built in the cascade was SHPP Lakatnik, which has functioned since 2008. In its storage are found the largest accumulations of river sediments, as well as an accumulation of large quantities of hardly degradable pollutants within the sediments [13].
An example of a typical pollutant that accumulates in these sediments is phenol—a toxic compound that is found in the water media exceptionally often due to pollution from different industrial processes from petrol refineries, the chemical industry, the production of dyes, wood conservation, paper production, etc. [14,15]. Phenol is a comparatively easily degradable xenobiotic for the microbial degraders. A higher concentration could inhibit the growth of the microorganisms and microbial communities. On the other hand, phenol is toxic to water organisms and to people [16] as it provokes carcinogenicity and neurotoxicity [17]. As a consequence of this, it is reasonable to propose that the living organisms that are in the river water and river sediments in the cascade could be at risk. Therefore, the elimination of phenol is vitally important for the good ecological status of the river. All this makes phenol a very convenient model xenobiotic for the study and management of the bioremediation processes in sediments.
In the last few decades, together with the improvement of biotechnologies, bioremediation has transformed into one of the fastest-developing fields in environment protection. Bioremediation is an application of biological processes for the purification of underground waters, soils, sediments, and sludges that are polluted with dangerous chemicals [18]. This approach is a more effective alternative to the physicochemical methods that have higher expenses and produce other toxic final products [17]. This technology, when applied in situ, causes the least disruption to the environment and, compared to other technologies, is relatively cheap. It can use autochthonous microflora, selected and/or adapted microbial cultures or microbial communities [18]. The application of the bioremediation process requires an entire study of the essence and the range of the pollution, the characteristics of the place, the legal restrictions, and the long-term management of the specific project as well as the juxtapositions between the value and the benefits of the specific technology [18,19]. The main aims of the prevention of the pollution of sediments are a decrease in the regional pollutions within the water basins and an increase in the essential self-purifying processes and bioremediation technologies for the recovery of the sediments’ quality.
One of the main challenges in the use of the bioremediation technologies is the identification of adequate microorganisms with a high enough level of metabolic activity that would be able to effectively eliminate the pollutants [14]. The bioremediation of phenol compounds could be performed by many microorganisms from different genera such as Pseudomonas, Vibrio, Serratia, Bacillus, Achromobacter, and Acinetobacter [15,20]. The identification of the microorganisms could be performed with standard culture methods [21,22]. However, by means of these methods, just a small subset of the microorganisms—not more than 3%—can be characterized. More complete information about the quantity, the biodiversity, the localization, and the distribution of the microorganisms in the communities allow molecular methods such as denaturing gradient gel electrophoresis (DGGE), polymorphism with a limited length of the fragment (T-RFLP), and fluorescence in situ (FISH) [23,24,25,26,27,28].
One of the most often applied molecular methods is fluorescence in situ hybridization analysis (FISH). The application of this method allows the analysis of the distribution of the target microorganisms in situ in the biological system [29,30,31]. FISH combines the precision of molecular genetics with the visual information of microscopic analysis, this combination allows the identification of key microbial cells in their essential microhabitat as well as the study of the population dynamics and interspecies interactions of the separate cell levels [32,33,34,35,36]. The FISH method gives an opportunity for a study of the physiological marks of selected microbial populations and responds to the question, “who does what in this microbial community?”. However, to the present date, studies of the microbial communities in the sediments of freshwater basins with FISH are not numerous [37,38,39,40]. Although FISH analysis is more often applied to underground waters [41,42,43], it has been proven that more than 90% of the microbial biomass within water can be found attached to precipitated particles [44,45] and that this biomass manifest a much higher level of activity than the plankton microbial community [46,47,48,49]. Therefore, detailed studies of sediments from water bodies are ecologically more convenient than studies of samples from underground and surface water [50].
The intensive development of nanotechnologies accelerates the studies and applications of nanodiamonds (ND) due to their mechanical, chemical and optic properties [51]. All of these characteristics contribute to the more effective application of ND in different biomedical and ecological applications and other biotechnologies, in comparison to other carbon nanoparticles. The application of nanodiamonds has expanded dramatically in recent years. This is the result of increasingly successful laboratory results and patents. The commercial production of nanodiamonds makes their application in industrial technologies more realistic. This could also lead to the production of widely manufactured products containing nanodiamonds. From an economic point of view, the increased production of ND leads to a decrease in their price and, therefore, their scope of application increases [52]. An example of such a new production, which is significantly more economically profitable, is described by Dolmatov et al. [53]. In previous experiments with nanodiamonds with hydrophobic groups, their positive effect on the biodegradation of phenol at concentrations of 250 mg/L has already been proven. Because of the hydrophobic properties of ND, they form consortia together with bacterial cells [54]. These properties are the base for the capability of ND to actively to adsorb viruses and microorganisms. An example is the attachment of the bio-compatible ND to enzymes or different medications that have a proven effectiveness against pathogenic bacteria [55] and cancer cells [56]. Regarding environment protection, ND could be used in different aspects. A main application of ND, which is examined in detail in the present paper, is their use for environment remediation [57]. The aim of the study is to investigate the effect of nanodiamonds on the key parameters of the model bioremediation of river sediments that are polluted with phenol, as well as their effect on the structure and functions of microbial communities. Kinetic and microbiological parameters, as well as fluorescent in situ hybridization analysis, were key to the process.

2. Materials and Methods

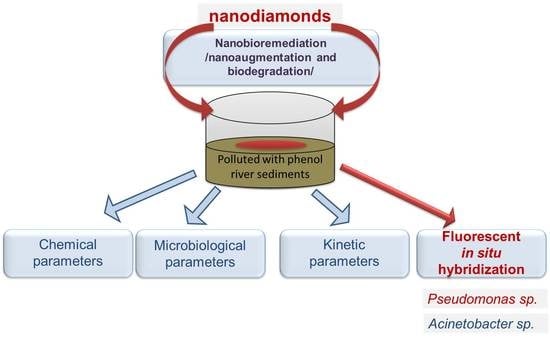
2.1. Experimental Design

The design of this analogous modeling included the making of 2 bioremediation sites simulating the processes in the sediments of the dams of the Middle Iskar cascade. Each bioremediation site had a volume of 1 dm3, contained 500 g of sediments from Lakatnik dam and 500 g of filler in the form of quartz sand, with a particle size of 0.8–1.6 mm. The duration of functioning was 214 h in a semi-continuous mode of action. The experiment aimed to follow the processes that were occurring in two variant conditions: (1) the control variant (Ph), containing sediments, quartz sand, and a model xenobiotic phenol and (2) the model variant (PhND), in which nanodiamonds were added to the sediments with quartz sand and phenol (ND) as nanomodulators (Figure 1).
The sediments were collected from MHPP Lakatnik, the oldest storage in the Middle Iskar cascade. In this part of the river, large quantities of pollutants have accumulated in the sediments. In the course of the model bioremediation, the biodetoxifying and adaptive processes of the microbial community in the variant with phenol (Ph) and in the variant with the phenol and nanodiamonds (PhND) were investigated. During the process, the increase in the concentration of phenol occurred according to a specialized algorithm: 2nd hour—250 mg/kg; 49th hour—500 mg/kg; and 72nd hour—500 mg/kg [30]. The following processes and situations were simulated:
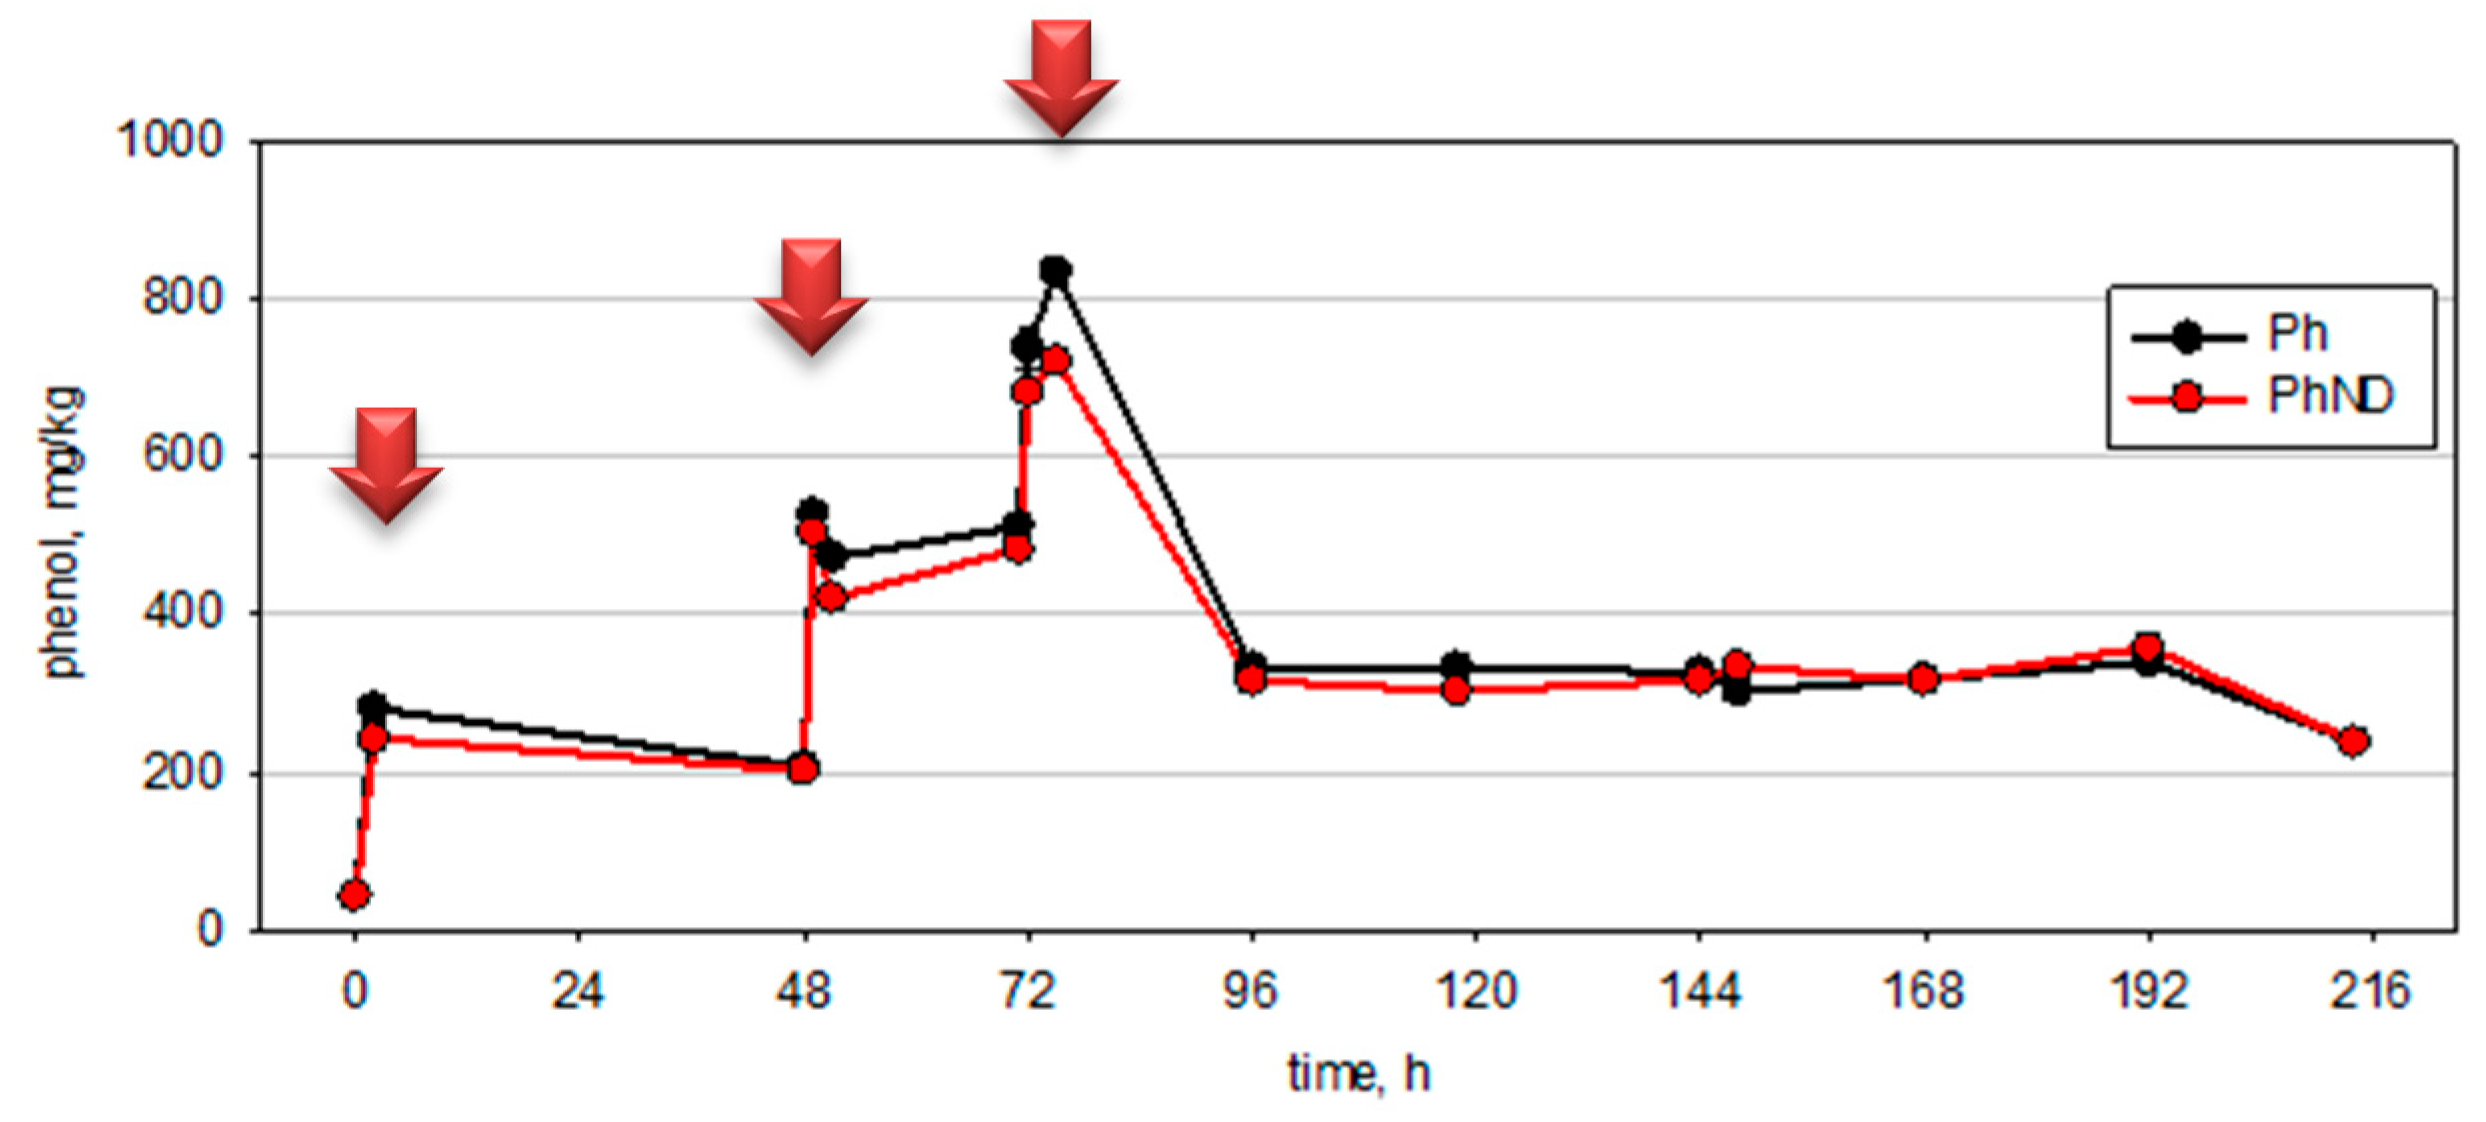
  • Pollution with a comparatively low concentration of phenol: from the 2nd–48th hours;
  • Simulation of a critical situation with the entering of a high concentration of phenol: at the 49th and 72nd hours;
  • Study of the system after a long adaptation and entering into the phase of system recovery after the explosive phenol loading: from the 144th–214th hours.
The parameters of these processed were measured at critical control points—CCP0, CCP2, CCP48, CCP144, and CCP214.
This selection of phenol as the model xenobiotic was made due to the fact that it is easily biodegradable, has a high level of solubility in water, has a high level of toxicity and is found in large quantities in essential water ecosystems, sediments, and industrial wastewaters [15,58].

2.2. Analytical Methods and Indicators

The residual phenol was measured by the use of the spectrophotometric method with 4-aminoantipyrine after distillation. After the preliminary distillation, the samples were analyzed according to the specifications that are described in the BDS and EPA methods [59,60]. The absorption was measured spectrophotometrically at Spectrophotometer—Pharmacia Biotech Ultrospec 3000. All of the chemical reagents that were used in the measurement of the residual phenol were supplied by Merck, Inc, Kenilworth, NJ, USA.
The following formulas for the calculation of biodegradation indicators were used.
Effectiveness of phenol biodegradation (Eff):
E f f = C t 1 C t 2 C t 1 100   [ % ] ,
where Ct1 is the phenol concentration at time t1 and Ct2 is the phenol concentration at the next time, t2.
Rate of phenol biodegradation (RB):
R B = C t 1 C t 2 t 2 t 1   mg / gxh ,
Specific rate of phenol biodegradation (SRB):
S R B = C t 1 C t 2 ( t 2 t 1 ) B m   mg / gxh ,
where Bm is the biomass in g/L dry weight.
Rate of biomass accumulation (RAB):
R A B = D W t 2 D W t 1 t 2 t 1   mg / lxh ,
where DWt1 is the dry weight at time t1 and DWt2 is the dry weight at the next time, t2.

2.3. Microbiological Analysis

The quantitative determination of the microorganisms was conducted through culture methods by using solid nutrient media according to the rules of routine microbiological practice [61]. The sediment samples were taken from both of the variants (Ph and PhND) at the 0th hour—CCP0, 48th hour—CCP48, and 214th hour—CCP214. The sediment samples were firstly treated with an ultrasound disintegrator UD-20 automatic (Techpan), in three repetitions for 10 s for the desorption of the bacterial cells from the surface layer of the sediment particles (1 g sediment + 9 mL mineral solution of NaCl (0.9%)). The conditions of the cultivation are presented in Table 1. All of the results are the average values of the three independent repetitions, represented as CFU/g dry weigh. The microbiological indicators that were investigated in this process were physiological and taxonomic groups of bacteria like aerobic heterotrophic bacteria (AeH), bacteria from genus Pseudomonas (Ps), and bacteria from the genus Acinetobacter (Ac) (Table 1). The amount of the phenol-degrading bacteria (Ph-degr.) were determined on the solid medium according to Furukawa [62], with phenol (200 mg/L) as the sole carbon and energy source (Table 1).

2.4. FISH Analysis

Samples were taken from both of the variants (Ph and PhND) of the experiment at the points CCP0 and CCP2 as well as at the points CCP48, CCP144, and CCP214 of the process. The samples were fixed with an 8% paraformaldehyde. This conducted a dehydration and a permeabilization process, according to Nielsen (2009) [31]. The fluorescent signal for the genera Pseudomonas was received with the 5′-labelled oligonucleotide probe 5′-GCT GGC CTA GCC TTC-3′ with the red dye Cy3 [63,64,65,66]. The fluorescent signal for the genera Acinetobacter was received with the 5′-labelled oligonucleotide probe (ACA652) 5’-ATC CTC TCC CAT ACT CTA-3’ with the yellow dye Fluos, 5’-labeled. For a control, a non-sense probe coHдa NON338 (5′-ACT CCT ACG GGA GGC AGC-3′) was used. The hybridization was performed with 20% formamide for the genus Pseudomonas and 35% formamide for the genus Acinetobacter. The samples were dyed with DAPI for the visualization of all of the microorganisms in the biofilm. The images were made with an epifluorescent microscope (Leica Micro Systems DFC 310 FX) with a magnification of 400×.

2.5. Application of Nanodiamonds

The ND were added in a concentration of 1.667 mg/g at the start of the process. The nanodiamonds that were applied in the present model bioremediation of river sediments were provided by Professor Stavry Stavrev from the International Center for Nanomaterials, Nanotechnologies and Nanomedicine in the town of Smolyan, Bulgaria [67]. A method of the detonation synthesis of ND was applied in order to create the obtained ND. The detonation of the explosive charge was performed in an aqueous medium in the presence of active reductants [68]. The nanodiamonds that were used in the present experiment were characterized by transmission electron microscopy (TEM) and X-ray measurements, as described in the study by Prokharov et al. [69]. The data from both of these methods has proven the characteristics of the nanodiamonds. In addition to these two methods, Raman spectroscopy was performed [69]. The Raman spectrum contained the line for nanodiamonds at 1332 cm−1, D-line of graphite at 1350 cm−1, and G-line of graphite at 1580 cm−1. The lines D and G were relatively narrow and had the same intensity, indicating the presence of carbon nanoclusters smaller than 5 nm [69]. In our experiments ND with hydrophobic properties without a specially treated surface have been used [70].

3. Results and Discussion

3.1. Residual Concentration of Phenol

In this section, the dynamics of the residual concentration of phenol, the kinetic parameters of the phenol elimination and the effect of the nanodiamonds on them will be discussed. The ecological situations of an explosive, risky pollution incident with phenol in high concentrations were simulated.
In Figure 2, the phenol dynamics at residual concentrations in the different hours of the detoxifying process are represented. Phenol was added on the 2nd hour at a concentration of 250 mg/kg. Between the 2nd and the 49th hours, a small decrease in the phenol concentration in both of the working variants was registered. The residual concentration was around 200 mg/kg in both of the systems. At the 49th hour, phenol was added into the systems at a two-times higher concentration—500 mg/kg and thus the phenol concentrations reached the values of 527.63 mg/kg for variant Ph and 504.99 mg/kg for variant PhND. At the 72nd hour, the third and last addition of phenol with a concentration of 500 mg/kg was performed. The phenol then reached the concentration of 738.87 mg/kg for variant Ph and 682.28 mg/kg for PhND; after which, at the 75th hour, there was a new discharge of the phenol that was accumulated in the cells which led to a bigger increase in the phenol concentration—835.06 mg/kg for variant Ph and 721.89 mg/kg for variant PhND. The lower values of the phenol at these hours in the variant PhND manifest the adsorbing properties of the nanoparticles which are due to the one of their specific features—their surface-active groups. From the 75th to the 96th hours a sharp decrease in the phenol concentration was registered. Due to the critical concentration being reached and the significant inhibition of the microorganisms, the process of elimination was probably accompanied by different biotic and abiotic processes, but it could hardly be considered a real biodegradation process. Between the 75th and the 96th hours, a sharp decrease in the phenol concentration was registered, which contradicts the biological logic of the realization of the biodegradation process. Here, phenol elimination from the model sediment site had occurred based on physicochemical processes—phenols flying in the air (this is a volatile pollutant at an extremely high concentration in periodically mixed sediments), polymerization and a permanent adsorption of the polymerized products on the sediment particles and others like them. After the physicochemical decrease in the phenol concentration after the 96th hour to around 310 mg/kg (a concentration which is near-critical), the long phase of the readaptation of the inhibited biological system began. This process of readaptation (from the 96th to 192nd hour) began around the 96th hour and only at the 192nd hour did the microbial community start to recover its biodegradation potential. Again, from the 192nd to the 214th hours, a real biodegradation process was registered. This is the reason for the later study of the kinetic biodegrading parameters which constituted a second real biodegradation stage from the 192nd to the 214th hours.

3.2. Kinetic Parameters of Biodetoxification Processes

Table 2 presents the kinetic parameters of the phenol biodegradation process in the experimental variants Ph and PhND within the bioremediation of the sediments. The rates of biodegradation of phenol at the 48th hour were found to be 1.598 mg/kg·h in variant Ph and 0.891 mg/kg·h in variant PhND. At the end of the process (at the 214th hour) an increase in this rate was found in the variant with the added ND—5.446 mg/kg·h, compared to the control variant Ph—4.578 mg/kg·h. The lower rate at the 48th hour may be due to the adsorption of phenol onto the nanodiamonds at the beginning of the process. This led to lower concentrations of the residual phenol, and thus induced the enzymatic activities that were responsible for the biodegradation of the xenobiotic.
The specific rate of the biodegradation of the phenol value at the 48th hour for the variant Ph was 0.211 mg/kg·h and 0.100 mg/kg·h for the variant PhND. At 214th hour, the specific rate for the variant PhND was 0.436 mg/kg·h versus 0.348 mg/kg·h for the variant Ph. The data in Table 1 show the negative modulating effect of the nanodiamonds on the first phase of the biodegradation of the phenol and the positive modulating effect at the end of the process.
Another finding is that the effectiveness of the elimination of phenol at the 48th hour was lower in the PhND variant. This confirms the negative modulating effect of nanodiamonds on the initial phase. At the end of the process (at the 214th hour), the effectiveness of variant Ph was 29.64% and for PhND—33.42%, i.e., the effectiveness was almost equal (with a difference of about 4%). These results show the low effectiveness of the elimination of the toxic pollutant.
Figure 3 presents the effect of nanodiamonds on the kinetic parameters of the biodegradation of phenol, compared to the control variant Ph. It was found that, at the 48th hour, the rate of the biodegradation of the phenol in the variant with the added ND was 44.37% lower than that of the control variant Ph, while at the 214th hour there was an increase of 19.00% in the variant PhND. From the data that are presented in Figure 3, it was found that, at the 48th hour, the specific rate of the biodegradation of phenol in the variant PhND was 52.38% lower than that of the variant Ph, while at the 214th hour we registered an increase in the specific rate by 25.71% in the variant PhND. Similar to the RBP, the data showed a higher SRBP for the 214th hour in the variant with ND. Regarding the EFF, it was found to be 35.72% lower at the 48th hour than in the control variant Ph, while at the 214th hour it was found to increase the EFF by 12.75%.
So far, it is clear that the rates and effectiveness of phenol elimination at the 48th hour were lower than those at the 214th hour in both of the experimental variants. It also became clear that the nanodiamonds reduced the kinetic parameters up to the 48th hour and increased the same parameters of the biodegradation of phenol up to the 214th hour. At the same time, in the moments of phenol addition (the explosive pollution), the nanodiamonds almost expressly reduce the amount of the residual phenol and relieved the system by slightly weakening the intoxication shock.
The next two sections will consider the microbial community, the adaptive mechanisms with which it responded, and how it changed its functional structure within the sediment during the model bioremediation through the study of classical cultivation techniques and fluorescent in situ hybridization analysis. Autochthonous microflora play a key role in the transformation of naturally occurring pollutants in sediments, as well as pollutants that are of an anthropogenic origin. Sediments accumulate high concentrations of organic matter, ions and toxic substances that are expected to have a negative effect on microorganisms. However, the biofilm in the sediments, through the processes of the succession and synergy of communities, has a high level of bioremediation potential.

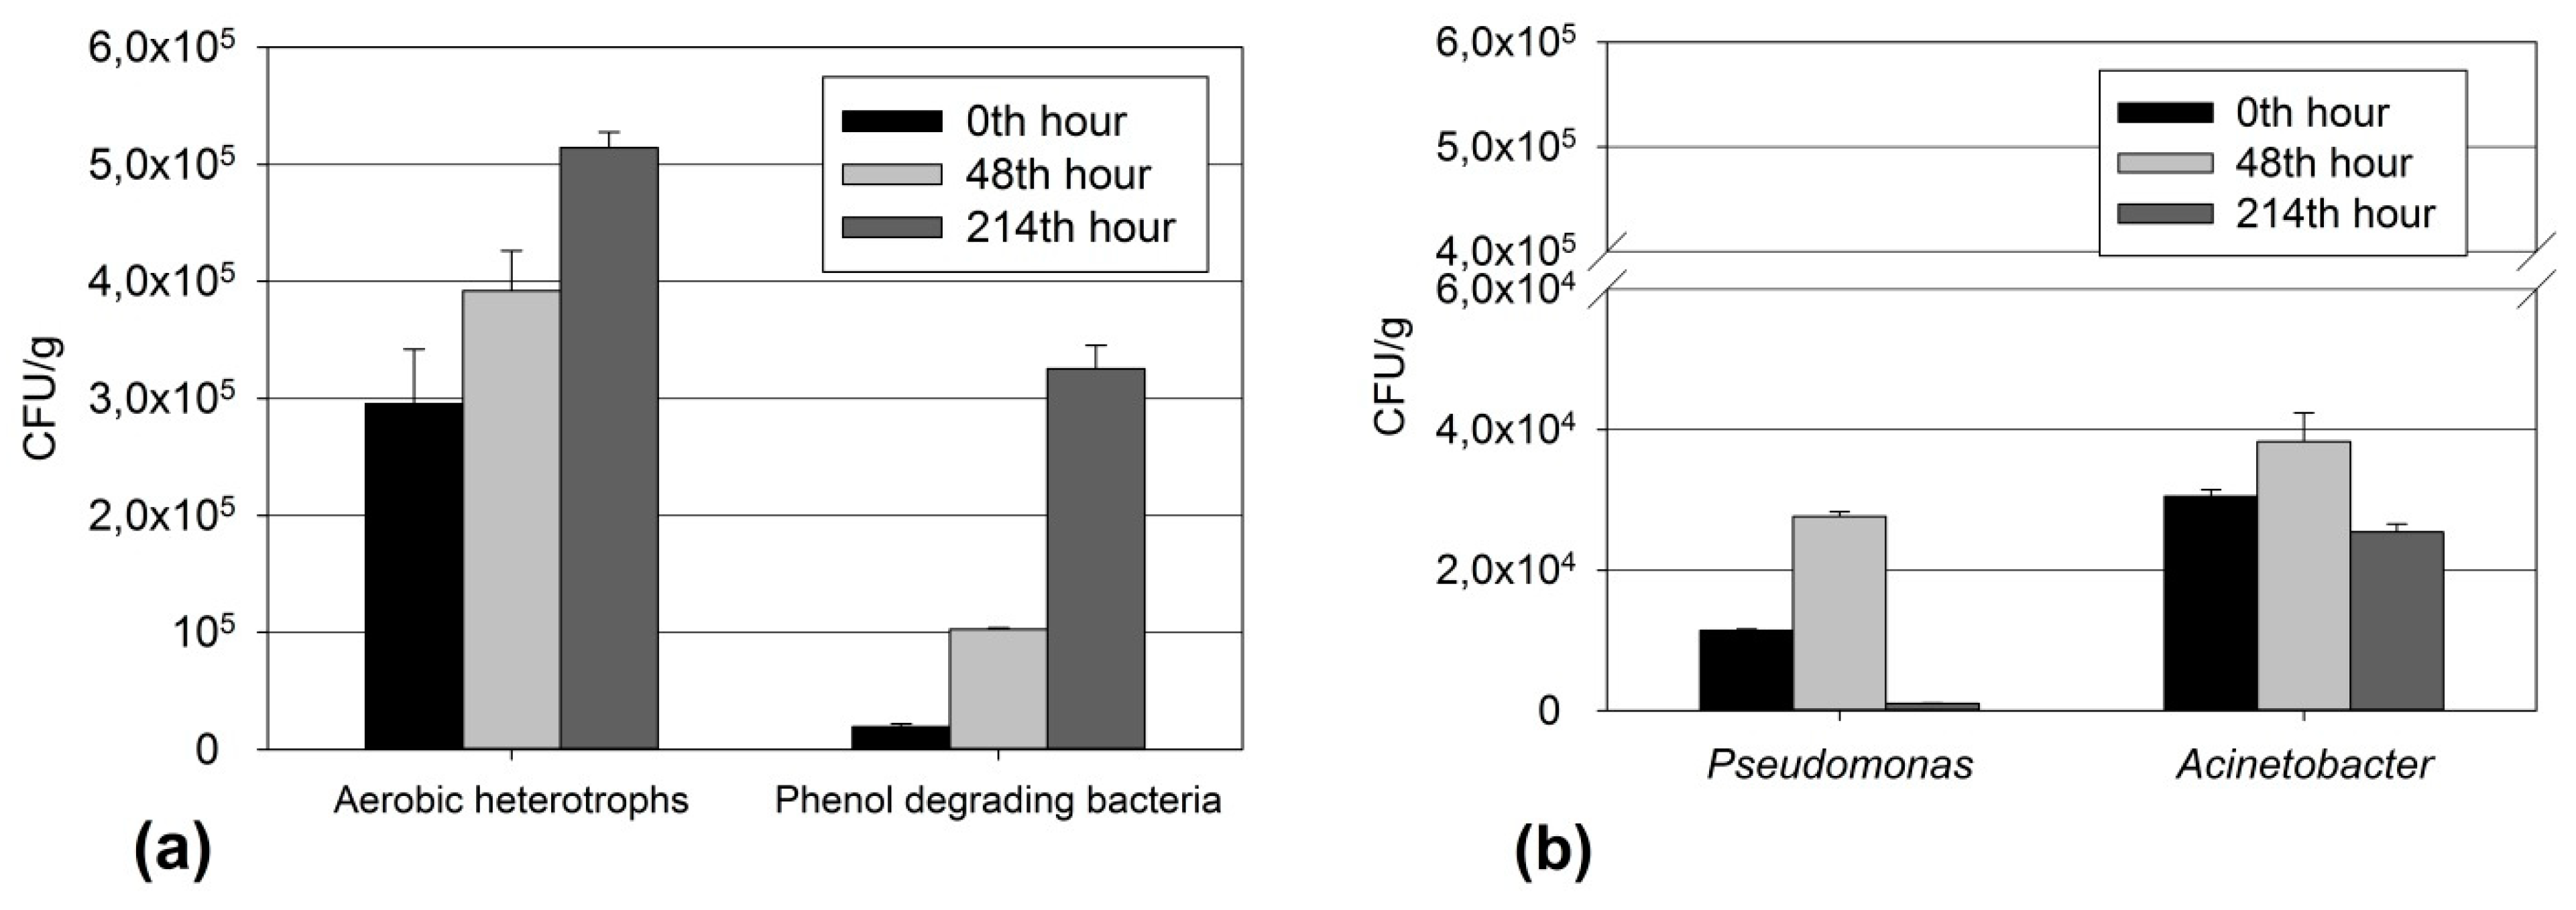
3.3. Relationship of Culturable and Non-Culturable Microorganisms during Adaptation without ND

This section discusses the results of the culture techniques and non-cultivation methods (FISH methods) that were used for studying the functional diversity of the microorganisms during of model bioremediation of phenol-contaminated sediments. The dynamics of the key physiological and taxonomic groups of the microorganisms are presented. A comparison was also made in the restructuring of the microbial communities during the process with the variant without added nanodiamonds.
Figure 4a shows the quantity of aerobic heterotrophs, as well as the phenol-degrading microorganisms that were present in the variant without added ND at the 0th, 48th and 214th hours—the three critical points characterizing the process. The number of aerobic heterotrophs shows a gradual increase throughout the process. The results for this group reveal the ability of the microbial sediment community to adapt to the available toxicant, based on the multiplication of the number of bacterial cells. The phenol-degrading microorganisms, during of the biodegradation process, increased their quantity despite intoxication shock (Figure 4). For them, phenol is both a substrate and an inhibitor. These two effects of phenol on the quantity of phenol-degrading microorganisms are related. During the adaptation process of sediment microbial communities (from the 48th–214th hours) these microorganisms increased their number more than 2 times. All of this leads to the intermediate conclusion that one of the adaptive reactions of the sediment microflora is an increase in the density of the cultured phenol-degrading microbial segment. In the microbial consortium at the 214th hour, their number was at its largest. At this time, microbial restructuring processes had already taken place and processes of a specific enzymatic response to the phenol were likely to take place in the microbial communities. So far, the data well illustrate the ability of xenobiotic-degrading bacteria to cope with phenol loading at near-critical concentrations (approximately 280 mg/kg) [71,72]. This result is not uncommon, as the intensive biodegradation of 200 mg/kg phenol under anaerobic conditions within 192 hours has been demonstrated in previous research [73]. It should be noted that the cultivation methods do not reflect the real picture of the metabolic processes in the microbial community and that these results should be interpreted more fully when considering the data from the fluorescent in situ hybridization analysis.
In the variant Ph, the quantity of Pseudomonas and Acinetobacter bacteria increased at the 48th hour (Figure 4b). This leads us to infer the exclusive role of both types of bacteria, the quantities of which determine their metabolic capacity to eliminate pollutants of different natures in the microbial community. These results coincide with the research of a number of authors, according to whom the adaptation of microbial communities to the biodegradation of toxic pollutants in concentrations that are close to critical involves the number of microorganisms of the genus Pseudomonas and Acinetobacter increasing; these are the main component of the culturable xenobiotic-degrading complex [72,74,75]. In our case, the bacteria of the genus Acinetobacter had a numerical advantage, during the whole process, over the bacteria of the genus Pseudomonas. In both groups there was a decrease in the number of cultured bacteria after the high intoxication shock at the 214th hour.
The bacteria of the genus Acinetobacter and especially those within the group of phenol-degrading bacteria remained present in relatively large quantities at the 214th hour. In contrast, the pseudomonads lost their leading role in biodetoxification. This is probably due to competition for substrates and electronic acceptors. Despite the smaller number of these bacteria, it is possible that they showed higher biodegradation activity. The quantity of cultured pseudomonads may be reduced by increasing the amount and activity of non-culturable Pseudomonas. The literature shows that both mechanisms are in force and that these two mechanisms are usually combined [30,72]. The community intensifies its biodegradation activity at the expense of the simultaneous manifestation of the following biological mechanisms:
(1)
In the early phase (at the 48th hour—in the biodegradation process while at phenol concentrations that are close to critical) of adaptation to low phenol concentrations, microbial communities respond by increasing the quantity of microorganisms from the key groups for the biodegradation process.
(2)
In the late phase (after the intoxication shock and the start of the readaptation process) after prolonged adaptation to high concentrations of xenobiotics that are close to a critical level, the adaptive response is more complex and highly specialized. Synergistic relationships and zones are formed in the communities with high oxygenase enzyme activity, formation of mature biofilm with zones with high biodegradation activity and other similar mechanisms. In this case, the quantity of culturable microorganisms is not the only adaptive response. For the genera Pseudomonas and Acinetobacter, the mechanisms that are associated with increased activity to degrade the xenobiotic are valid.
The genera Pseudomonas and Acinetobacter were studied by fluorescence in situ hybridization analysis. Bacteria of the genus Pseudomonas and the genus Acinetobacter have been selected as key microorganisms due to their importance in the biodegradation of xenobiotics. It is known that microorganisms from these two genera can use alternative pathways for energy supply and this property gives them more opportunities to develop resistance and reach their detoxification potential [72].
From the data in Figure 5 for the percentage of non-culturable bacteria of the genus Pseudomonas, in relation to the total number of microorganisms that were stained with DAPI, it was found that at the beginning of the process at the 0th hour the non-culturable Pseudomonas bacteria numbered 11.46%, while the non-culturable Acinetobacter numbered 16.61%. These results from the beginning of the process are correlated with the results for the non-culturable bacteria of these two genera, where bacteria of the genus Acinetobacter were dominant. At the 48th hour, the pseudomonads responded with an increase in their percentage, reaching 22.81%, while the genus Acinetobacter decreased its presence to 7.95%. After the explosive addition of phenol at the 72nd hour and after a certain period of readaptation of the sedimentary microbial communities, at the 144th hour there was a change in the dominant genus. Bacteria of the genus Acinetobacter increased their percentage to 17.72%. Pseudomonads decreased their presence to 9.52%. At the end of the study process at the 214th hour, the genus Acinetobacter maintained its higher percentage by 15.57%, compared to 6.99% for the genus Pseudomonas. These results are identical to those that were obtained for the culturable bacteria, where again the genus Acinetobacter had a leading role in the biodegradation of the phenol.

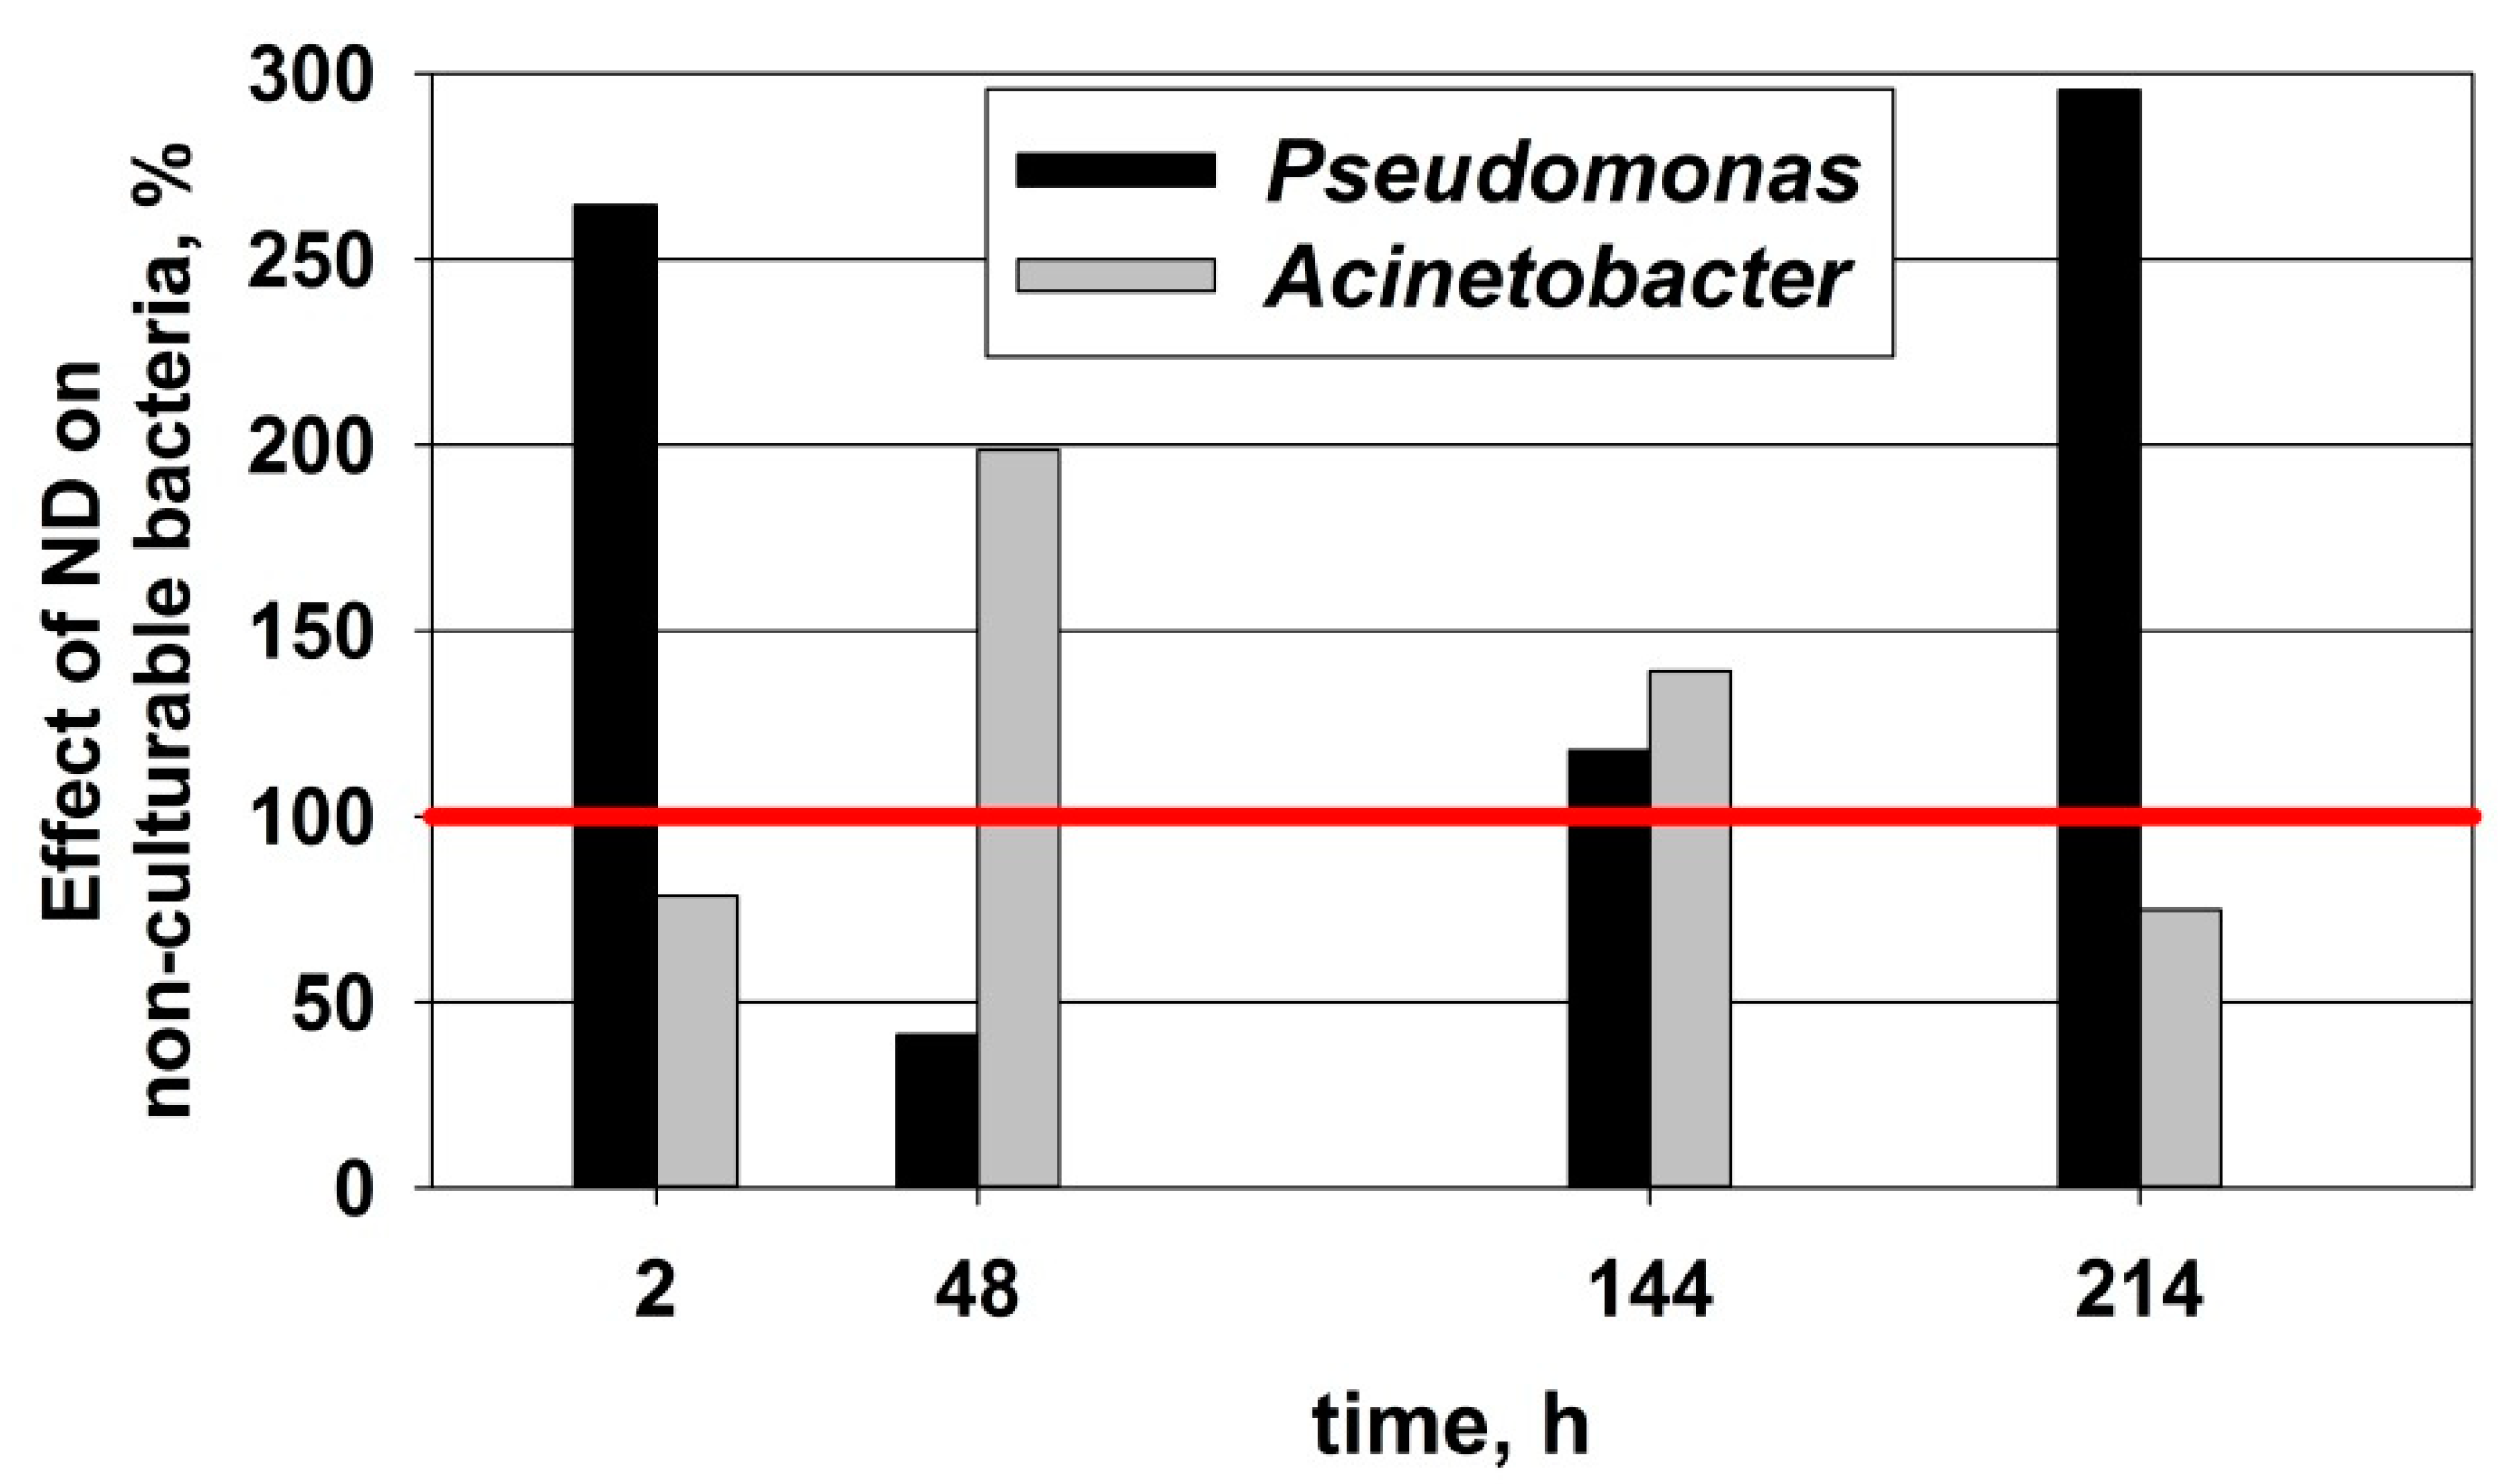
3.4. Relationship of Culturable and Non-Culturable Microorganisms during Adaptation with the Participation of ND

The quantity of aerobic heterotrophs at the 0th and 48th hours was found to be higher in the PhND variant, a result which was probably influenced by the ND that were added to the system (Figure 6a). This peak in the quantity of aerobic heterotrophs was followed by a sharp decrease at the 214th hour. The stimulating effect of the ND at the 48th hour was due to the fact that there was a high concentration of trivial substrates in the system. On the other hand, due to the adsorption of phenol on the ND and in the “micelles” its toxic effect on the other microorganisms, in this case the complex of aerobic heterotrophs, was reduced.
The phenol-degrading microorganisms, during the biodegradation process, increased their quantity, despite the intoxication shock (Figure 6a). In the microbial consortium at the 214th hour, their number was the largest in both variants. At this time, microbial restructuring processes had already taken place and processes of a specific enzymatic response to phenol were likely to take place in the microbial communities. In the control variant Ph, the quantity of cultured phenol-degrading microorganisms exceeded that which was present in the variant with ND at the 48th and 214th hours. It should be noted that the culture methods do not reflect the real situation of the metabolic processes in the microbial community and that these results should be interpreted more fully in the section on the application of fluorescent in situ hybridization analysis.
The data that are presented in Figure 6b also establish the influence of ND on two important taxonomic groups of bacteria—Pseudomonas and Acinetobacter. Nanodiamonds, at the 48th hour, had a positive effect on the development of bacteria of the genus Acinetobacter, but at the 214th hour their quantity was negatively affected in the control variant Ph. At the 48th hour there was a peak in the quantity of Acinetobacter and a decrease in the number of bacteria at the 214th hour. This peak was probably due to the increased bioavailability of pollutants in the system, both trivial and xenobiotic. In this case, ND led to the strong stimulation of the bacteria of the genus Acinetobacter at the 48th hour and their inhibition at the 214th hour, while the nanoparticles caused a decrease in the bacteria of the genus Pseudomonas at the 48th hour and had almost no effect on their amount at the 214th hour. The change in the dominant role of these two bacterial genera in terms of the characteristics of the detoxification process was again confirmed. Here, most likely, the specific mechanisms that are a response to community adaptation have been activated. However, here we have to emphasize—these are only culturable bacteria from both genera.
As a brief summary, when monitoring the quantity of the bacteria from the xenobiotic-degrading complex (genus Pseudomonas and genus Acinetobacter as well as phenol-degrading microorganisms) it was found that, after the explosive load in the 48th hour, the bacterial segment changed as follows:
  • The genus Pseudomonas reduced their quantity. In this standard method of studying microbial cenosis, ND inhibited the growth and adaptation of culturable bacteria of this genus within 48 h.
  • At the 48th hour, the other two physiological and taxonomic groups increased their populations of culturable bacteria, namely Acinetobacter and the phenol-degrading microorganisms. Bacteria of the genus Acinetobacter played a leading role in the bioremediation of the phenol-contaminated sediments. These bacteria have occupied this ecological niche and there was an increase in their population compared to the observed decline in the quantity of bacteria of the genus Pseudomonas.
From the data that are presented in Figure 7, the percentage of non-culturable bacteria from Acinetobacter was found to be 16.61% at the 0th hour, while for Pseudomonas it was 11.47%. These results for the start of the process are correlated with the results for culturable bacteria of these two genera, where the dominant bacteria were Acinetobacter. At the 48th hour, the pseudomonads responded by reducing their percentage to 9.40%, while the Acinetobacter decreased to 15.80%. After the explosive addition of phenol at the 72th hour and after a certain period of readaptation of the sediment microbial communities at the 144th hour, the genus Acinetobacter’s tendency to predominate was preserved. The bacteria of the genus Acinetobacter increased their percentage to 24.68% at the 144th hour. The pseudomonads also increased their percentage to 11.21% by the 144th hour. At the end of the process at the 214th hour, genus Pseudomonas played a dominant role at 20.69% compared to 11.66% for the genus Acinetobacter. These results are in contrast to those of the culturable bacteria, where the genus Acinetobacter played a leading role in the biodegradation of the phenol at the end of the process.

3.5. Effect of ND on the Restructuring of the Microbial Community

Table 3 presents the effect of ND on the amounts of the key groups of microorganisms that were present at the 48th hour of the biodegradation process compared to those that were present at the same time in the control variant Ph. In this phase, the nanomodulator, as we have already established, had the strongest influence on the initial adaptation to the degradation of pollutants and had a positive effect on the quantitative growth of the aerobic heterotrophs and bacteria of the genus Acinetobacter. The aerobic heterotrophs and bacteria of the genus Acinetobacter had the largest percentage increases, 33.87% and 74.65%, respectively.
The largest decrease was registered in the percentage of the bacteria of the genus Pseudomonas (−76.30%) and the phenol-degrading microorganisms (−60.61%) (Table 3). Phenol-degrading microorganisms and especially bacteria of the genus Pseudomonas have a plastic metabolism for the degradation of trivial organics and they play a key role in the degradation of xenobiotics [72,76,77]. In this case, in microbial restructuring, ND activate the degradation of organic matter by heterotrophic microorganisms and ND have positively stimulated bacteria of the genus Acinetobacter from the xenobiotic-degrading complex.
Under the modulating effect of the ND, the largest percentage negative change in the 214th hour was registered by the phenol-degrading bacteria (−75.35%) (Table 3). At the same time, the aerobic heterotrophs decreased by −19.45% compared to the control variant Ph (Table 3).
At the 214th hour, the ND stimulated the Pseudomonas bacteria by 71.83%. At the same time (the 214th hour), the phenol-degrading microorganisms and bacteria of the genus Acinetobacter decreased by 75.35% and 37.58%, respectively. Bacteria of the genus Pseudomonas are also involved in the processes of organic transformation, but here they probably played a significant role in the biodegradation of phenol when the trivial substrates were depleted (Table 3).
During the experiment, dynamic changes in the development and restructuring of the microbial community were found in both of the variants. The effect of the ND, as compared to the control variant, was registered in the 48th hour within bacteria of the genus Acinetobacter (+74.65%) and the aerobic heterotrophic bacteria increased by about 30%. At the 214th hour, the bacteria of the genus Pseudomonas increased by 71.83%, compared to the control variant. These changes are related to microheterogeneity, due to nanoparticles, oxygen access, the number of bacteria and the influence of the toxic agent.
The discussed microbiological dependences are reflected and associated with the changes in the kinetic parameters of the process of biodegradation of phenol and the bioremediation of the sediments and also with the changes in the enzymatic profile; the role of non-culturable microorganisms in sedimentary communities [72]. Comprehensive interpretation of this information is a key tool for use in future algorithms for managing risk situations stemming from the explosive and accumulative loading of sediments with toxic pollutants.
From the data that are presented in Figure 8, it could be concluded that the nanodiamonds had a positive effect on the density of the microorganisms of the genus Pseudomonas at the 144th and 214th hour (+17.71% and +195.54%, respectively). At the end of the biodegradation process, a peak in the density of bacteria of the genus Pseudomonas was reached, which means that the system had already adapted and could degrade the phenol that was present in the sediments. The ND helped the microbial system to stay active for longer, i.e., there was an increase in the readiness of the pseudomonads to degrade the toxicant. In the control variant, the density was highest at the 48th hour, but the distribution of the microorganisms was uneven, without the clear formation of microbial structures. These structures and clusters are the most likely places (zones), or micro-niches, where phenolic biodegradation is enhanced at the expense of the synergetic relationships that are formed there. These assumptions are supported by the kinetic parameters of phenolic biodegradation, enzyme activity and other data from researchers working with amaranth, pentachlorophenol and other toxic pollutants [72,74,75,78].
From the data that are presented in Figure 8, it could be concluded that the ND had a positive effect on the density of Acinetobacter microorganisms at the 48th and 144th hours. Comparing the results that are presented in Figure 8, it can be concluded that a clear synergism was registered in the hours of the strongest adaptation of the bacteria of the two target genera in the ND variant. The ND had their strongest effect on the genus Acinetobacter at the 48th hour, while for bacteria of the genus Pseudomonas the effect was the strongest at the 214th hour These results can be considered as a response to the microbial system, which through its smooth restructuring adapts to toxic shock. The development of this synergism and metabolic succession in the activity of the two target genera can be considered as a successful adaptation of the microbial community to effectively cope with the toxic effects of high concentrations of phenol and its adaptation to subsequent biodegradation.
Judging by the photographic material detailing the bacteria of the genus Pseudomonas at the 48th hour in the PhND variant, accumulations of a small size and rather dispersed locations of the bacteria of the target genus were reported (Table 4). At the 144th hour, the genus Pseudomonas showed stronger fluorescence (compared to the 48th hour), corresponding to its increased metabolic activity. Clusters of increased size were found, which is an indication of the development of cooperative and synergetic relationships. These relationships are connected with improved and increased target activity. In this case this activity was the increased detoxification of phenol. At the 214th hour, well-formed accumulations of microorganisms were established—an indication of established synergetic relationships in the biodegradation community. At the end of the experiment, high-intensity fluorescence was detected in the PhND variant, which indicates high levels of density and activity of Pseudomonas spp. in the microbial community. At the 214th hour, an inverse relationship was found when comparing the cultured and non-cultured microorganisms (Figure 9). Pseudomonas spp. predominated among the non-culturable ones, while Acinetobacter spp. predominated among the culturable ones (Figure 9).
The corresponding photographic material for the genus Acinetobacter recorded low fluorescence at the 2nd hour, corresponding to low metabolic activity of the target group (Table 4). At the 48th hour, a relatively strong fluorescence and strong clustering of the genus Acinetobacter was recorded, showing the activation of the population of these microorganisms in the biofilm. An increase in the quantity of the target microorganisms was observed at the 144th hour, but the clustering was not as compact as it was at the 48th hour. It can be assumed that at this time bacteria of the genus Acinetobacter had high activity with respect to the biodegradation of the xenobiotic, but the synergistic relationships in this group were not so well established. An explanation can be found in the assumption that ND have a positive stimulation on the development of the adaptive potential of the genus Acinetobacter. Accumulations of the microorganisms were registered at the 214th hour, but the clusters were reduced in size and their fluorescence was reduced in intensity compared to that which was observed at the 144th hour. The addition of ND helped to overcome the early toxic shock by increasing the amount of non-culturable bacteria of the genus Acinetobacter, especially at the 48th and 144th hours (Figure 9). This led to an increase in the number of synergistic relationships and the ability of the sediment microbial communities to reactivate their biodegradation detoxification potential. At the same time, Pseudomonas spp. played the largest role in the late adaptation. The clear proof of this was the significant clustering that was observed at the 214th hour. At the 214th hour, the Pseudomonas spp. prevailed as culturable and non-culturable bacteria, probably with high detoxification activity.

4. Conclusions

The adaptive response of microbial communities to the biodegradation of phenol at low concentrations (close to critical, about 250 mg/kg) manifests itself as the multiplication of culturable bacteria and an increase in AeH (by 33.87%) and Ac. (by 74.65%) as well as a relatively well-developed non-culturable microbial segment of Pseudomonas and Acinetobacter in the presence of the ND.
In the case of the modelled explosive or accumulative contamination of sediments with phenol in concentrations many times higher than that which is considered critical (in the case of phenol up to 835 mg/kg), the sediment communities fell into intoxication shock. This requires a technological, physicochemical or bioremediation reduction of the concentration of the toxicant and the chosen approach to this is critical for the community. ND as an augmentation factor improved the parameters of the adaptation to and biodegradation of the toxic pollutants: they increased RB by 19%, Eff by 13%, and activated the increase in the amount of Ps. (culturable) by 72% after the intoxication shock. In long-term adaptation processes, the presence of ND when associated with high phenol intoxication and readaptation led to the evolution of the xenobiotic biodegradation potential. This was done by increasing the relative part of non-culturable Ac. (FISH) (at the 48th and 144th hours) and Ps (FISH) (at the 144th and 214th hours). In parallel, ND presence increased the cometabolic and synergistic relationships in the xenobiotic-degrading consortium. ND increased the relative part of Ac. (FISH) by 98.98% at the 48th hour and by 39.94% at the 144th hour, it also increased the relative part of Ps. (FISH) at the 144th and 214th hours (by +17.71% and +195.54%, respectively). The reasons for these results are complex—including the deeper anaerobic conditions in clusters of ND and the greater ability of Acinetobacter and especially Pseudomonas to use alternative energy sources to overcome intoxication. In conclusion, it was found that ND accelerated the detoxification processes and their effect was higher in risky situations that involve explosive pollution with extremely high concentrations of xenobiotics. This effect from nanoparticles is extremely important for the effective implementation of bioremediation in river sediments. The results that were obtained could be used as a reference for similar studies for lake and dam sediments, as well as for dewatered sludge from wastewater treatment plants. Nanodiamonds could also be used as nanomodulators in future experiments on the biodegradation of xenobiotics such as nitrophenols and pentachlorophenol.

Author Contributions

Conceptualization, Y.T. (Yana Topalova); methodology, I.Y., M.B. and E.D.; data collection—I.Y.; A.F. and I.S.; software, I.Y.; kinetic parameters, I.Y., N.D. and I.S.; microbiological analysis, I.Y., E.D. and Y.T. (Yovana Todorova); FISH analyses—M.B., I.Y., N.D. and A.F.; writing—original draft preparation, I.Y.; writing—review and editing, Y.T. (Yana Topalova), Y.T. (Yovana Todorova) and M.B.; visualization, I.Y.; project administration, Y.T. (Yana Topalova). All authors have read and agreed to the published version of the manuscript.

Funding

This paper was supported by the Grant № BG05M2OP001-1.002-0019: “Clean Technologies for Sustainable Environment—Waters, Waste, Energy for a Circular Economy”, financed by the Science and Education for Smart Growth Operational Program (2014–2020) and co-financed by the EU through the ESIF by means of financing the labor.

Data Availability Statement

The data that are presented in this study are available on request from the corresponding author.

Acknowledgments

This work has been carried out in the framework of the National Science Program “Environmental Protection and Reduction of Risks of Adverse Events and Natural Disasters”, approved by the Resolution of the Council of Ministers № 577/17.08.2018, and supported by the Ministry of Education and Science (MES) of Bulgaria (Agreement № D01-322/18.12.2019).

Conflicts of Interest

The authors declare no conflict of interest.

References

  1. Carere, M.; Marcheggiani, S.; Miniero, R.; Pilozzi, A.; Mancini, L. Risk Assessment Elements for the Management of Contaminated Sediments. Preface. Ann. Del’istituto Super. Di Sanità 2008, 44, 217. [Google Scholar]
  2. De Groot, R.S. Functions of Nature: Evaluation of Nature in Environmental Planning, Management and Decision-Making; Wolters Noordhoff BV: Groningen, The Neatherlands, 1992. [Google Scholar]
  3. Heise, S. Risk management of sediments. Ann. Ist. Super. Sanità 2008, 44, 224–232. [Google Scholar] [PubMed]
  4. Heise, S.; Apitz, S.E.; Babut, M.; Bergmann, H.; Besten, P.D.; Ellen, G.J.; Joziasse, J.; Katsiri, A.; Maaß, V.; Oen, A.; et al. Risk management of sediments and communication. Synthesis of the SedNet working group 5 outcomes. J. Soils Sediments 2004, 4, 233–235. [Google Scholar] [CrossRef]
  5. Salomons, W.; Brils, J. Contaminated Sediments in European River Basins; European Sediment Research Network SedNet. EC Contract No. EVKI-CT-2001-20002, Key Action 1.4. 1 Abatement of Water Pollution from Contaminated Land, Landfills and Sediments; TNO: Den Helder, The Netherlands, 2004. [Google Scholar]
  6. Marcheggiani, C.; Mancini, L. Microbiological Quality of River Sediments and Primary Prevention. In Ecosystems Biodiversity; Grillo, O., Venora, G., Eds.; IntechOpen: London, UK, 2011. [Google Scholar]
  7. Jones, J.G. Some differences in the microbiology of profundal and littoral lake sediments. Microbiology 1980, 117, 285–292. [Google Scholar] [CrossRef] [Green Version]
  8. Kuznezow, S.I. Die Rolle der Mikroorganismen im Stoffkreislauf der Seen; Deutscher Verlag d. Wissenschaften: Berlin, Germany, 1959; p. 301. [Google Scholar]
  9. Rheinheimer, G. Aquatic Microbiology, 4th ed.; John Wiley & Sons: Hoboken, NJ, USA, 1992; p. 362. [Google Scholar]
  10. Lincheva, S.; Todorova, Y.; Topalova, Y. Spatial and seasonal fluctuations in microbial segment of Iskar River in the part of cascade of mini-hydroelectric power stations “Middle Iskar”. In Proceedings of the Youth Scientific Conference “Klimentovi Dni, Sofia Bulgaria, 22–23 November 2010; Volume 1, pp. 46–50. [Google Scholar]
  11. Yotinov, I.; Lincheva, S.; Kenderov, L.; Schneider, I.; Topalova, Y. Functional Structure of Microbial Communities—Mechanism for Management of Biotransformation Processes in the Sediments. In Proceedings of the International Conference Ecology—Interdisciplinary Science and Practice, Sofia, Bulgaria, 25–26 October 2012; Volume 1, pp. 100–107. [Google Scholar]
  12. Lincheva, S. Algorithms for Biocontrol of the Transformation Processes in the Sediments of the Iskar River in the Area of the Cascade of Middle Middle Iskar. Ph.D. Disertation, Sofia University “St. Kliment Ohridski”, Sofia, Bulgaria, 2015; p. 181. [Google Scholar]
  13. Yotinov, I.; Lincheva, S.; Kenderov, L.; Schneider, I.; Topalova, Y. Evaluation of the self-purification in the waters of the micro-dams in the small hydroelectric power plants (hepps) Lakatnik and Svrazhen: Potential of the bioalgorithms. Bulg. J. Agric. Sci. 2013, 19, 135–138. [Google Scholar]
  14. Paisio, C.E.; Talano, M.A.; González, P.S.; Pajuelo-Domínguez, E.; Agostini, E. Characterization of a phenol-degrading bacterium isolated from an industrial effluent and its potential application for bioremediation. Environ. Technol. 2013, 34, 485–493. [Google Scholar] [CrossRef] [PubMed]
  15. Krastanov, A.; Alexieva, Z.; Yemendzhiev, H. Microbial degradation of phenol and phenolic derivatives. Eng. Life Sci. 2013, 13, 76–87. [Google Scholar] [CrossRef]
  16. Qiao, M.; Wang, C.; Huang, S.; Wang, D.; Wang, Z. Composition, sources, and potential toxicological significance of PAHs in the surface sediments of the Meiliang Bay, Taihu Lake, China. Environ. Int. 2006, 32, 28–33. [Google Scholar] [CrossRef]
  17. WHO. International Programme on Chemical Safety (IPCS); Environmental Health Criteria 161 Phenol; World Health Organization (WHO): Geneva, Switzerland, 1994. [Google Scholar]
  18. Topalova, Y.; Dimkov, R. Biodegradation of Xenobiotics; Faculty of Biology, Sofia University “St. Kliment Ohridski”: Sofia, Bulgaria, 2003; p. 120. [Google Scholar]
  19. Asenova, M.; Topalova, Y.; Dimkov, R. Validation of TTC-dehydrogenase activity method for measurement of bioremediation potencial of plankton community in oil contaminated ponds. Biotechnol. Biotechnol. Equip. 2003, 17, 16–26. [Google Scholar]
  20. Nair, C.I.; Jayachandran, K.; Shashidhar, S. Biodegradation of phenol. Afr. J. Biotechnol. 2008, 7, 25. [Google Scholar]
  21. Haack, S.K.; Bekins, B.A. Microbial populations in contaminant plumes. Hydrogeol. J. 2000, 8, 63. [Google Scholar] [CrossRef]
  22. Madsen, E.L. Nucleic-acid characterization of the identity and activity of subsurface microorganisms. Hydrogeol. J. 2000, 8, 112. [Google Scholar] [CrossRef]
  23. Amann, R.; Ludwig, W. Ribosomal RNA-targeted nucleic acid probes for studies in microbial ecology. FEMS Microbiol. Rev. 2000, 24, 555–565. [Google Scholar] [CrossRef] [PubMed]
  24. Amann, R.I.; Ludwig, W.; Schleifer, K.H. Phylogenetic identification and in situ detection of individual microbial cells without cultivation. Microbiol. Rev. 1995, 59, 143–169. [Google Scholar] [CrossRef] [PubMed]
  25. MacGregor, B.J. Molecular approaches to the study of aquatic microbial communities. Curr. Opin. Biotechnol. 1999, 10, 220–224. [Google Scholar] [CrossRef]
  26. Magrez, A.; Kasas, S.; Salicio, V.; Pasquier, N.; Seo, J.W.; Celio, M.; Forró, L. Cellular toxicity of carbon-based nanomaterials. Nano Lett. 2006, 6, 1121–1125. [Google Scholar] [CrossRef] [PubMed]
  27. Muyzer, G.; Smalla, K. Application of denaturing gradient gel electrophoresis (DGGE) and temperature gradient gel electrophoresis (TGGE) in microbial ecology. Antonie Van Leeuwenhoek 1998, 73, 127–141. [Google Scholar] [CrossRef] [PubMed]
  28. Muyzer, G. DGGE/TGGE a method for identifying genes from natural ecosystems. Curr. Opin. Microbiol. 1999, 2, 317–322. [Google Scholar] [CrossRef]
  29. Aktan, S.; Salih, B.A. Fluorescent in situ hybridization (FISH) for the detection of bacterial community in activated sludge from textile factories. Environ. Technol. 2006, 27, 63–69. [Google Scholar] [CrossRef] [PubMed]
  30. Belouhova, M.; Schneider, I.; Chakarov, S.; Ivanova, I.; Topalova, Y. Microbial community development of biofilm in Amaranth decolourization technology analysed by FISH. Biotechnol. Biotechnol. Equip. 2014, 28, 635–642. [Google Scholar] [CrossRef] [PubMed]
  31. Nielsen, H.; Daims, H.; Lemmer, H. FISH Handbook for Biological Wastewater Treatment: Identification and Quantification of Microorganisms in Activated Sludge and Biofilms by FISH; IWA Publishing: London, UK, 2009; p. 200. ISBN 9781843392316. [Google Scholar]
  32. Amann, R.I.; Krumholz, L.; Stahl, D.A. Fluorescent-oligonucleotide probing of whole cells for determinative, phylogenetic, and environmental studies in microbiology. J. Bacteriol. 1990, 172, 762–770. [Google Scholar] [CrossRef] [PubMed] [Green Version]
  33. Breuker, A.; Köweker, G.; Blazejak, A.; Schippers, A. The deep biosphere in terrestrial sediments in the Chesapeake Bay area, Virginia, USA. Front. Microbiol. 2011, 2, 156. [Google Scholar] [CrossRef] [PubMed] [Green Version]
  34. Tischer, K.; Zeder, M.; Klug, R.; Pernthaler, J.; Schattenhofer, M.; Harms, H.; Wendeberg, A. Fluorescence in situ hybridization (CARD-FISH) of microorganisms in hydrocarbon contaminated aquifer sediment samples. Syst. Appl. Microbiol. 2012, 35, 526–532. [Google Scholar] [CrossRef] [PubMed]
  35. Langendijk, P.S.; Schut, F.; Jansen, G.J.; Raangs, G.C.; Kamphuis, G.R.; Wilkinson, M.H.; Welling, G.W. Quantitative fluorescence in situ hybridization of Bifidobacterium spp. with genus-specific 16S rRNA-targeted probes and its application in fecal samples. Appl. Environ. Microbiol. 1995, 61, 3069–3075. [Google Scholar] [CrossRef] [PubMed] [Green Version]
  36. Suárez-Suárez, A.; López-López, A.; Tovar-Sánchez, A.; Yarza, P.; Orfila, A.; Terrados, J.; Rosselló-Móra, R. Response of sulfate-reducing bacteria to an artificial oil-spill in a coastal marine sediment. Environ. Microbiol. 2011, 13, 1488–1499. [Google Scholar] [CrossRef] [PubMed]
  37. Grenni, P.; Gibello, A.; Caracciolo, A.B.; Fajardo, C.; Nande, M.; Vargas, R.; Martín, M. A new fluorescent oligonucleotide probe for in situ detection of s-triazine-degrading Rhodococcus wratislaviensis in contaminated groundwater and soil samples. Water Res. 2009, 43, 2999–3008. [Google Scholar] [CrossRef] [PubMed]
  38. Kleikemper, J.; Pombo, S.A.; Schroth, M.H.; Sigler, W.V.; Pesaro, M.; Zeyer, J. Activity and diversity of methanogens in a petroleum hydrocarbon-contaminated aquifer. Appl. Environ. Microbiol. 2005, 71, 149–158. [Google Scholar] [CrossRef] [PubMed] [Green Version]
  39. Pombo, S.A.; Kleikemper, J.; Schroth, M.H.; Zeyer, J. Field-scale isotopic labeling of phospholipid fatty acids from acetate-degrading sulfate-reducing bacteria. FEMS Microbiol. Ecol. 2005, 51, 197–207. [Google Scholar] [CrossRef] [PubMed] [Green Version]
  40. Rogers, S.W.; Ong, S.K.; Moorman, T.B. Mineralization of PAHs in coal–tar impacted aquifer sediments and associated microbial community structure investigated with FISH. Chemosphere 2007, 69, 1563–1573. [Google Scholar] [CrossRef] [PubMed]
  41. Ficker, M.; Krastel, K.; Orlicky, S.; Edwards, E. Molecular characterization of a toluene-degrading methanogenic consortium. Appl. Environ. Microbiol. 1999, 65, 5576–5585. [Google Scholar] [CrossRef] [Green Version]
  42. Kleikemper, J.; Pelz, O.; Schroth, M.H.; Zeyer, J. Sulfate-reducing bacterial community response to carbon source amendments in contaminated aquifer microcosms. FEMS Microbiol. Ecol. 2002, 42, 109–118. [Google Scholar] [CrossRef] [PubMed]
  43. Pombo, S.A.; Pelz, O.; Schroth, M.H.; Zeyer, J. Field-scale 13C-labeling of phospholipid fatty acids (PLFA) and dissolved inorganic carbon: Tracing acetate assimilation and mineralization in a petroleum hydrocarbon-contaminated aquifer. FEMS Microbiol. Ecol. 2002, 41, 259–267. [Google Scholar] [CrossRef] [PubMed]
  44. Anneser, B.; Pilloni, G.; Bayer, A.; Lueders, T.; Griebler, C.; Einsiedl, F.; Richters, L. High resolution analysis of contaminated aquifer sediments and groundwater—what can be learned in terms of natural attenuation? Geomicrobiol. J. 2010, 27, 130–142. [Google Scholar] [CrossRef]
  45. Griebler, C.; Mindl, B.; Slezak, D.; Geiger-Kaiser, M. Distribution patterns of attached and suspended bacteria in pristine and contaminated shallow aquifers studied with an in situ sediment exposure microcosm. Aquat. Microb. Ecol. 2002, 28, 117–129. [Google Scholar] [CrossRef] [Green Version]
  46. Albrechtsen, H.J.; Winding, A. Microbial biomass and activity in subsurface sediments from Vejen, Denmark. Microb. Ecol. 1992, 23, 303–317. [Google Scholar] [CrossRef] [PubMed]
  47. Fera, M.T.; Gugliandolo, C.; Lentini, V.; Favaloro, A.; Bonanno, D.; La Camera, E.; Maugeri, T.L. Specific detection of Arcobacter spp. in estuarine waters of Southern Italy by PCR and fluorescent in situ hybridization. Lett. Appl. Microbiol. 2010, 50, 65–70. [Google Scholar] [CrossRef] [PubMed]
  48. Holm, P.E.; Nielsen, P.H.; Albrechtsen, H.J.; Christensen, T.H. Importance of unattached bacteria and bacteria attached to sediment in determining potentials for degradation of xenobiotic organic contaminants in an aerobic aquifer. Appl. Environ. Microbiol. 1992, 58, 3020–3026. [Google Scholar] [CrossRef] [PubMed] [Green Version]
  49. Madsen, E.L.; Ghiorse, W.C. Aquatic Microbiology—An Ecological Approach; Ford, T.E., Ed.; Blackwell Scientific Publication: Hoboken, NJ, USA, 1993; pp. 167–213. [Google Scholar]
  50. Brad, T.; Van Breukelen, B.M.; Braster, M.; Van Straalen, N.M.; Röling, W.F. Spatial heterogeneity in sediment-associated bacterial and eukaryotic communities in a landfill leachate-contaminated aquifer. FEMS Microbiol. Ecol. 2008, 65, 534–543. [Google Scholar] [CrossRef] [PubMed]
  51. Chang, Y.R.; Lee, H.Y.; Chen, K.; Chang, C.C.; Tsai, D.S.; Fu, C.C.; Fann, W. Mass production and dynamic imaging of fluorescent nanodiamonds. Nat. Nanotechnol. 2008, 3, 284–288. [Google Scholar] [CrossRef] [PubMed]
  52. Market Publishers. The Global Market for Nanodiamonds 2020–2030; Future Markets Inc.: London, UK, 2021; p. 114. [Google Scholar]
  53. Dolmatov, V.Y.; Ozerin, A.N.; Kulakova, I.I.; Bochechka, O.O.; Lapchuk, N.M.; Myllymäki, V.; Vehanen, A. Detonation nanodiamonds: New aspects in the theory and practice of synthesis, properties and applications. Russ. Chem. Rev. 2020, 89, 1428. [Google Scholar] [CrossRef]
  54. Yotinov, I.; Todorova, Y.; Schneider, I.; Daskalova, E.; Topalova, Y. The effect of nanodiamonds on phenol biodegradation by Pseudomonas sp. strain isolated from polluted sediments. J. Nanosci. Nanotechnol. 2016, 16, 7696–7706. [Google Scholar] [CrossRef]
  55. Perevedentseva, E.; Cheng, C.Y.; Chung, P.H.; Tu, J.S.; Hsieh, Y.H.; Cheng, C.L. The interaction of the protein lysozyme with bacteria E. coli observed using nanodiamond labelling. Nanotechnology 2007, 18, 315102. [Google Scholar] [CrossRef]
  56. Huang, H.; Pierstorff, E.; Osawa, E.; Ho, D. Active nanodiamond hydrogels for chemotherapeutic delivery. Nano Lett. 2007, 7, 3305–3314. [Google Scholar] [CrossRef] [PubMed]
  57. Lee, J.; Jaeeun, K.; Jaeyoung, K.; Hyorang, K. Novel Electrode for Water Purification based on Nanodiamonds. In ECS Meeting Abstracts; IOP Publishing: Bristol, UK, 2011; Volume 38, p. 2346. [Google Scholar]
  58. Cordova-Rosa, S.M.; Dams, R.I.; Cordova-Rosa, E.V.; Radetski, M.R.; Corrêa, A.X.R.; Radetski, C.M. Remediation of phenol-contaminated soil by a bacterial consortium and Acinetobacter calcoaceticus isolated from an industrial wastewater treatment plant. J. Hazard. Mater. 2009, 164, 61–66. [Google Scholar] [CrossRef] [PubMed]
  59. ISO. BDS EN ISO 6439-1990 Water Quality—Determiantion of Phenol Index—4-Aminoantipyrine Spectrophotometric Methods after Distillation; ISO: Geneva, Switzerland, 1990. [Google Scholar]
  60. Kopp, J.F.; McKee, G.D. Methods for Chemical Analysis of Water and Wastes; US Environmental Protection Agency: Washington, DC, USA, 1983; p. 491.
  61. Kuznetzov, S.I.; Dubinina, G. Methods of Investigation of Water Microorganisms; Acad. Sc. USSR: Moskow, Russia, 1989. [Google Scholar]
  62. Furukawa, K.; Simon, J.R.; Chakrabarty, A.M. Common induction and regulation of biphenyl, xylene/toluene, and salicylate catabolism in Pseudomonas paucimobilis. J. Bacteriol. 1983, 154, 1356–1362. [Google Scholar] [CrossRef] [PubMed] [Green Version]
  63. Belouhova, M.; Topalova, Y. Structural and functional changes in biofilm during adaptation towards amaranth biodegradation. Biotechnol. Biotechnol. Equip. 2021, 35, 1769–1777. [Google Scholar] [CrossRef]
  64. Belouhova, M.; Dinova, N.; Yotinov, I.; Lincheva, S.; Schneider, I.; Topalova, Y. FISH investigation of the bacterial groups anammox and Azoarcus-Thauera at treatment of landfill leachate. Bulg. Chem. Commun. 2021, 53, 27. [Google Scholar] [CrossRef]
  65. Loy, A.; Maixner, F.; Wagner, M.; Horn, M. probeBase—an online resource for rRNA-targeted oligonucleotide probes: New features 2007. Nucleic Acids Res. 2007, 35, D800–D804. [Google Scholar] [CrossRef] [PubMed] [Green Version]
  66. Schleifer, K.-H.; Amann, R.; Ludwig, W.; Rothemund, C.; Springer, N.; Dorn, S. Nucleic acid probes for the identification and in situ detection of pseudomonads. In Pseudomonas: Molecular Biology and Biotechnology; Galli, E., Silver, S., Witholt, B., Eds.; American Society for Microbiology: Washington, DC, USA, 1992; pp. 127–134. [Google Scholar]
  67. Stavrev, S.; Karaguiozova, Z.; Karadjov, Y.; Dragieva, I. Formation of Metal layer—Covers on Nanodiamonds Powder. In Proceedings of the 7th Workshop Nanoscience & Nanotechnology, Sofia, Bulgaria, 25–26 November 2005. [Google Scholar]
  68. Yur’ev, G.S.; Dolmatov, V.Y. X-ray diffraction study of detonation nanodiamonds. J. Superhard Mater. 2010, 32, 311–328. [Google Scholar] [CrossRef]
  69. Prokhorov, V.; Kulibaba, V.; Korobov, A.; Stavrev, S.; Kolev, S. Preparation and microstructure, elasticity and hardness investigation of alalloy/nanodiamonds composite. In Proceedings of the 8th International Congress-Mashines, Technologies Materials, Varna, Bulgaria, 18–21 September 2011; Volume 2, pp. 86–89. [Google Scholar]
  70. Yotinov, I.; Todorova, Y.; Schneider, I.; Daskalova, E.; Topalova, Y. Comparison of the Influence of Nanodiamonds and Single-Walled Nanotubes on Phenol Biodetoxification by Pseudomonas sp. J. Nanosci. Nanotechnol. 2017, 17, 1031–1040. [Google Scholar] [CrossRef] [PubMed]
  71. Lincheva, S.; Schneider, I.; Daskalova, E.; Topalova, Y. Modelling of risk effect of mercury on nutrient transformation in lake sediments. Biotechnol. Biotechnol. Equip. 2014, 28, 650–658. [Google Scholar] [CrossRef] [PubMed]
  72. Topalova, Y. Biological Control and Management of Water Treatment; ScieSet-Eco: Sofia, Bulgaria, 2008; p. 352. [Google Scholar]
  73. Lincheva, S.; Shneider, I.; Topalova, Y. Dynamics of the Functional Structure of the Sediment Microflora during the Model Process of Phenol Biodegradation. Bulg. J. Agric. Sci. 2013, 19, 139–142. [Google Scholar]
  74. Belouhova, M. Management of Water Purification from Biofilm Communities in Innovative Detoxification Technologies. Ph.D. Dissertation, Sofia University “St. Kliment Ohridski”, Sofia, Bulgaria, 2015; p. 201. [Google Scholar]
  75. Grekova-Vasileva, M. Bioalgorithms for Water Treatment Management from the Textile Industry. Ph.D. Disertation, Sofia University ‘St. Kliment Ohridski”, Sofia, Bulgaria, 2009; p. 172. [Google Scholar]
  76. Dimkov, R.; Topalova, Y. Dependence of microbiological degradation of the aryl-containing xenobioics on their concentrations. Acta Microbiol. Bulg. 1993, 29, 9–16. [Google Scholar]
  77. Topalova, Y.; Dimkov, R. Role of the factors–controlling aryl-biodegradation in the process management, biostatistics and applicability. Biotechnol. Biotechnol. Equip. 2003, 17, 104–111. [Google Scholar]
  78. Grekova-Vasileva, M.; Topalova, Y. Biological algorithms for textile wastewater management. Biotechnol. Biotechnol. Equip. 2009, 23, 442–447. [Google Scholar] [CrossRef]
Figure 1. Experimental design.
Processes 10 00602 g001
Figure 2. Residual concentration of phenol in Ph and PhND variants in the course of model bioremediation of contaminated sediments. Arrows indicate the addition of phenol in the model system—at the 2nd, 49th and 72nd hours.
Processes 10 00602 g002
Figure 3. Effect of ND on kinetic parameters.
Processes 10 00602 g003
Figure 4. Quantities of: (a) aerobic heterotrophic bacteria and phenol-degrading bacteria in the variant without added ND; (b) bacteria from genus Pseudomonas and genus Acinetobacter in the variant without added ND.
Processes 10 00602 g004
Figure 5. Percentage of non-culturable bacteria of the genus Pseudomonas and genus Acinetobacter and residual phenol concentration in the variant without added ND.
Processes 10 00602 g005
Figure 6. Quantities of: (a) aerobic heterotrophic bacteria and phenol-degrading bacteria in the variant without added ND; (b) culturable bacteria of the genus Pseudomonas and the genus Acinetobacter in the variant with added ND.
Processes 10 00602 g006
Figure 7. Percentage of non-culturable bacteria of the genus Pseudomonas and genus Acinetobacter and residual phenol concentration in the variant with added ND.
Processes 10 00602 g007
Figure 8. Effect of ND on non-culturable bacteria of the genus Pseudomonas and the genus Acinetobacter.
Processes 10 00602 g008
Figure 9. Comparison between culturable and non-culturable bacteria of the genus Pseudomonas and the genus Acinetobacter in the variant PhND.
Processes 10 00602 g009
Table 1. Studied groups of microorganisms, nutrient media, and cultivation conditions.
Microbiological IndicatorNutrient MediaProducerIncubation Conditions
Aerobic heterotrophic bacteria
(AeH)
Nutrient agar in aerobic conditionsHiMedia24 h,
37 °C
Genus Pseudomonas
(Ps.)
Glutamate starch Pseudomonas agarHiMedia24 h,
37 °C
Genus Acinetobacter
(Ac.)
Sellers differential agarHiMedia24 h,
37 °C
Phenol-degrading bacteria
(Ph.degr.)
Synthetic salt medium with added phenolaccording to Furukawa, 19832–7 days, 28 °C
Table 2. Kinetic parameters of phenolic biodegradation and biomass growth.
ParametersVariants48th hour214th hour
Rate of biodegradation of phenol /RBP/mg/kgxhPh1.598 ± 0.1664.578 ± 0.295
PhND0.891 ± 0.1175.446 ± 0
Specific rate of biodegradation of phenol/SRBP/mg/kgxhPh0.211 ± 0.0220.348 ± 0.027
PhND0.100 ± 0.0160.436 ± 0
Rate of accumulation of biomass /RAB/mg/lxhPh−0.082 ± 0.0530.034 ± 0.008
PhND−0.054 ± 0.0280.021 ± 0.008
Effectiveness of elimination of phenol/EFF./%Ph26.15 ± 1.97629.64 ± 1.638
PhND16.81 ± 2.26033.42 ± 0.486
Table 3. Effect of ND on the amount of culturable key groups of microorganisms at 48 h and 214 h of the bioremediation process (expressed in %).
Groups of M.O.Change (%) versus Variant Ph at 48 hChange (%)
versus Variant Ph
at 214 h
AeH+33.87%−19.45%
Ps.−76.30%+71.83%
Ac.+74.65%−37.58%
Ph.degr.−60.61%−75.35%
Table 4. Fluorescent images of the microbial community for the variant PhND (400×). Subjects were represented by hybridization with an oligonucleotide probe specific to the genus Pseudomonas (red) and the genus Acinetobacter (yellow).
2nd hour48th hour144th hour214th hour
Processes 10 00602 i001
Ps. /FISH/- 2nd hour
Processes 10 00602 i002
Ps. /FISH/-48th hour
Processes 10 00602 i003
Ps. /FISH/-144th hour
Processes 10 00602 i004
Ps. /FISH/-214th hour
Processes 10 00602 i005
Ac. /FISH/-2nd hour
Processes 10 00602 i006
Ac. /FISH/-48th hour
Processes 10 00602 i007
Ac. /FISH/-144th hour
Processes 10 00602 i008
Ac. /FISH/-214th hour
Publisher’s Note: MDPI stays neutral with regard to jurisdictional claims in published maps and institutional affiliations.

