Article

Machine Learning Prediction of Critical Temperature of Organic Refrigerants by Molecular Topology

1
China Petroleum Engineering and Construction Corporation Southwest Company, Chengdu 610041, China
2
Key Laboratory of Low-Grade Energy Utilization Technologies and Systems, Ministry of Education, School of Energy and Power Engineering, Chongqing University, Chongqing 400030, China
*
Authors to whom correspondence should be addressed.
Processes 2022, 10(3), 577; https://doi.org/10.3390/pr10030577
Submission received: 16 February 2022 / Revised: 8 March 2022 / Accepted: 9 March 2022 / Published: 16 March 2022

Abstract

:
In this work, molecular structures, combined with machine learning algorithms, were applied to predict the critical temperatures (Tc) of a group of organic refrigerants. Aiming at solving the problem that previous models cannot distinguish isomers, a topological index was introduced. The results indicate that the novel molecular descriptor ‘molecular fingerprint + topological index’ can effectively differentiate isomers. The average absolute average deviation between the predicted and experimental values is 3.99%, which proves a reasonable prediction ability of the present method. In addition, the performance of the proposed model was compared with that of other previously reported methods. The results show that the present model is superior to other approaches with respect to accuracy.

1. Introduction

The proposal of carbon neutrality will accelerate the utilization of renewable energy, such as solar energy and geothermal energy [1,2]. Additionally, thermodynamic cycles, including novel power systems represented by the organic Rankine cycle (ORC), and refrigeration/heat pump cycles, represented by a vapor compression cycle, are the effective approaches to use the medium and low energy. A working fluid is the energy carrier of thermodynamic cycles, which plays a key role in designing and enhancing the thermodynamic cycles [3,4]. Organic refrigerants, as a kind of compounds with low boiling point, apart from their application in the refrigeration industry, also have unique advantage to be used as working fluids in ORC to recover low-grade energy and improve energy utilization efficiency.
In recent years, with increasing attention paid to environmental problems, such as ozone layer depletion and greenhouse effect, it is urgent to develop new environmentally friendly and efficient working fluids with zero ozone depletion potential (ODP) and low global warming potential (GWP) [5,6]. Critical parameters are basic thermophysical properties of a working fluid consisting of critical temperature (Tc), critical pressure (pc), and critical volume (vc). Among them, critical temperature is not only the demarcation point of a subcritical and supercritical cycle, but also the basis for estimating other physical properties. Besides, the efficiency of a subcritical cycle is a function of Tc. For example, when the evaporation and condensation temperatures are given, working fluids with high Tc usually have better cycle efficiency [7]. Therefore, the accuracy of critical temperature largely determines the reliability of thermophysical property estimation and relevant computational design.
Currently, there are two main approaches to obtain critical temperature: experimental measurement and theoretical estimation. The measurement methods can be categorized into direct and indirect way. For the direct observation method, the reappearance of the phase interface and the critical opalescence phenomenon are usually used for judging the emergence of critical points [8]. On the other hand, the indirect calculation method usually takes the specific heat peak on the Cv-T diagram and the inflection point of the isotherm to find critical points [9]. However, an experiment alone cannot meet the requirements of industrial application for Tc. Until now, only hundreds of experimental values of critical temperature are reported, which is far from the demands of industrial production and design [10]. Hence, it is of necessity to predict Tc by using theoretical methods. There are several routes to calculate the critical temperature of working fluids.
The empirical correlation method is mainly based on the physical properties that are common and easy to measure, such as boiling point and density. Guldberg et al. [11] proposed a formula correlating the critical temperature with the boiling point. Vejahati et al. [12] proposed a simple exponential model to estimate the critical temperature of alkanes. Klincewicz et al. [13] correlated the molecular weight and boiling point with Tc. The calculation of empirical correlation is simple and fast, but lacks theoretical foundation and has poor universality.
A group contribution method (GCM) is a generally applied method to estimate physical properties. As regards Tc, Riedel et al. [14] proposed a model using the group contribution concept to estimate the critical temperature of organic compounds. Based on their work, Lydersen et al. [15] proposed the first group contribution method with a detailed group division and better estimation results. Joback et al. [16] further improved this method. Considering that the previous methods did not consider the interaction between adjacent groups and distinguish isomers, several new models have been developed later, such as the secondary group contribution method proposed by Constantinou et al. [17], group-interaction contribution method by Marrero et al. [18], and position contribution method by Wang et al. [19]. It is convenient to apply a group contribution method with complete functional group parameters. However, the group division is complex, and the calculation is complicated, which slows down the calculation process of physical property.
Besides, molecular simulation (MS) is a numerical prediction method based on atomic interaction [20]. Raabe [21] investigated the vapor-liquid phase equilibria of several binary mixtures of R-1234yf and R-1234ze(E) via Gibbs ensemble Monte Carlo simulation. Yang et al. [22] reported the vapor-liquid equilibrium properties of R152a and its mixture by Gibbs ensemble Monte Carlo simulation and molecular dynamics simulation. Cai et al. [23] studied the evaporation process of R32/R152a by molecular dynamics method. More reports [24,25,26] have shown that MS is a powerful method for predicting the properties of materials. However, the prediction accuracy of MS heavily relies on the atomic interaction potential model.
Recently, machine learning (ML) has become a popular method for physical property estimation due to high accuracy [27]. Theoretically, a three-layer neural network can approximate any rational function with any precision [28]. It is easy to set and implement an ML model in computer programs without a given expression. Compared with previous models, when a machine learning method is applied to predict the physical properties of a working fluid, such as melting point [29], boiling point [30], density [31], and heat capacity [32], it usually has better prediction accuracy. The application of ML on the estimation of critical temperature has also been explored. Gharagheizi et al. [33] attempted to apply group contribution as the input of an artificial neural network to estimate the critical temperature of pure compounds. However, most of the existing group contribution methods cannot effectively distinguish isomers, which inevitably affects the prediction results. Therefore, the appropriate expression of a molecular structure is a prerequisite for the construction of a machine learning model.
The development of cheminformatics provides a new idea for the programming language expression of a molecule structure. In the 1980s, molecular fingerprints (MF) appeared along with the study of similarity searching in medicinal chemistry [34]. MF uses the Boolean value ‘1’ or ‘0’ to describe whether there is a specific substructure in a molecule. When it comes to the prediction of toxicity [35] and viscosity [36], taking MF as the input feature of a machine learning algorithm can achieve satisfactory results.
Consequently, in this paper, four kinds of molecular fingerprints were used to represent the structures of working fluid molecules, acting as the input of four ML algorithms. A total of 16 different prediction models of Tc (16 = 4 MFs multiplied by 4 ML algorithms) were established. Then a topological index was introduced to further optimize and obtain the optimal model to predict the critical temperature of working fluids. The performance of the proposed model was then compared with those of other previous methods.

2. Methods

2.1. ML Algorithms

Four types of supervised ML algorithms were used in this research, including support vector regression (SVR), decision tree (DT), random forest (RF), and multilayer perceptron (MLP).

2.1.1. Support Vector Regression

Support vector regression is an algorithm that uses an appropriate kernel function to map nonlinear data to a high dimensional feature space and transform the nonlinear relationship into a linear form [37]. The accuracy of SVR depends on the optimization of the model parameters, including the choice of kernel function, kernel parameter, tube radius, and regularization parameter, which balance the model complexity and training error. In this work, 10-fold cross validation paralleled with grid research was applied to find the optimal combination of these parameters.

2.1.2. Decision Tree

A decision tree is composed of nodes and directed edges. There are two types of nodes, the internal node, which represents a feature or attribute, and the leaf node, which represents a category or certain value [38]. When DT is used for a regression task, it tests a certain feature of the sample from the root node and assigns the sample to the child nodes according to the test results. At this time, each child node corresponds to one of the characteristic values. The samples are tested and distributed recursively until they reach the leaf node. The prepruning of DT in this study was realized by 10-fold cross validation and grid research to get the optimal parameters.

2.1.3. Random Forest

Random forest is a bagging algorithm based on multiple decision trees, which are grown from different bootstrap samples of the training data. Bootstrap samples are generated from a random selection with replacement of the training samples during tree growth. The data that are not chosen in the construction of forests is called ‘out-of-bag’ samples. Each tree predicts its out-of-bag sample as the tree is added to the forest, and the average of these results gives an overall evaluation [39]. Random forest usually has a better performance than an individual tree, which helps to decrease the variance of a model. The number of trees is obtained from drawing the learning curve, and the process of prepruning is similar to that of DT.

2.1.4. Multilayer Perceptron

An artificial neural network is designed to simulate the structure and function of a neural system for data processing; it can constantly adjust the weight of the chain between the simulated neurons so that the entire network can better fit the relationship of the training data. Multilayer perceptron is a feedforward neural network that simulates nonlinear relationships through interconnected artificial neurons and complex topological structures [40]. Its basic structure includes input layer, hidden layer, and output layer. Each input node is connected to the output node through a weighted chain, which is used to simulate the connection strength between neurons. Here, a multilayer perceptron with two hidden layers was built based on Keras. The optimal parameters, including the activation function, learning rate, and hidden layer sizes, were obtained by random search, and the remaining parameters took defaults.

2.2. Datasets

The experimentally measured critical temperature data points of working fluids were taken from an open database of the Design Institute for Physical Properties (DIPPR) and relevant literature [41]. The data consist of the Tc of 155 pure substances of working fluids. Based on this, the Tc databases of pure working fluids was built.
The pure chemicals basically cover the working fluids, which are commonly used in engineering practice. In order to improve the performance of the prediction model for pure substances, the chemicals in the database are divided into three categories: (halogenated) alkanes, (halogenated) alkenes, and ethers. Seventy percent data of each category were randomly selected to construct the training set, which was used to train the models, establishing a relationship between the molecular structure and the critical temperature. The remaining 30% data formed the testing set, which was used to evaluate the prediction accuracy of the established model.

2.3. Feature Extraction and Data Preprocessing

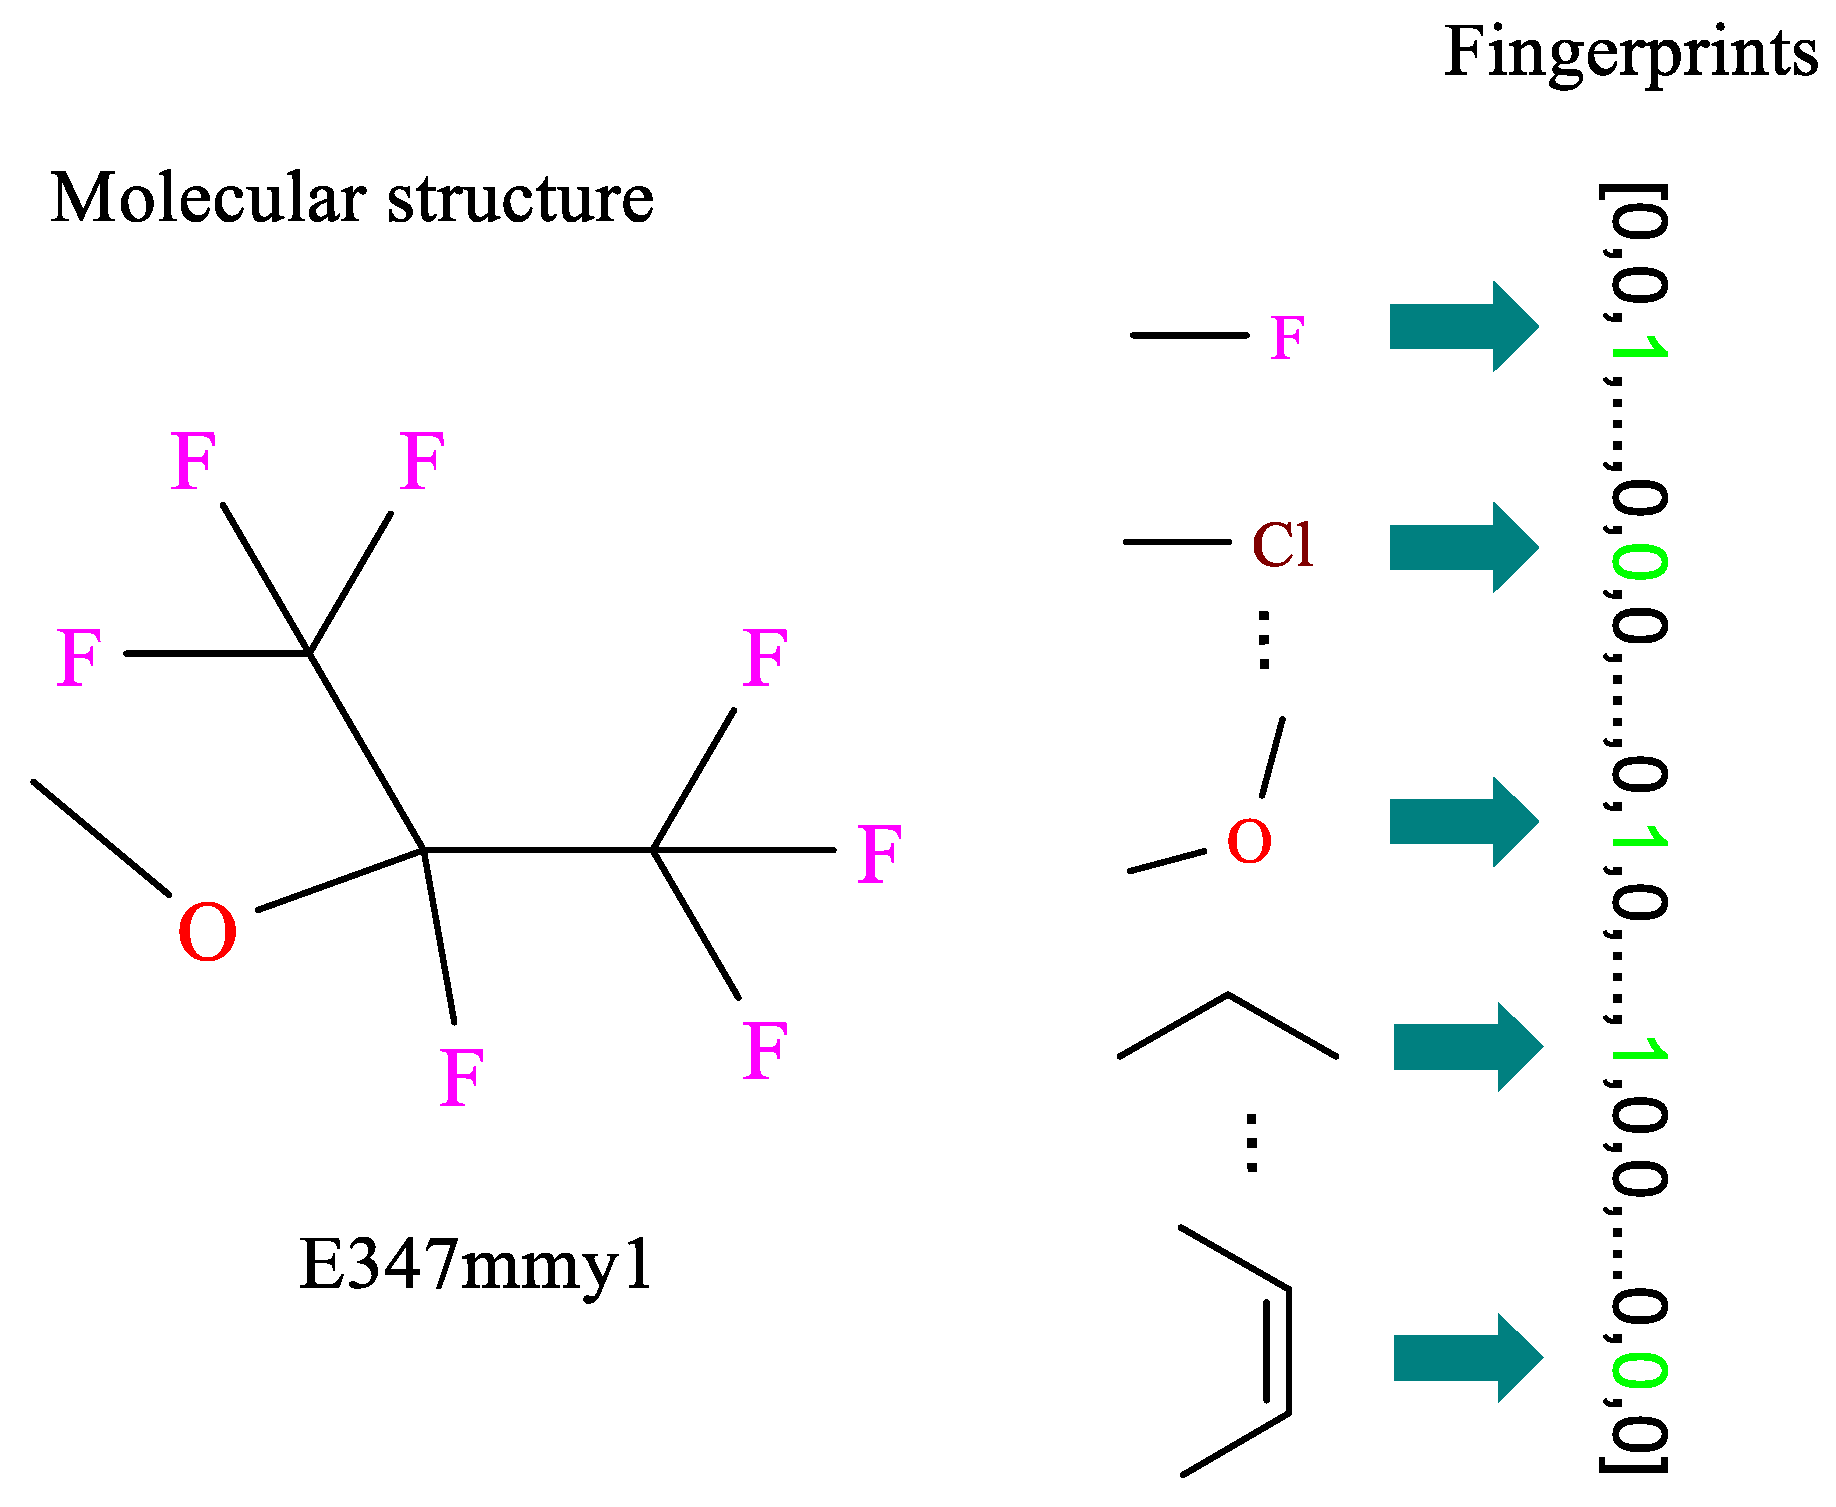
2.3.1. Molecular Fingerprints

The working fluids were represented by fingerprints derived from their molecular structures. Molecular fingerprints encode a structure into an array of bit strings, the 1 s and 0 s describe the presence or absence of particular substructures in the molecule. A schematic of molecular fingerprints is shown in Figure 1.
In this work, four different lengths of fingerprints were chosen: MACCS (166 bits), Pubchem (881 bits), Extended (1024 bits), Morgan (2048 bits). All the fingerprints were calculated through an online transformer, ChemDes [42]. Since the structures of working fluids are simple, fingerprint bits with zero variance were filtered. The MFs were then applied to build regression models. Relevant information is listed in Table 1.

2.3.2. Topological Index

Compared with a group contribution method, molecular fingerprints can uniquely express the structural characteristics of most working fluid molecules. However, there are still a few isomers that cannot be effectively distinguished. Therefore, the topological index MTI′ was introduced to tell the difference between structural isomers, and the geometric correction number GM was added to MTI′ to further distinguish the cis-trans isomers [43]. A topological index is an approach to quantify a molecular structure, which is a constant of a molecular graph. It is obtained by performing certain numerical operations on the matrices that characterize the graph [44]. The topological index S is calculated as follows:
D v V w = D v D V D w
MTI = i = 1 N v D v V w i
G M = i = 1 N M G F D v V w + D v V w T i
S = MTI + G M
In Equations (1)–(4), Dv, DV, and Dw represent the valence matrix, vertex weight matrix, and adjacency matrix of a working fluid molecule, respectively. N is the number of atoms, v represents the valence vector, and MGF is a diagonal matrix that distinguishes cis and trans isomers. The detailed process to obtain topological indices can be found in the Supplementary Materials.

2.4. Model Validation

The performance of a model is evaluated by comparing the predicted and experimental values using the following statistical parameters: correlation coefficient (R2), root mean square error (RMSE), and average absolute deviation (AAD).
R 2 = 1 i = 1 m ( y i y ^ i ) 2 i = 1 m ( y i y ¯ i ) 2
R M S E = i = 1 m ( y i y ^ i ) 2 m
A A D = 1 m i = 1 m 100 × y i y ^ i y i
In Equations (5)–(7), m is the number of samples; y i and y i ^ are the measured and predicted value of chemical i, respectively; and y ¯ is the mean value of data points.

3. Results and Discussion

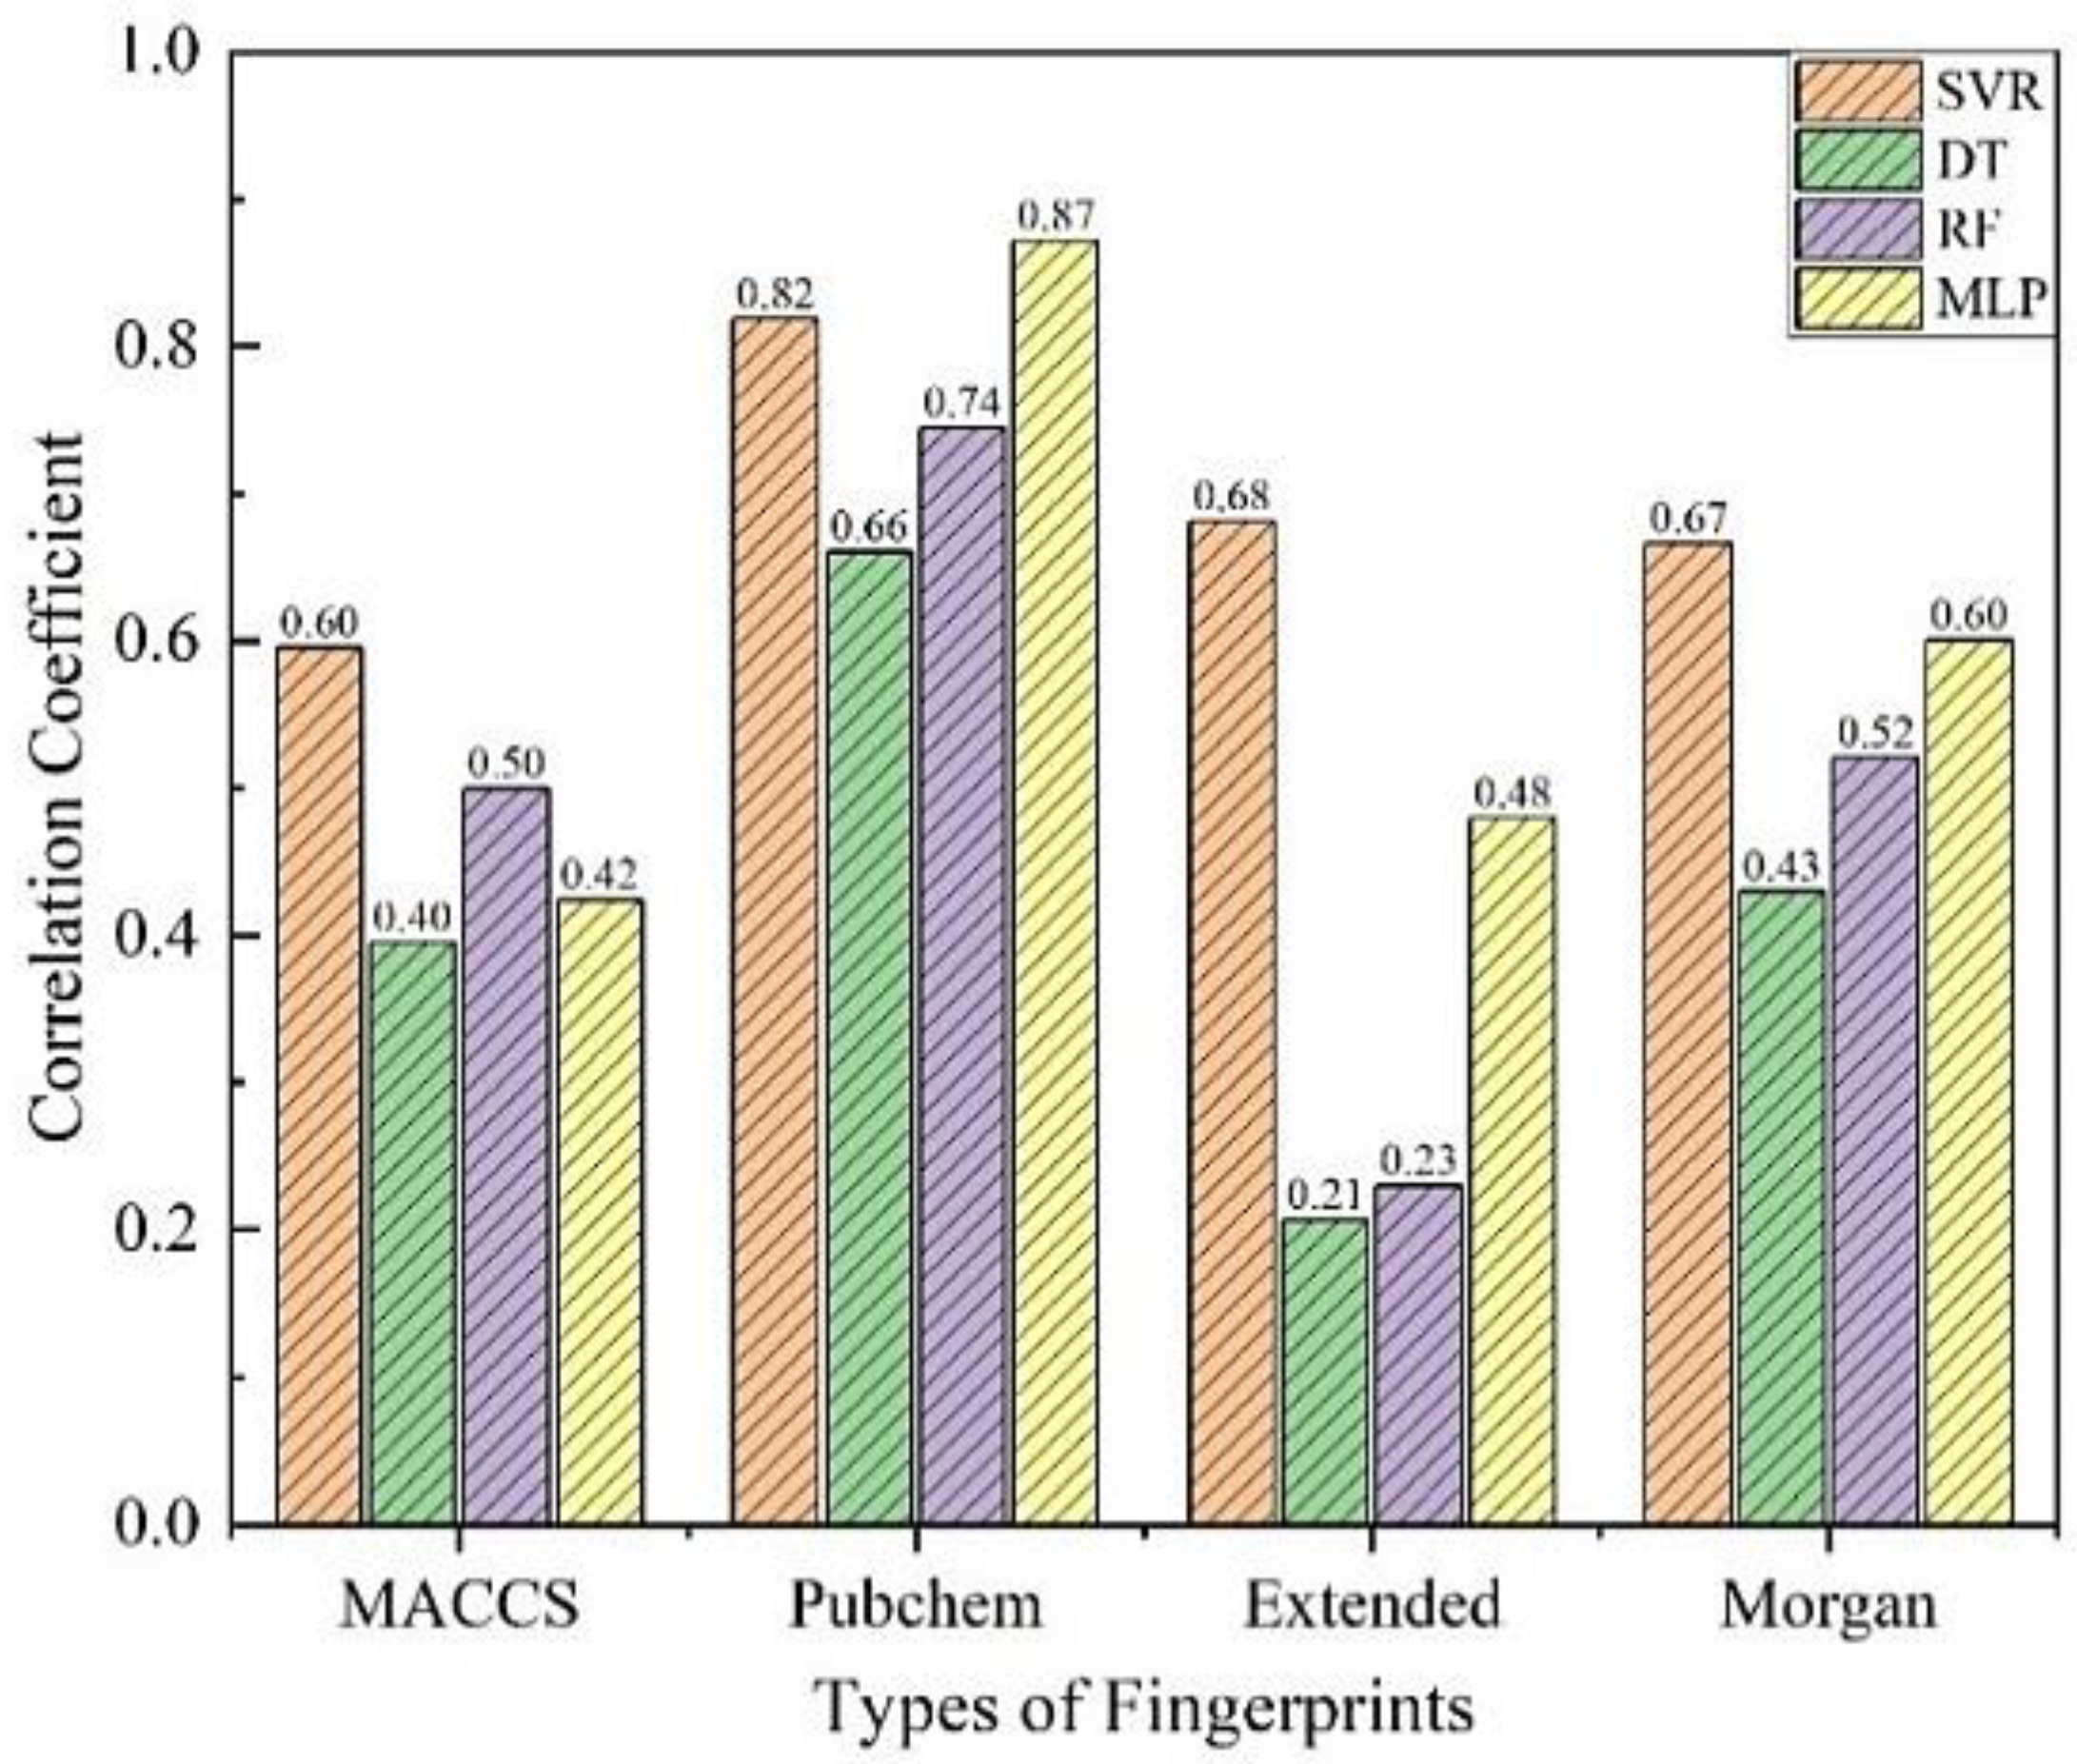
3.1. Preliminary Screening of Models

Sixteen prediction models were obtained by employing the molecular fingerprints of pure working fluids as the input of machining learning algorithms. The prediction performance of each regression model in the testing subset is shown in Figure 2 (taking the coefficient of determination R2 as a statistical indicator).
The MACCS fingerprint is the shortest among the four fingerprints; it cannot distinguish the four couples of cis and trans isomers in the dataset. When MACCS were input as the feature of ML algorithms, the model established by SVR exhibited an unsatisfactory R2 value of 0.5956 in a testing set. It is because this kind of short-length fingerprint covers less molecular structure information, which is insufficient to train the prediction models, thus limiting the performance of models.
Extended is an extension of the Chemistry Development Kit fingerprint [45]. Taking Extended fingerprints as input, the highest R2 value achieved by SVR is only 0.6807. The reason accounting for it is that an Extended fingerprint works by counting all molecular fragments along the path from a certain atom to a specified number of bonds and judging whether these fragments are presented in a preassigned list of substructures. While in ChemDes the maximum path length is set to 5 by default, this leads to those molecules with chain length ≥5 maybe having the same fingerprints (14 couples of fluids have the same Extended fingerprints in this work), therefore affecting the model performance.
As the longest fingerprints, Morgan can distinguish the molecular structures of all the pure working fluids in the dataset. Nevertheless, an optimal R2 of 0.6661 obtained by an SVR model is still unsatisfactory. Small datasets and excessive features may be the main reason they cause overfitting and reduce the robustness of models. Therefore, a Morgan fingerprint is not suitable to establish models for a dataset with limited samples.
Compared with other fingerprints, Pubchem achieved the best prediction performance among all the four ML models. The optimal combination is MLP + Pubchem, which attained an R2 of 0.8712. This proves that Pubchem can effectively characterize molecular information and construct the relationship between the molecular structure and the critical temperature with a limited training dataset. A comparison between the predicted and experimental values and the deviation of each point are shown in Figure 3. It can be seen that most of the data points have deviations less than 7.5%, only four samples’ deviations are more than 10%, which proves a relatively good prediction ability of the model. More details about Pubchem fingerprints are provided in the Supplementary Materials.
From the point of ML algorithms, as a strong learner, SVR has a stable and satisfactory prediction performance, and the R2 of SVR + Pubchem model in the testing set reaches 0.8184. Apart from MLP + Pubchem, the feedforward neural network MLP has a general effect when other fingerprints are used as input. The ensemble algorithm RF, which is based on the weak learner DT, has higher prediction accuracy compared with DT. However, the performance of RF varies with different fingerprints. Thus, the comprehensive prediction efficiency of the four models can be sorted as follows: SVR > MLP > RF > DT.

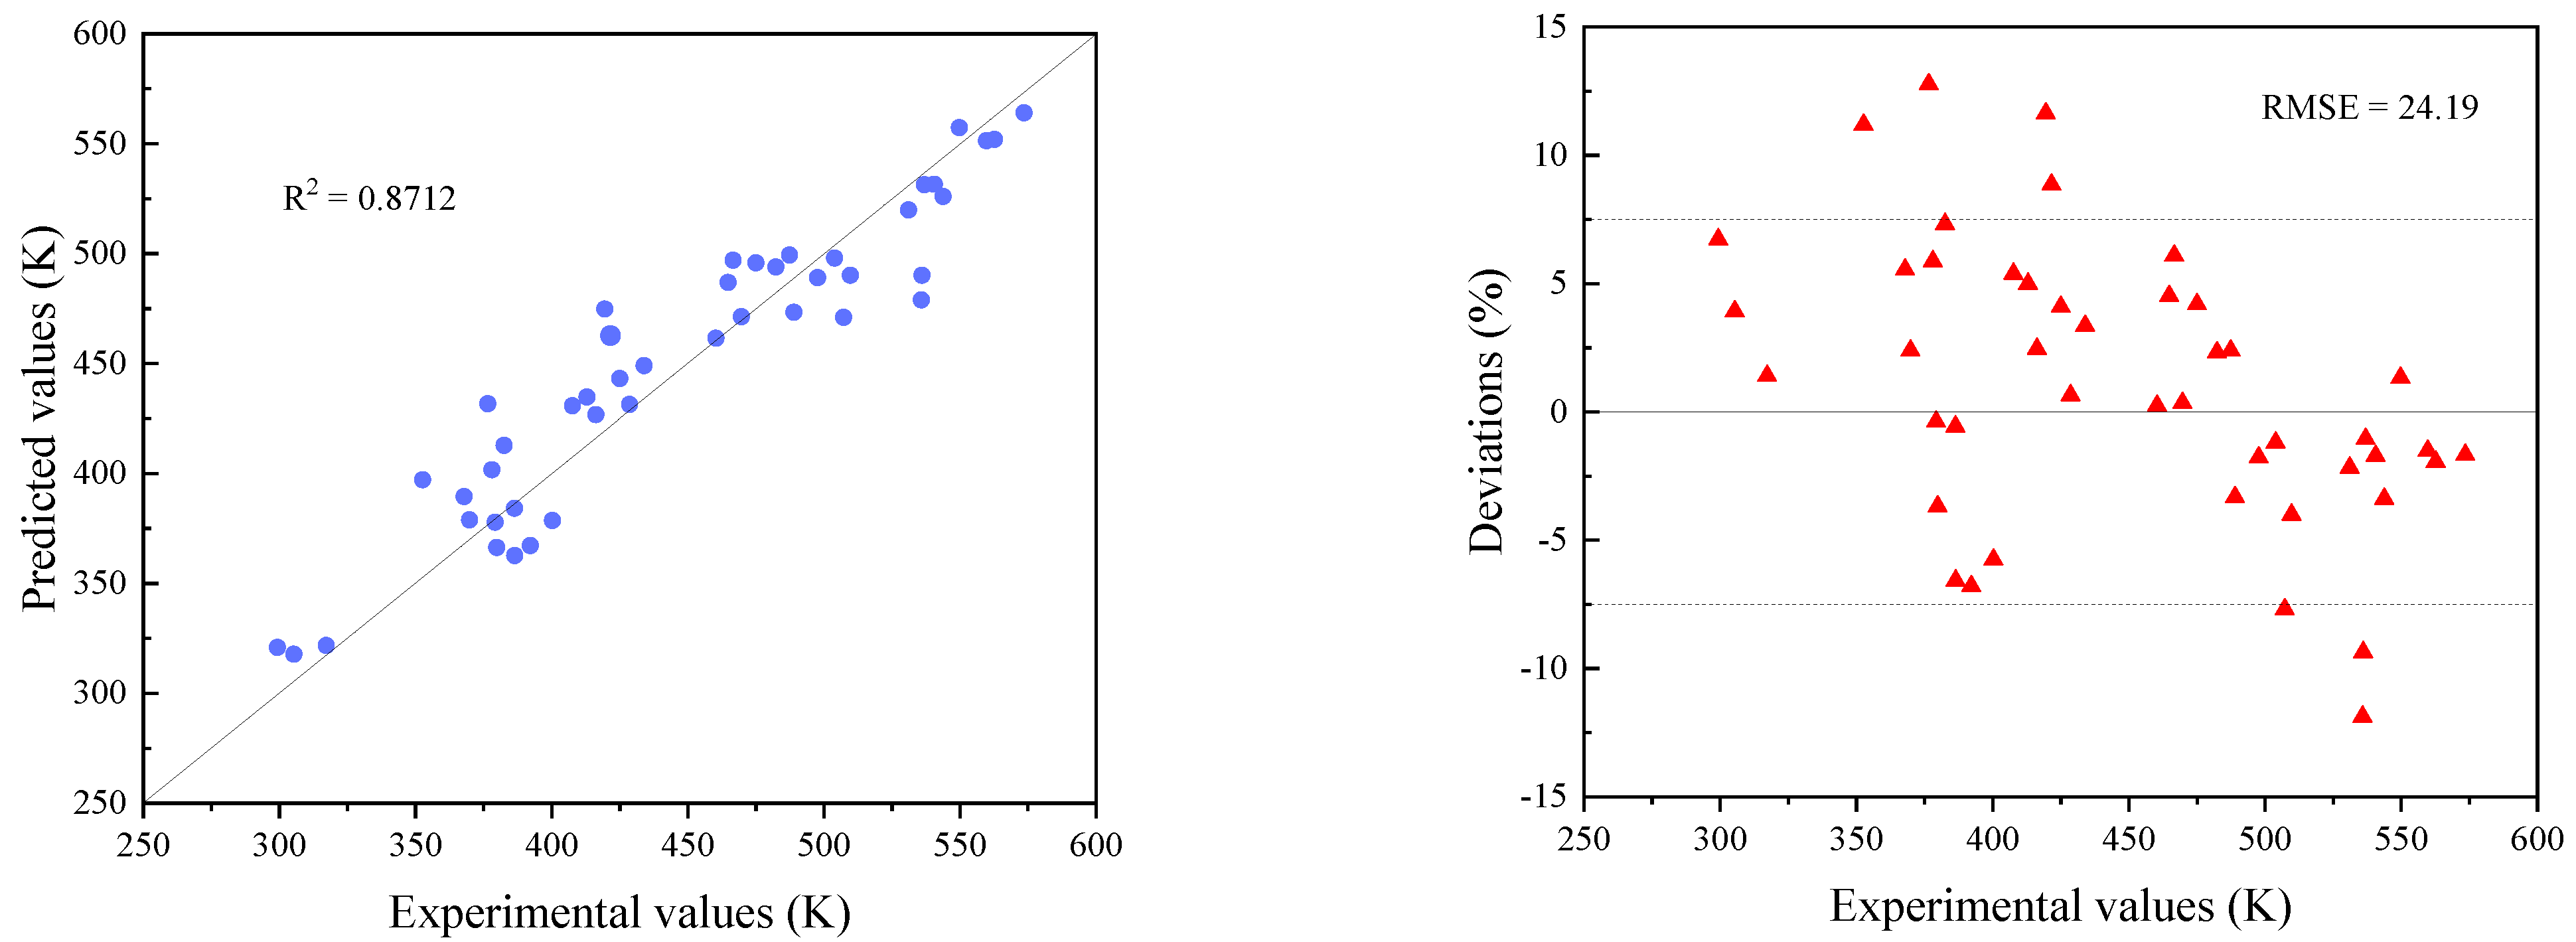
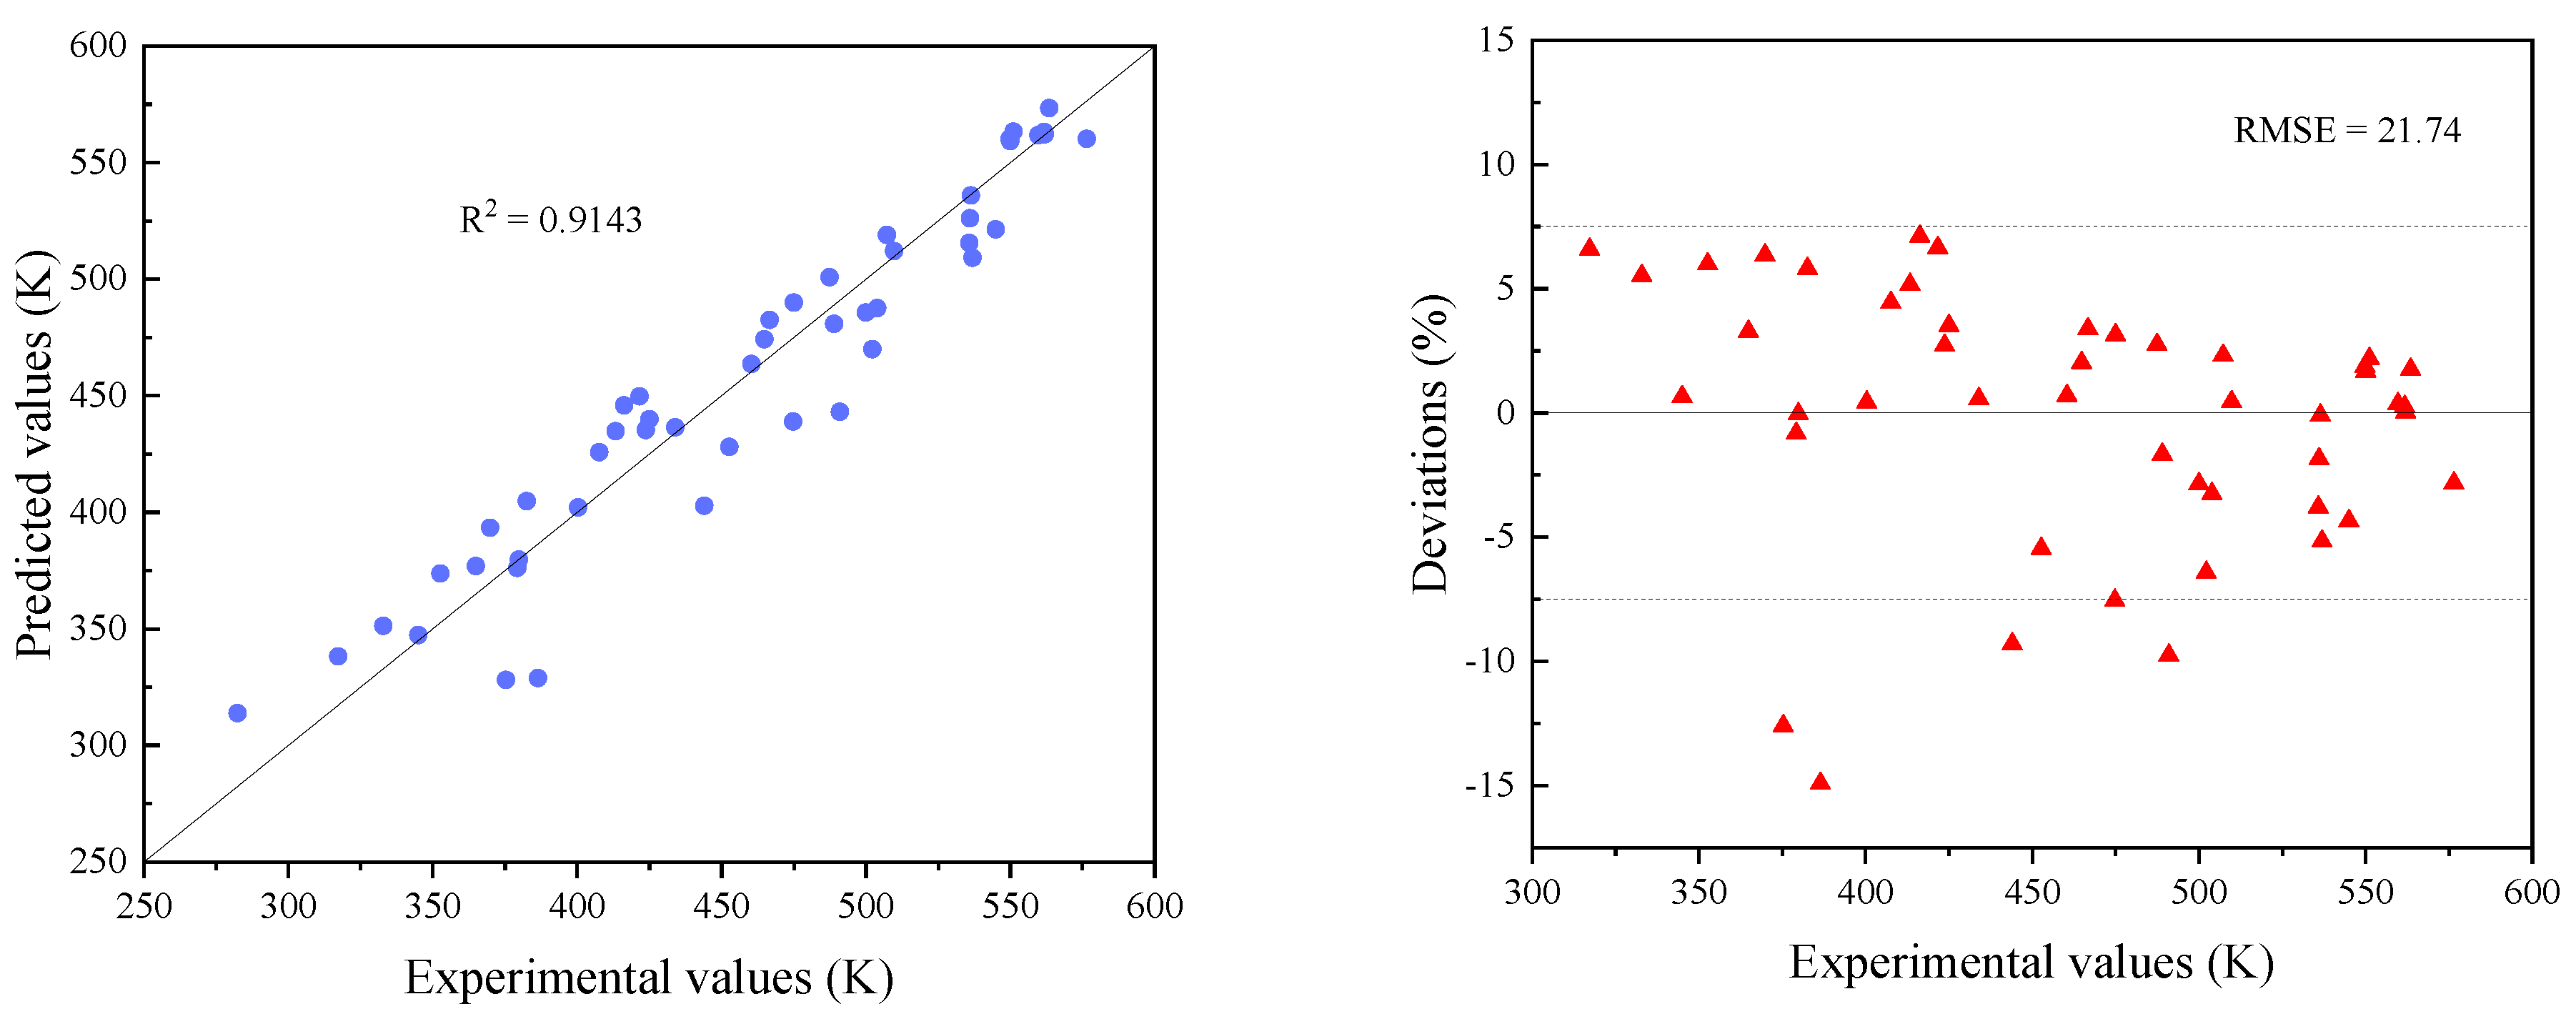
3.2. Modification of Models

When checking the data of a Pubchem fingerprint, it is found that certain cis and trans isomers of working fluids cannot be distinguished by Pubchem. Therefore, the prediction model can be further optimized. Based on the analysis above, a topological index S was considered to be added as a new feature of Pubchem. Then the modified fingerprint was used as the input of the two ML algorithms with top performance: SVR and MLP. By comparing statistical parameters, the optimal critical temperature prediction model of a pure working fluid was finally selected.
The prediction results of SVR and MLP after modification are shown in Figure 4 and Figure 5, respectively. It is clear that the prediction accuracy of the models significantly improved with the introduction of a topological index. The R2 of SVR + Pubchem in a testing set increased from 0.8184 to 0.8426, while that of MLP + Pubchem reached 0.9143.
Comparing Figure 3 with Figure 5, it is obvious that the data points of a modified model are more concentrated around the line y = x, the working fluids with deviations of more than 7.5% reduced from 7 to 4, proving its better prediction ability. This shows that the selected topological index can well solve the problem that Pubchem cannot differentiate cis and trans isomers, thereby improving the overall prediction performance of models. Thus, the final critical temperature prediction model of pure working fluids was obtained.

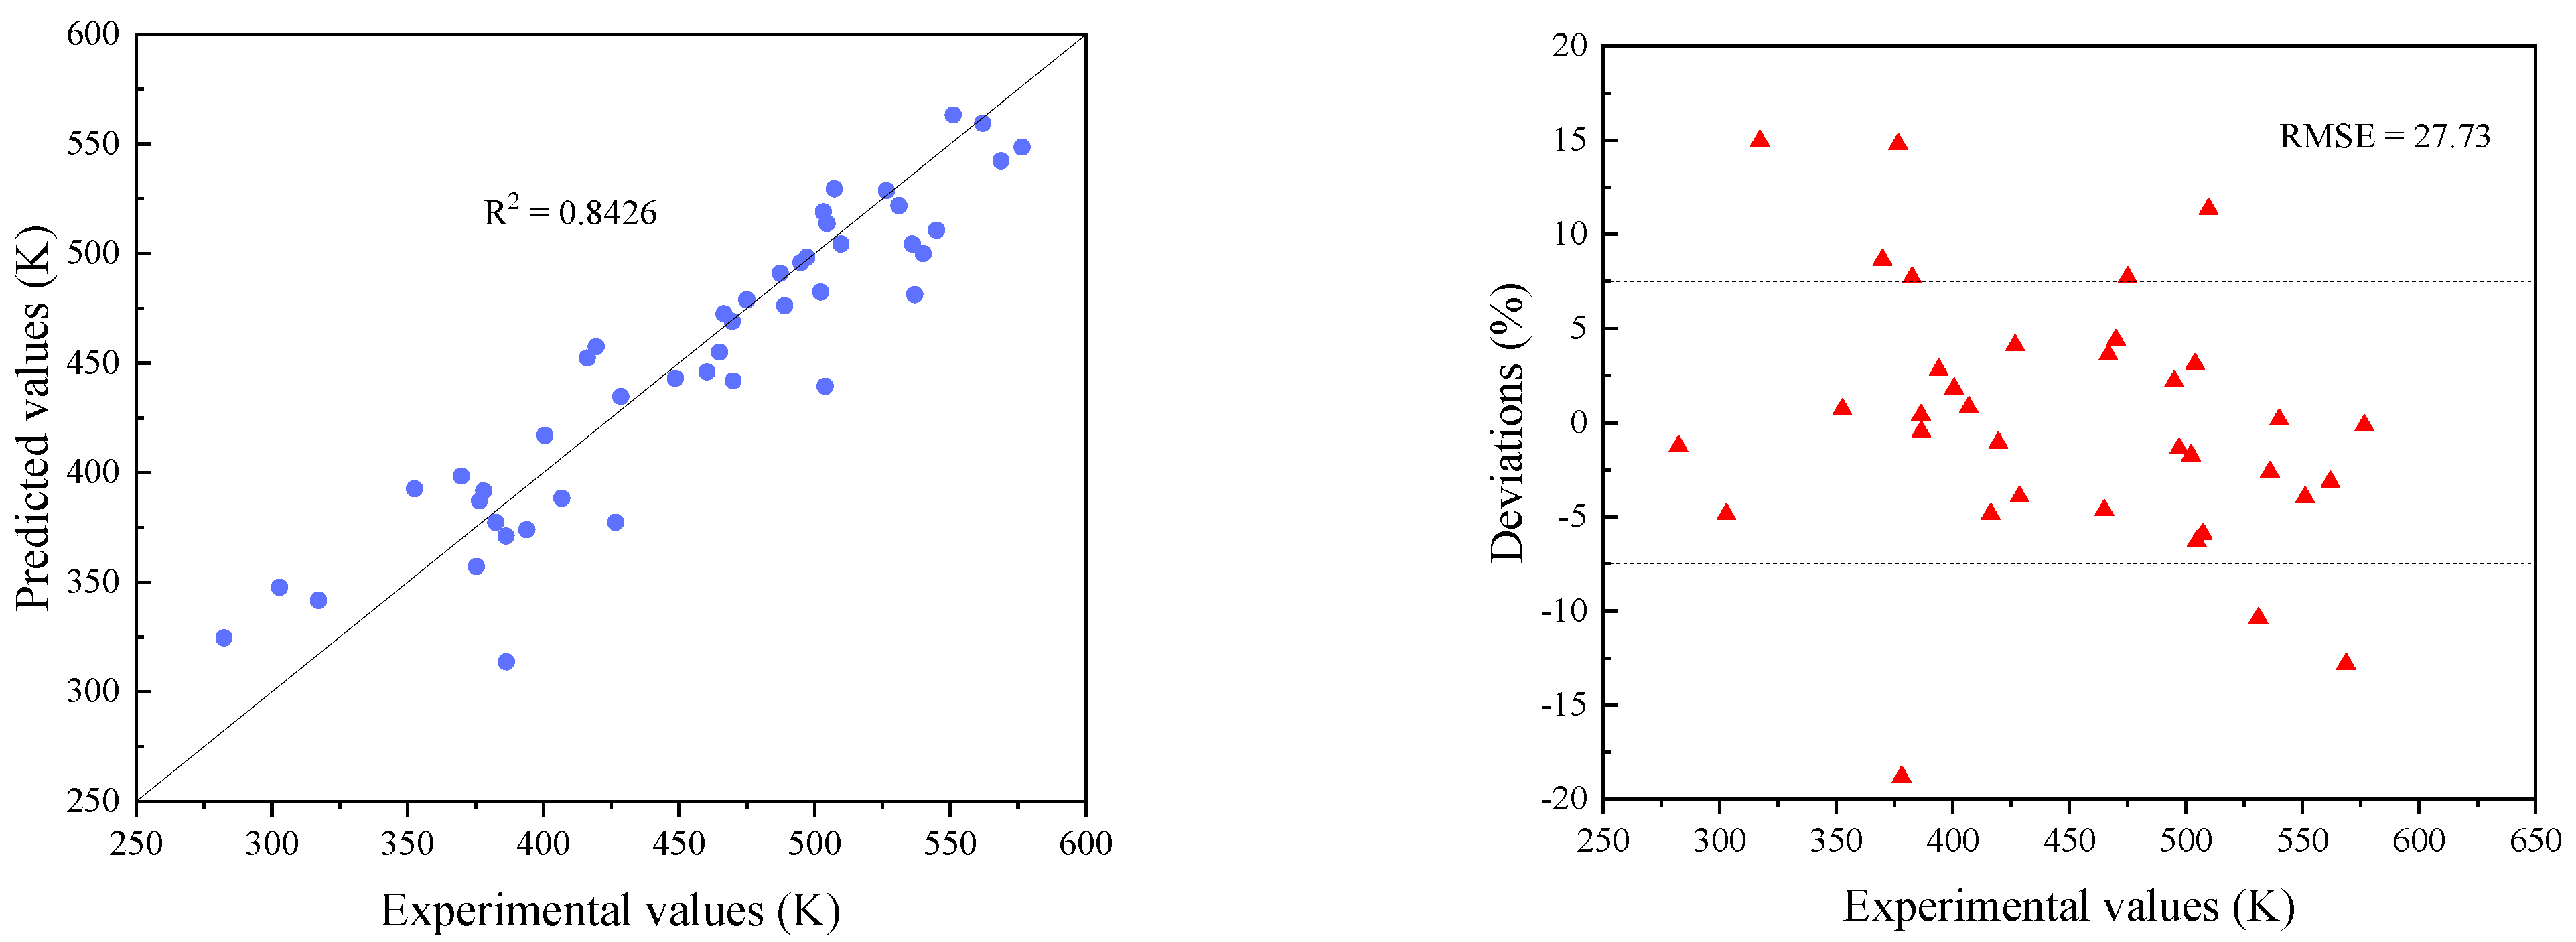
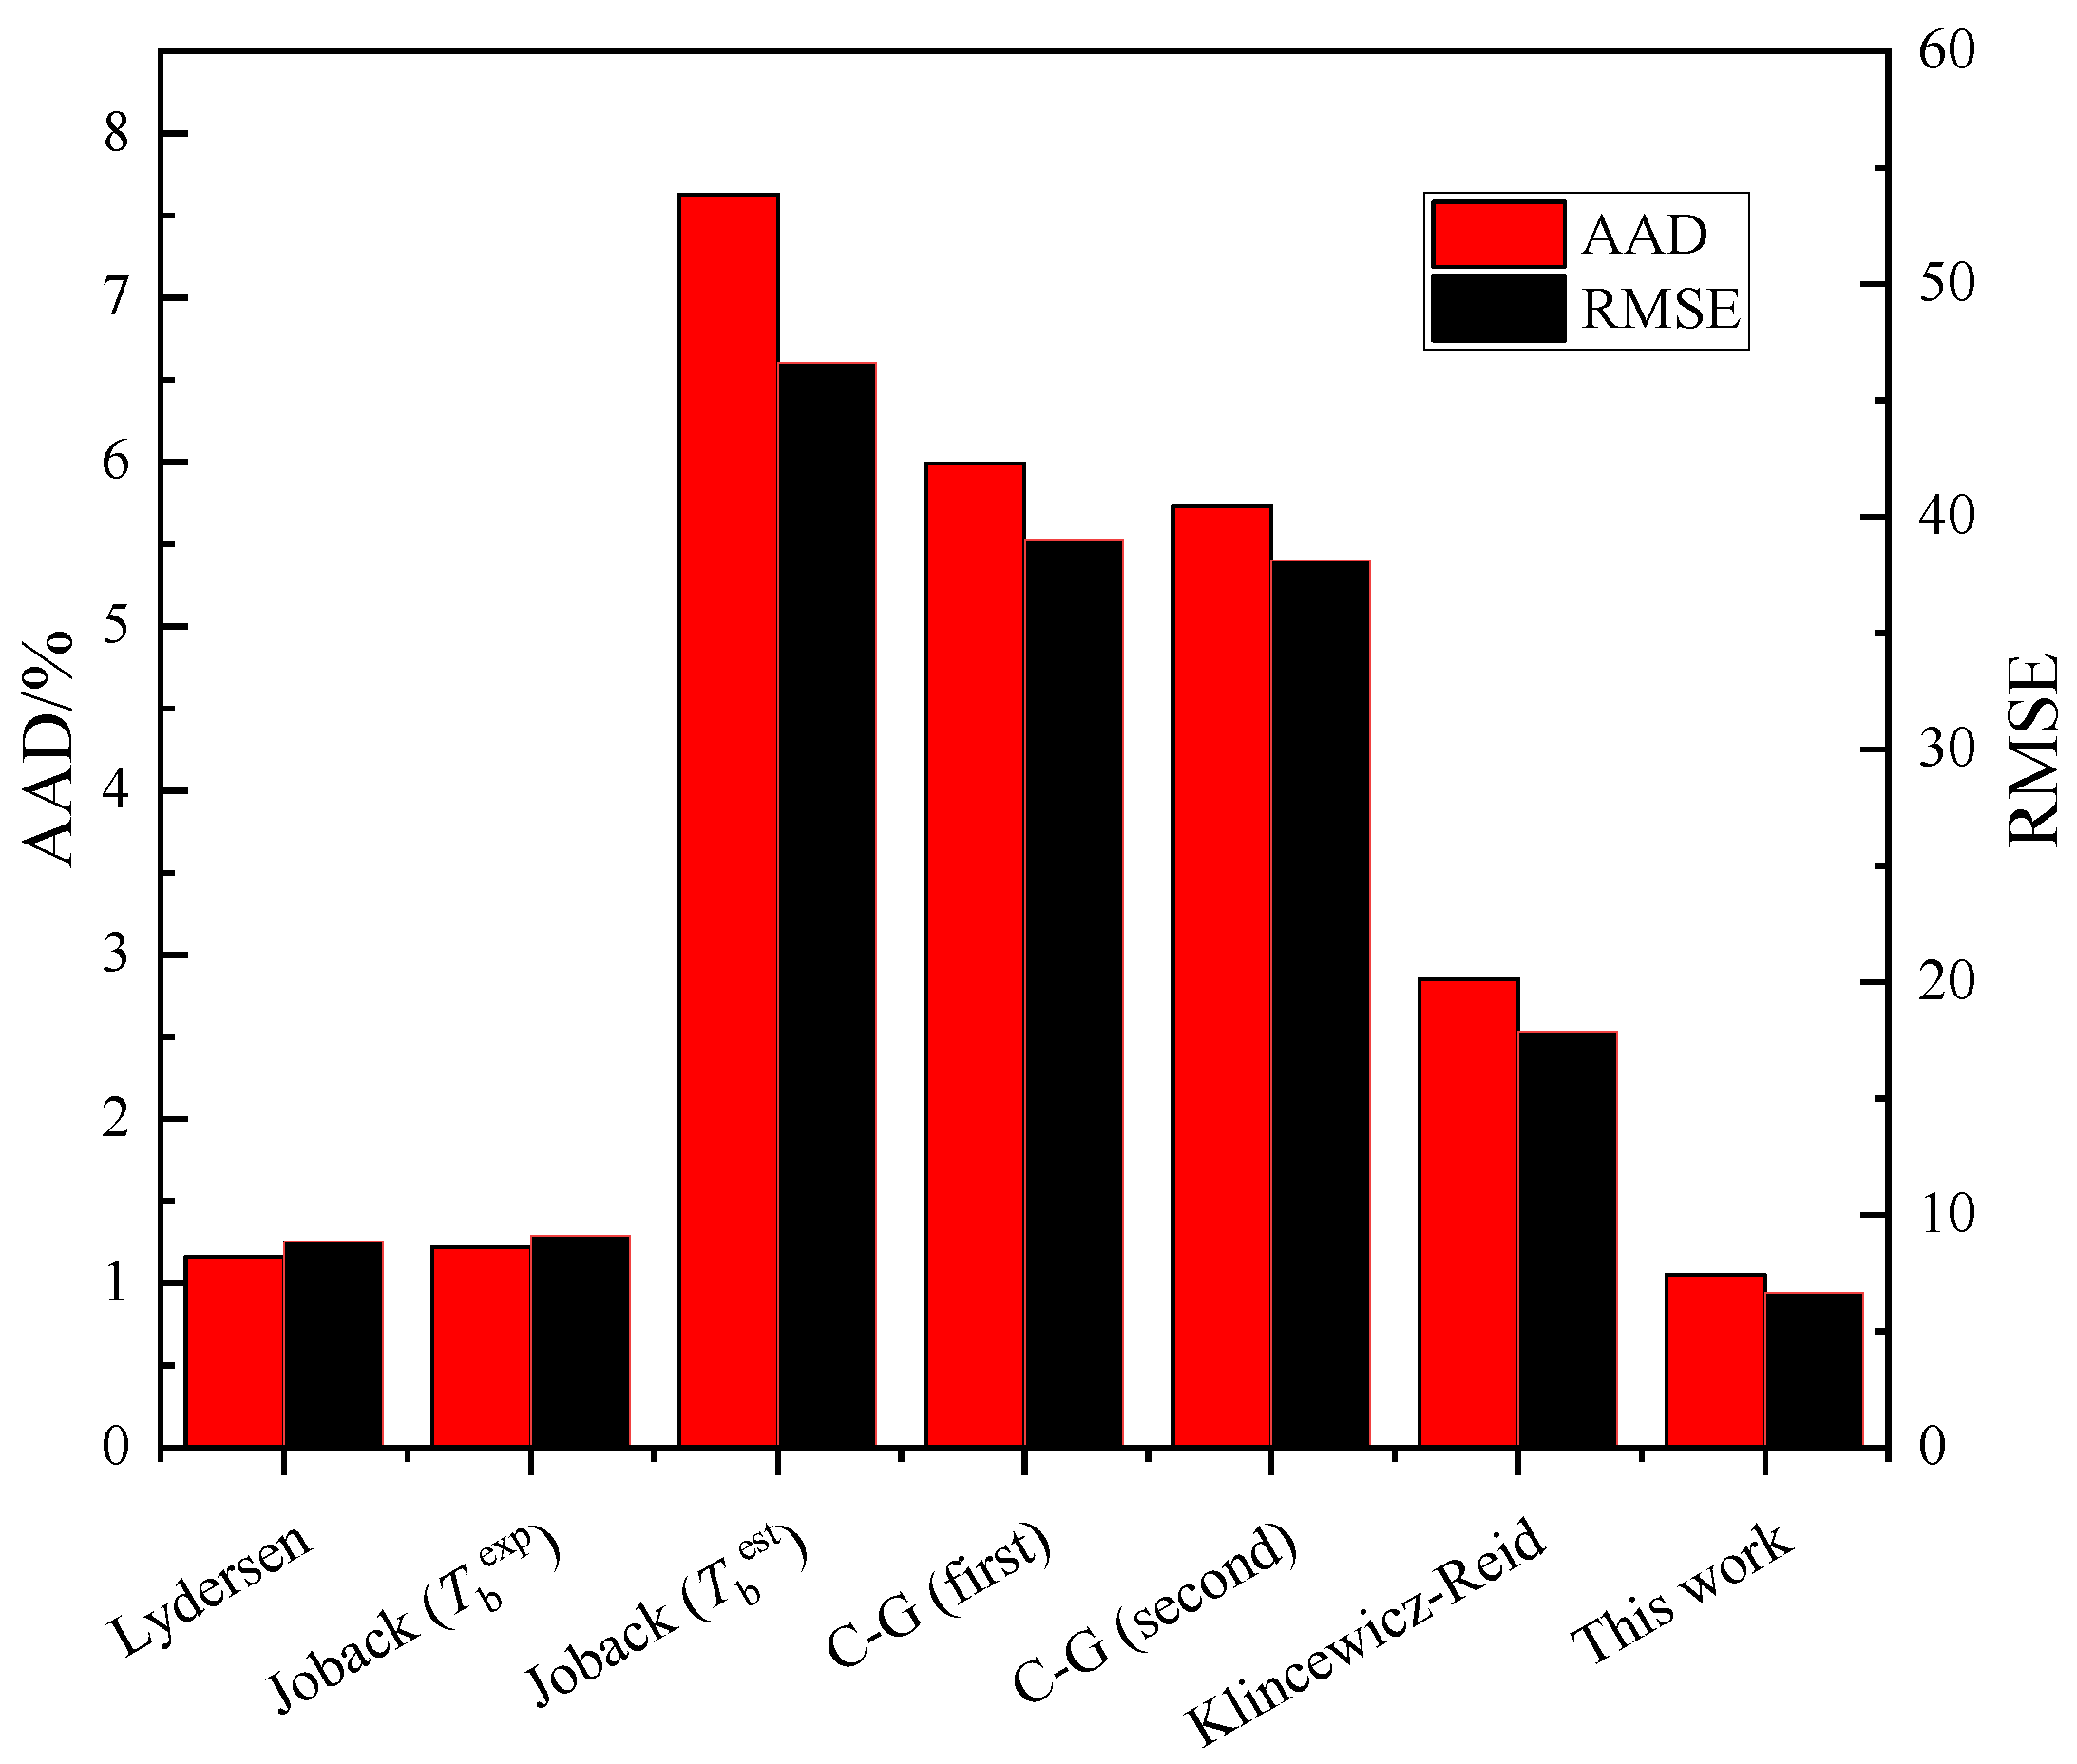
3.3. Comparisons with Existing Methods

Three existing group contribution methods (GCMs) and an empirical correlation for the estimation of critical temperature were used to compare with the proposed model. The GCMs include the Lydersen, Joback, and Constantinou-Gani methods, and the differences between them are the division of groups and whether the boiling point (Tb) is needed in the estimation. All the methods were applied to 120 pure working fluid samples with available Tb collected in this article.
The comparison results are shown in Figure 6. It is noticed that the Joback method, based on the experimental boiling points (Tbexp), exhibits relatively good performance in the estimation of Tc. However, the experimentally determined values of Tb may not always be available. When the estimated values (Tbest) were considered in the Joback method, its accuracy showed a marked decline.
The Constantinou-Gani (C-G) method does not need to use a normal boiling point; it involves two orders of groups, and the second groups are used to overcome the limitation that the first groups cannot distinguish isomers in molecular structures. The C-G method, taking second groups into account, has higher accuracy than single first groups, and the estimated value is more reliable. However, there are still some problems in the C-G method. For example, the estimation performance of substances composed of very small molecules is poor. Besides, many substances cannot be correctly separated because the division of second groups is not comprehensive; thus only a small part of isomers can be discriminated by the C-G method. The Klincewicz-Reid method correlates critical temperature with molecular weight (Mw) and boiling point and gives a simple linear regression function. This function provides relatively reasonable estimations. However, as mentioned earlier, correlating molecular weights with Tc still lacks theoretical basis.
By means of comparison, the MLP + Pubchem model proposed in this paper effectively solves the problem of distinguishing isomers and obtains the best accuracy on the premise of not relying on experimental values of boiling points.

3.4. Distinction of Isomers

The C-G method can partially discriminate isomers with the aid of a second group. The MLP + Pubchem model also has this ability depending on the molecular fingerprints and topological index. Table 2 shows the estimation results of our proposed model as opposed to the C-G (second) method.
Tcal1 and Tcal2 denote the estimated critical temperature values of the MLP + Pubchem model and the C-G (second) method, respectively. Apparently, while the C-G (second) method cannot distinguish cis and trans isomers and achieve worse estimation performance in structural isomers, the proposed model can recognize isomers with decent prediction accuracy. The detailed calculation process and results can be found in the Supplementary Materials.

4. Conclusions

In this work, molecular fingerprints, which are derived from molecular structures, were used as the input of machine learning algorithms to establish the critical temperature prediction models of working fluids. By analyzing the prediction performances, it is found that Pubchem fingerprints can effectively characterize the molecular structures of working fluids when acting as the input of MLP to establish the ‘molecular structure-critical temperature’ relationship. In order to address the problem that Pubchem fingerprints cannot distinguish small parts of cis and trans isomers, the topological index S was introduced as a new feature of fingerprints. The modified fingerprints have a better structure recognition ability, leading to a significant improvement in the prediction performance of the Pubchem + MLP model. The R2 of the testing set reaches 0.9143, with an average deviation of 3.99%. Finally, the performance of the proposed model was compared with those of other previous methods, and the results indicate that the present model is superior to other approaches with respect to accuracy. This research provides a new approach to build the ‘molecular structure-critical temperature’ relationship for working fluids. By this ‘molecular structure-property’ method, the proposed model can also be applied in the physical property prediction of other common working fluid systems.

Supplementary Materials

The following supporting information can be downloaded at: https://www.mdpi.com/article/10.3390/pr10030577/s1, Table S1: Topological indices of working fluids.

Author Contributions

Conceptualization, Y.Q. and J.R.; methodology, S.R.; software, Z.H.; validation, Y.Q., S.R. and J.R.; formal analysis, J.R.; investigation, J.R.; resources, Y.Q.; data curation, Y.Q.; writing—original draft preparation, Y.Q. and J.R.; writing—review and editing, Y.Q., S.R. and J.R.; project administration, Y.Q.; funding acquisition, Y.Q. and J.R. All authors have read and agreed to the published version of the manuscript.

Funding

This work is supported by the National Natural Science Foundation of China (No. 51876015).

Institutional Review Board Statement

Not applicable.

Informed Consent Statement

Not applicable.

Data Availability Statement

Not applicable.

Acknowledgments

The authors wish to acknowledge Yu Liu (guest editor) and anonymous reviewers.

Conflicts of Interest

The authors declare no conflict of interest.

Nomenclature

AADabsolute average deviation
DTdecision tree
GCMgroup contribution method
GWPglobal warming potential
MLmachine learning
MLPmultilayer perceptron
MFmolecular fingerprint
ODPozone depletion potential
ORCorganic Rankine cycle
QSPRquantitative structure property relationship
R2coefficient of determination
RMSEroot mean square error
RFrandom forest
SMILESsimplified molecular input line entry specification
SVRsupport vector regression
TItopological index

References

  1. Wang, X.; Li, X.; Li, Q.; Liu, L.; Liu, C. Performance of a solar thermal power plant with direct air-cooled supercritical carbon dioxide Brayton cycle under off-design conditions. Appl. Energy 2020, 261, 114359. [Google Scholar] [CrossRef]
  2. Wang, S.; Liu, C.; Zhang, C.; Xu, X.; Li, Q. Thermo-economic evaluations of dual pressure organic Rankine cycle (DPORC) driven by geothermal heat source. J. Renew. Sustain. Energy 2018, 10, 063901. [Google Scholar] [CrossRef]
  3. Chen, X.; Liu, C.; Li, Q.; Wang, X.; Wang, S. Dynamic behavior of supercritical organic Rankine cycle using zeotropic mixture working fluids. Energy 2020, 191, 116576. [Google Scholar] [CrossRef]
  4. Wang, S.; Liu, C.; Li, Q.; Liu, L.; Zhang, C. Selection principle of working fluid for organic Rankine cycle based on environmental benefits and economic performance. Appl. Therm. Eng. 2020, 178, 115598. [Google Scholar] [CrossRef]
  5. Mahmoudi, A.; Fazli, M.; Morad, M.R. A recent review of waste heat recovery by Organic Rankine Cycle. Appl. Therm. Eng. 2018, 143, 660–675. [Google Scholar] [CrossRef]
  6. Samudra, A.; Sahinidis, N.V. Design of Secondary Refrigerants: A Combined Optimization-Enumeration Approach. In Design for Energy and the Environment; El Halwagi, M.M., Linninger, A.A., Eds.; CRC Press: Boca Raton, FL, USA, 2010; pp. 879–886. [Google Scholar]
  7. Liu, B.T.; Chien, K.H.; Wang, C.C. Effect of working fluids on organic Rankine cycle for waste heat recovery. Energy 2004, 29, 1207–1217. [Google Scholar] [CrossRef]
  8. Kay, W.B.; Pak, S.C. Determination of the critical constants of high-boiling hydrocarbons Experiments with gallium as a containing liquid. J. Chem. Thermodyn. 1980, 12, 673–681. [Google Scholar] [CrossRef]
  9. Kleinrahm, R.; Wagner, W. Measurement and correlation of the equilibrium liquid and vapour densities and the vapour pressure along the coexistence curve of methane. J. Chem. Thermodyn. 1986, 18, 739–760. [Google Scholar] [CrossRef]
  10. Su, W.; Zhao, L.; Deng, S. Group contribution methods in thermodynamic cycles: Physical properties estimation of pure working fluids. Renew. Sustain. Energy Rev. 2017, 79, 984–1001. [Google Scholar] [CrossRef]
  11. Reid, R.C.; Sherwood, T.K.; Street, R.E. The properties of gases and liquids. Phys. Today 1959, 18, 739–760. [Google Scholar] [CrossRef]
  12. Vejahati, F.; Nikoo, M.B.; Mokhatab, S.; Towler, B.F. Simple Correlation Estimates Critical Properties of Alkanes. Pet. Sci. Technol. 2007, 25, 1115–1123. [Google Scholar] [CrossRef]
  13. Klincewicz, K.M.; Reid, R.C. Estimation of critical properties with group contribution methods. AIChE J. 1984, 30, 137–142. [Google Scholar] [CrossRef]
  14. Riedel, L. Additives Verfahren zur Abschätzung der kritischen Temperatur aus dem normalen Siedepunkt. Chem. Ing. Tech. 1952, 24, 353–357. [Google Scholar] [CrossRef]
  15. Lydersen, L.A. Estimation of Critical Properties of Organic Compounds Vol. 2; Engineering Experiment Station Report 3; College of Engineering, University of Wisconsin: Madison, WI, USA, 1955; p. 12S. [Google Scholar]
  16. Joback, K.G.; Reid, R.C. Estimation of pure-component properties from group-contribution. Chem. Eng. Commun. 1987, 57, 233–243. [Google Scholar] [CrossRef]
  17. Constantinou, L.; Gani, R. New group contribution method for estimating properties of pure compounds. AIChE J. 1994, 40, 1697–1710. [Google Scholar] [CrossRef]
  18. Marrero-Morejón, J.; Pardillo-Fontdevila, E. Estimation of pure compound properties using group-interaction contributions. AIChE J. 1999, 45, 615–621. [Google Scholar] [CrossRef]
  19. Wang, Q.; Ma, P.; Jia, Q.; Xia, S. Position Group Contribution Method for the Prediction of Critical Temperatures of Organic Compounds. J. Chem. Eng. Data 2008, 53, 1103–1109. [Google Scholar] [CrossRef]
  20. Frenkel, D.; Smit, B. Understanding Molecular Simulation: From Algorithms to Applications, 2nd ed.; Academic Press: New York, NY, USA, 2002. [Google Scholar]
  21. Gabriele, R. Molecular Simulation Studies on the Vapor–Liquid Phase Equilibria of Binary Mixtures of R-1234yf and R-1234ze(E) with R-32 and CO2. J. Chem. Eng. Data 2013, 58, 1867–1873. [Google Scholar]
  22. Dong, X.; Gong, M.; Li, X.; Wu, J.; Yang, Z. Molecular modeling and simulation of vapor–liquid equilibrium of the refrigerant R152a and its mixture R152a+R32. Fluid Phase Equilibria 2015, 394, 93–100. [Google Scholar]
  23. Cai, S.; Li, Q.; Liu, C.; Zhou, Y. Evaporation of R32/R152a mixtures on the Pt surface: A molecular dynamics study. Int. J. Refrig. 2020, 113, 156–163. [Google Scholar] [CrossRef]
  24. Li, Q.; Xiao, Y.; Shi, X.; Song, S. Rapid Evaporation of Water on Graphene/Graphene-Oxide: A Molecular Dynamics Study. Nanomaterials 2017, 7, 265. [Google Scholar] [CrossRef] [PubMed]
  25. Hu, J.; Liu, C.; Li, Q.; Shi, X. Molecular simulation of thermal energy storage of mixed CO2/IRMOF-1 nanoparticle nanofluid. Int. J. Heat Mass Transf. 2018, 125, 1345–1348. [Google Scholar] [CrossRef]
  26. Huo, E.; Liu, C.; Xu, X.; Li, Q.; Dang, C. The oxidation decom position mechanisms of HFO-1336mzz(Z) as an environmentally friendly refrigerant in O2/H2O environment. Energy 2019, 185, 1154–1162. [Google Scholar] [CrossRef]
  27. Maleki, A.A.H.; Mahariq, I. Machine learning-based approaches for modeling thermophysical properties of hybrid nanofluids: A comprehensive review. J. Mol. Liq. 2021, 322, 114843. [Google Scholar] [CrossRef]
  28. Mitchell, J. Machine learning methods in chemoinformatics. Wiley Interdiscip. Rev. Comput. Mol. Sci. 2014, 4, 468–481. [Google Scholar] [CrossRef] [PubMed] [Green Version]
  29. Venkatraman, V.; Evjen, S.; Knuutila, H.K.; Fiksdahl, A.; Alsberg, B.K. Predicting ionic liquid melting points using machine learning. J. Mol. Liq. 2018, 264, 318–326. [Google Scholar] [CrossRef]
  30. Deng, S.; Su, W.; Zhao, L. A neural network for predicting normal boiling point of pure refrigerants using molecular groups and a topological index. Int. J. Refrig. 2016, 63, 63–71. [Google Scholar] [CrossRef]
  31. Zolfaghari, H.; Yousefi, F. Thermodynamic properties of lubricant/refrigerant mixtures using statistical mechanics and artificial intelligence. Int. J. Refrig. 2017, 80, 130–144. [Google Scholar] [CrossRef]
  32. Gao, N.A.; Wang, X.B.; Xuan, Y.A.; Chen, G. An artificial neural network for the residual isobaric heat capacity of liquid HFC and HFO refrigerants. Int. J. Refrig. 2019, 98, 381–387. [Google Scholar] [CrossRef]
  33. Gharagheizi, F.; Eslamimanesh, A.; Mohammadi, A.H.; Richon, D. Determination of Critical Properties and Acentric Factors of Pure Compounds Using the Artificial Neural Network Group Contribution Algorithm. J. Chem. Eng. Data 2011, 56, 2460–2476. [Google Scholar] [CrossRef]
  34. Kohberger, R. Similarity and Clustering in Chemical Information Systerns. Technometrics 1990, 32, 359–360. [Google Scholar] [CrossRef]
  35. Domenico, A.; Daniela, T.; Kamel, M.; Felice, M.G.; Orazio, N. Prediction of Acute Oral Systemic Toxicity Using a Multifingerprint Similarity Approach. Toxicol. Sci. 2019, 167, 484–495. [Google Scholar]
  36. Yi, D.A.; Mc, B.; Chao, G.A.; Peng, Z.C.; Jw, A. Molecular fingerprint-based machine learning assisted QSAR model development for prediction of ionic liquid properties. J. Mol. Liq. 2021, 326, 115212. [Google Scholar]
  37. Bahadori, A.; Tavalaeian, M.; Soleimani, R.; Lee, M.; Hashemkhani, M. Prediction of the binary surface tension of mixtures containing ionic liquids using Support Vector Machine algorithms. J. Mol. Liq. 2015, 211, 534–552. [Google Scholar]
  38. Huo, Y.; Bouffard, F.; Joós, G. Decision tree-based optimization for flexibility management for sustainable energy microgrids. Appl. Energy 2021, 290, 116772. [Google Scholar] [CrossRef]
  39. Liaw, A.; Wiener, M. Classification and Regression by randomForest. R News 2002, 2, 18–22. [Google Scholar]
  40. Cheshmberah, F.; Fathizad, H.; Parad, G.A.; Shojaei, S. Comparison of RBF and MLP neural network performance and regression analysis to estimate carbon sequestration. Int. J. Environ. Sci. Technol. 2020, 17, 3891–3900. [Google Scholar] [CrossRef]
  41. Calm, J.M.; Hourahan, G.C. Physical, safety, and environmental data for current and alternative refrigerants. In Proceedings of the 23rd International Congress of Refrigeration (ICR2011), Prague, Czech Republic, 21–26 August 2011. [Google Scholar]
  42. Dong, J.; Cao, D.-S.; Miao, H.-Y.; Liu, S.; Deng, B.-C.; Yun, Y.-H.; Wang, N.-N.; Lu, A.-P.; Zeng, W.-B.; Chen, A.F. ChemDes: An integrated web-based platform for molecular descriptor and fingerprint computation. J. Cheminform. 2015, 7, 60. [Google Scholar]
  43. Schultz, H.P.; Schultz, T.P.; Schultz, E.B. Topological Organic Chemistry. 9. Graph Theory and Molecular Topological Indices of Stereoisomeric Organic Compounds. J. Chem. Inf. Comput. Sci. 1995, 35, 864–870. [Google Scholar] [CrossRef]
  44. Haruo, H. Topological Index. A Newly Proposed Quantity Characterizing the Topological Nature of Structural Isomers of Saturated Hydrocarbons. Bull. Chem. Soc. Jpn. 1971, 44, 2332–2339. [Google Scholar]
  45. Steinbeck, C.; Han, Y.; Kuhn, S.; Horlacher, O.; Willighagen, E. The Chemistry Development Kit (CDK): An Open-Source Java Library for Chemo- and Bioinformatics. ChemInform 2003, 34, 493–500. [Google Scholar] [CrossRef] [Green Version]
Figure 1. Schematic diagram of fingerprint of a molecule.
Processes 10 00577 g001
Figure 2. Predictive performance of each model on the testing set.
Processes 10 00577 g002
Figure 3. Predictive performance of MLP + Pubchem model.
Processes 10 00577 g003
Figure 4. Predictive performance of the SVR + modified Pubchem model.
Processes 10 00577 g004
Figure 5. Predictive performance of the MLP + modified Pubchem model.
Processes 10 00577 g005
Figure 6. The comparisons between the proposed model and previous models.
Processes 10 00577 g006
Table 1. Length of fingerprints after variance threshold.
FingerprintsMACCSPubchemExtendedMorgan
Length16688110242048
After removal4280191376
Table 2. Prediction samples of isomers in pure working fluids.
CompoundsSTexp/KTcal1/KDeviation/%Tcal2/KDeviation/%
(Z)-1,2-Dichloroethylene3846507.25518.972.3105558.4510.094
(E)-1,2-Dichloroethylene2838535.8533.20.4853558.454.228
(Z)-1,2,3,3,3-Pentafluoropropene7758379.25376.130.822435.302.003
(E)-1,2,3,3,3-Pentafluoropropene6636386.75376.212.727435.3013.789
(Z)-2-Butylene180435.5437.400.436430.031.257
(E)-2-Butylene68428.6426.330.530430.030.333
1,1,1,2,2,3-Hexafluoropropane8276403.35411.482.017404.060.175
1,1,1,2,3,3-Hexafluoropropane8741412.45411.010.349494.5219.897
1,1,1,3,3,3-Hexafluoropropane8984398.1410.773.183386.512.912
2,2,3-Trimethylpentane424563.5573.401.757566.242.736
2,2,4-Trimethylpentane460543.8545.110.241545.160.250
2,3,3-Trimethylpentane412573.5573.060.077594.423.648
2,3,4-Trimethylpentane426566.4567.140.130588.603.920
Publisher’s Note: MDPI stays neutral with regard to jurisdictional claims in published maps and institutional affiliations.

