Article

Celastrol with a Knockdown of miR-9-2, miR-17 and miR-19 Causes Cell Cycle Changes and Induces Apoptosis and Autophagy in Glioblastoma Multiforme Cells

by
Monika Paul-Samojedny
*,
Emilia Liduk
,
Paulina Borkowska
,
Aleksandra Zielińska
,
Małgorzata Kowalczyk
,
Renata Suchanek-Raif
and
Jan Alojzy Kowalski
Department of Medical Genetics, School of Pharmaceutical Sciences in Sosnowiec, Medical University of Silesia, 40-055 Katowice, Poland
*
Author to whom correspondence should be addressed.
Processes 2022, 10(3), 441; https://doi.org/10.3390/pr10030441
Submission received: 18 November 2021 / Revised: 17 February 2022 / Accepted: 18 February 2022 / Published: 22 February 2022
(This article belongs to the Special Issue 10th Anniversary of Processes: Women's Special Issue Series)

Abstract

:
Glioblastoma multiforme (GBM) is a cancer with extremely high aggressiveness, malignancy and mortality. Because of all of the poor prognosis features of GBM, new methods should be sought that will effectively cure it. We examined the efficacy of a combination of celastrol and a knockdown of the miR-9-2, miR-17 and miR-19 genes in the human glioblastoma U251MG cell line. U251MG cells were transfected with specific siRNA and exposed to celastrol. The effect of the knockdown of the miRs genes in combination with exposure to celastrol on the cell cycle (flow cytometry) and the expression of selected genes related to its regulation (RT-qPCR) and the regulation of apoptosis and autophagy was investigated. We found a significant reduction in cell viability and proliferation, an accumulation of the subG1-phase cells and a decreased population of cells in the S and G2/M phases, as well as the induction of apoptosis and autophagy. The observed changes were not identical in the case of the silencing of each of the tested miRNAs, which indicates a different mechanism of action of miR9-2, miR-17, miR-19 silencing on GBM cells in combination with celastrol. The multidirectional effects of the silencing of the genes encoding miR-9-2, miR-17 and miR-19 in combination with exposure to celastrol is possible. The studied strategy of silencing the miR overexpressed in GBM could be important in developing more effective treatments for glioblastoma. Additional studies are necessary in order to obtain a more detailed interpretation of the obtained results. The siRNA-induced miR-9-2, miR-17 and miR-19 mRNA knockdowns in combination with celastrol could offer a novel therapeutic strategy to more effectively control the growth of human GBM cells.

1. Introduction

Glioblastoma multiforme is a cancer with extremely high aggressiveness, malignancy and mortality [1]. It is characterized by an insufficient number of therapeutic possibilities and a poor prognosis. This is due to its unrestrained proliferation, infiltrative and rapid growth, neurodegeneration and diffuse tissue penetration [2]. This type of cancer in adults most often develops in the temporal lobe of the brain and might be composed of several types of different cells. Glioblastoma multiforme accounts for 17% of primary brain tumors. It most often develops between the ages of 50 and 70. The median survival of patients is only 14.7 months after diagnosis despite the aggressive and multifaceted therapeutic approaches that are currently being used [3,4]. Its worldwide incidence is 0.59–3.69 per 100,000 births and only 3% of patients survive for five years after the diagnosis [5]. Despite the numerous studies that have been conducted over many years, the exact factors that might indicate the basis of this tumor are not known.
Because there are also no effective methods of therapy, new substances that will provide an effective cure are constantly being sought. One of these is celastrol, which is a natural, pentacyclic, triterpene quinonomethyl compound. This bioactive substance is abundant in the plant Tripterygium wilfordii, which belongs to the Celastraceae family. Tripterygium wilfordii is a perennial grapevine that grows in south China. It is also known as Lei Gong Teng or Thunder God Vine in various parts of the world [6,7]. Many preclinical studies have indicated that this compound, which has been used for centuries in Chinese alternative medicine, has an anti-cancer effect [8]. Experience has shown that celastrol can induce autophagy, inhibit the cell cycle or the apoptosis of cancer cells [6]. In addition, it has been proven that it is able to suppress invasiveness, inhibit the growth of the tumor itself, and, additionally, has an anti-angiogenic effect [9]. Its influence on such key properties of tumors has prompted scientists to take a closer look at this natural substance.
Because of the poor prognosis features of glioblastoma multiforme, new methods are being sought that will effectively cure it. For this purpose, it is worth looking at microRNAs, which are small, non-coding, endogenous RNA molecules. Their role is to control gene expression by inhibiting the translation process or by binding to mRNA. MicroRNAs participate in most cellular processes such as the proliferation, differentiation, cell death and regulation of the cell cycle itself [10,11]. Moreover, each microRNA is able to influence mRNA either by acting as a potent oncogene or tumor suppressor [12]. In the presented experiment, miR-9-2, miR-17 and miR-19 were used because they are overexpressed in the studied tumor [11].
The miR-9-2 gene is expressed almost exclusively in the brain and is involved in the development of the nervous system. It is also involved in the regulation of many neoplastic processes. Its abnormal expression has been demonstrated in various neoplasms, while also pointing to its dual role, for example, as a pro-metastasis onco-miR in breast cancer, and as a tumor suppressor in melanoma. MiR-9-2 has been shown to significantly stimulate the proliferation, migration and invasion of glioblastoma cells and promote the production of new blood vessels in vitro and in vivo. MiR-9-2 has also been implicated in angiogenesis. It has been suggested that miR-9 is an inherent onco-miR in human glioma. However, the mechanisms that underlie the miR-9-2 overexpression, functional changes, the functions of miR-9-2 in glioma angiogenesis and the molecular mechanism by which miR-9-2 influences the malignant phenotypes in glioblastoma have not yet been fully elucidated [13].
Transcriptome analysis in glioblastoma cells showed that miR-17 expression is increased in high-grade tumors. Research results indicate that miR-17 acts specifically in the G1/S phase of the cell cycle and targets multiple genes involved in the transition between these phases. The contribution of miR-17 to cancer development is still under discussion. There are reports of both its oncogenic and suppressive role. MiR-17 is involved in regulating the autophagy process in glioblastoma. It has been shown that the inhibition of miR-17 expression activates autophagy and conditions the sensitization of GBM cells to treatment with chemotherapeutic agents and ionizing radiation [14].
The miR-17-92 cluster, to which miR-19 belongs, is considered the first miRNA cluster with oncogenic potential. It contains 6 single mature miRNAs, and miR-19 is a key oncogenic miRNA among the six members of miR-17-92 cluster. It has been shown that the expression of the miR-17-92 cluster is increased in glioblastoma multiforme. MiR-19 expression is increased in glioblastoma. MiR-19, a member of the miR-17-92 cluster, has been shown to play an oncogenic role in cancer formation. It is also known that miR-19 plays an important role in the pathogenesis of glioblastoma. In turn, inhibition of miR-17-92 clusters reduces cell proliferation and induces apoptosis in glioblastoma spheroid culture by increasing the expression of CDKN1A (cyclin-dependent kinase inhibitor 1A), E2F1, and PTEN. The participation of miR-19 in the glioblastoma process was confirmed as a recurrence.
In addition, miR-19 plays an important role in glioblastoma progression. MiR-19 is also considered a prognostic biomarker for glioma. It has been shown that high miR-19 expression in the patient’s serum is associated with poor survival. MiR-19 influences many biological characteristics of cancer cells by regulating target genes. The effect of miR-19 on the proliferation, apoptosis and migration of glioblastoma cells, and the effect of miR-19 on chemotherapy and radiotherapy have been demonstrated. Research results indicate that miR-19 inhibits the apoptosis of glioblastoma cells. It has also been reported that miR-19 promotes glioblastoma progression by the direct suppression of PPARα (peroxisome proliferator-activated α receptor, PPARα). It has also been reported that miR-19 promotes invasion and migration of glioblastoma cells by direct suppression of RhoB [15]. Therefore, miR-9-2, miR-19 and miR-17 can be identified as a potential target gene for glioblastoma therapy.
Currently, one of the molecular goals is to study the checkpoint genes that help to maintain the normal course of the cell cycle. It is believed that the genetic mutations and deletions of the cell cycle regulators could be one of the causes of this cancer [13]. Disruption of the proper functioning of these regulators causes the escape of glioblastoma cells from the points that control the cell cycle, which will help to increase the process of their proliferation and enable a tumor to survive [14].
Thus, the aim of our study was concerned with the changes in the cell-cycle, the proliferation and induction of apoptosis in U251MG glioblastoma multiforme cells after the miR-9-2, miR-17 and miR-19 gene knockdowns and their exposure to celastrol. The presented study was also undertaken to examine the effect of the siRNAs targeting indicated miR genes on U251MG cells susceptibility on celastrol.

2. Materials and Methods

2.1. Glioblastoma Multiforme Cell Culture

The human glioblastoma multiforme cell line U251MG was cultured in a modified Eagle’s Minimum Essential Medium (ATCC) that had been supplemented with heat-inactivated 10% fetal bovine serum (ATCC) and 10 µg/mL gentamicin (Invitrogen) at 37 °C with 5% CO2 in a humidified incubator.

2.2. Knockdown of the miR-9-2, miR-17 and miR-19 Gene in U251MG GBM Cells

The glioblastoma multiforme U251MG cells were seeded at 1.6 × 10⁴ cells per well in six-well plates and incubated for 24 h. Next, the U251MG cell line was transfected with the specific siRNAs that target miR-9-2 (siRNA sequence: 5′TATGAGTGTATTGGTCTTCAT3′), miR-17 (siRNA sequence: 5′GTGAAGGCACTTGTAGCATTA3′) and miR-19 (siRNA sequence: 5′TGCATAGTTGCACTACAAGAA3′) mRNA. Transfection was performed using FlexiTube siRNA Premix (Qiagen, Milan, Italy) according to the manufacturer’s protocol. The final concentration of siRNA was 1 nM siRNA for miR-9-2, miR-17 and miR-19 and the incubation duration was 48 h.

2.3. Celastrol Uptake

The celastrol was purchased from Sigma-Aldrich (cat no C0869-10MG). Freshly prepared stock solutions of celastrol were made in a serum-free medium immediately prior to treatment. Dose-response studies were conducted to determine the appropriate doses (0 μM, 0.5 μM, 1 μM, 2.5 μM, 5 μM, 10 μM) of celastrol for the cell cycle changes, the inhibition of cell growth and the induction of cell death. The U251MG cells were seeded in 96-well plates at 5 × 10³ cells for 24 h before the celastrol was administered. The celastrol was diluted in an Eagle’s Minimum Essential Medium to concentrations of 0, 0.5, 1, 2.5, 5 and 10 μM. After treatment for 24 h, the cytotoxicity of celastrol was analyzed with a trypan blue exclusion assay. Equal volumes of resuspended cells and the trypan blue solution (0.4% wt/vol) were mixed at a ratio of 1:1 and a 1 μM concentration of celastrol was selected. The U251MG GBM cells that had been transfected with miR-9-2-, miR-17- and miR-19-specific siRNA were treated with celastrol (1 μM) for 24 h (48 h after transfection).

2.4. Cell Cycle Analysis Using Flow Cytometry

The U251MG cells were seeded in six-well plates (at a density of 1.6 × 10⁴ cells per well), cultured overnight (24 h) and after the miR-9-2, miR-17 and miR-19 gene siRNA silencing, the cells were exposed to celastrol and the cell cycle was analyzed. After exposure, the cells were harvested and washed twice with ice-cold phosphate-buffered saline (PBS) (without Ca2+ and Mg2+), fixed in 70% ice-cold ethanol while undergoing low-speed vortexing (incubation for 1 h on ice). The samples were then treated with RNAse A (10 mg/mL; for 1 h at 37 °C); the nuclei were stained with propidium iodide (PI, 50 µg/mL) and analyzed using flow cytometry (FACS AriaII, Becton Dickinson, Franklin Lakes, NJ, USA). DNA histograms of the PI-stained cells and histograms that showed the distribution of cells in the different phases of the cell cycle were assessed. A total of 1 × 10⁴ nuclei from each sample were analyzed using an FACS AriaII flow cytometer. For each measurement, data from 10,000 single-cell events were collected. A gating strategy based on forward scatter versus side scatter used to exclude any doublets and debris. The cell cycle histograms were analyzed using BD FACSDiva Software V6.1.2 (Becton Dickinson, NJ, USA). The presented data were obtained from the DNA histograms and represent the average of three independent repeats.

2.5. RNA Extraction from U251MG Cells

Total RNA was isolated from the U251MG cells using a TRIzol reagent (Life Technologies, Inc., Carlsbad, NY, USA) according to the manufacturer’s protocol. The integrity of the total RNA was checked using electrophoresis in 1% agarose gel stained with ethidium bromide. All of the RNA extracts were treated with DNAse I in order to avoid any genomic DNA contamination. The quantity and quality of the RNA were evaluated using a BioPhotometer Plus spectrophotometry (Eppendorf).

2.6. Determining the mRNA Copy Number for the Cell Cycle and Apoptosis-Related Genes Using RT-qPCR

We performed RT-qPCR for the selected genes that are associated with regulating the cell cycle (CDC20, CDC25A, CDK4, CKS2, CDKN3 and MELK) and apoptosis (CASP3, CASP8, CASP9, GSK3B, BNIP3 and BID). The RT-QPCR assays were performed using a CFX96 Real-Time System (BIO-RAD), specific primers (KiCqStart® SYBR® Green Primers, Merck; QuantiTect Primer Assay, Qiagen; Table 1) and the GoTaq® 1-Step RT-qPCR System (Promega GmbH, Walldorf, Germany; A6020) according to the manufacturer’s protocol. The following conditions were used 37 °C for 15 min, 95 °C for 10 min followed by 40 cycles of 10 s at 95 °C, 30 s at 55 °C and 30 s at 72 °C. The RNA for the human TBP (Tata Binding Protein) was used as the endogenous control. Negative controls with no total RNA were included in each run of the RT-qPCR. A melting-curve analysis was performed to confirm the RT-qPCR specificity. The results were analyzed using a Bio-Rad CFX Manager v.3.1 provided by BIO-RAD Laboratories, Inc. The relative gene expression was obtained after normalization with the endogenous human TBP and the difference in threshold cycle (Ct) between the treated and untreated cells was determined using the 2−∆∆CT method. Each of the 12 data points for the mRNA copy numbers is the average of the duplicates on the same analyzed plate.

2.7. Statistical Analyses

The data are presented as the mean ± SD. A one-way ANOVA was performed for the statistical analyses. The statistical significance between the treatment groups was determined using Tukey’s post-hoc honest significant difference test. The data were analyzed using GraphPad Prism software version 8.0. All of the tests were two-sided and p < 0.05 was considered to be statistically significant. The fold change (2−∆∆CT) method was used to present the RT-qPCR results.

3. Results

3.1. Cell Viability Assay

The U251MG cells were treated with celastrol at various concentrations (0, 0.5, 1, 2.5, 5 and 10 μM) for 24 h and a trypan blue cell viability assay was then performed (Figure 1).
A celastrol concentration of 1 µM was selected for further analysis.

3.2. Cell Cycle Changes in the U251MG GBM Cells after the miR9-2, miR-17 and miR-19 Silencing and Exposure to Celastrol

In order to examine the possible mechanisms of the antiproliferative activity of the miR9-2, miR-17 and miR-19 siRNA in combination with celastrol (CEL), the distribution of the cell cycle phases was determined using flow cytometry. It was found that the siRNA that is specific for mi9-2 in combination with celastrol increased the percentage of the cells in the subG1 phase most intensively compared to the untransfected (control) cells, the U251MG cells that had only been exposed to celastrol and the cells with a knockdown of the miR9-2 gene (36.07% vs. 0.67% vs. 15.67% vs. 15.77). Additionally, the siRNA that is specific for mi9-2 decreased the percentage of the cells in the G1/G0 phase compared to the above-mentioned cell groups of the glioblastoma multiforme U251MG cells (42.9% vs. 75.3% vs. 74.57% vs. 59.07%). Moreover, celastrol significantly decreased the percentage of cells in the S (5.47% vs. 11.87% vs. 12.17% vs. 10.7%) and G2/M phases (3.0% vs. 8.46% vs. 8.96% vs. 9.6%). This phenomenon was not observed in the case of the miR9-2 silenced cells and the cells that had been transfected and then exposed to celastrol (Figure 2a).
It was found that the siRNA that is specific for miR-17 in combination with celastrol and the siRNA that is specific for miR-19 without and in combination with celastrol increased the percentage of the cells in the subG1 phase most intensively compared to the untransfected (control) cells and the U251MG cells that had only been exposed to celastrol (35.87%, 36.23%, 32.7% vs. 0.67%, respectively). Additionally, the siRNA that is specific for miR-17 and miR-19 in combination with celastrol decreased the percentage of the cells in the G1/G0 phase compared to the above-mentioned cell groups of the glioblastoma multiforme U251MG cells (62.37%, 46.03% vs. 75.3%, respectively). Moreover, the siRNA that is specific for miR-17 without and in combination with celastrol significantly increased the percentage of cells in the S compared to the untransfected (control) cells (20.3%, 17.03%, vs. 11.87%, respectively) (Figure 2b). We also revealed that the siRNA that is specific for miR-17 and miR-19 without and in combination with celastrol and celastrol alone significantly decreased the percentage of cells in the G2/M phase (6.9%, 5.93%, 2.83%, 5.25% and 3.78% vs. 11.87%, respectively) (Figure 2b,c). We also revealed that the siRNA that is specific for miR-19 most strongly decreased the percentage of cells in the G2/M phase compared to the other studied groups (Figure 2b,c). This phenomenon was not observed in the case of the miR9-2-silenced cells (Figure 2b,c). We also revealed that the miR-17 that is specific for siRNA without and in combination with 1 μM celastrol increased the polyploidy of the U252MG cells (Figure 2b).
We also performed RT-qPCR for selected genes that are related to the regulation of the cell cycle: CDC25A, CDK4, CDC20, MELK, CDKN3, and CKS2. The gene expression levels between the untreated cells, the cells that had been treated with the siRNA that is specific for the miR-9-2, miR-17 or miR-19 gene and for the cells with the silenced genes that were mentioned above that had been exposed to celastrol were compared.
We found that the changes in cell cycle-related genes after the miR-9-2 knockdown were mainly manifested in a decreased MELK and CDKN3 (~two-fold) gene expression. Celastrol increased CDK4 (antagonistically to be combined with miR-9-2 gene silencing) and CDC20 (comparable to combining with the miR-9-2 gene silencing) and decreased MELK (comparable to combining with the miR-9-2 gene silencing) and the CKS2 gene expression. Only the knockdown of the miR-9-2 gene significantly decreased the expression of the CDKN3 gene. In addition, only the combination of miR-9-2 gene silencing with the exposure of the U251MG cells to celastrol decreased the expression of the CDC25A and CDK4 genes (Figure 3a; Table 2).
We found that the changes in the cell cycle-related genes after the miR-17 knockdown were mainly manifested in a decreased CDC25A, CDK4 and CDKN3 (comparable to combining with the miR-17 gene silencing and celastrol exposure) gene expression and an increased CKS2 gene expression (comparable with the combination with celastrol). The knockdown of the miR-17 gene in combination with celastrol increased the CKS2 gene expression more strongly than just silencing the miR-17. Only the knockdown of the miR-17 gene decreased the expression of the CDKN3 gene (Figure 3b; Table 2)
We also revealed that the changes in cell cycle-related genes after the miR-19 knockdown were mainly manifested in a decreased CDC25A, CDK4, MELK and CDKN3 gene expression. Celastrol significantly increased the CDC20 gene expression (comparable to a combination of the miR-19 silencing with celastrol). The knockdown of the miR-19 gene in combination with celastrol increased the CKS2 gene expression more strongly than just silencing the miR-17 and increased the CDC25A gene expression (Figure 3c; Table 2).
To summarize, silencing the miR-9-2 gene and exposing the U251MG cells to celastrol most strongly decreased the expression of the CDC25A and MELK genes. On the other hand, silencing the miR-19 gene in combination with celastrol most strongly increased the expression of the CDC25A and CDC20 genes and most strongly decreased the expression of the CDKN3 gene. At the same time, silencing the above = mentioned gene most strongly decreased the expression of the CDK4 gene, while celastrol itself most strongly increased the expression of this gene. Silencing the miR-17 gene most strongly decreased the expression of the CDC20 and CDKN3 genes, while in combination with celastrol, it most strongly increased the expression of the CKS2 gene (Table 3).

3.3. Induction of Apoptosis and Autophagy in the U251MG GBM Cells after miR-9-2, miR-17 or miR-19 Silencing and Exposure to Celastrol

We performed RT-qPCR for the selected genes related to the regulation of apoptosis: CASP3, CASP8, CASP9, BID and GSK3B (also autophagy), BNIP3 (also autophagy), PDCD1L and autophagy: BECN1, ULK1 and MAPLC3IIA. The gene expression levels between the untreated cells, the cells that had been treated with the siRNA that is specific for the miR-9-2, miR-17 or miR-19 genes and for the cells with the silenced genes mentioned above that had been exposed to celastrol were compared.
We found that the changes in the apoptosis-related genes after the miR-9-2 knockdown were mainly manifested in an increased CASP8, CASP9, BID, GSK3B, BNIP3 and PDCD1L gene expression. In turn, celastrol increased the expression of all of the genes mentioned above except GSK3B. The knockdown of the miR-9-2 gene in combination with the exposure to celastrol increased CASP9, BID and PDCD1L decreased (antagonistically to celastrol) BNIP3 and decreased GSK3B (antagonistically to the miR-9-2 silencing only) gene expression (Figure 4a; Table 4).
We found that the changes in the apoptosis-related genes after the miR-17 knockdown were mainly manifested in an increased CASP8, CASP9, BID and PDCD1L expression and a decreased BNIP3 (comparable to combining with miR-9-2 gene silencing and celastrol exposure) gene expression. The knockdown of the miR-17 gene in combination with celastrol increased the expression of all of the tested genes related to apoptosis. The knockdown of the miR-17 gene in combination with celastrol increased the GSK3B gene expression more strongly than just silencing the miR-19 in combination with celastrol (p < 0.05; U-Mann Whitney test) (Figure 4b,c; Table 4).
We also revealed that the changes in the apoptosis-related genes after the miR-19 knockdown were mainly manifested in an increased CASP3, CASP8, CASP9, BID, GSK3B and PDCD1L gene expression. The knockdown of the miR-19 gene in combination with celastrol increased PDCD1L gene expression more strongly than just silencing the miR-19 (Figure 4c; Table 4).
To summarize, silencing miR-9-2 in combination with celastrol most strongly decreased the expression of the CASP3 and GSK3B genes. On the other hand, silencing the miR-17 gene most strongly increased the expression of the CASP9 and GSK3B genes. At the same time, silencing the miR-17 gene most strongly decreased the expression of the BNIP3 gene, while celastrol alone most strongly increased the expression of the CASP9, BID and BNIP3 genes. The knockdown of the miR-17 gene in combination with celastrol most strongly increased the expression of the CASP8 gene. Additionally, miR-19 gene silencing most strongly increased the expression of the PDCD1L gene (Table 5).
We found that the changes in the autophagy-related genes after the miR-9-2 knockdown as well as after the exposure of the U251MG cells to celastrol were mainly manifested in an increased BECN1 and ULK1 gene expression (Figure 5a; Table 6). The knockdown of the miR-17 and miR-19 genes without and in combination with exposure to celastrol increased the BECN1, ULK1 and MAPLC3IIA gene expression (Figure 5b,c; Table 6).
To summarize, silencing the miR-17 gene and exposing U251MG cells to celastrol most strongly increased the expression of the BECN1 gene. On the other hand, silencing the miR-19 gene in combination with celastrol most strongly increased the expression of the MAPLC3IIA gene. At the same time, celastrol alone most strongly increased the expression of the ULK1 gene (comparable with the knockdown of the miR-19 gene) and decreased the expression of the MAPLC3IIA gene (comparable with the knockdown of the miR-9-2 gene without and in combination with celastrol) (Table 7).

4. Discussion

The resistance of cancer cells to chemotherapy is one of the greatest problems of modern clinical oncology. Glioblastoma multiforme (GBM) is one of the brain tumors for which there are currently no effective therapies. The median survival of patients with this type of cancer is 14.6 months, the median progression-free survival is 6.9 months and the five-year survival is 9.8% [15,16]. Because of the resistance of glioblastoma to conventional chemotherapy and radiotherapy, it is necessary to develop new, more effective methods that would use the molecular disorders characteristic of this cancer. miRNAs, which can regulate the expression of more than 60% of human genes, are of great importance in neoplastic transformation, including oncogenes, suppressor genes and the genes related to chemoresistance.
The possibility of regulating the expression of these genes based on the phenomenon of RNA interference, their expression vectors and their combination with substances of natural origin such as, for example, celastrol, could be a potential method for reducing the invasiveness of glioblastoma and additionally increasing its sensitivity to the chemotherapeutic agents used.
The use of the technique based on the phenomenon of RNA interference might turn out to be important, especially in the treatment of neoplasms of the nervous system because of the possibility of their crossing the blood–brain barrier, which impermeable to most cytostatic drugs. Because of their biochemical properties, RNA molecules are a promising therapeutic tool.
One of the newest strategies for the treatment of cancer, including brain tumors, is the use of molecules that affect the activity of miRNAs. Out of the 2.5 thousand miRNAs found in human cells, about 70% are expressed in the central nervous system, e.g., the expression of miR-9, miR-124a, miR-124b and miR-135 has only been demonstrated in nerve cells and miR-23 only in astrocytes [17]. It is known that 256 miRNAs are overexpressed and that 95 miRNAs have a decreased expression in glioblastoma. It has been shown, inter alia, an increased expression of miR-21, miR-10b, miR-15b, miR-16, miR-25, miR-92b, miR-93, miR-106, miR-155, miR-210, miR-17-5p, miR- 106, miR-148a and miR-196b and a decreased expression of miR132, miR-218, miR-124, miR-128a, miR-323, miR-128, miR-7, miR-181b, miR-221, miR-222, miR-31, miR-138, miR-181 and miR-379 [18,19]. Malkorn et al. (2010) identified 12 miRNAs: miR-9, miR-15a, miR-16, miR-17, miR-19a, miR-20a, miR-21, miR-25, miR-28, miR-130b, miR-140 and miR-210, which were overexpressed and two, miR-184 and miR-328, whose expression was underexpressed during tumor progression [20]. Hence, the inhibition of miRNA expression in glioblastoma cells could be an interesting therapeutic option. However, despite numerous studies that have confirmed the role of miRNAs in treating this type of cancer, studies that have shown its showing therapeutic efficacy are scarce. This type of procedure may also be effective in combination with other therapeutic methods because there is evidence that the expression of specific miRNAs is important for the sensitivity of glioblastoma cells to chemo- and radiotherapy [21], which confirms the validity of the attempts to use them in strategies for inhibiting the multidrug resistance of tumor cells [22,23,24].
This study included a preliminary analysis of the effect of celastrol in combination with the silencing of the genes encoding miR-9-2, miR-17, and miR-19, which are overexpressed in glioblastoma multiforme, on the cell cycle, the expression of selected genes related to its regulation and the expression of selected genes related to the regulation of programmed cell death—apoptosis and autophagy.
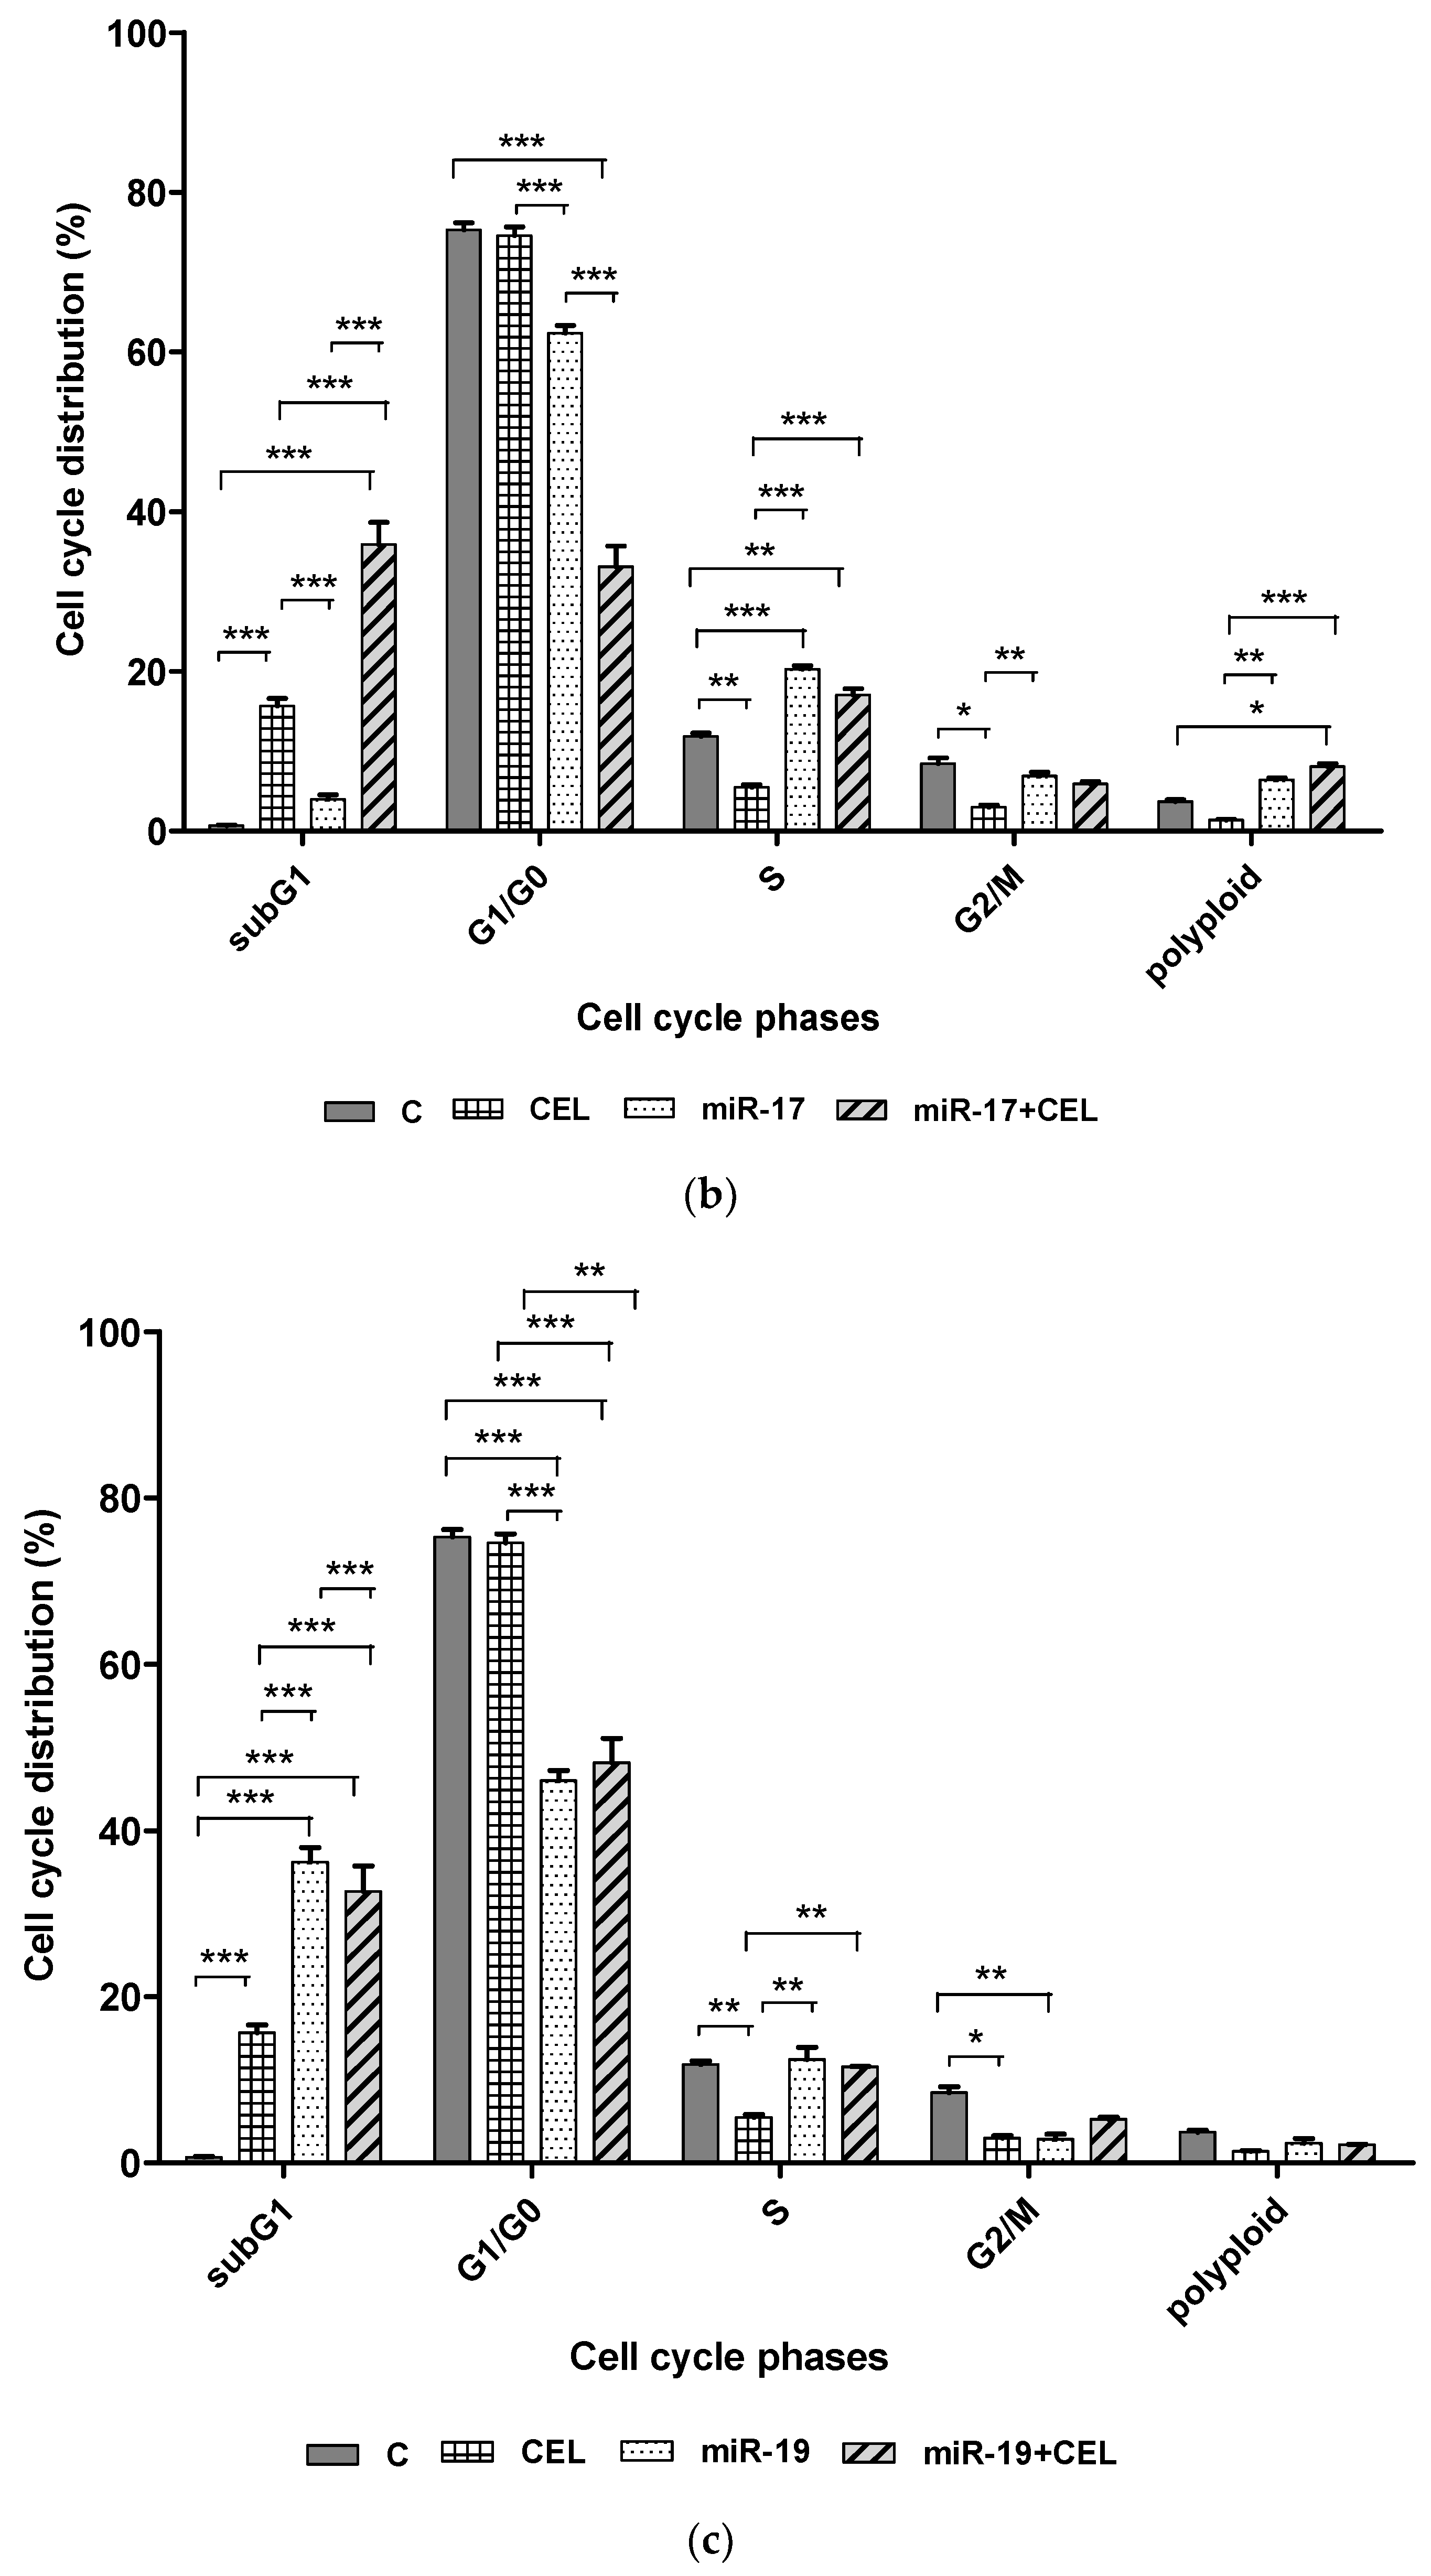
Whether silencing the genes encoding miR-9-2, miR-17, miR-19 and the exposure of U251MG glioblastoma cells to celastrol changed the percentage of cells at specific stages of the cell cycle was investigated. It was found that silencing miR-9-2, miR-17 and miR-19 in combination with exposure to celastrol significantly increased the percentage of the cells of the subG1 (potentially apoptotic) population, which might suggest the induction of apoptosis and also decreased the percentage of G1/G0 cells. A similar, though slightly weaker effect was observed with the cells that had been transfected but not exposed to celastrol. The exposure of the U251MG cell line to celastrol alone was associated with a less pronounced increase in the percentage of cells in the subG1 population. It was also shown that silencing the miR-17 and miR-19 genes and the combination of silencing these genes with the action of celastrol and the action of celastrol alone was associated with a decrease in the percentage of the G2/M population cells. In the case of silencing the miR-19 gene and exposure to celastrol, this was a synergistic effect. Cell cycle alteration is one of the triggers for the malignant behavior of cells seen in cancer, such as proliferation, invasion, and chemoresistance. Unfortunately, the mechanism of cell cycle regulation mediated by miR-17 is still unclear, especially in glioblastoma multiforme. In turn, the results obtained by Huang et al. (2021) indicate that miR-17 promotes cell cycle progression of the head and neck squamous cell carcinoma mainly by increasing the proportion of cells in the G2/M phase and reducing the proportion of cells in the S phase [25]. The reduction in the percentage of cells in the G2/S phase observed by us and an increase in the percentage of cells in the S phase of the cell cycle after silencing the miR-17 gene may indicate a similar effect on the progression of the cell cycle of glioblastoma multiforme cells.
The results of studies by other researchers indicate different mechanisms by which miR-17 promotes cell cycle progression. Cloonan et al. (2008) showed that miR-17 acts specifically at the G1/S phase boundary of the cell cycle, regulating the expression of more than 20 genes involved in the transition between these phases [26]. In turn, Li et al. (2015) observed that miR-17 promotes the proliferation of ovarian cancer cells by promoting G1/S cell cycle transition and inhibiting apoptosis. At the same time, inhibition of miR-17 expression was associated with the opposite effect [27]. Contrary to our research results, Zhu et al. (2018) showed that inhibition of miR-17 expression in pancreatic cancer cells resulted in a higher proportion of cells in the G1 phase and a lower proportion in the S phase, leading to impaired proliferation of neoplastic cells [28]. The results obtained by various researchers indicate that miR-17 acts mainly at the G1/S boundary in promoting cell cycle progression, which was also confirmed in our research. Our results, although different from those of other researchers, may help explain the role of miR-17 in promoting cell cycle progression in glioblastoma multiforme. The observed difference may be largely due to the role of miR-17 target genes in the regulation of the cell cycle of glioblastoma.
Celastrol also caused a significant decrease in the percentage of cells in the S phase of the cell cycle, which could indicate inhibition of replication. On the other hand, it was observed that silencing the miR-17 and miR-19 genes and combining miR-17 gene silencing with the exposure of the U251MG cells to celastrol induced cell cycle arrest in S phase, which was manifested by an increased percentage of cells in this population.
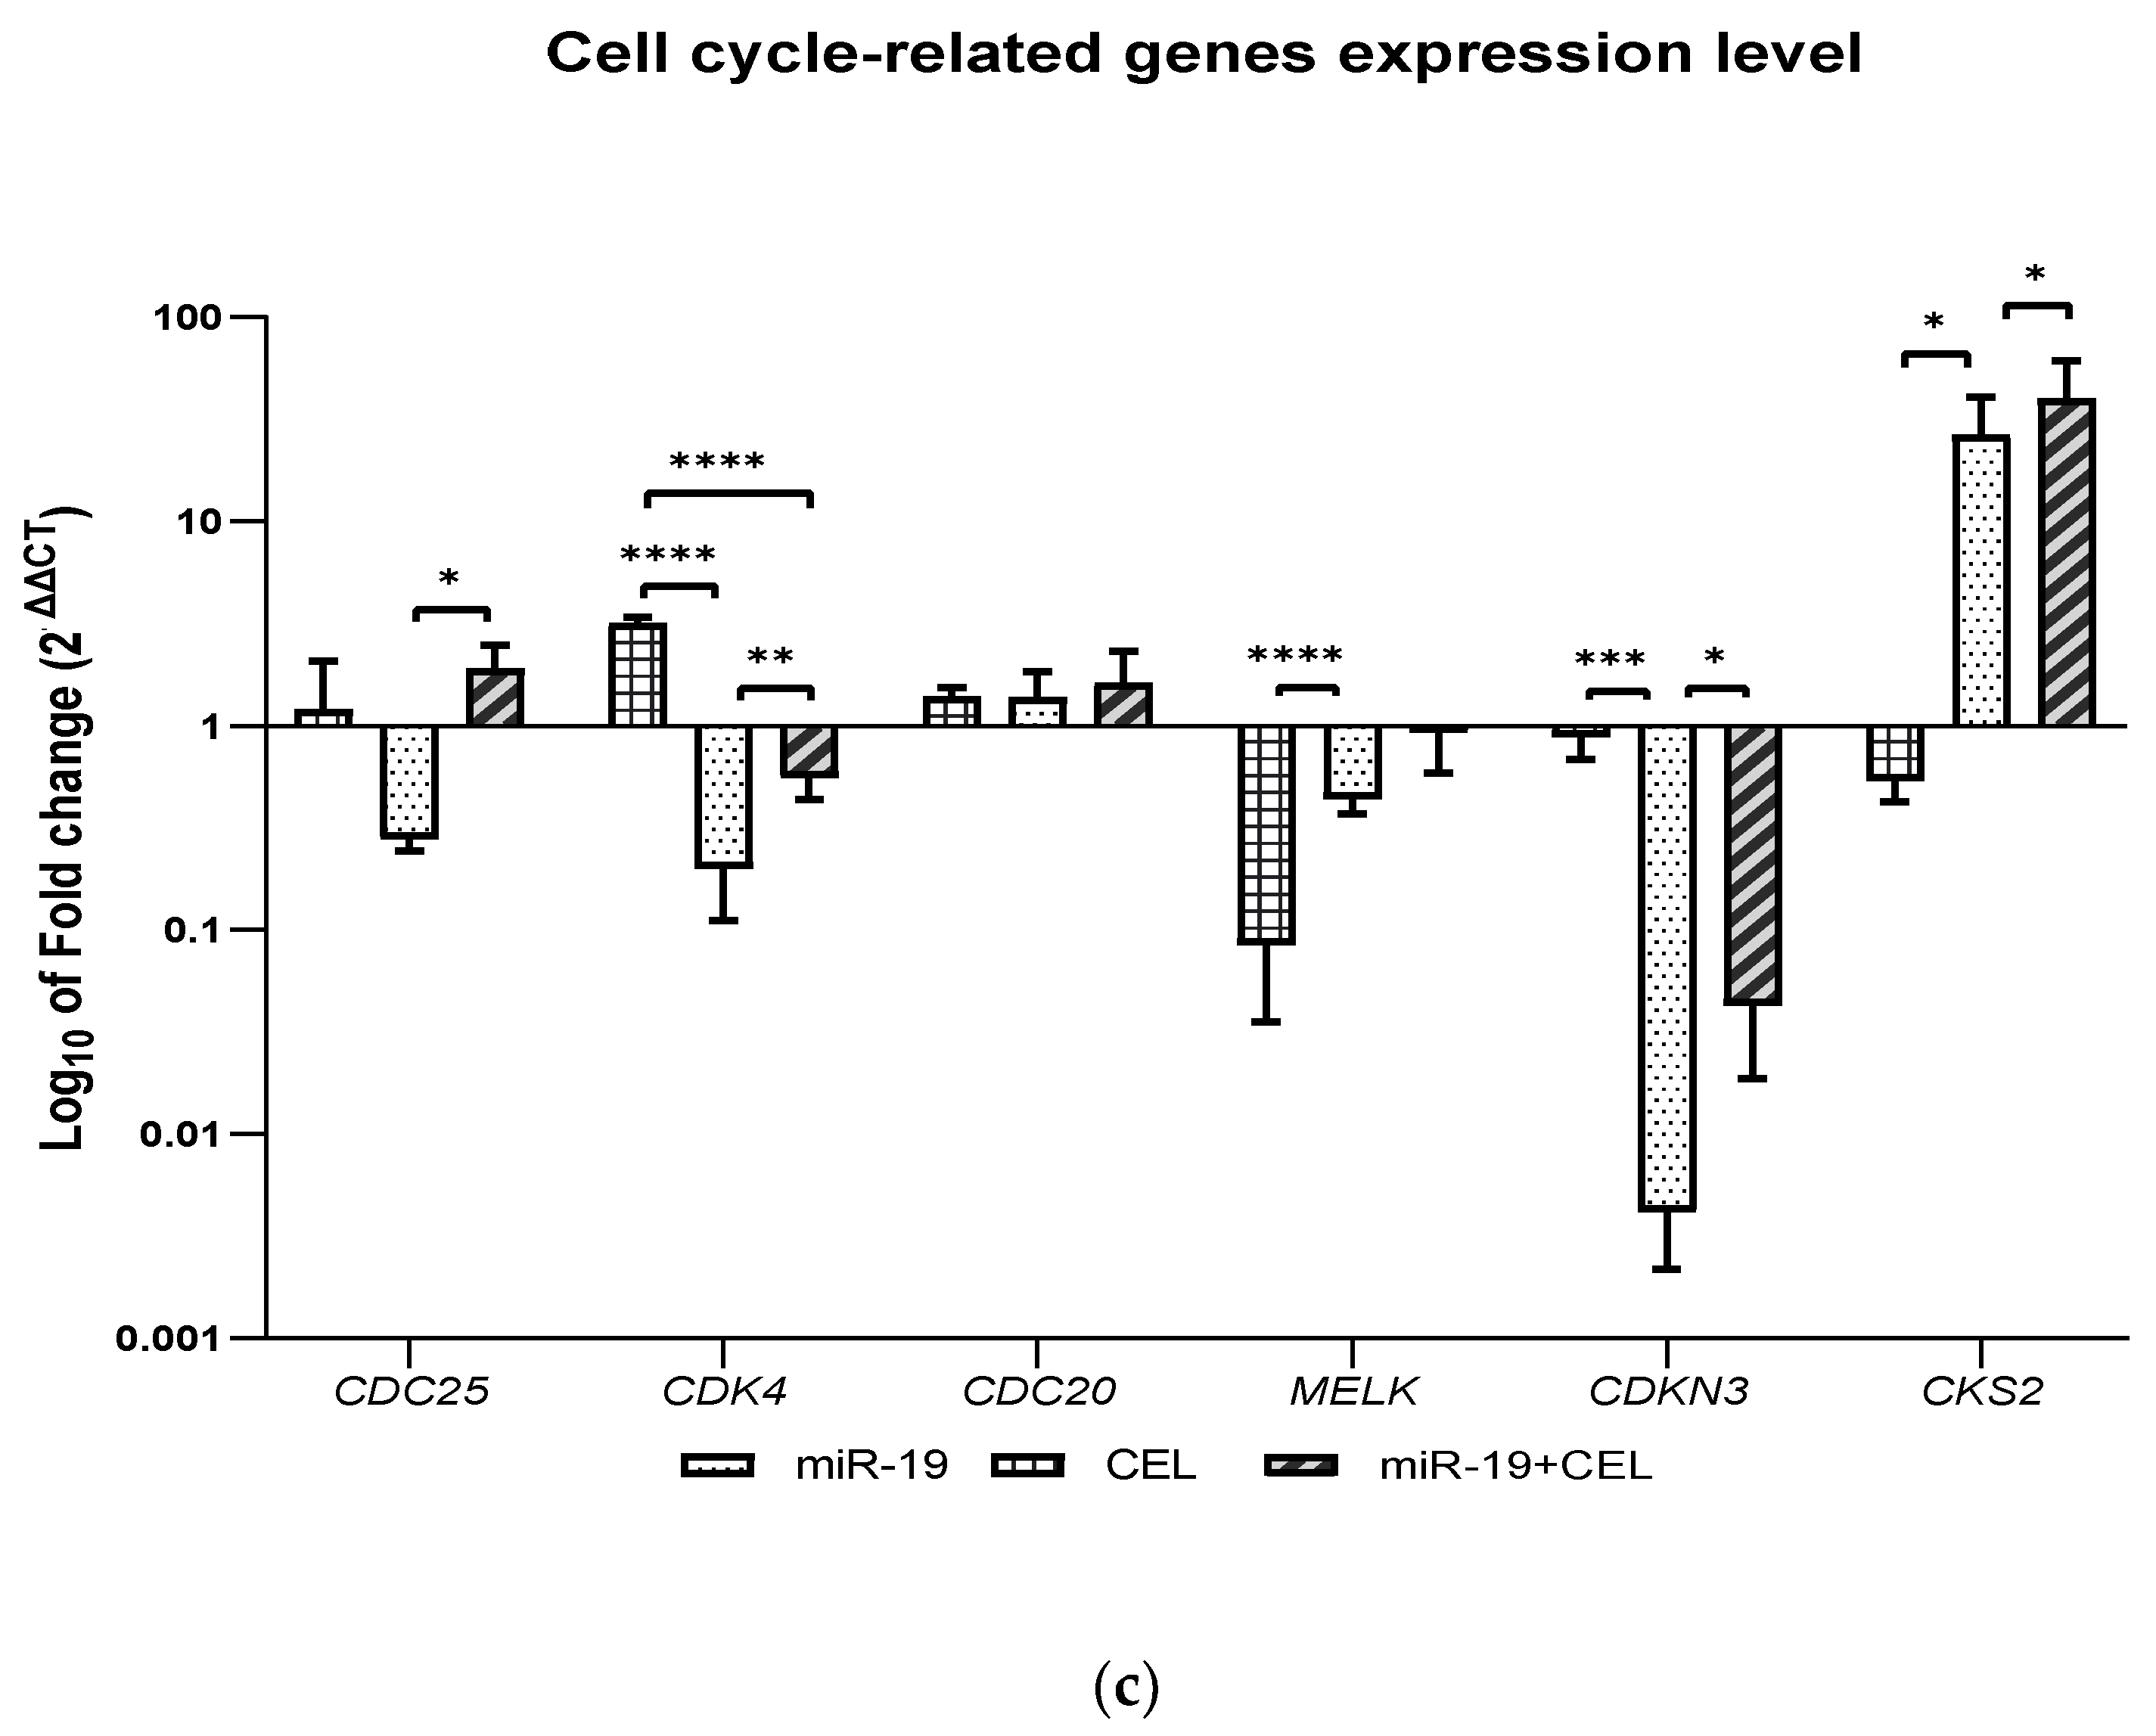
How silencing the miR-9-2, miR-17 and miR-17 genes and the exposure of glioblastoma multiforme cells of the U251MG cell line affect the expression of selected genes (CDC25A, CDK4, CDC20, MELK, CDKN3 and CKS2), that are related to the regulation of the cell cycle was also analyzed. It was shown that miR-17 and miR-19 gene silencing and the combination of miR-9-2, miR-17 and miR-19 gene silencing and exposure to celastrol decreased the expression of the CDC25A and CDK4 genes with the CDC25A expression being most strongly inhibited in the case of the silencing of the miR-9-2 gene and the exposure of tested cells to celastrol, while the silencing of the miR-19 gene and the exposure of glioblastoma multiforme U251MG cells to celastrol was associated with an increase in the CDC25A gene expression. A similar effect was observed with the exposure of the untransfected cells to celastrol.
In turn, silencing the miR-19 gene most strongly decreased the expression of the CDK4 gene. The CDC25 dual phosphatase family has three members: CDC25A, CDC25B and CDC25C. An overexpression of CDC25A has been documented in multiple cancer cell lines and is highly associated with malignancy and poor prognosis in cancer patients. Because CDC25A plays a more extensive role in assisting both the G1/S and G2/M progression by dephosphorylating CDK4 and CDK6, as well as CDK2 and CDK1, inhibition of the CDC25A gene expression may cause the inhibition of the cell transition from the G1 to S phase of the cell cycle (this is possible because it is also known that the overexpression of CDC25A can accelerate the transition of cells from the G1 to S phase by prematurely increasing the activity of CDK2 kinase [29] as well as from the G2 to M phase. The observed relationship between the miR-9, miR-17 and miR-19 gene silencing without and in combination with celastrol exposure and a decrease in the CDC25A expression and cell cycle progression requires more elucidation because that regulation of the CDC25A expression can occur at the transcriptional, translational and post-translational levels and by regulating the catalytic efficiency of CDC25A and the enzyme-substrate interaction. It should also be noted that cytoplasmic CDC25A inhibits the activity of ASK1 and increases the resistance to the apoptosis that is induced by oxidative stress and is required for Myc-dependent apoptosis [30], hence, a decrease in the CDC25A gene expression might increase the sensitivity of cells to the apoptosis that is induced by oxidative stress, but more detailed studies are needed to confirm this hypothesis. Moreover, because of the dual role of CDC25A in the regulation of the apoptosis process that is related to the subcellular distribution (CD25A acts as a suppressor of apoptosis only when it is in the cytoplasm and the accumulation of CDC25A in the nucleus leads to cell apoptosis), it is necessary to conduct detailed studies to explain the effect of a decrease in the CDC25A gene expression for regulating apoptosis. Since CDC25A is involved in several different biological processes, including cell division, cell proliferation, the cellular response to UV, DNA replication, cell transition from G1 phase to S phase, cell cycle regulation and regulating the activity of cyclin-dependent serine-threonine kinases, a decrease in the expression of the gene encoding this cyclin might have a multidirectional effect; therefore, it is impossible to clearly define the effects of this phenomenon.
Knockdown of the miR-17 gene and the combination of silencing the said gene with The knockdown of the miR-17 gene and the combination of the silencing of said gene with the exposure to celastrol decreased the expression of the CDC20 gene, while silencing the miR-9-2 gene and miR-19 genes combined with the exposure of the glioblastoma multiforme cells to celastrol or the action of celastrol alone increased the expression of this gene. The results of studies by Wang et al. (2017) indicate that overexpression of CDC20 is involved in temozolomide-resistant glioma cells with an epithelial-mesenchymal transition [31]. Decreasing the expression of the CDC20 gene in the case of miR-17 gene silencing might, therefore, be associated with increased sensitivity of glioblastoma cells to temozolomide; however, additional studies using other glioblastoma cell lines are necessary to confirm this hypothesis.
A decrease in the MELK gene expression was observed after silencing the miR-9-2 gene and exposing cells to celastrol, as well as after silencing the miR-17 and miR-19 genes and in the case of celastrol alone. Silencing the miR-9-2 gene most strongly decreased the expression of the MELK gene. The Maternal Embryonic Leucine Zipper Kinase (MELK) is overexpressed in multiple cancer types, including melanoma, colorectal cancer and triple-negative breast cancer and is a putative drug target [32,33,34]. A high expression of MELK is associated with a poor patient prognosis. It was found that the knockdown of MELK using RNA interference was associated with blocking cancer cell proliferation and triggering cell cycle arrest or causing a mitotic catastrophe [35]. The knockdown of the miR-9-2, miR-17 or miR-19 gene with or without exposure to celastrol, which is associated with a significant decrease in the expression of the MELK gene may thus result in the inhibition of the proliferation of glioblastoma multiforme cells and the induction of a mitotic catastrophe, which could be confirmed by demonstrating, for example, the presence of characteristic features within the cell nucleus and the presence of abnormal mitotic figures. Additionally, MELK has been implicated in several other cancer-related processes, for example, cancer stem cell maintenance and chemotherapy resistance; hence, the inhibition of the expression of this gene may be associated with increased sensitivity of glioblastoma cells to chemotherapy. However, more research is needed to confirm this hypothesis. We assume that additional studies will be conducted to confirm that the inhibition of the MELK gene expression could increase the sensitivity of glioblastoma cells to temozlolomide.
The knockdown of the miR-9-2, miR-17 and miR-19 genes and the combination of miR-19 gene silencing with exposure to celastrol and the action of celastrol alone decreased the expression of the CDKN3 gene. Silencing the miR-17 gene most strongly decreased the expression of this gene. Cyclin-dependent kinase inhibitor 3 (CDKN3) encodes a protein from the family of protein phosphatases that has a dual specificity. CDKN3 kinase dephosphorylates CDK2 at the Thr160 position and thus prevents its activation [36]. A CDKN3 overexpression causes the inhibition of the cell transition from the G1 to S phase [37]. A CDKN3 overexpression is found in many human tumor tissues and tumor cell lines (hepatocellular carcinoma, lung adenocarcinoma, breast cancer, cervical cancer, ovarian cancer, gastric cancer and kidney cancer) [38,39,40,41,42,43]. In most cases, CDKN3 acts as an oncogene. It has been shown that, in glioblastoma cells, CDKN3 can inhibit cell proliferation and migration via a phosphatase-dependent inhibition of CDC2. Because CDKN3 can perform different biological functions in different types of cancer cells, the relationship between the silencing of the miR-9-2, miR-17 and miR-19 genes and exposure to celastrol and the decrease in the CDKN3 gene expression that was observed in this study requires a more detailed analysis to determine its importance for the survival and proliferation activity of glioblastoma cells.
We also revealed that the knockdown of the miR-17 and miR-19 genes and the combination of the silencing of the above-mentioned genes and the silencing of the miR-9-2 gene combined with the exposure of glioblastoma multiforme cells to celastrol increased the expression of the CKS2 gene, while the action of celastrol alone or the silencing of the miR-9-2 gene decreased the expression of this gene. The CKS2 gene expression was most strongly increased after the miR-17 gene silencing and cell exposure to celastrol. CKS2 (CDC28 protein kinase regulatory subunit 2) belongs to the CKS family and plays an important role in early embryonic development, somatic cell division and meiosis. CKS2 has been shown to play an important role in regulating the cell cycle. It has been shown that the knockdown of the CKS2 gene causes a decrease in the expression of cyclin A and cyclin B1 [44]. A growing body of evidence also indicates that CKS2 drives the incidence and growth of cancer and is responsible for metastasis among many human malignancies. Some research results have indicated that CKS2 mRNA is overexpressed in low-grade glioma and may be involved in the pathogenesis of gliomas [45,46]. Currently, CKS2 is considered to be a prognostic biomarker in low-grade glioma. However, the CKS2 expression is differentiated in low-grade glioma and non-neoplastic tissues. Some authors have pointed to the correlation between the CKS2 expression and the IDH1 mutation status. CKS2 was shown to be upregulated in the IDH1-wildtype, while the genetic test results revealed a recurrent mutation in the isocitrate dehydrogenase (IDH1) gene in most GBM cells. Therefore, additional research is needed to understand the importance of increasing or decreasing the expression of the CKS2 gene in GBM cells.
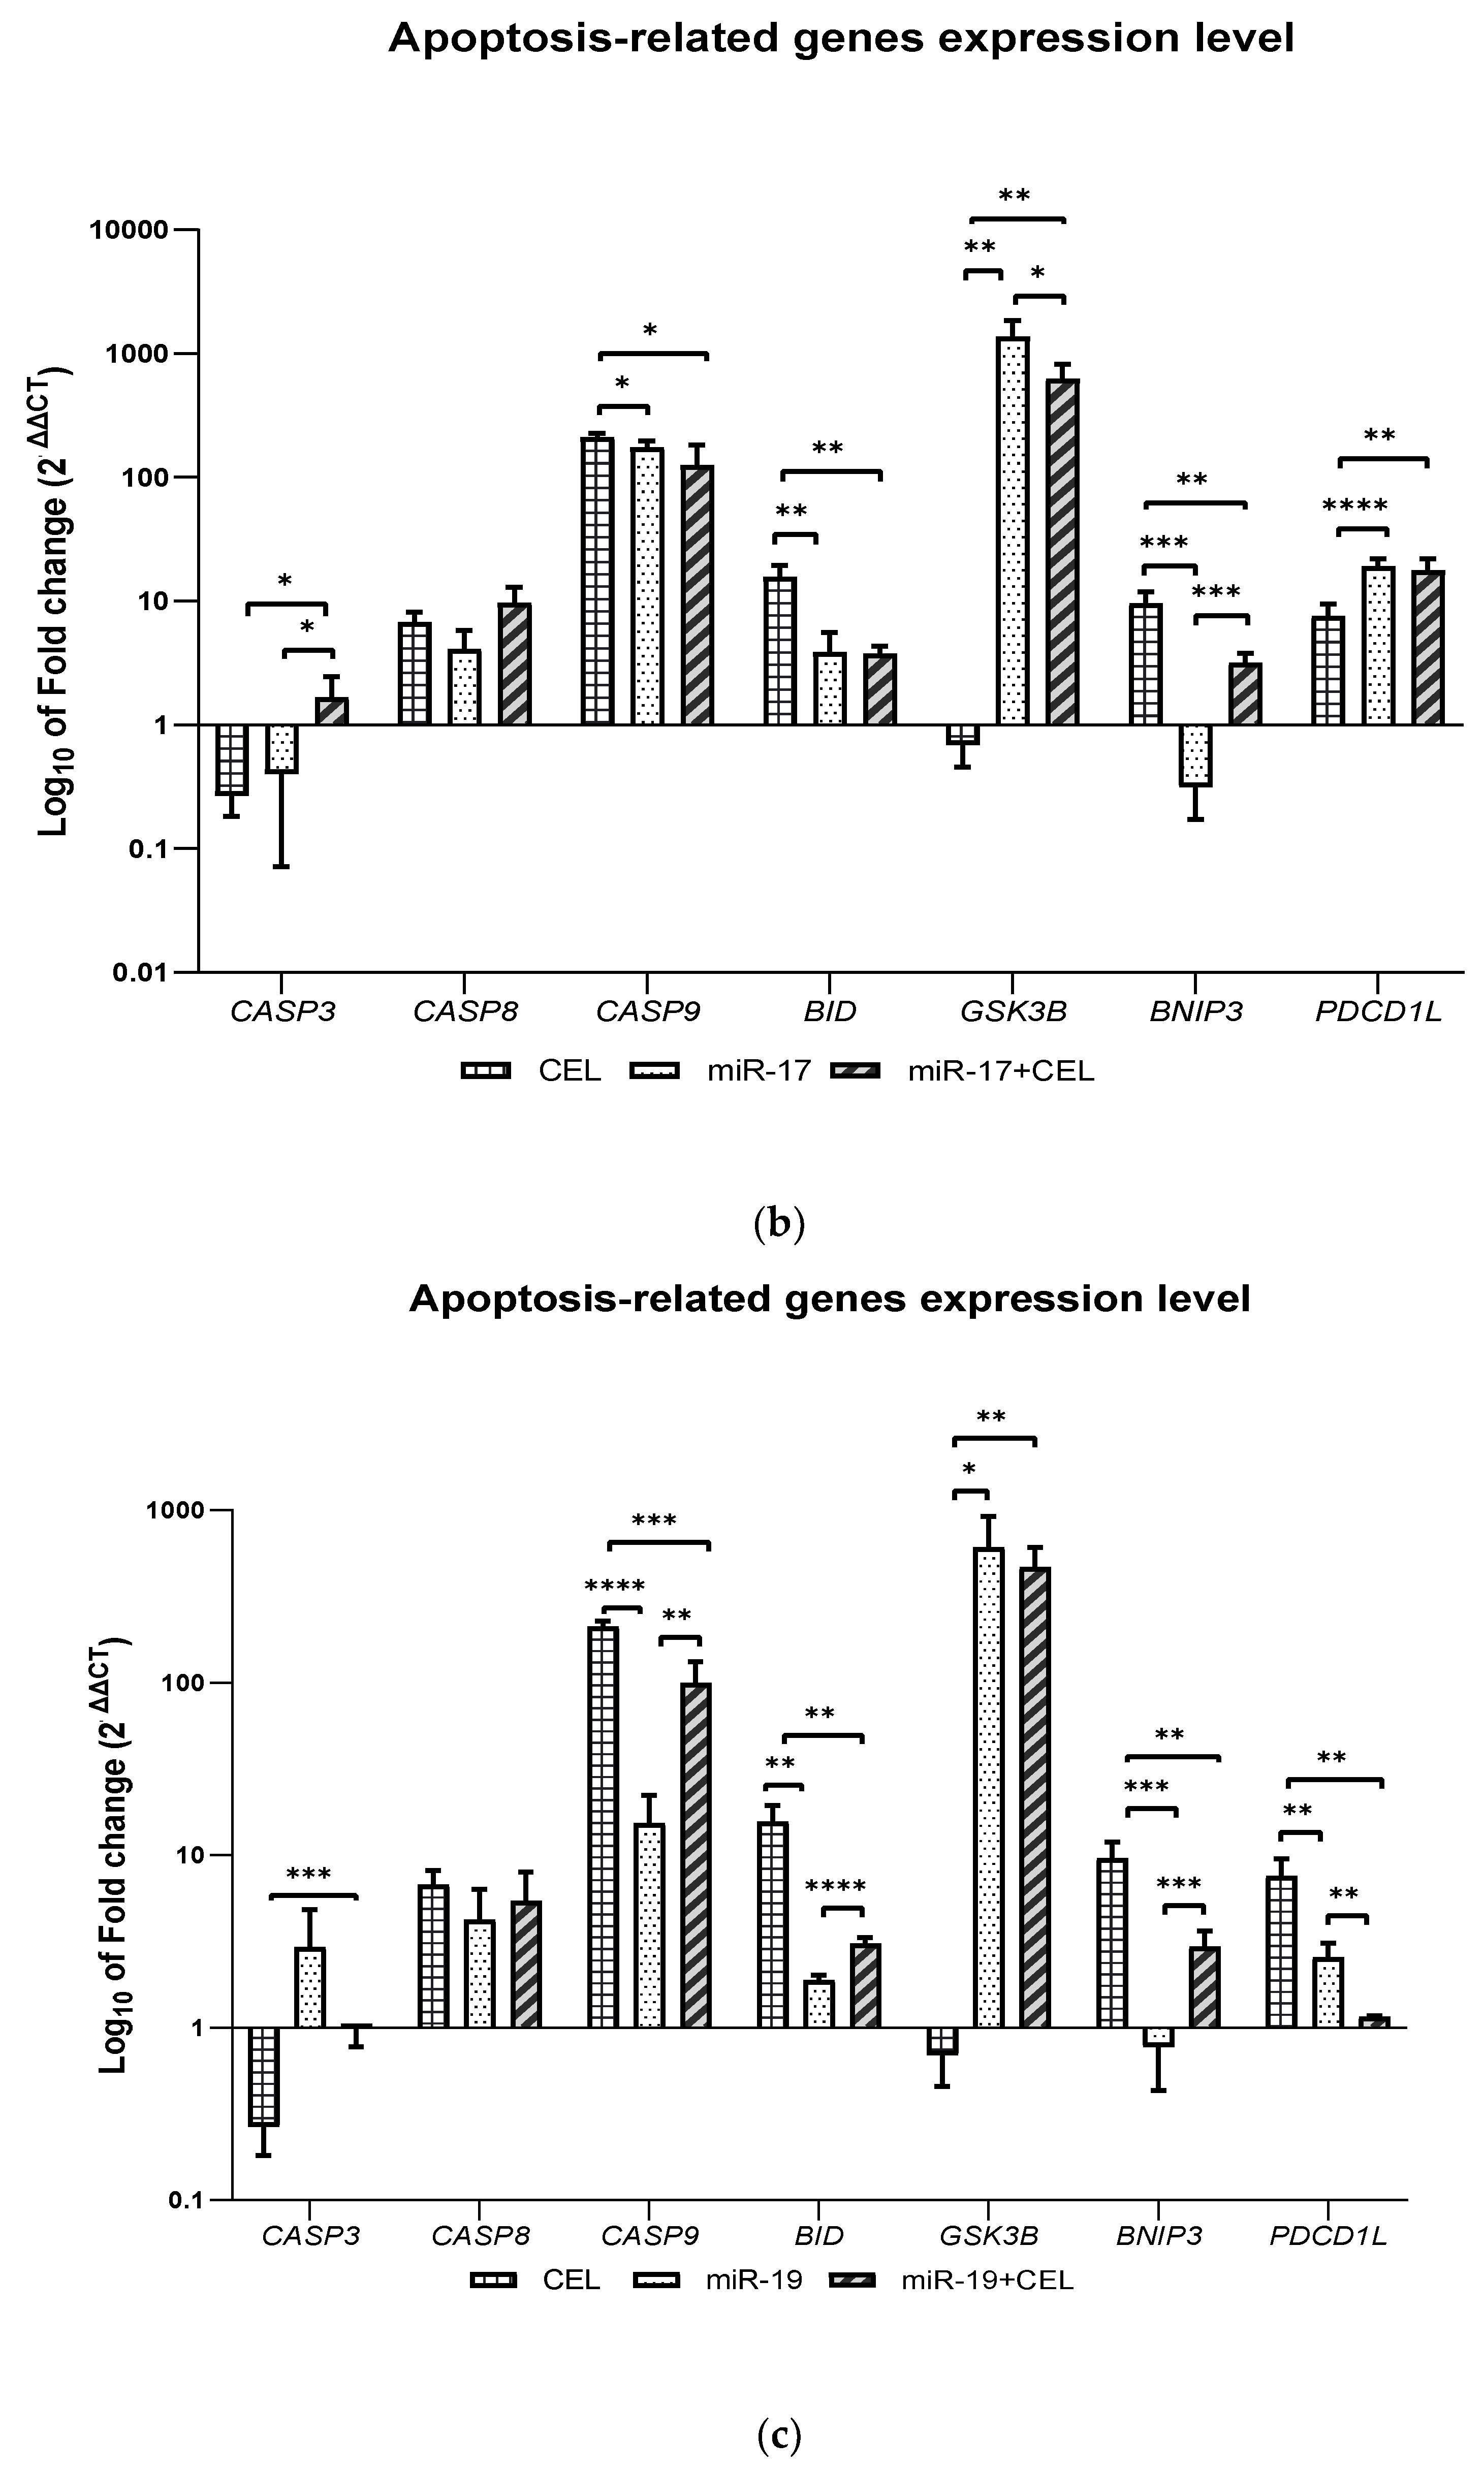
It was shown that the knockdown of the miR-9-2, miR-17 and miR-19 genes and the combination of miR-17 and miR-19 gene silencing with the exposure of glioblastoma multiforme cells to celastrol and the action of celastrol alone significantly increased the expression of the CASP8, CASP9 and BID genes, which may indicate the activation of the extrinsic and intrinsic pathways of apoptosis induction. Only in the case of the silencing of the miR-17 gene in combination with the exposure of cells to celastrol was an increase in the expression of the CASP3 gene observed. In turn, the effect of celastrol was associated with the greatest increase in the BID expression and silencing of the miR-17 gene in combination with celastrol exposure was associated with the greatest increase in the CASP8 expression, which in these cases may indicate the induction of the apoptosis of glioblastoma multiforme cells mainly via an extrinsic pathway but further studies are required to confirm this hypothesis.
However, the available data might support this hypothesis. Celastrol belongs to the group of so-called proteasome inhibitors. It is known to inhibit the CT-L activity of the 20S proteasome with an IC50 = 2.5 µM. It was shown that in the prostate cancer cells of the PC-3 and LNCaP lines, celastrol caused an increase in the level of the ubiquitinated proteins, IκBα, Bax and P27, which resulted in the induction of apoptosis. Celastrol enhances TNF- and chemotherapeutic-induced apoptosis and inhibits the proliferation and invasiveness of cancer cells by inhibiting both the inducible and constitutive activation of NF-kB [47,48]. One of the main goals in cancer therapy is to completely reduce the tumor cell mass, e.g., via the induction of apoptosis (type I programmed cell death). Since glioblastomas are resistant to therapies that induce apoptosis [49], the observed phenomenon is highly desirable.
It was also observed that the GSK3B gene expression was decreased only when miR-9-2 gene silencing was combined with the exposure of glioblastoma cells to celastrol. In the remaining cases, an increase in the expression of this gene was observed and the observed effect was the strongest after silencing the miR-17 gene, which was also associated with the lowest expression of the BNIP3 gene. In turn, the action of celastrol was associated with the greatest increase in the expression of this gene. GSK3B kinase (glycogen synthase kinase-3 beta) is involved in cellular metabolism, neuronal cell development and body pattern formation by triggering the degradation of the signaling or functional proteins. GSK3B is involved in regulating both apoptosis and autophagy. The role of GSK3B in the regulation of apoptosis is ambiguous; namely, GSK3B can act as both a pro-apoptotic and anti-apoptotic factor depending on the type of cell and the surrounding environment. GSK3β is able to promote apoptosis and DNA damage under hypoxic conditions by inhibiting the cell “survival” signals such as the cAMP response element-binding protein (CREB), heat shock protein 1 and by activating the pro-apoptotic transcription factors such as P53. However, inhibiting GSK3β synthesis could lead to the hypophosphorylation of the MDM2 protein, which in turn suggests an anti-apoptotic effect of GSK3β [50]. The activation of PI3KCA that was observed in the case of glioblastoma multiforme induced the phosphorylation of GSK3B at Ser9 and attenuated the interaction of GSK3B with Bcl-2, which prevented the phosphorylation of Bcl-2 at Ser70 and was connected with the ubiquitin-mediated degradation of Bcl-2. In turn, the increased expression of Bcl-2 interferes with the activation of BECN1 and attenuates autophagy in cancer cells [51]. Several studies have indicated that GBM cells seem to be less resistant to therapies that induce cell death that has the features of autophagy (type II programmed cell death) [52]. Our previous research results also showed that the siRNAs that are specific for the AKT3 and PI3KCA genes decreased the BNIP3 mRNA expression [53]. Although BNIP3 (Bcl-2/adenovirus E1B 19 kDa interacting protein 3) is a member of the pro-cell death Bcl-2 family, its proapoptotic activity is questionable. BNIP3 is known to induce autophagy and plays a key role in As2O3-induced autophagic cell death in malignant glioma cells [54]. BNIP3 is nuclear and is localized in most GBMs and does not cause cell death. It has been shown that BNIP3 binds to the promoter of the AIF gene, inhibits its expression and inhibits temozolomide-induced apoptosis (TMZ) in glioblastoma cells [55]. Because there was a reduced copy number of BNIP3 mRNA in the transfected GBM cells, transfected cells may therefore be associated with the induction of apoptosis. The serine-threonine kinase ULK1, which is encoded by the gene of the same name, is a key initiator of autophagy.
It has been shown that silencing the miR-9-2 gene and the combination of the knockdown of this gene with exposure to celastrol increases the expression of the BECN1 and ULK1 genes. Moreover, it was found that silencing the miR-17 and miR-19 genes in cells that had either been exposed or not exposed to celastrol not only increased the expression of the BECN1 and ULK1 genes, but also that of the MAPLC3IIA gene.
The obtained results may therefore indicate the induction of autophagy. We observed the induction of autophagy and apoptosis after the knockdown of the miR-9-2, miR-17 and miR-19 genes and the combination of the silencing of these genes with the exposure to celastrol, which is consistent with the available results of other studies confirming the possibility of the simultaneous activation of these processes. However, our results are difficult to interpret unequivocally because of the dual role of autophagy—either promoting or inhibiting cancer [56]. Autophagy can both stimulate and prevent cancer depending on the cell type and the cellular context [57]. Additionally, the results of some studies suggest that inhibiting autophagy at different time stages may produce different results [58,59]. Thus, more research is needed to elucidate the exact mechanism of autophagy and the induction apoptosis in GBM cells after the knockdown of miR-9-2, miR-17 and miR-19 and whether the induction of autophagy is a positive phenomenon in increasing the sensitivity of GBM cells to the chemotherapeutic agents—temozolomide and carmustine.
The significance of the presented research results is cognitive. Preliminary analysis of the effect of silencing selected genes encoding miRNAs overexpressed in glioblastoma (miR-9-2, miR-17 and miR-19) and exposure of GBM cells to celastrol was to characterize the type of changes occurring in the expression of selected genes related to the regulation of cellular processes important for the proliferation and progression of this tumor. Demonstrating the relationship between the silencing of miR-9-2, miR-17 and miR-19 and changes in the expression of these genes is the basis for determining the mechanism by which such a change occurs and what its consequences will be. The results obtained by us should make it possible to determine the validity of silencing the genes encoding the indicated miRs in combination with celastrol in the experimental therapy of glioblastoma. Evidence of the effectiveness of regulation of the expression of selected miRNA-coding genes in glioblastoma multiforme cell cultures may be the basis for confirming the obtained effects in vivo on the basis of examining the increase in tumor mass and monitoring the survival time of animals with cancerous tumors. This precedes possible clinical trials. The results of this study could therefore form the basis for the development of new and more perfect methods for therapy of glioblastoma multiforme.

5. Conclusions

Silencing the miR-9-2, miR-17 and miR-19 genes and the combination of silencing these genes with the exposure to celastrol caused changes in the cell cycle in the U251MG glioblastoma cells, but the observed changes were not identical, which indicates a different mechanism of the effects of the studied miRNAs and celastrol in glioblastoma multiforme cells. Because some of the changes that occur in the cell cycle are similar regardless of which of the studied genes encoding miR-9-2, miR-17 and miR-19 is silenced, a detailed interpretation of the obtained results requires additional studies. Nevertheless, the obtained results indicate the multidirectional effects of silencing the genes encoding miR-9-2, miR-17 and miR-19 and the combination of silencing these genes with the exposure to celastrol, which suggests that the studied strategy of silencing the miR that are overexpressed in GBM could be important in developing more effective treatments for glioblastoma.

Author Contributions

Conceptualization, M.P.-S.; methodology, M.P.-S. and E.L.; software, M.P.-S.; Acquisition of data, M.P.-S. and E.L.; Formal analysis and interpretation of data, M.P.-S. and E.L.; Investigation, M.P.-S., E.L., P.B. and A.Z.; Software, M.P.-S., J.A.K. and P.B.; Data Curation, M.P.-S.; Resources, M.P.-S., E.L., R.S.-R.; Orginal draft preparation, M.P.-S. and E.L.; Statistical analysis, M.P.-S., P.B. and J.A.K.; Technical or material support, M.K., R.S.-R. and P.B.; Visualization, M.P.-S., P.B.; Supervision, J.A.K. All authors have read and agreed to the published version of the manuscript.

Funding

This research was funded by the Medical University of Silesia, grant number KNW-1-088/N/8/O.

Institutional Review Board Statement

Not applicable.

Informed Consent Statement

Not applicable.

Data Availability Statement

The data that support the findings of this study are available from the corresponding author upon reasonable request.

Acknowledgments

This work was supported by a grant from the Medical University of Silesia (KNW-1-088/N/8/O). The University had no further role in the study design, in the collection, analysis or interpretation of the data, in the writing of the report or in the decision to submit the paper for publication.

Conflicts of Interest

The authors declare no conflict of interest. The funders had no role in the design of the study, in the collection, analyses, or interpretation of data; in the writing of the manuscript or in the decision to publish the results.

References

  1. Trejo-Solís, C.; Serrano-Garcian, N.; Escamilla-Ramírez, Á.; Castillo-Rodríguez, R.A.; Jimenez-Farfan, D.; Palencia, G.; Calvillo, M.; Alvarez-Lemus, M.A.; Flores-Nájeram, A.; Cruz-Salgado, A.; et al. Autophagic and Apoptotic Pathways as Targets for Chemotherapy in Glioblastoma. Int. J. Mol. Sci. 2018, 19, 3773. [Google Scholar] [CrossRef] [PubMed] [Green Version]
  2. Silantyev, A.S.; Falzone, L.; Libra, M.; Gurina, O.I.; Kardashova, K.S.; Nikolouzakis, T.K.; Nosyrev, A.E.; Sutton, C.W.; Mitsias, P.D.; Tsatsakis, A. Current and Future Trends on Diagnosis and Prognosis of Glioblastoma. From Molecular Biology to Proteomics. Cells 2019, 8, 863. [Google Scholar] [CrossRef] [PubMed] [Green Version]
  3. Bailly, C.; Vidal, A.; Bonnemaire, C.; Kraeber-Bodéré, F.; Chérel, M.; Pallardy, A.; Rousseau, C.; Garcion, E.; Lacoeuille, F.; Hindré, F.; et al. Potential for Nuclear Medicine Therapy for Glioblastoma Treatment. Front. Pharmacol. 2019, 10, 772. [Google Scholar] [CrossRef] [PubMed]
  4. Ghosh, D.; Nandi, S.; Bhattacharjee, S. Combination therapy to checkmate Glioblastoma: Clinical challenges and advances. Clin. Transl. Med. 2018, 7, 33. [Google Scholar] [CrossRef] [Green Version]
  5. Kirstein, A.; Schmid, T.E.; Combs, S.E. The Role of miRNA for the Treatment of MGMT Unmethylated Glioblastoma Multiforme. Cancers 2020, 12, 1099. [Google Scholar] [CrossRef]
  6. Shi, J.; Li, J.; Xu, Z.; Chen, L.; Luo, R.; Zhang, C.; Gao, F.; Zhang, J.; Fu, C. Celastrol: A Review of Useful Strategies Overcoming its Limitation in Anticancer Application. Front. Pharmacol. 2020, 18, 1726. [Google Scholar] [CrossRef]
  7. Cascão, R.; Fonseca, J.E.; Moita, L.F. Celastrol: A Spectrum of Treatment Opportunities in Chronic Diseases. Front. Med. 2017, 4, 69. [Google Scholar] [CrossRef] [Green Version]
  8. Boridy, S.; Le, P.U.; Petrecca, K.; Maysinger, D. Celastrol targets proteostasis and acts synergistically with a heat-shock protein 90 inhibitor to kill human glioblastoma cells. Cell Death Dis. 2014, 5, e1216. [Google Scholar] [CrossRef]
  9. Zhang, K.; Fu, G.; Pan, G.; Li, C.; Shen, L.; Hu, R.; Zhu, S.; Chen, Y.; Cui, H. Demethylzeylasteral inhibits glioma growth by regulating the miR-30e-5p/MYBL2 axis. Cell Death Dis. 2018, 9, 1035. [Google Scholar] [CrossRef] [Green Version]
  10. Ben-Hamo, R.; Zilberberg, A.; Cohen, H.; Efroni, S. hsa-miR-9 controls the mobility behavior of glioblastoma cells via regulation of MAPK14 signaling elements. Oncotarget 2016, 7, 23170–23181. [Google Scholar] [CrossRef] [Green Version]
  11. Shea, A.; Harish, V.; Afzal, Z.; Chijioke, J.; Kedir, H.; Dusmatova, S.; Roy, A.; Ramalinga, M.; Harris, B.; Blancato, J.; et al. MicroRNAs in glioblastoma multiforme pathogenesis and therapeutics. Cancer Med. 2016, 5, 1917–1946. [Google Scholar] [CrossRef] [PubMed]
  12. Katakowski, M.; Charteris, N.; Chopp, M.; Khain, E. Density-Dependent Regulation of Glioma Cell Proliferation and Invasion Mediated by miR-9. Cancer Microenviron. 2016, 9, 149–159. [Google Scholar] [CrossRef] [PubMed] [Green Version]
  13. Chen, X.; Yang, F.; Zhang, T.; Wang, W.; Xi, W.; Li, Y.; Zhang, D.; Huo, Y.; Zhang, J.; Yang, A.; et al. MiR-9 promotes tumorigenesis and angiogenesis and is activated by MYC and OCT4 in human glioma. J. Exp. Clin. Cancer Res. 2019, 38, 99. [Google Scholar] [CrossRef] [PubMed] [Green Version]
  14. Comincini, S.; Allavena, G.; Palumbo, S.; Morini, M.; Durando, F.; Angeletti, F.; Pirtoli, L.; Miracco, C. microRNA-17 regulates the expression of ATG7 and modulates the autophagy process, improving the sensitivity to temozolomide and low-dose ionizing radiation treatments in human glioblastoma cells. Cancer Biol. Ther. 2013, 14, 574–586. [Google Scholar] [CrossRef] [PubMed]
  15. Wang, W.; Zhang, A.; Hao, Y.; Wang, G.; Jia, Z. The emerging role of miR-19 in glioma. J. Cell. Mol. Med. 2018, 22, 4611–4616. [Google Scholar] [CrossRef]
  16. Lee, K.-H.; Chen, C.-L.; Lee, Y.-C.; Kao, T.-J.; Chen, K.-Y.; Fang, C.-Y.; Chang, W.-C.; Chiang, Y.-H.; Huang, C.-C. Znf179 induces differentiation and growth arrest of human primary glioblastoma multiforme in a p53-dependent cell cycle pathway. Sci. Rep. 2017, 7, 4787. [Google Scholar] [CrossRef] [Green Version]
  17. Touat, M.; Idbaih, A.; Sanson, M.; Ligon, K.L. Glioblastoma targeted therapy: Updated approaches from recent biological insights. Ann. Oncol. 2017, 28, 1457–1472. [Google Scholar] [CrossRef]
  18. Louis, D.N.; Ohgaki, H.; Wiestler, O.D.; Cavenee, W.K.; Burger, P.C.; Jouvet, A.; Scheithauer, B.W.; Kleihues, P. The 2007 WHO classification of tumours of the central nervous system. Acta Neuropathol. 2007, 114, 97–109. [Google Scholar] [CrossRef] [Green Version]
  19. Stupp, R.; Hegi, M.E.; Mason, W.P.; van den Bent, M.J.; Taphoorn, M.J.; Janzer, R.C.; Ludwin, S.K.; Allgeier, A.; Fisher, B.; Belanger, K.; et al. Effects of radiotherapy with concomitant and adjuvant temozolomide versus radiotherapy alone on survival in glioblastoma in a randomised phase III study: 5-year analysis of the EORTC-NCIC trial. Lancet Oncol. 2009, 10, 459–466. [Google Scholar] [CrossRef]
  20. Li, X.; Jin, P. Roles of small regulatory RNAs in determining neuronal identity. Nat. Rev. Neurosci. 2010, 11, 329–338. [Google Scholar] [CrossRef]
  21. Moller, H.G.; Rasmussen, A.P.; Andersen, H.H.; Johnsen, K.B.; Henriksen, M.; Duroux, M. A systematic review of microRNA in glioblastoma multiforme: Micro-modulators in the mesenchymal mode of migration and invasion. Mol. Neurobiol. 2013, 47, 131–144. [Google Scholar] [CrossRef] [PubMed] [Green Version]
  22. Visani, M.; de Biase, D.; Marucci, G.; Cerasoli, S.; Nigrisoli, E.; Bacchi Reggiani, M.L.; Albani, F.; Baruzzi, A.; Pession, A. PERNO study group. Expression of 19 microRNAs in glioblastoma and comparison with other brain neoplasia of grades I-III. Mol. Oncol. 2014, 8, 417–430. [Google Scholar] [CrossRef] [PubMed]
  23. Malzkorn, B.; Wolter, M.; Liesenberg, F.; Grzendowski, M.; Stühler, K.; Meyer, H.E.; Reifenberger, G. Identification and functional characterization of microRNAs involved in the malignant progression of gliomas. Brain Pathol. 2010, 20, 539–550. [Google Scholar] [CrossRef]
  24. Floyd, D.; Purow, B. Micro-masters of glioblastoma biology and therapy: Increasingly recognized roles for microRNAs. Neuro Oncol. 2014, 16, 622–627. [Google Scholar] [CrossRef] [Green Version]
  25. Huang, Q.; Shen, Y.J.; Hsueh, C.Y.; Guo, Y.; Zhang, Y.F.; Li, J.Y.; Zhou, L. miR-17-5p drives G2/M-phase accumulation by directly targeting CCNG2 and is related to recurrence of head and neck squamous cell carcinoma. BMC Cancer 2021, 21, 1074. [Google Scholar] [CrossRef] [PubMed]
  26. Cloonan, N.; Brown, M.K.; Steptoe, A.L.; Wani, S.; Chan, W.; Forres, A.R.R.; Kolle, G.; Gabrielli, B.; Grimmond, S.M. The miR-17-5p microRNA is a key regulator of the G1/S phase cell cycle transition. Genome Biol. 2008, 9, R127. [Google Scholar] [CrossRef] [PubMed] [Green Version]
  27. Li, L.; He, L.; Zhao, J.-L.; Xiao, J.; Liu, M.; Li, X.; Tang, H. MiR-17-5p up-regulates YES1 to modulate the cell cycle progression and apoptosis in ovarian Cancer cell lines. J. Cell Biochem. 2015, 116, 1050–1059. [Google Scholar] [CrossRef]
  28. Zhu, Y.; Gu, J.; Li, Y.; Peng, C.; Shi, M.; Wang, X.; Wei, G.; Ge, O.; Wang, D.; Zhang, B.; et al. MiR-17-5p enhances pancreatic cancer proliferation by altering cell cycle profiles via disruption of RBL2/E2F4-repressing complexes. Cancer Lett. 2018, 412, 59–68. [Google Scholar] [CrossRef]
  29. De Bacco, F.; Luraghi, P.; Medico, E.; Reato, G.; Girolami, F.; Perera, T.; Gabriele, P.; Comoglio, P.M.; Boccaccio, C. Induction of MET by ionizing radiation and its role in radioresistance and invasive growth of cancer. J. Natl. Cancer Inst. 2011, 103, 645–661. [Google Scholar] [CrossRef] [Green Version]
  30. Zhang, H.; Hua, Y.; Jiang, Z.; Yue, J.; Shi, M.; Zhen, X.; Zhang, X.; Yang, L.; Zhou, R.; Wu, S. Cancer-associated fibroblast-promoted LncRNA DNM3OS confers radioresistance by regulating DNA damage response in esophageal squamous cell carcinoma. Clin. Cancer Res. 2019, 25, 1989–2000. [Google Scholar] [CrossRef] [Green Version]
  31. Tang, Q.; Hann, S.S. HOTAIR: An oncogenic long non-coding RNA in human cancer. Cell Physiol. Biochem. 2018, 47, 893–913. [Google Scholar] [CrossRef] [PubMed]
  32. Shen, T.; Huang, S. The role of Cdc25A in the regulation of cell proliferation and Apoptosis. Anti Cancer Agents Med. Chem. 2012, 12, 631–639. [Google Scholar] [CrossRef] [PubMed]
  33. Zou, X.; Tsutsui, T.; Ray, D.; Blomquist, J.F.; Ichijo, H.; Ucker, D.S.; Kiyokawa, H. The cell cycleregulatory Cdc25A phosphatase inhibits apoptosis signal-regulating kinase 1. Mol. Cell Biol. 2001, 21, 4818–4828. [Google Scholar] [CrossRef] [PubMed] [Green Version]
  34. Wang, J.; Zhou, F.; Li, Y.; Li, Q.; Wu, Z.; Yu, L.; Yuan, F.; Liu, J.; Tian, Y.; Cao, Y.; et al. Cdc20 overexpression is involved in temozolomide-resistant glioma cells with epithelial-mesenchymal transition. Cell Cycle 2017, 16, 24–2355. [Google Scholar] [CrossRef] [Green Version]
  35. Speers, C.; Zhao, S.G.; Kothari, V.; Santola, A.; Liu, M.; Wilder-Romans, K.; Evans, J.; Batra, N.; Bartelink, H.; Hayes, D.F.; et al. Maternal embryonic leucine zipper kinase (MELK) as a novel mediator and biomarker of radioresistance in human breast cancer. Clin. Cancer Res. 2016, 22, 5864–5875. [Google Scholar] [CrossRef] [Green Version]
  36. Wang, Y.; Lee, Y.M.; Baitsch, L.; Huang, A.; Xiang, Y.; Tong, H.; Lako, A.; Von, T.; Choi, C.; Lim, E.; et al. MELK is an oncogenic kinase essential for mitotic progression in basal-like breast cancer cells. eLife 2014, 3, e01763. [Google Scholar] [CrossRef]
  37. Janostiak, R.; Rauniyar, N.; Lam, T.T.; Ou, J.; Zhu, L.J.; Green, M.R.; Wajapeyee, N. MELK promotes melanoma growth by stimulating the NF-kB pathway. Cell Rep. 2017, 21, 2829–2841. [Google Scholar] [CrossRef]
  38. Liu, J.; Min, L.; Zhu, S.; Guo, Q.; Li, H.; Zhang, Z.; Zhao, Y.; Xu, C.; Zhang, S. Cyclin-Dependent Kinase Inhibitor 3 Promoted Cell Proliferation by Driving Cell Cycle from G1 to S Phase in Esophageal Squamous Cell Carcinoma. J. Cancer 2019, 10, 1915–1922. [Google Scholar] [CrossRef]
  39. Gyuris, J.; Golemis, E.; Chertkov, H.; Brent, R. Cdi1, a human G1 and S phase protein phosphatase that associates with Cdk2. Cell 1993, 75, 791–803. [Google Scholar] [CrossRef]
  40. Poon, R.Y.; Hunter, T. Dephosphorylation of Cdk2 Thr160 by the cyclin-dependent kinase-interacting phosphatase KAP in the absence of cyclin. Science 1995, 270, 90–93. [Google Scholar] [CrossRef]
  41. Deng, M.; Wang, J.; Chen, Y.; Zhang, L.; Xie, G.; Liu, Q.; Zhang, T.; Yuan, P.; Liu, D. Silencing cyclin-dependent kinase inhibitor 3 inhibits the migration of breast cancer cell lines. Mol. Med. Rep. 2016, 14, 1523–1530. [Google Scholar] [CrossRef] [PubMed] [Green Version]
  42. Fan, C.; Chen, L.; Huang, Q.; Shen, T.; Welsh, E.A.; Teer, J.K.; Cai, J.; Cress, W.D.; Wu, J. Overexpression of major CDKN3 transcripts is associated with poor survival in lung adenocarcinoma. Br. J. Cancer 2015, 113, 1735–1743. [Google Scholar] [CrossRef] [PubMed] [Green Version]
  43. Lai, M.W.; Chen, T.C.; Pang, S.T.; Yeh, C.T. Overexpression of cyclin-dependent kinase-associated protein phosphatase enhances cell proliferation in renal cancer cells. Urol. Oncol. 2012, 30, 871–878. [Google Scholar] [CrossRef]
  44. Li, T.; Xue, H.; Guo, Y.; Guo, K. CDKN3 is an independent prognostic factor and promotes ovarian carcinoma cell proliferation in ovarian cancer. Oncol. Rep. 2014, 31, 1825–1831. [Google Scholar] [CrossRef] [PubMed]
  45. Li, Y.; Ji, S.; Fu, L.Y.; Jiang, T.; Wu, D.; Meng, F.D. Knockdown of Cyclin-Dependent Kinase Inhibitor 3 Inhibits Proliferation and Invasion in Human Gastric Cancer Cells. Oncol. Res. 2017, 25, 721–731. [Google Scholar] [CrossRef] [PubMed]
  46. Xing, C.; Xie, H.; Zhou, L.; Zhou, W.; Zhang, W.; Ding, S.; Wei, B.; Yu, X.; Su, R.; Zheng, S. Cyclin-dependent kinase inhibitor 3 is overexpressed in hepatocellular carcinoma and promotes tumor cell proliferation. Biochem. Biophys. Res. Commun. 2012, 420, 29–35. [Google Scholar] [CrossRef] [PubMed]
  47. Shen, D.-Y.; Zhan, Y.-H.; Wang, Q.-M.; Rui, G.; Zhang, Z.M. Oncogenic potential of cyclin kinase subunit-2 in cholangiocarcinoma. Liver Int. 2013, 33, 137–148. [Google Scholar] [CrossRef] [PubMed]
  48. Scrideli, C.A.; Carlotti, C.G.; Okamoto, O.K.; Andrade, V.S.; Cortez, M.A.; Motta, F.J.; Lucio-Eterovi, A.K.; Neder, L.; Rosemberg, S.; Oba-Shinjo, S.M.; et al. Gene expression profile analysis of primary glioblastomas and non-neoplastic brain tissue: Identification of potential target genes by oligonucleotide microarray and real-time quantitative PCR. J. Neurooncol. 2008, 88, 281–291. [Google Scholar] [CrossRef]
  49. Rickman, D.S.; Bobek, M.P.; Misek, D.E.; Kuick, R.; Blaivas, M.; Kurnit, D.M.; Taylor, J.; Hanash, S.M. Distinctive molecular profiles of high-grade and low-grade gliomas based on oligonucleotide microarray analysis. Cancer Res. 2001, 61, 6885–6891. [Google Scholar]
  50. Sethi, G.; Ahn, K.S.; Pandey, M.K.; Aggarwal, B.B. Celastrol, a novel triterpene, potentiates TNF-induced apoptosis and suppresses invasion of tumor cells by inhibiting NF-kappaB-regulated gene products and TAK1-mediated NF-kappaB activation. Blood 2007, 109, 2727–2735. [Google Scholar] [CrossRef] [Green Version]
  51. Kannaiyan, R.; Manu, K.A.; Chen, L.; Li, F.; Rajendran, P.; Subramaniam, A.; Lam, P.; Kumar, A.P.; Sethi, G. Celastrol inhibits tumor cell proliferation and promotes apoptosis through the activation of c-Jun N-terminal kinase and suppression of PI3K/Akt signaling pathways. Apoptosis 2011, 16, 1028–1041. [Google Scholar] [CrossRef] [PubMed]
  52. Ziegler, D.S.; Kung, A.L.; Kieran, M.W. Anti-apoptosis mechanisms in malignant gliomas. J. Clin. Oncol. 2008, 26, 493–500. [Google Scholar] [CrossRef] [PubMed] [Green Version]
  53. Glibo, M.; Serman, A.; Karin-Kujundzic, V.; Bekavac Vlatkovic, I.; Miskovic, B.; Vranic, S.; Serman, L. The role of glycogen synthase kinase 3 (GSK3) in cancer with emphasis on ovarian cancer development and progression: A comprehensive review. Bosn. J. Basic Med. Sci. 2021, 21, 5–18. [Google Scholar] [CrossRef]
  54. Rubinfeld, B.; Albert, I.; Porfiri, E.; Fiol, C.; Munemitsu, S.; Polakis, P. Binding of GSK3beta to the APC-beta-catenin complex and regulation of complex assembly. Science 1996, 272, 1023–1026. [Google Scholar] [CrossRef] [PubMed]
  55. Lefranc, F.; Facchini, V.; Kiss, R. Proautophagic drugs: A novel means to combat apoptosis-resistant cancers, with a special emphasis on glioblastomas. Oncologist 2007, 12, 1395–1403. [Google Scholar] [CrossRef]
  56. Paul-Samojedny, M.; Pudełko, A.; Kowalczyk, M.; Fila-Daniłow, A.; Suchanek-Raif, R.; Borkowska, P.; Kowalski, J. Knockdown of AKT3 and PI3KCA by RNA interference changes the expression of the genes that are related to apoptosis and autophagy in T98G glioblastoma multiforme cells. Pharmacol. Rep. 2015, 67, 1115–1123. [Google Scholar] [CrossRef] [PubMed]
  57. Kanzawa, T.; Zhang, L.; Xiao, L.; Germano, I.M.; Kondo, Y.; Kondo, S. Arsenic trioxide induces autophagic cell death in malignant glioma cells by upregulation of mitochondrial cell death protein BNIP3. Oncogene 2005, 24, 980–991. [Google Scholar] [CrossRef] [Green Version]
  58. Burton, T.R.; Eisenstat, D.D.; Gibson, S.B. BNIP3 (Bcl-2 19 kDa interacting protein) acts as transcriptional repressor of apoptosis-inducing factor expression preventing cell death in human malignant gliomas. J. Neurosci. 2009, 29, 4189–4199. [Google Scholar] [CrossRef]
  59. Janku, F.; McConkey, D.J.; Hong, D.S.; Kurzrock, R. Autophagy as a target for anticancer therapy. Nat. Rev. Clin. Oncol. 2011, 8, 528–539. [Google Scholar] [CrossRef]
Figure 1. Trypan blue cell viability assay. The U251MG glioblastoma multiforme cells were treated with celastrol (0, 0.5, 1, 2.5, 5 and 10 μM). The data are presented as the means ± the SEM of six independent experiments. Statistically significant *** p < 0.001.
Processes 10 00441 g001
Figure 2. The cell cycle profiles of the U251MG cells that were examined using flow cytometry. (a) U251MG cells that had been exposed to celastrol (1 μM; CEL) for 24 h, the siRNA that is specific for miR-9-2 (0.25 nM; miR-9-2) for 48 h or a combination of the siRNA that is specific for miR-9-2 (0.25 nM) for 48 h and celastrol (1 μM) for 24 h (miR-9-2 + CEL). (b) The U251MG cells that had been exposed to celastrol (1 μM; CEL) for 24 h, the siRNA that is specific for miR-17 (0.25 nM; miR-17) for 48 h, or a combination of the siRNA that is specific for miR-17 (0.25 nM) for 48 h and celastrol (1 μM) for 24 h (miR-17 + CEL). (c) The U251MG cells that had been exposed to celastrol (1 μM; CEL) for 24 h, the siRNA that is specific for miR-19 (0.25 nM; miR-19) for 48 h or a combination of the siRNA that is specific for miR-19 (0.25 nM) for 48 h and celastrol (1 μM) for 24 h (miR-19 + CEL). The results are presented as the percentage contribution of the number of cells that were located in each cell cycle phase, including the subG1 population. The results represent the average of three replicates. Statistically significant * p < 0.05, ** p < 0.01, *** p < 0.001.
Processes 10 00441 g002aProcesses 10 00441 g002b
Figure 3. The RT-qPCR analysis for the genes related to the cell cycle after 24 h of treatment with 1 µM celastrol, 0.25 nM miR-9-2, miR-17, miR-19 specific siRNA (miR-9-2, miR-17, miR-19) and the combination of celastrol with knockdown of the miR-9-2, miR-17 and miR-19 genes (miR9-2 + CEL, miR-17 + CEL, miR-19 + CEL) is presented as the fold change (2−∆∆CT) in the level of their expression, which was normalized to the TBP reference gene. C (control) untreated cells. The data are expressed as the mean ± SD (n = 6 independent assays); statistically significant * p < 0.05, ** p < 0.01, *** p < 0.001, **** p < 0.0001, ordinary one-way ANOVA followed by Tukey’s post-hoc test. (a) The U251MG cells that had been exposed to celastrol (1 μM; CEL) for 24 h, the siRNA that is specific for miR-9-2 (0.25 nM; miR-9-2) for 48 h or a combination of the siRNA that is specific for miR-9-2 (0.25 nM) for 48 h and celastrol (1 μM) for 24 h (miR-9-2 + CEL). (b) The U251MG cells that had been exposed to celastrol (1 μM; CEL) for 24 h, the siRNA that is specific for miR-17 (0.25 nM; miR-17) for 48 h or a combination of the siRNA that is specific for miR-17 (0.25 nM) for 48 h and celastrol (1 μM) for 24 h (miR-17 + CEL). (c) The U251MG cells that had been exposed to celastrol (1 μM; CEL) for 24 h, the siRNA that is specific for miR-19 (0.25 nM; miR-19) for 48 h or a combination of the siRNA that is specific for miR-19 (0.25 nM) for 48 h and celastrol (1 μM) for 24 h (miR-19 + CEL).
Processes 10 00441 g003aProcesses 10 00441 g003b
Figure 4. RT-qPCR analysis for the genes related to apoptosis after 24 h of treatment with 1 μM celastrol, 0.25 nM miR-9-2, miR-17, miR-19 specific siRNA (miR-9-2, miR-17, miR-19) and the combination of celastrol with the knockdown of miR-9-2, miR-17 miR-19 genes (miR9-2 + CEL, miR-17 + CEL and miR-19 + CEL) is presented as the fold change (2−∆∆CT) in the level of their expression, which was normalized to the TBP reference gene. C (control) untreated cells. The data are expressed as the mean ± SD (n = 6 independent assays); statistically significant * p < 0.05, ** p < 0.01, *** p < 0.001, **** p < 0.0001, ordinary one-way ANOVA followed by a post hoc Tukey’s test. (a) The U251MG cells that had been exposed to celastrol (1 μM; CEL) for 24 h, the siRNA that is specific for miR-9-2 (0.25 nM; miR-9-2) for 48 h or a combination of the siRNA specific for miR-9-2 (0.25 nM) for 48 h and celastrol (1 μM) for 24 h (miR-9-2 + CEL). (b) The U251MG cells that had been exposed to celastrol (1 μM; CEL) for 24 h, the siRNA that is specific for miR-17 (0.25 nM; miR-17) for 48 h or a combination of the siRNA that is specific for miR-17 (0.25 nM) for 48 h and celastrol (1 μM) for 24 h (miR-17 + CEL). (c) The U251MG cells that had been exposed to celastrol (1 μM; CEL) for 24 h, the siRNA that is specific for miR-19 (0.25 nM; miR-19) for 48 h or a combination of the siRNA that is specific for miR-19 (0.25 nM) for 48 h and celastrol (1 μM) for 24 h (miR-19 + CEL).
Processes 10 00441 g004aProcesses 10 00441 g004b
Figure 5. The RT-qPCR analysis for the genes related to autophagy after 24 h of treatment with 1 μM celastrol, 0.25 nM miR-9-2, miR-17, miR-19 specific siRNA (miR-9-2, miR-17, miR-19) and the combination of celastrol with the knockdown of the miR-9-2, miR-17 and miR-19 genes (miR9-2 + CEL, miR-17 + CEL and miR-19 + CEL) is presented as the fold change (2−∆∆CT) in the level of their expression, which was normalized to the TBP reference gene. C (control) untreated cells. The data are expressed as the mean ± SD (n = 6 independent assays); statistically significant * p < 0.05, ** p < 0.01, *** p < 0.001, **** p < 0.0001, ordinary one-way ANOVA followed by a Tukey’s post-hoc test. (a) The U251MG cells that had been exposed to celastrol (1 μM; CEL) for 24 h, the siRNA that is specific for miR-9-2 (0.25 nM; miR-9-2) for 48 h or a combination of the siRNA that is specific for miR-9-2 (0.25 nM) for 48 h and celastrol (1 μM) for 24 h (miR-9-2 + CEL). (b) The U251MG cells that had been exposed to celastrol (1 μM; CEL) for 24 h, the siRNA that is specific for miR-17 (0.25 nM; miR-17) for 48 h or a combination of the siRNA that is specific for miR-17 (0.25 nM) for 48 h and celastrol (1 μM) for 24 h (miR-17 + CEL). (c) The U251MG cells that had been exposed to celastrol (1 μM; CEL) for 24 h, the siRNA that is specific for miR-19 (0.25 nM; miR-19) for 48 h or a combination of the siRNA that is specific for miR-19 (0.25 nM) for 48 h and celastrol (1 μM) for 24 h (miR-19 + CEL).
Processes 10 00441 g005aProcesses 10 00441 g005b
Table 1. Sequences of the primers that were used for the RT-qPCR.
GenePrimer Forward Sequence (5′→3′)Primer Reverse Sequence (5′→3′)
CDC20CAGCTATATCCTGTCCAGTGCCAAGTTATCATTACCACCAC
CDC25AAGAAGAATACATTCCCTACCTCCAAGAGAATCAGAATGGCTC
CDK4GAACATTCTGGTGACAAGTGCAAAGATACAGCCAACACTC
CKS2TCATCTGATGTCTGAAGAGGGAGAAGAATATGTGGTTCTGG
CDKN3GAAGAACTAAAGAGCTGTGGTTCCATTATTTCACAGCAGC
MELKAGGGTAACAAGGATTACCATCCTGATCCAAGATATGATTTGCC
CASP3TGCTGCATCGACATCTGTACCCGCTGTGAAAGACATCATTTTGGC
CASP8TTCAAGCCCTGCTGAATTTGC ACAAAAATATTGTGGTTTCCTGTTGAAGAG
CASP9AGGCCTCAGCCTCTTTCAGCGGGTTGAGTGGACATTCCC
BIDTATCTTCCAGCCTGTCTTCTCTAGGTGCACGGATAGGACTTCAGG
GSK3BGTCTATCTTAATCTGGTGCTGACTTGACATAAATCACAGGG
BNIP3CAGTCTGAGGAAGATGATATTGGTGTTTAAAGAGGAACTCCTTG
PDCD1LTATCTGAACCTGTGGTCTTGGAATTCTTGTTCAGAGTCCAG
BECN1QuantiTect Primer Assay Hs_ULK1_1_SG, cat. no.: QT00009884
ULK1QuantiTect Primer Assay Hs_BECN1_1_SG, cat. no.: QT00004221
MAPLC3IIAAGAAAGGATTTTGAGGAGGGTTCATCTGCAAAACTGAGAC
TBPGGAAGTGACATTATCAACGCCCAAGAAACAGTGATGCTG
Table 2. Results of the one-way ANOVA followed by Tukey’s post-hoc test in Figure 2. Statistically significant * p < 0.05, ** p < 0.01, *** p < 0.001, **** p < 0.0001.
GeneTukey’s Multiple Comparison TestSignificantSummaryAdjusted p-Value
CDC25AC vs. CELNons0.9425
C vs. miR-9-2 siRNANons0.8989
C vs. miR-9-2 siRNA + CELYes****<0.0001
CEL vs. miR-9-2 siRNANons0.9982
CEL vs. miR-9-2 siRNA + CELNons0.1064
miR-9-2 siRNA vs. miR-9-2 siRNA + CELYes*0.0126
C vs. miR-17 siRNAYes****<0.0001
C vs. miR-17 siRNA + CELYes***0.0002
CEL vs. miR-17 siRNANons0.198
CEL vs. miR-17 siRNA + CELNons0.1287
miR-17 siRNA vs. miR-17 siRNA + CELNons0.2627
C vs. miR-19 siRNAYes****<0.0001
C vs. miR-19 siRNA + CELYes*0.045
CEL vs. miR-19 siRNANons0.1609
CEL vs. miR-19 siRNA + CELNons0.4055
miR-19 siRNA vs. miR-19 siRNA + CELYes**0.0038
CDK4C vs. CELYes****<0.0001
C vs. miR-9-2 siRNANons0.9869
C vs. miR-9-2 siRNA + CELYes****<0.0001
CEL vs. miR-9-2 siRNAYes**0.001
CEL vs. miR-9-2 siRNA + CELYes****<0.0001
miR-9-2 siRNA vs. miR-9-2 siRNA + CELNons0.1022
C vs. miR-17 siRNANons0.0729
C vs. miR-17 siRNA + CELYes***0.0006
CEL vs. miR-17 siRNAYes****<0.0001
CEL vs. miR-17 siRNA + CELYes****<0.0001
miR-17 siRNA vs. miR-17 siRNA + CELNons0.934
C vs. miR-19 siRNAYes****<0.0001
C vs. miR-19 siRNA + CELYes***0.0003
CEL vs. miR-19 siRNAYes****<0.0001
CEL vs. miR-19 siRNA + CELYes****<0.0001
miR-19 siRNA vs. miR-19 siRNA + CELYes**0.001
CDC20C vs. CELYes*0.0176
C vs. miR-9-2 siRNANons0.9876
C vs. miR-9-2 siRNA + CELYes*0.0127
CEL vs. miR-9-2 siRNAYes*0.0131
CEL vs. miR-9-2 siRNA + CELNons0.9962
miR-9-2 siRNA vs. miR-9-2 siRNA + CELYes*0.0111
C vs. miR-17 siRNANons0.0751
C vs. miR-17 siRNA + CELNons0.3562
CEL vs. miR-17 siRNAYes***0.00007
CEL vs. miR-17 siRNA + CELYes***0.0067
miR-17 siRNA vs. miR-17 siRNA + CELNons0.911
C vs. miR-19 siRNANons0.3629
C vs. miR-19 siRNA + CELNons0.2724
CEL vs. miR-19 siRNANons0.99
CEL vs. miR-19 siRNA + CELNons0.8499
miR-19 siRNA vs. miR-19 siRNA + CELNons0.887
MELKC vs. CELYes***0.0002
C vs. miR-9-2 siRNAYes*0.0265
C vs. miR-9-2 siRNA + CELYes***0.0003
CEL vs. miR-9-2 siRNANons0.2059
CEL vs. miR-9-2 siRNA + CELNons0.9875
miR-9-2 siRNA vs. miR-9-2 siRNA + CELNons0.1934
C vs. miR-17 siRNANons0.7529
C vs. miR-17 siRNA + CELNons0.9398
CEL vs. miR-17 siRNANons0.0668
CEL vs. miR-17 siRNA + CELYes****<0.0001
miR-17 siRNA vs. miR-17 siRNA + CELNons0.5946
C vs. miR-19 siRNAYes**0.022
C vs. miR-19 siRNA + CELNons0.9417
CEL vs. miR-19 siRNAYes****<0.0001
CEL vs. miR-19 siRNA + CELYes**0.0062
miR-19 siRNA vs. miR-19 siRNA + CELNons0.0576
CDKN3C vs. CELNons0.3463
C vs. miR-9-2 siRNAYes***0.0003
C vs. miR-9-2 siRNA + CELNons0.6099
CEL vs. miR-9-2 siRNANons0.1796
CEL vs. miR-9-2 siRNA + CELNons0.2762
miR-9-2 siRNA vs. miR-9-2 siRNA + CELNons0.0687
C vs. miR-17 siRNAYes****<0.0001
C vs. miR-17 siRNA + CELNons0.8796
CEL vs. miR-17 siRNAYes***0.0005
CEL vs. miR-17 siRNA + CELNons0.2074
miR-17 siRNA vs. miR-17 siRNA + CELYes****<0.0001
C vs. miR-19 siRNAYes****<0.0001
C vs. miR-19 siRNA + CELYes****<0.0001
CEL vs. miR-19 siRNAYes***0.0005
CEL vs. miR-19 siRNA + CELYes***0.0005
miR-19 siRNA vs. miR-19 siRNA + CELYes*0.0395
CKS2C vs. CELYes***0.0003
C vs. miR-9-2 siRNANons0.2571
C vs. miR-9-2 siRNA + CELNons0.1211
CEL vs. miR-9-2 siRNANons0.2747
CEL vs. miR-9-2 siRNA + CELYes***0.0002
miR-9-2 siRNA vs. miR-9-2 siRNA + CELYes*0.0336
C vs. miR-17 siRNAYes****<0.0001
C vs. miR-17 siRNA + CELYes**0.0044
CEL vs. miR-17 siRNAYes****<0.0001
CEL vs. miR-17 siRNA + CELYes**0.0043
miR-17 siRNA vs. miR-17 siRNA + CELYes*0.0338
C vs. miR-19 siRNAYes*0.0267
C vs. miR-19 siRNA + CELYes*0.0238
CEL vs. miR-19 siRNAYes*0.0249
CEL vs. miR-19 siRNA + CELYes*0.0227
miR-19 siRNA vs. miR-19 siRNA + CELNons0.5966
Table 3. Mean fold change value (relative to the control cells) and the direction of the change in the expression of the cell cycle-related genes in the U251MG cells.
GeneEffect on the U251MG CellsThe Fold Change ValueThe Direction of the Change in Expression
CDC25ACEL1.2no change
miR-9-2 siRNA1.1no change
miR-9-2 siRNA + CEL0.144
miR-17 siRNA0.34
miR-17 siRNA + CEL0.206
miR-19 siRNA0.28
miR-19 siRNA + CEL1.8
CDK4CEL3.26
miR-9-2 siRNA1.091no change
miR-9-2 siRNA + CEL0.31
miR-17 siRNA0.43
miR-17 siRNA + CEL0.54
miR-19 siRNA0.2
miR-19 siRNA + CEL0.56
CDC20CEL1.38
miR-9-2 siRNA0.98no change
miR-9-2 siRNA + CEL1.36
miR-17 siRNA0.68
miR-17 siRNA + CEL0.78
miR-19 siRNA1.37
miR-19 siRNA + CEL1.62
MELKCEL0.08
miR-9-2 siRNA0.4
miR-9-2 siRNA + CEL0.07
miR-17 siRNA0.79
miR-17 siRNA + CEL0.79no change
miR-19 siRNA0.43
miR-19 siRNA + CEL0.44no change
CDKN3CEL0.88no change
miR-9-2 siRNA0.66
miR-9-2 siRNA + CEL1.28no change
miR-17 siRNA0.004
miR-17 siRNA + CEL1.08no change
miR-19 siRNA0.004
miR-19 siRNA + CEL0.004
CKS2CEL0.54
miR-9-2 siRNA0.77no change
miR-9-2 siRNA + CEL1.2no change
miR-17 siRNA27.6
miR-17 siRNA + CEL69.8
miR-19 siRNA26.5
miR-19 siRNA + CEL40.0
Table 4. Results of the one-way ANOVA followed by the post-hoc Tukey test in Figure 3. Statistically significant * p < 0.05, ** p < 0.01, *** p < 0.001, **** p < 0.0001.
GeneTukey Multiple Comparison TestSignificantSummaryAdjusted p-Value
CASP3C vs. CELYes*0.0113
C vs. miR-9-2 siRNANons0.8333
C vs. miR-9-2 siRNA + CELYes**0.004
CEL vs. miR-9-2 siRNAYes**0.0066
CEL vs. miR-9-2 siRNA + CELYes**0.0037
miR-9-2 siRNA vs. miR-9-2 siRNA + CELYes**0.0028
C vs. miR-17 siRNAYes*0.04
C vs. miR-17 siRNA + CELNons0.3839
CEL vs. miR-17 siRNANons0.7731
CEL vs. miR-17 siRNA + CELYes*0.0258
miR-17 siRNA vs. miR-17 siRNA + CELYes*0.0351
C vs. miR-19 siRNANons0.2028
C vs. miR-19 siRNA + CELNons0.9884
CEL vs. miR-19 siRNANons0.0686
CEL vs. miR-19 siRNA + CELYes***0.0009
miR-19 siRNA vs. miR-19 siRNA + CELNons0.1859
CASP8C vs. CELYes***0.0007
C vs. miR-9-2 siRNAYes*0.0406
C vs. miR-9-2 siRNA + CELNo ns0.0521
CEL vs. miR-9-2 siRNANons0.5545
CEL vs. miR-9-2 siRNA + CELYes***0.0006
miR-9-2 siRNA vs. miR-9-2 siRNA + CELYes*0.0351
C vs. miR-17 siRNAYes*0.0267
C vs. miR-17 siRNA + CELYes**0.0051
CEL vs. miR-17 siRNANons0.0605
CEL vs. miR-17 siRNA + CELNons0.2821
miR-17 siRNA vs. miR-17 siRNA + CELYes*0.0276
C vs. miR-19 siRNAYes*0.0458
C vs. miR-19 siRNA + CELYes*0.0292
CEL vs. miR-19 siRNANons0.1383
CEL vs. miR-19 siRNA + CELNons0.6991
miR-19 siRNA vs. miR-19 siRNA + CELNons0.8062
CASP9C vs. CELYes****<0.0001
C vs. miR-9-2 siRNAYes*0.0205
C vs. miR-9-2 siRNA + CELYes**0.0031
CEL vs. miR-9-2 siRNAYes****<0.0001
CEL vs. miR-9-2 siRNA + CELYes****<0.0001
miR-9-2 siRNA vs. miR-9-2 siRNA + CELNo ns0.1371
C vs. miR-17 siRNAYes****<0.0001
C vs. miR-17 siRNA + CELYes*0.0108
CEL vs. miR-17 siRNAYes*0.0397
CEL vs. miR-17 siRNA + CELYes*0.0473
miR-17 siRNA vs. miR-17 siRNA + CELNo ns0.2818
C vs. miR-19 siRNAYes*0.0146
C vs. miR-19 siRNA + CELYes**0.0031
CEL vs. miR-19 siRNAYes****<0.0001
CEL vs. miR-19 siRNA + CELYes***0.0006
miR-19 siRNA vs. miR-19 siRNA + CELYes**0.0054
BIDC vs. CELYes***0.0009
C vs. miR-9-2 siRNAYes**0.0012
C vs. miR-9-2 siRNA + CELYes***0.0001
CEL vs. miR-9-2 siRNANons0.0752
CEL vs. miR-9-2 siRNA + CELYes**0.0023
miR-9-2 siRNA vs. miR-9-2 siRNA + CELYes**0.0060
C vs. miR-17 siRNAYes*0.0425
C vs. miR-17 siRNA + CELYes***0.0003
CEL vs. miR-17 siRNAYes**0.001
CEL vs. miR-17 siRNA + CELYes**0.002
miR-17 siRNA vs. miR-17 siRNA + CELNons0.9981
C vs. miR-19 siRNAYes****<0.0001
C vs. miR-19 siRNA + CELYes****<0.0001
CEL vs. miR-19 siRNAYes**0.0011
CEL vs. miR-19 siRNA + CELYes**0.0017
miR-19 siRNA vs. miR-19 siRNA + CELYes****<0.0001
GSK3BC vs. CELNons0.0839
C vs. miR-9-2 siRNAYes*0.0445
C vs. miR-9-2 siRNA + CELYes****<0.0001
CEL vs. miR-9-2 siRNAYes**0.0073
CEL vs. miR-9-2 siRNA + CELYes**0.0049
miR-9-2 siRNA vs. miR-9-2 siRNA + CELYes**0.0014
C vs. miR-17 siRNAYes**0.0032
C vs. miR-17 siRNA + CELYes**0.0025
CEL vs. miR-17 siRNAYes**0.0032
CEL vs. miR-17 siRNA + CELYes**0.0025
miR-17 siRNA vs. miR-17 siRNA + CELYes*0.0367
C vs. miR-19 siRNAYes*0.0206
C vs. miR-19 siRNA + CELYes**0.0019
CEL vs. miR-19 siRNAYes*0.0206
CEL vs. miR-19 siRNA + CELYes**0.0019
miR-19 siRNA vs. miR-19 siRNA + CELNons0.7707
BNIP3C vs. CELYes**0.0011
C vs. miR-9-2 siRNAYes*0.0498
C vs. miR-9-2 siRNA + CELYes***0.0007
CEL vs. miR-9-2 siRNAYes**0.0013
CEL vs. miR-9-2 siRNA + CELYes***0.0008
miR-9-2 siRNA vs. miR-9-2 siRNA + CELYes**0.0059
C vs. miR-17 siRNAYes****<0.0001
C vs. miR-17 siRNA + CELYes***0.001
CEL vs. miR-17 siRNAYes***0.0007
CEL vs. miR-17 siRNA + CELYes**0.0031
miR-17 siRNA vs. miR-17 siRNA + CELYes***0.0002
C vs. miR-19 siRNANons0.4571
C vs. miR-19 siRNA + CELYes**0.0034
CEL vs. miR-19 siRNAYes***0.008
CEL vs. miR-19 siRNA + CELYes**0.0024
miR-19 siRNA vs. miR-19 siRNA + CELYes***0.0009
PDCD1LC vs. CELYes**0.0015
C vs. miR-9-2 siRNAYes***0.0003
C vs. miR-9-2 siRNA + CELYes*0.0151
CEL vs. miR-9-2 siRNANons0.9918
CEL vs. miR-9-2 siRNA + CELYes**0.0022
miR-9-2 siRNA vs. miR-9-2 siRNA + CELYes***0.0004
C vs. miR-17 siRNAYes****<0.0001
C vs. miR-17 siRNA + CELYes***0.0008
CEL vs. miR-17 siRNAYes****<0.0001
CEL vs. miR-17 siRNA + CELYes**0.0047
miR-17 siRNA vs. miR-17 siRNA + CELNons0.8931
C vs. miR-19 siRNAYes**0.0023
C vs. miR-19 siRNA + CELNons0.5094
CEL vs. miR-19 siRNAYes**0.0041
CEL vs. miR-19 siRNA + CELYes**0.0018
miR-19 siRNA vs. miR-19 siRNA + CELYes**0.0061
Table 5. Mean fold change value (relative to the control cells) and the direction of the change in the expression of the apoptosis-related genes in the U251MG cells.
GeneEffect on the U251MG CellsThe Fold Change ValueThe Direction of the Change in Expression
CASP3CEL0.26
miR-9-2 siRNA1.21no change
miR-9-2 siRNA + CEL0.025
miR-17 siRNA0.4
miR-17 siRNA + CEL1.653
miR-19 siRNA2.9
miR-19 siRNA + CEL0.99no change
CASP8CEL6.73
miR-9-2 siRNA5.1
miR-9-2 siRNA + CEL0.84no change
miR-17 siRNA4.05
miR-17 siRNA + CEL9.6
miR-19 siRNA4.22
miR-19 siRNA + CEL5.41
CASP9CEL209.9
miR-9-2 siRNA62.17no change
miR-9-2 siRNA + CEL26.24
miR-17 siRNA174.3
miR-17 siRNA + CEL124.4
miR-19 siRNA15.26
miR-19 siRNA + CEL98.94
BIDCEL15.59
miR-9-2 siRNA10.27
miR-9-2 siRNA + CEL4.07
miR-17 siRNA3.86
miR-17 siRNA + CEL3.73
miR-19 siRNA1.86
miR-19 siRNA + CEL3.06
GSK3BCEL0.69no change
miR-9-2 siRNA1.75
miR-9-2 siRNA + CEL0.064
miR-17 siRNA1379
miR-17 siRNA + CEL618.5
miR-19 siRNA603.6
miR-19 siRNA + CEL465.8
BNIP3CEL9.53
miR-9-2 siRNA1.72
miR-9-2 siRNA + CEL0.53
miR-17 siRNA0.31
miR-17 siRNA + CEL3.15
miR-19 siRNA0.77no change
miR-19 siRNA + CEL2.54
PDCD1LCEL7.54
miR-9-2 siRNA7.82
miR-9-2 siRNA + CEL1.52
miR-17 siRNA19.1
miR-17 siRNA + CEL17.65
miR-19 siRNA60.0
miR-19 siRNA + CEL1.15no change
Table 6. Results of the one-way ANOVA followed by Tukey’s post-hoc test in Figure 4. Statistically significant * p < 0.05, ** p < 0.01, *** p < 0.001, **** p < 0.0001.
GeneTukey’s Multiple Comparison TestSignificantSummaryAdjusted p-Value
BECN1C vs. CELYes****<0.0001
C vs. miR-9-2 siRNAYes***0.0006
C vs. miR-9-2 siRNA + CELNons0.2794
CEL vs. miR-9-2 siRNAYes***0.0007
CEL vs. miR-9-2 siRNA + CELYes****<0.0001
miR-9-2 siRNA vs. miR-9-2 siRNA + CELYes***0.0006
C vs. miR-17 siRNAYes**0.0021
C vs. miR-17 siRNA + CELYes**0.0087
CEL vs. miR-17 siRNAYes**0.0022
CEL vs. miR-17 siRNA + CELYes**0.0088
miR-17 siRNA vs. miR-17 siRNA + CELYes*0.0353
C vs. miR-19 siRNAYes*0.0121
C vs. miR-19 siRNA + CELYes*0.0149
CEL vs. miR-19 siRNAYes*0.0127
CEL vs. miR-19 siRNA + CELYes*0.0179
miR-19 siRNA vs. miR-19 siRNA + CELYes*0.0369
ULK1C vs. CELYes****<0.0001
C vs. miR-9-2 siRNAYes**0.0012
C vs. miR-9-2 siRNA + CELYes****<0.0001
CEL vs. miR-9-2 siRNANons0.1698
CEL vs. miR-9-2 siRNA + CELYes***0.0001
miR-9-2 siRNA vs. miR-9-2 siRNA + CELYes**0.0024
C vs. miR-17 siRNAYes****<0.0001
C vs. miR-17 siRNA + CELNons0.1146
CEL vs. miR-17 siRNAYes****<0.0001
CEL vs. miR-17 siRNA + CELYes****<0.0001
miR-17 siRNA vs. miR-17 siRNA + CELNons0.118
C vs. miR-19 siRNAYes**0.0054
C vs. miR-19 siRNA + CELNons0.0921
CEL vs. miR-19 siRNANons0.9923
CEL vs. miR-19 siRNA + CELYes****<0.0001
miR-19 siRNA vs. miR-19 siRNA + CELYes**0.0077
C vs. CELYes*0.0258
C vs. miR-9-2 siRNAYes****<0.0001
C vs. miR-9-2 siRNA + CELYes***0.0004
CEL vs. miR-9-2 siRNANons0.2808
CEL vs. miR-9-2 siRNA + CELNons0.6232
miR-9-2 siRNA vs. miR-9-2 siRNA + CELNons0.8407
C vs. miR-17 siRNAYes*0.0489
C vs. miR-17 siRNA + CELYes***0.0001
CEL vs. miR-17 siRNAYes*0.0248
CEL vs. miR-17 siRNA + CELYes****<0.0001
miR-17 siRNA vs. miR-17 siRNA + CELYes*0.0225
C vs. miR-19 siRNAYes**0.0056
C vs. miR-19 siRNA + CELYes**0.0015
CEL vs. miR-19 siRNAYes**0.0025
CEL vs. miR-19 siRNA + CELYes**0.0013
miR-19 siRNA vs. miR-19 siRNA + CELYes**0.0031
Table 7. Mean fold change value (relative to the control cells) and the direction of the change in the expression of the autophagy-related genes in the U251MG cells.
GeneEffect on the U251MG CellsThe Fold Change ValueThe Direction of the Change in Expression
BECN1CEL67.9
miR-9-2 siRNA37.12
miR-9-2 siRNA + CEL1.24no change
miR-17 siRNA6796
miR-17 siRNA + CEL22,651
miR-19 siRNA5956
miR-19 siRNA + CEL1520
ULK1CEL12.37
miR-9-2 siRNA9.6
miR-9-2 siRNA + CEL2.5
miR-17 siRNA2.66
miR-17 siRNA + CEL10.3
miR-19 siRNA11.88
miR-19 siRNA + CEL2.5
MAPLC3IIACEL0.674
miR-9-2 siRNA0.5
miR-9-2 siRNA + CEL0.55
miR-17 siRNA2.8
miR-17 siRNA + CEL4.92
miR-19 siRNA3.2
miR-19 siRNA + CEL11.7
Publisher’s Note: MDPI stays neutral with regard to jurisdictional claims in published maps and institutional affiliations.

