Article

Non-Woven Filters Made of PLA via Solution Blowing Process for Effective Aerosol Nanoparticles Filtration

Department of Chemical and Process Engineering, Warsaw University of Technology, Waryńskiego 1, 00-645 Warsaw, Poland
*
Authors to whom correspondence should be addressed.
Processes 2022, 10(12), 2598; https://doi.org/10.3390/pr10122598
Submission received: 17 October 2022 / Revised: 23 November 2022 / Accepted: 2 December 2022 / Published: 5 December 2022
(This article belongs to the Special Issue Advanced Liquid Waste and Gas Waste Treatment Processes)

Abstract

:
With the development of civilization, the awareness of the impact of versatile aerosol particles on both human health and the environment is growing. New materials are needed to purify the air to control this impact The aspect of processing the produced waste is not negligible. In view of the above, this study proposes utilizing the solution blow spinning process (SBS) for manufacturing a biodegradable filtration structure that ensures high efficiency of nanoobject filtration, with a low pressure drop. Polylactic acid (PLA) was used to produce a nanofiber layer on the coconut substrate. The advantage of this method is the ability to blow fibers with diameters in the nano-scale, applying relatively simple, cost-effective, and easy to scale-up equipment. This work selected appropriate process parameters to produce good quality filters. Moreover, the process conditions influence on the morphology of the obtained structures and, thus, also the filtration properties, were examined. For tested solutions, i.e., 4% and 6%, the mean fiber diameter decreased as the concentration decreased. Therefore, the overall filtering efficiency increased as the concentration of the used solution decreased. The produced structures exhibited approximately 70% filtration efficiency for particles ranging from 0.02 to 0.2 μm with a pressure drop of less than 60 Pa. Obtained results are optimistic and are a step in producing efficient, biodegradable filters to remove nanoparticles from air.

1. Introduction

Along with the development of civilization, the number of dangerous aerosol particles emitted into the environment is increasing. The World Health Organization reported that 3 million deaths every year were a result of exposure to ambient air pollution. The compounds of air pollution are mainly particulate matter (e.g., mineral dust, soot), ozone, nitrogen dioxide, sulfur dioxide, ammonia, sodium chloride, benzo[a]pyrene. They are a complex mixture of solid and liquid, organic and inorganic substances. Calderón-Garcidueñas et al. [1] found that exposure to air pollution causes neuroinflammation, an altered brain innate immune response in childhood that should be considered a risk factor for Alzheimer’s and Parkinson’s diseases. Wu et al. [2] noticed that long-term exposure (>12 years) to particulate matter particles suspended in the air (PM) could cause an increased risk for Alzheimer’s disease in the elderly (>60 years old). Kioumourtzoglou et al. [3] also showed that increases in annual PM2.5 exposure are associated with time to the first hospitalization for Alzheimer’s and Parkinson’s diseases and dementia. Moreover, when the concentration of PM10 increases by 10 μg/m3, the daily mortality increases by 0.6%, chronic obstructive pulmonary disease (COPD) in people over 65 increases by 10%, and the risk of heart disease increases by 11% [4]. Particulate matter is considered a significant component of outdoor air pollution. Therefore, the International Agency for Research on Cancer (IARC) has classified air pollution and separately PM as carcinogenic to human.
The sources of PM in the environment can be divided into two groups: natural (e.g., ocean evaporation, volcanic eruptions, sandstorms, forest fires) and anthropogenic (industrial processes, domestic heating for households, fuel combustion, transportation, thermal power generation). The impact of PM on human health is primarily related to its size. The larger the particles are, the shorter the residence time in the air and the exposure time. In addition, particles with a diameter of more than 5 μm are mainly deposited in the oral cavity and upper respiratory tract, where a cough can easily remove them from the body. On the other hand, small particles remain in the atmosphere longer and can penetrate deeper into the respiratory tract, up to the alveoli. The smallest of them, those on a nanometric scale, penetrate the body’s barriers and, therefore, are the most dangerous.
There are many ways to reduce the PM from the atmosphere. Devices equipped with fibrous filters or electrostatic precipitators are the most popular because they provide high filtration efficiency over a wide range of particle sizes. Hasler and Nussbaumer [5] showed that the fractional separation efficiency for non-woven filters and electrostatic precipitators is higher than for other devices. Comparing these two methods of aerosol separation, fibrous filters are used more often since their production and exploitation is cheaper. The particles, depending on their diameter and process conditions, are deposited on the fiber’s surface of the non-woven filters due to five mechanisms: diffusion (Brownian motions), interception, inertial impaction, gravitational settling, and electrostatic forces [6]. Particle diameter, air velocity, filter thickness, porosity, and fiber diameter influence particle deposition efficiency for a given mechanism. Jackiewicz et al. [7] compared the behavior of melt-blown polypropylene filters composed of microfibers with those made of nanofibers. As the mean fiber diameter decreases, the pressure drop and particle deposition efficiency increases. Therefore, non-woven filters with only nanometric fibers, despite high filtration efficiency, are rarely produced and rarely used. It is also due to the poor mechanical strength of such thin fibers [8,9]. However, in the numerical simulation, Przekop and Gradoń [10] showed that mixing nanofibers with microfibers ensured high efficiency in nanometric particle filtration without generating high pressure drops because nanofiber is a significant attractor for collecting particles due to the huge surface area to volume ratio. One can affect filtration efficiency by controlling parameters such as fiber diameter or porosity at the stage of fibrous filter production. Moreover, considering that nanofibers are excellent attractors for collecting particles, one can mix them with a highly porous structure containing fibers with a higher diameter (micrometer size and higher) and, thus, significantly improve the nanoparticle filtration efficiency without significantly increasing the pressure drop. This means that the nanofiber production’s capability is crucial in designing and creating optimal filters for air purification.
There are three major processes for nanofiber production: electrostatic spinning [11], the melt-blown technique [12,13], and the blow spinning technique [14,15]. Electrospinning technology is currently the most common method to produce nanofibers (also for water filtration [16]), while the two other methods are less frequently used in the case of nanofibrous production. Huang et al. [17] used electrospinning methods to obtain nanofibrous electret polyvinylidene fluoride materials for air filtration. The average fiber diameter was 644 nm. The filtration efficiency of NaCl particles with a mean diameter of 100 nm was 93.8%, but the pressure drop across the membrane was 950 Pa. The filtration efficiency increased to 99% when nanoscale graphite platelets were incorporated into membranes, but at the same time, the pressure drop increased to almost 1300 Pa. In turn, Su et al. [18] manufactured a hierarchically structured TiO2/PAN (polyacrylonitrile) nanofibrous membrane for air filtration and toluene degradation with a mean fiber diameter of approximately 900 nm. The manufactured membrane ensured the filtration efficiency of NaCl particles (260 nm mass median diameter) in the range of 70–97% and a pressure drop of 50–150 Pa, depending on TiO2 content. Yang et al. [19] proposed air filtration sandwich-structured polyamide-6/polyacrylonitrile nanonets with a mean fiber diameter in the range of 40 nm to 320 nm. The obtained filtration efficiency was above 90% for sodium chloride particles with a mean diameter between 300 and 500 nm with a pressure drop between 20–120 Pa depending on the surface modification. There are also environmentally friendly procedures for manufacturing filter membranes for effective air filtration using electrospinning technology. For example, Zhu et al. [20] have developed a synthesis procedure for crosslinked poly(vinyl alcohol)/poly(acrylic acid) composite membranes for air filtration. The obtained filtration efficiency of NaCl particles (300–500 nm mean diameter) was as high as 90% but at the same time, pressure drop was 150 Pa. An important aspect of manufacturing filtration nanostructures is that the procedure should be environmentally friendly, and the final product should be biodegradable, easily decomposable, or recyclable. Desai et al. [21] fabricated a nanofibrous chitosan non-woven filter made by electrospinning with an average fiber diameter of 88 nm–131 nm, depending on the process conditions. The filtration efficiency for NaCl aerosol particles of 260 nm mean diameter obtained for this structure was 60–70%. Unfortunately, the pressure drop was not shown. In turn, Fang et al. [22] used soy protein isolate to produce a nanofiber membrane as “multi-functional eco-friendly filtration materials”. The filtration efficiency for NaCl particles (260 nm average diameter) was in the range of 90–100%, depending on the area density of the membrane. However, the pressure drop across the membrane was an average of 325 Pa. Matulevicius et al. [23] manufactured nanofiber media using cellulose acetate. The obtained mean fiber diameter was 350–360 nm, the filtration efficiency for NaCl particles (100 nm diameter) was 24%, 44%, and 55% for a single, double, and triple layer membrane, and the pressure drop was, respectively, 6.6 Pa, 13.6 Pa, and 20.2 Pa.
Electrospinning has a few disadvantages: (i) the process of fiber production is challenging to scale up to the industrial level due to its low efficiency, and (ii) the chemicals used during the process are not environmentally friendly. However, Böttjer et al. [24] showed that by using electrospinning—the most popular method to produce nanofibers—one can produce a nanofibrous structure with a high filtration efficiency for nanometric particles. Notwithstanding, the final product is a membrane with relatively low porosity, leading to high pressure drops. The high pressure drops in the structure for air filtration are undesirable since they require a higher energy input, which entails higher costs. In addition, high-pressure drop structures, even with high filtration efficiency, cannot be used as personal protective filters. The research on materials used as personal protection has been strongly developed in recent years, especially due to the SARS-CoV-2 virus epidemic [25,26].
The industrial production of filters is based on the melt-blown technique. The most popular polymer used is polypropylene, causing an environmental problem at the end of the filter’s life. Waste that is difficult to recycle is produced, and it can form nano plastic, which recently became a huge environmental issue [15]. If biodegradable material is used to produce filtration structure, it will reduce environmental pollution. This work proposes using polylactic acid (PLA) to produce nanofibers via the solution blow spinning method (SBS). Such fibers are already successfully used for applications other than separating particles from the air, e.g., tissue engineering, controlled drug release, as surgical sealants [27]. In this technique, the polymer solution is carried by the stream of compressed gas that induces fiber formation. It does not require a high temperature in the solution or severe conditions for the process [14]. That fact gives a possibility to use some of the polymers that were not yet applied in filters manufacturing. Using the suited composition of the solution and process parameters makes it possible to acquire fibers with several dozens of nanometer diameters. Applying such fibers may result in the fabrication of new, highly efficient filtering media. Data on the use of non-woven PLA materials for the effective removal of submicron- and micron-sized particles from the air can be found in the literature [28]. Pierpaoli et al. [29] determined the filtration efficiency for NaCl aerosol particles with diameters of 0.23 μm, 0.5 μm, and 1 μm. Jafari et al. [30] studied the filtration performance of PLA media using 0.3 μm monodisperse DOP (dioctyl phthalate) particles. However, there is a gap in the data on nanoparticles filtration using PLA non-woven fabric. Data on the separation of nanoparticles from the air in other non-woven materials can be found, e.g., for polypropylene [31,32] and PAN (polyacrylonitrile) [33]. The production of non-woven materials made of biodegradable polymers effective for nanoparticle separation is another excellent advantage of the solution blow spinning method. Such materials could reduce the danger of nanoparticle inhalation and the environmental costs of utilizing the filters. Therefore, the main goal was to develop a new, biodegradable filtration structure that ensures high efficiency in nanoobject filtration with a low pressure drop (<100 Pa). The sandwich model of the filter was chosen for investigation. This was created by applying a layer of biodegradable PLA nanofibers to the coconut substrate via the SBS method. Within the work: (i) a system producing filter materials was launched; (ii) operation parameters were selected to ensure materials with the desired properties were obtained; (iii) filter materials were prepared from PLA solutions of selected concentrations; (iv) pressure drops and filtration efficiencies of solid nanoparticles were investigated for new materials; (v) influence of the electrostatic mechanism on filtration in PLA filters was analyzed.

2. Materials and Methods

2.1. Production of Fibrous Materials Media via Solution Blowing

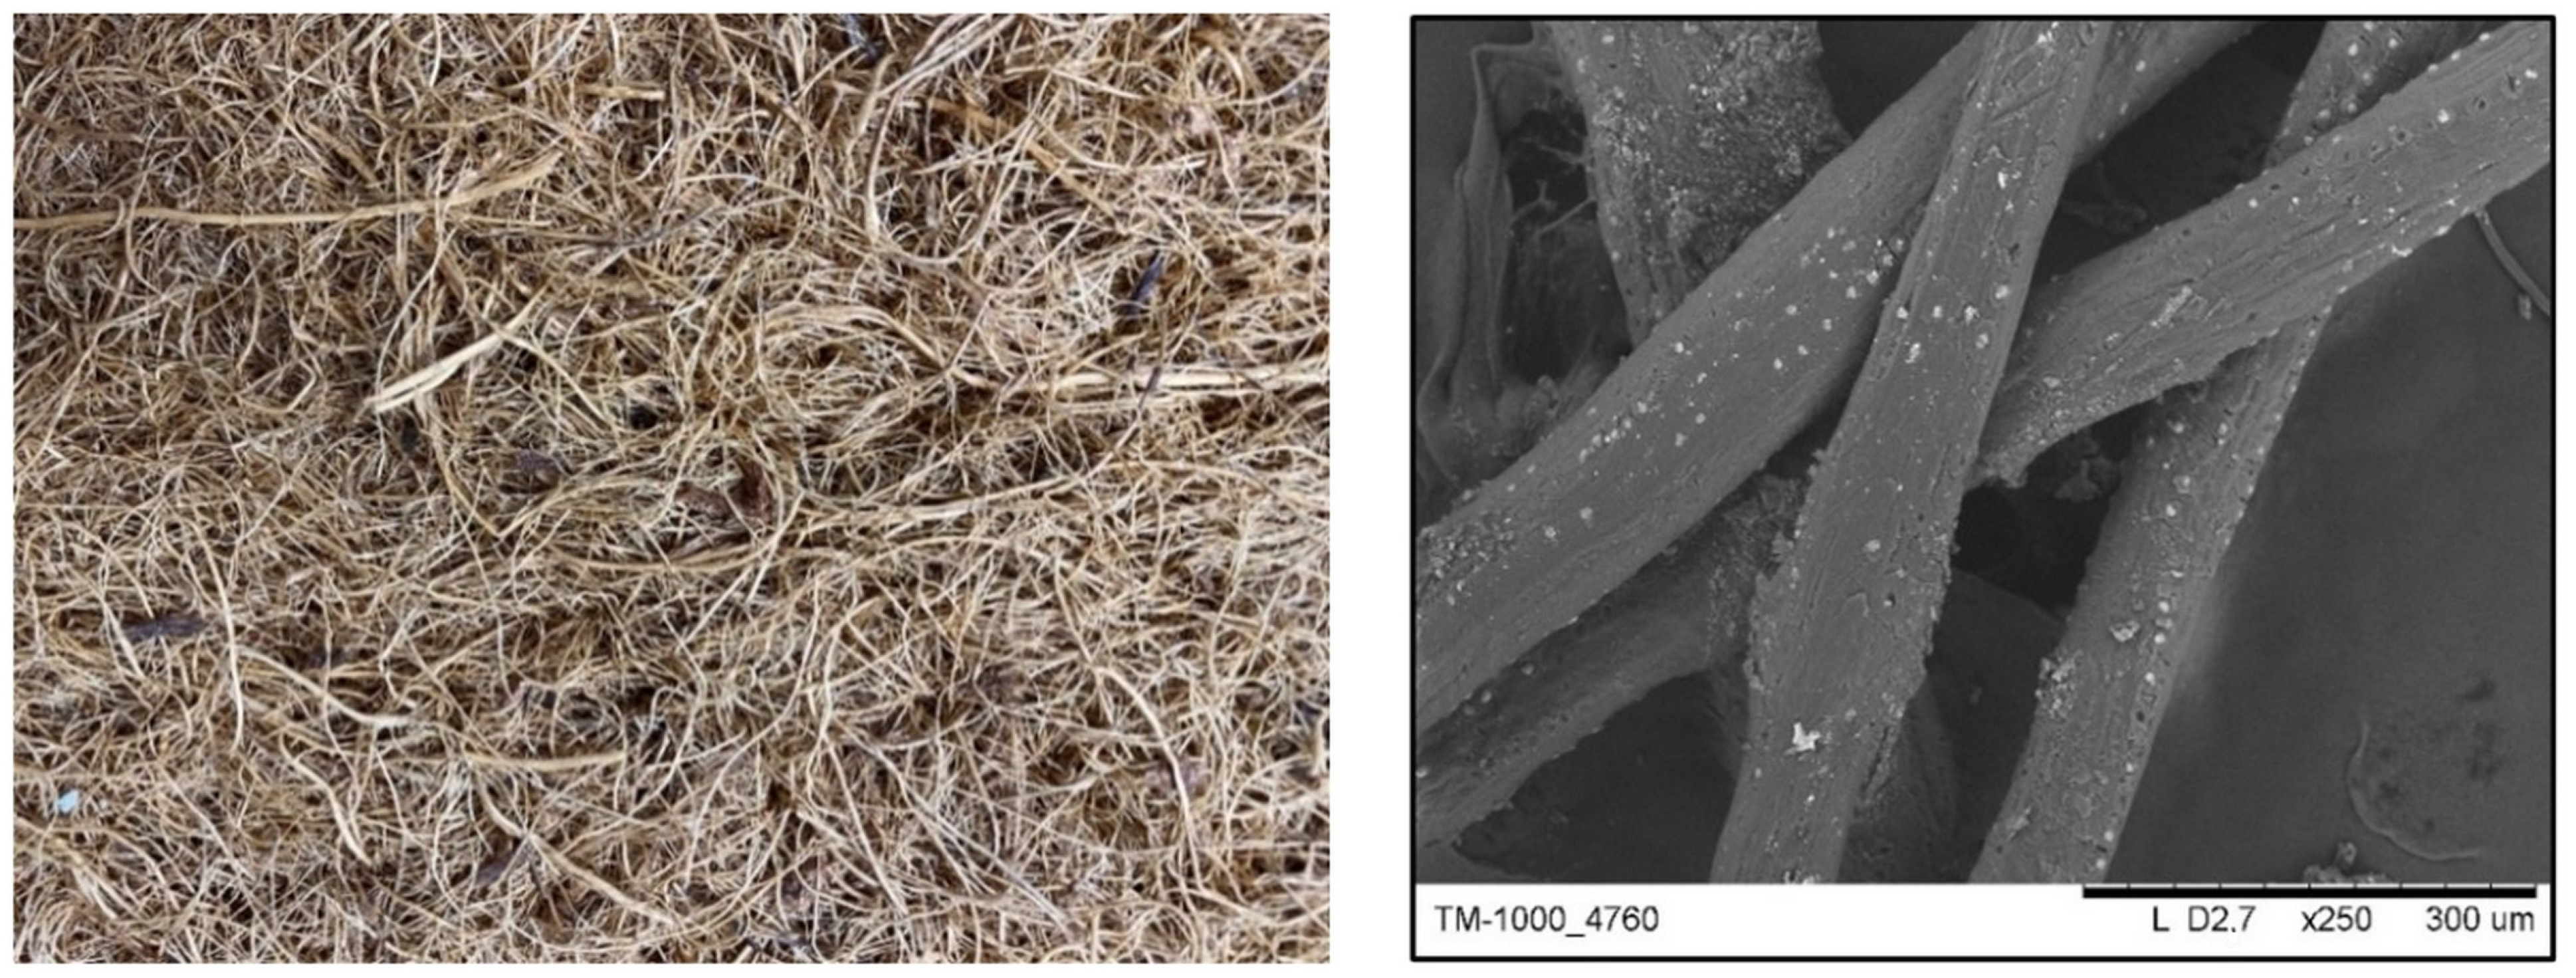
2.1.1. Coconut Support Mat

One of the features that the newly created filter material was supposed to have is biodegradability. For this reason, organic materials were used as a backing layer for the fibers generated by the SBS process. There are a lot of natural fiber sources, i.e., cotton, flax, hemp, even properly processed straw. Coconut fibers are suitable in this case because they have an appropriate diameter and already have the necessary mat structure. They are easily available on the market in this form, and there is no need for a mat forming process. Moreover, coconut fibers were chosen due to their numerous advantages: (i) they are hard and rigid, therefore, they allow the entire filtering structure to be stiffened and stabilized; (ii) the mineral salts found in coconut fibers prevent the growth of microorganisms such as bacteria and mites, which are present in ventilation and air-conditioning systems where our materials can be used; (iii) they absorb and release moisture well; (iv) they have a very porous structure, therefore, the pressure drop for aerosol flowing through such media is low. The base layer should be characterized by the lowest possible pressure drop and small filtration efficiency for submicron particles and high micron-size particles to act as a prefilter for nanofiber structures. Due to the above, it was decided to use a coconut fiber mat as a base layer.
The dimensions of each mat were approximately 14 × 14 cm and 1 cm thickness. The exemplary coconut mat’s photo and a SEM image of its fibers are shown in Figure 1.

2.1.2. Polylactic Acid Solution

Polylactic acid (PLA) (Biomer L9000, Schwalbach, Germany) was chosen to produce nanofibers. It is considered biodegradable and compostable. PLA is a thermoplastic, high-strength polymer that can be made from renewable sources to yield products for use in many applications, e.g., in the packaging field or in medical devices.
The SBS method requires the use of a highly volatile solvent [34]. In this work, the PLA was dissolved in a mix of chloroform (pure p.a, Chempur, Piekary Śląskie, Poland) and acetone (pure p.a, Sigma-Aldrich, Poznań, Poland) at the volume ratio of 3:1 [35]. The concentrations of tested solutions were 4 and 6% wt. Every mixture was stirred until the polymer was completely dissolved. The PLA solution in a mix of chloroform and acetone has nonnewtonian rheology with shear-thinning viscosity. For conditions present in the nozzles during fiber formation (shear rate more prominent than 20 1/s), the apparent viscosity was 70 mPa∙s. The density of the polymer solution was equal to 1.377 kg/dm3.

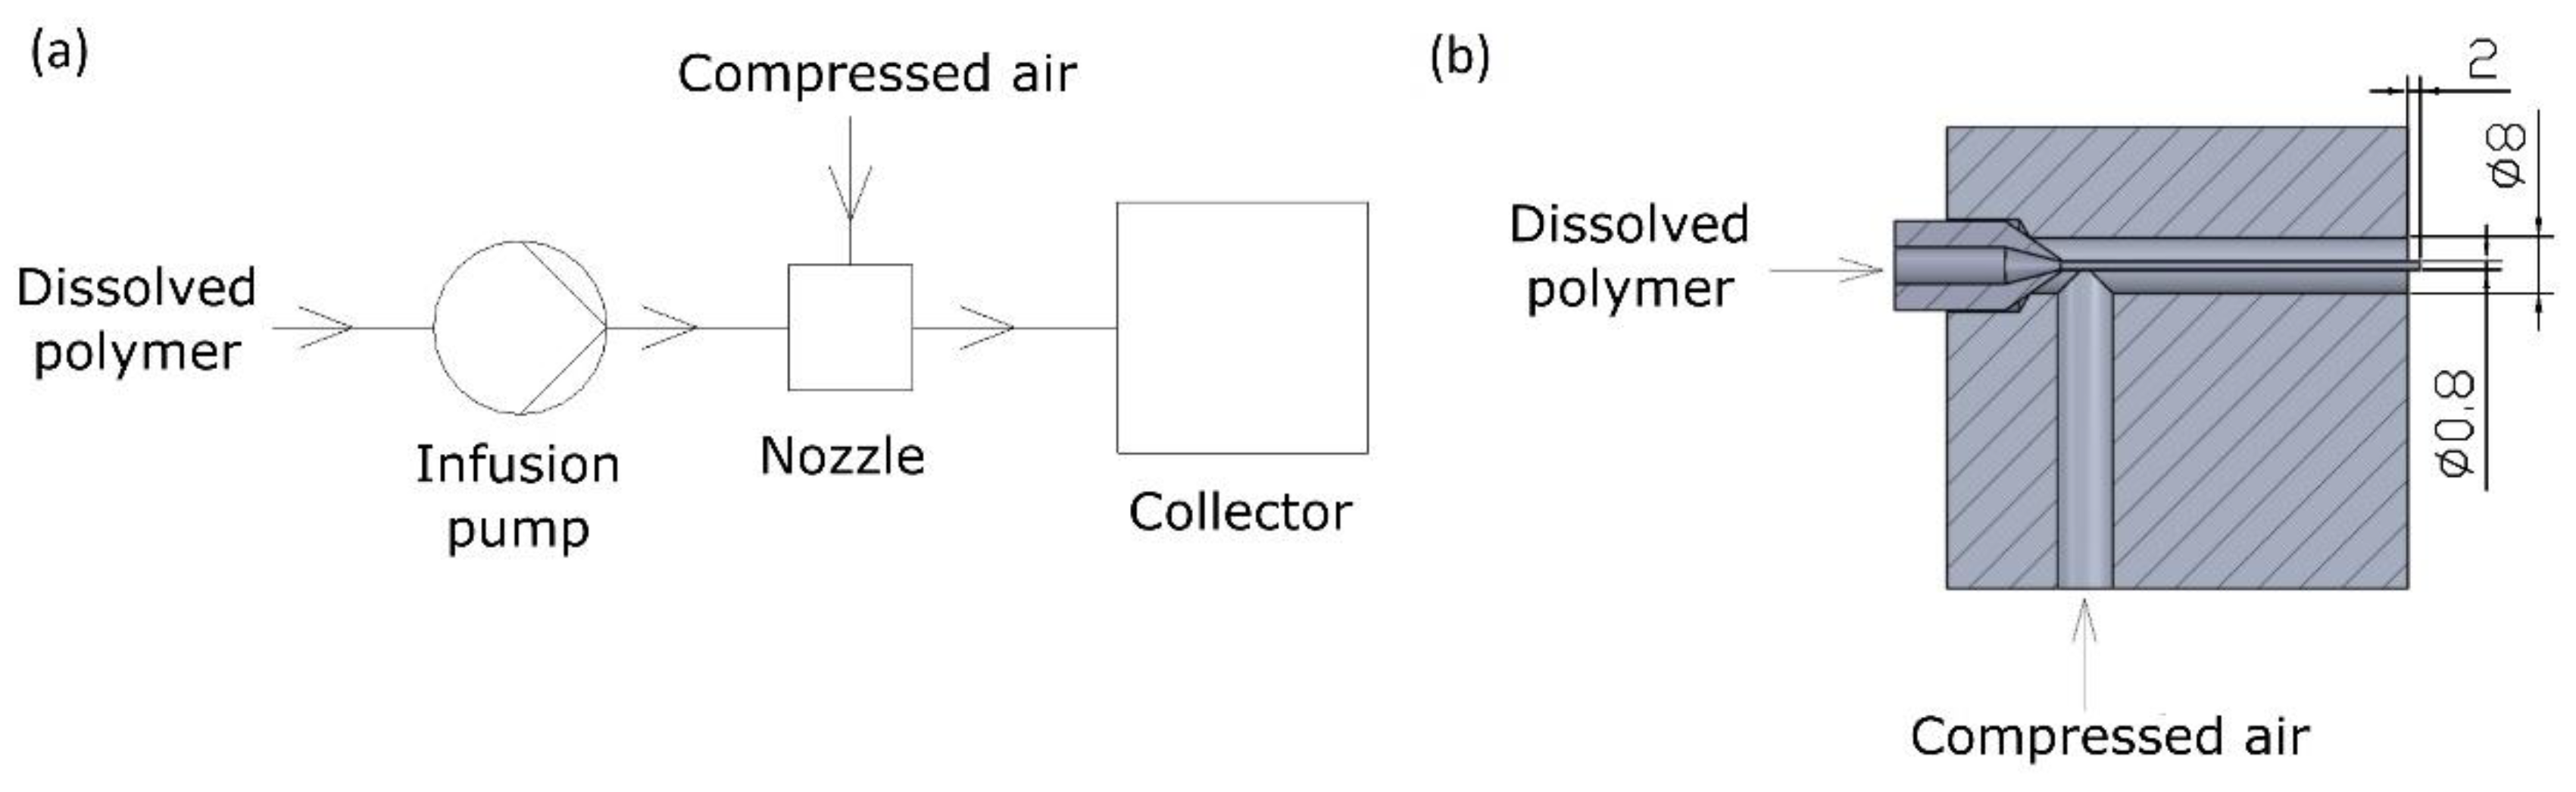
2.1.3. Solution Blow Spinning

The solution blow spinning setup consisted of four main parts: nozzle, infusion pump, collector, and source of the compressed air (Figure 2a). The dissolved polymer was pumped into the nozzle at a fixed rate, where a stream of high-velocity air surrounded it. Due to the solution’s contact with air, the fibers were formed primarily due to shear stresses. Elongation forces create the long filaments of solution. The solvent evaporates, and filament solidification occurs. The air stream carried fibers and dried them simultaneously. The dried fibers were gathered on the collector, where the coconut fibrous support mat was fixed. The mat was rotated on a scaffold that performs additional reciprocating moves to provide homogeneous nanofiber distribution on their surface.
The nozzle consisted of two concentric channels, as shown in Figure 2b. The polymer solution was pumped through the inner one via a syringe placed in the infusion pump, while the compressed air was released through the outer one. A compressed air stream accelerated the polymer solution at the end of the channel. As a result, a cone was formed from the collected solution. If air with sufficiently high pressure is used, solution streams are entrained at the tip of the cone, from which solidified fibers are formed when the solvent is evaporated.

2.2. Research Methodology

2.2.1. Preliminary Tests

In the first stage of the research, it was necessary to determine the process parameters (air pressure and flow rate of PLA solutions) at which fibers with the desired properties are formed. Owing to the analysis of data in the literature, it was possible to approximate the order of magnitude of the parameters at which the research should be conducted. Oliveira et al. [36] used PLA solutions with 4–8% concentrations, the solution flows ranging from 0.02 mL/min to 0.12 mL/min and pressures from 2 × 10⁵ Pa to 4 × 10⁵ Pa. The distance between the nozzle and the collector was set at 0.8 m. This distance provided a long time between the formation of the fibers and their collection on the collector, giving the solvent the longest possible time for evaporation.
To establish approximate process parameters, PLA concentrations of 3%, 4%, 6%, and 7% wt were chosen for preliminary tests. For every solution, the feeding rate varied from 0.05 mL/min to 5 mL/min. For the stated conditions, pressure in the range of 0.5 × 10⁵ Pa to 3 × 10⁵ Pa was applied in order to acquire an effective fiber formation. It was concluded that defibration was the most effective at the polymer feed of 0.1 mL/min to 0.5 mL/min with applied pressure of 0.5 × 10⁵ Pa to 1 × 10⁵ Pa. At higher pressures, the fiber formation was complex due to the high turbulence of the air at the point where the solution was dispensed, which made the spiral cone impossible. The Reynolds number for air flow at the end of the air channel was approximately 9500. If the flow rate was too low, the formation of a spherical cone did not occur, as the gas stream immediately entrained the polymer. On the other hand, at too high a flow rate, the gas stream could not take up the solution at a sufficient rate, leading to the deposition of the solution as drops at the point of dosing. It was observed that below a 3% concentration of PLA, fiber formation was difficult due to the low viscosity of the solution. In comparison, above 7%, the process was complicated due to the high viscosity of the solution, preventing the efficient formation of the spinning cone.
For the concentrations at which the fiber production process was the most stable and the fibers collected on the coconut support were visible to the naked eye (4% and 6% wt), detailed SEM analyses were carried out. For both polymer solutions, combinations of polymer feed and pressure were tested as presented in Table 1. During the testing of each set, 5 mL of a PLA solution was fed to the nozzle. The collected fibers were examined under a scanning electron microscope (SEM, Hitachi TM-1000, Hitachi, Tokyo, Japan) to determine their morphology. Fiber samples were coated with gold using sputter K550X EMITECH (Quorum, East Sussex, UK) before the SEM analysis. Fiber diameter distribution was determined based on SEM photos, each considering approximately fifty fibers from different parts of the samples. The ImageJ analysis program was used to measure the fiber diameters and the surface area of fibers and undefibrated polymer. The proportion of undefibrated polymer surface area to fiber surface area was calculated. Results are presented in Table 1.
The overall quality of the produced materials was assessed by comparing all factors listed in Table 1, i.e., mean fiber diameter, standard deviation, and proportion of undefibrated PLA surface area to fiber area. The low value of the last-mentioned parameter means that the sample consists mostly of fibers. On the contrary, a high value in this factor proves that defibration was ineffective and many different structures, e.g., bubbles, droplets, are visible in a sample. Every process parameter (flow of the solution, concentration, pressure) had a significant effect on the final morphology of the materials. Exemplary photos of poor, good, and very good-quality PLA materials are shown in Figure 3.

2.2.2. Proper Measurements

As a consequence of the preliminary stage, a set of process parameters and solution concentrations was obtained, for which, in the next stage, high-quality non-woven material was produced. To sum up, two solution concentrations were tested: 4 and 6% wt. For every solution, three samples were examined. The pressure of air and solution flow rate was fixed during an experiment at the level of 1 × 10⁵ Pa and 0.4 mL/min, respectively. The working distance was set to 0.8 m.
The dependence of the fractional filtration efficiency of new material on the amount of defibrated polymer was investigated. Initially, the coconut mat’s filtration efficiency and pressure drop were tested. The solution was applied on the mat surface in portions of 5 mL until 45 mL. After each portion, pressure drop and fractional filtration efficiency were measured for three samples, and the results were presented as mean values.
Three samples of each filtering media were taken to characterize the PLA fiber size distribution. The coconut mat was also characterized: pressure drop, fractional efficiency, and mass were determined.
To check the influence of the electrostatic mechanism on the filtration efficiency of the produced fibrous mats, some samples were placed into a desiccator with isopropanol for twelve hours for charge neutralization. After this time, the filtration efficiency of samples with and without charge neutralization was tested.

2.3. Nanoparticles Filtration

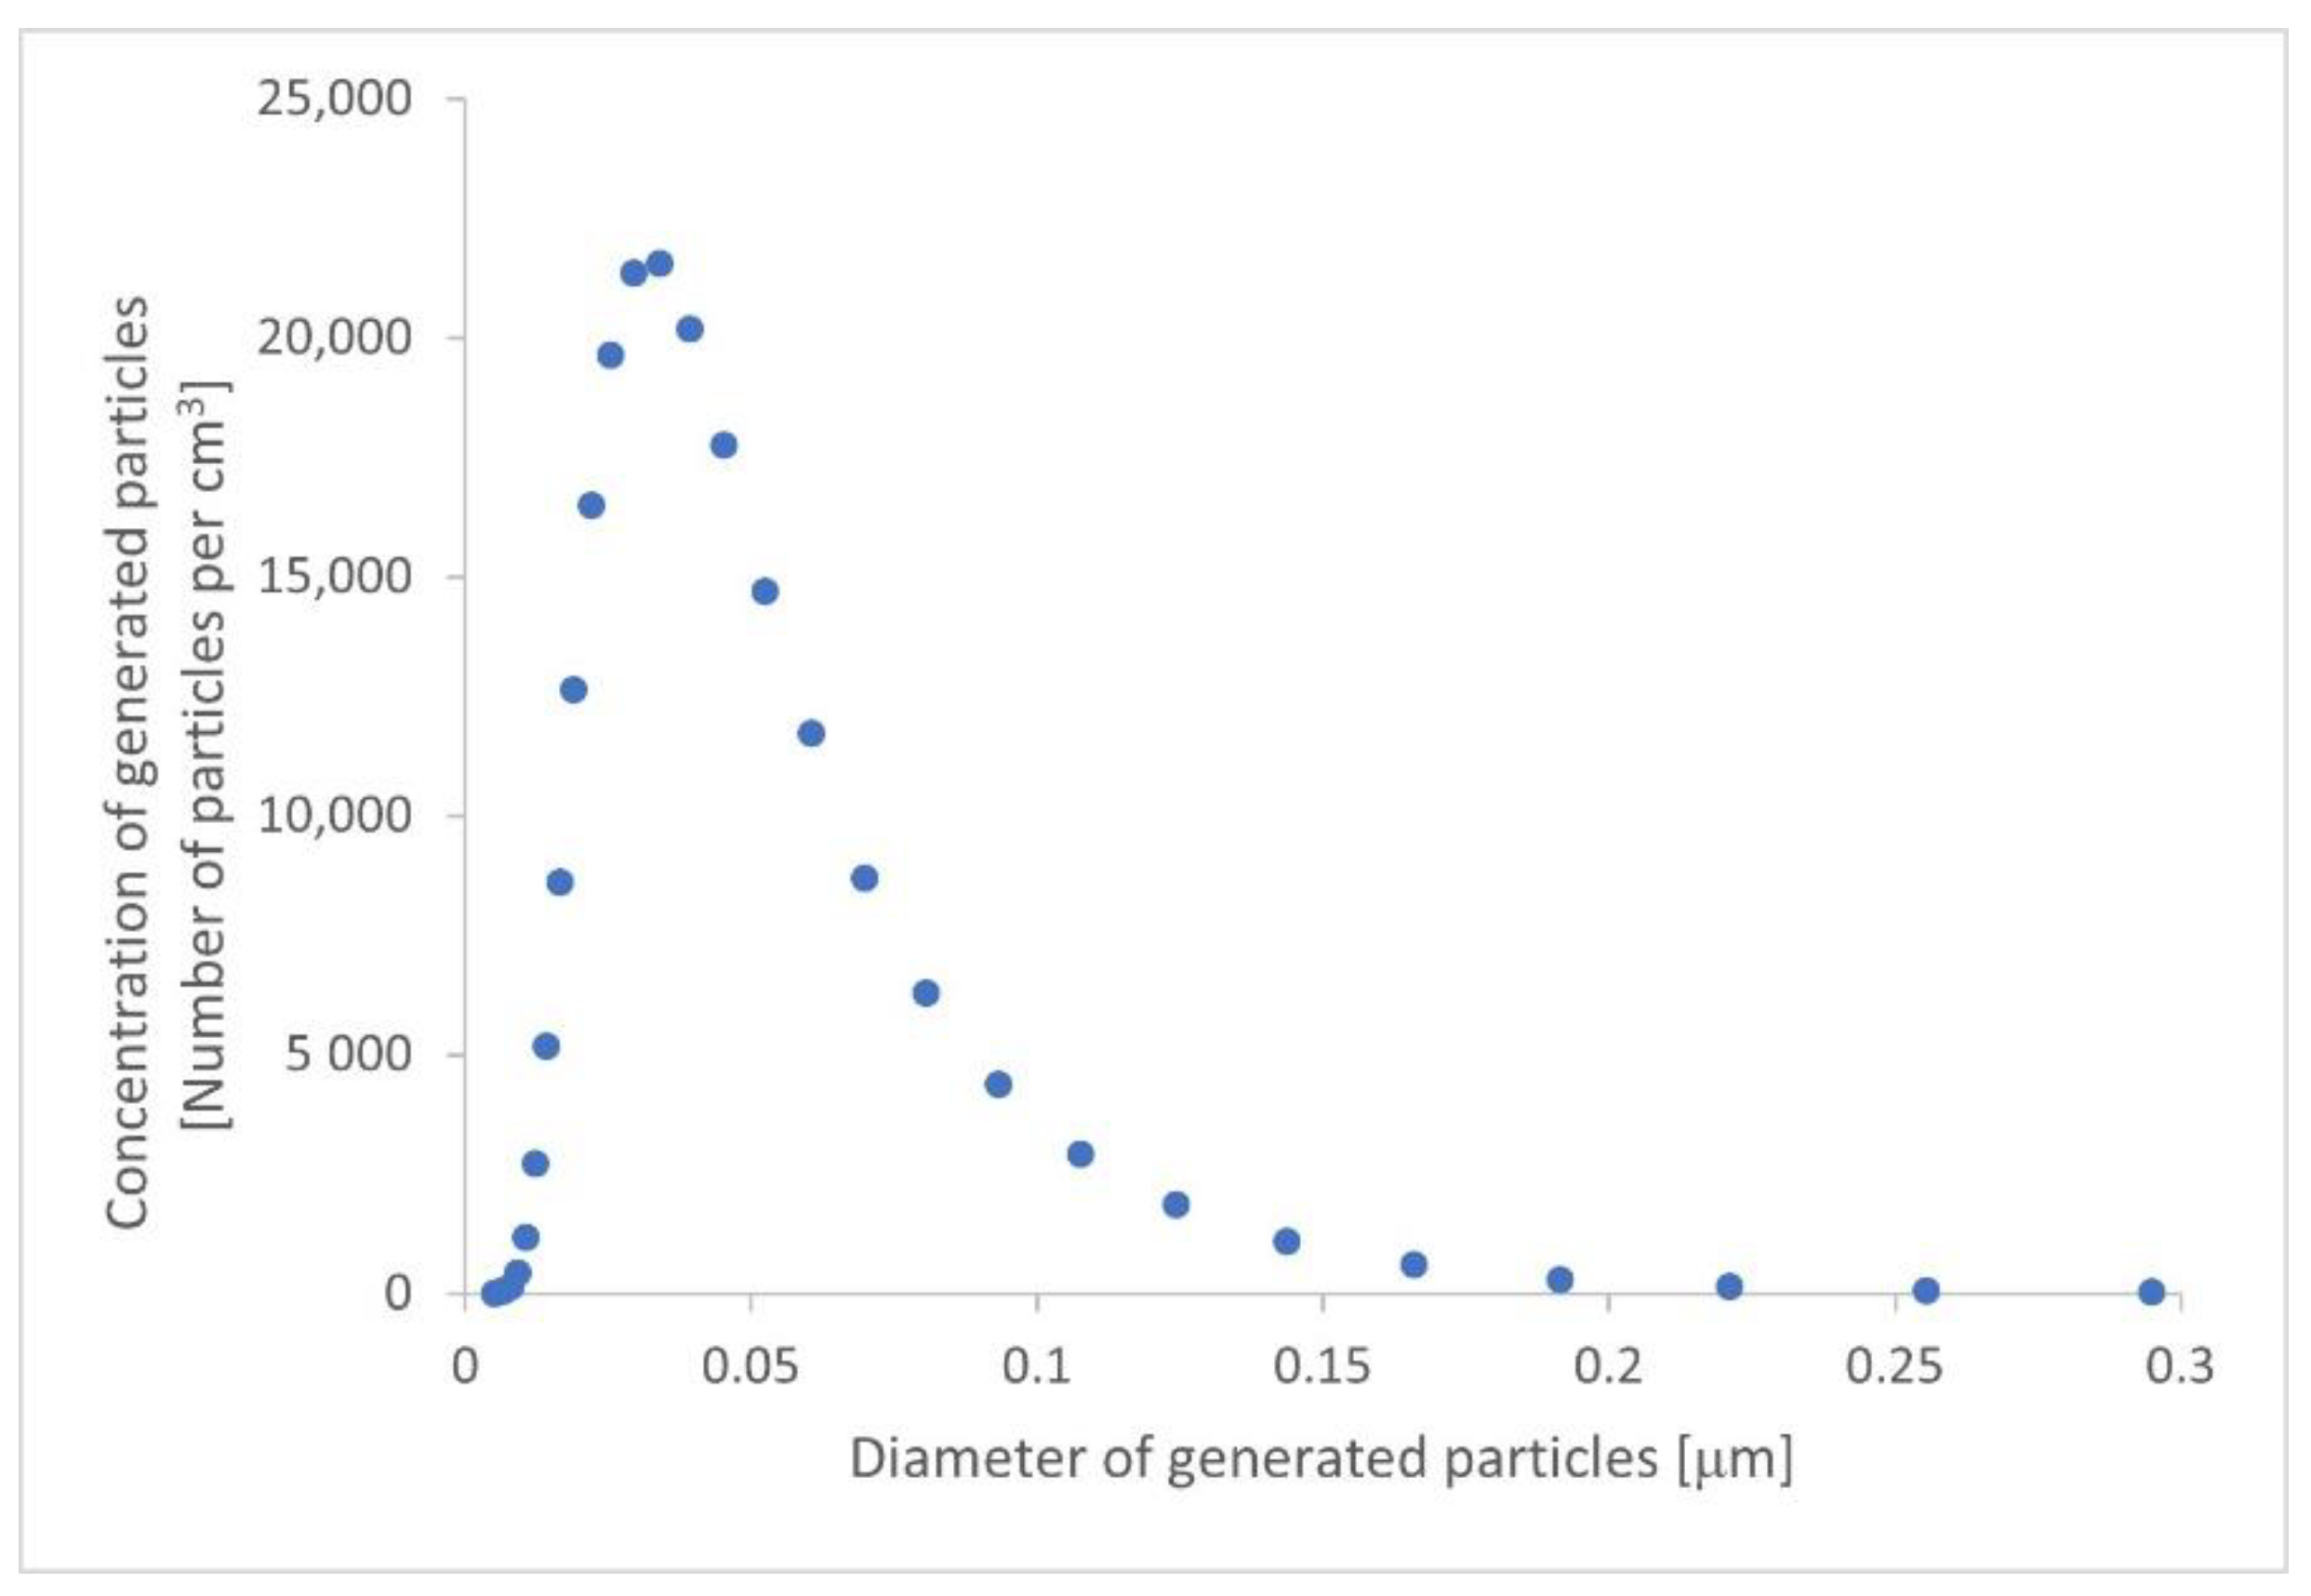
2.3.1. Potassium Chloride Nanoparticles

Solid particles of potassium chloride were used to study the fractional efficiency of the new non-woven structures. They were generated from a solution of potassium chloride (KCl) (pure p.a, Sigma Aldrich) in deionized water at a concentration of 0.1 gKCl/100 mL of water. The concentration of KCl particles is shown in Figure 4. The apparatus was set to generate particles with maximum concentration at the range of 0.02 µm–0.04 µm. Due to the insufficient concentration, particles above 0.2 µm were not considered.

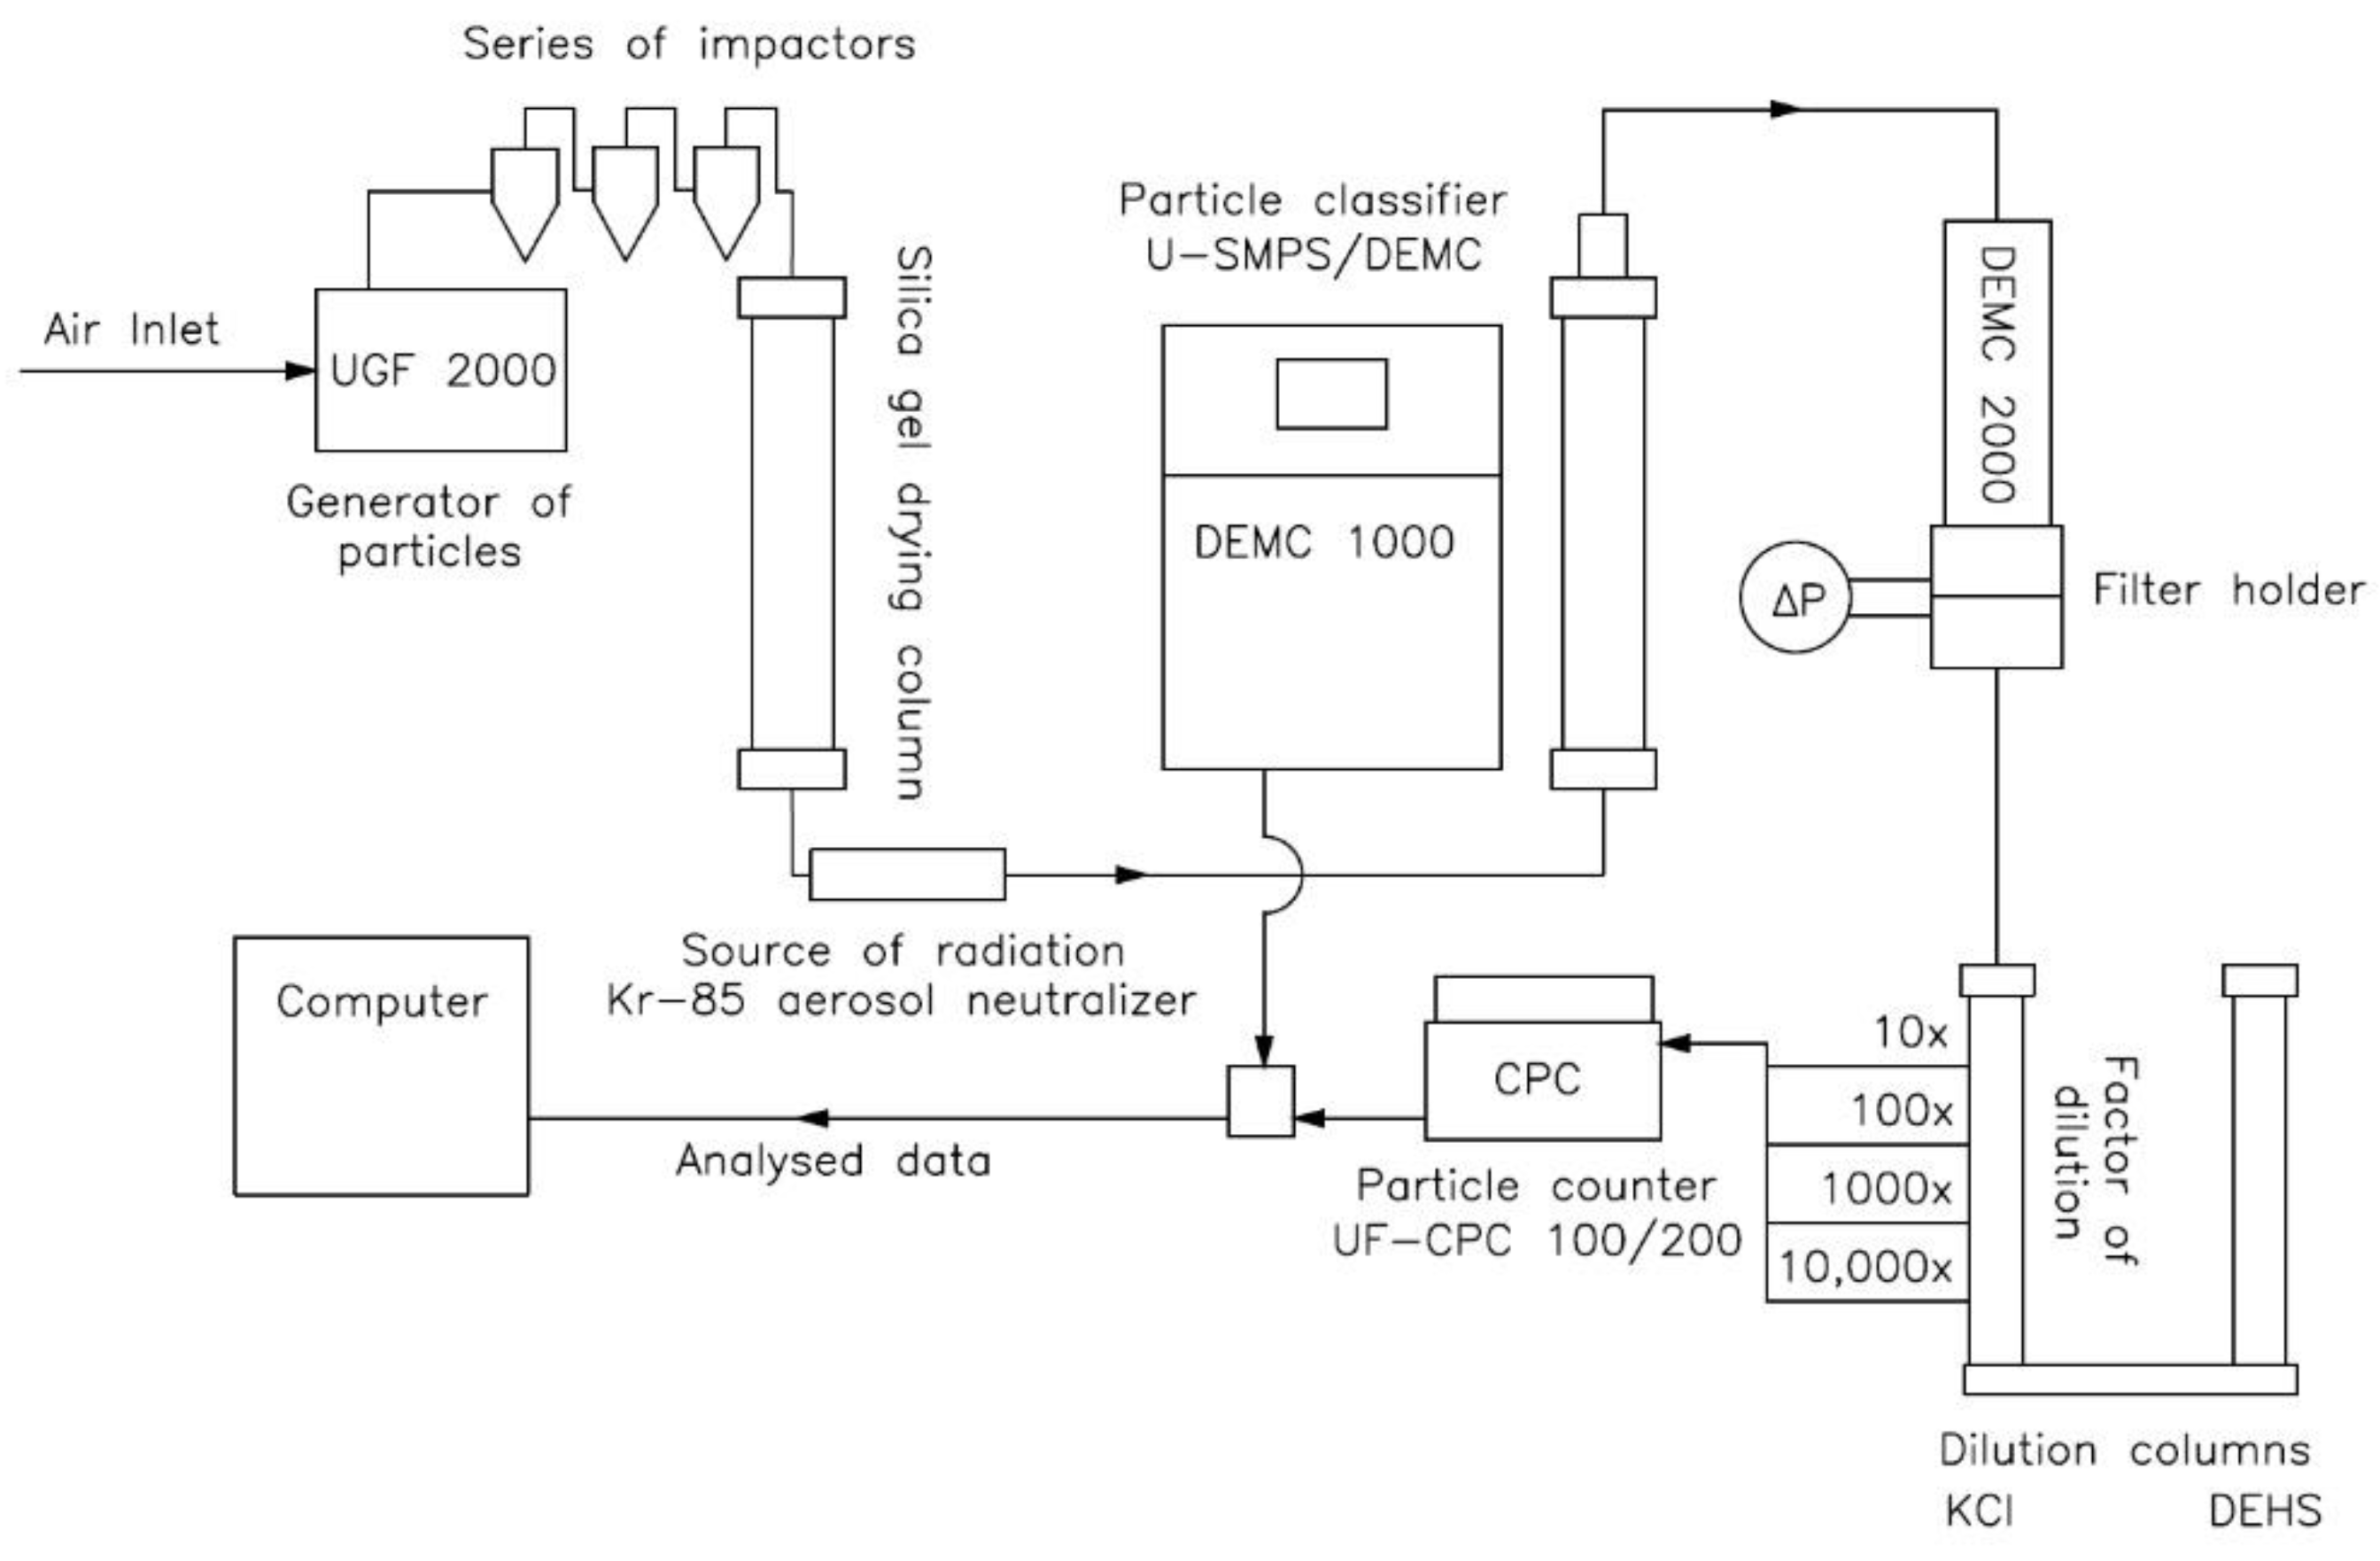
2.3.2. Test Bench for Testing Flat Filtration Materials

The PALAS MFP Nano Plus test bench was used to perform the filtration tests on the PLA material. The scheme of the test stand is shown in Figure 5. It measures the pressure drop and the fractional efficiency of the filter material, calculated as:
η = ( N u p s t r e a m ,   i   N d o w n s t r e a m ,   i N u p s t r e a m ,   i )
where: Nupstream,i and Ndownstream,i denote the number of particles of a particular fraction counted at upstream and downstream of the tested filter, respectively.
Compressed air was supplied to the test bench, and its pressure was adjusted with a reducer. Then, the air was fed to the UGF 2000 nanoparticle generator. It produced particles from a solution of a specific composition. Particles with too great a diameter were separated from the aerosol using an in-line cyclone. Then, the aerosol was directed to a set of three impactors arranged in series to separate the remaining particles of undesirable diameter. The next step was to neutralize electrostatic charges with the Kr-85 neutralizer. The neutralized aerosol was fed to the differential mobility particle counter (DEMC) classifying column, where the particle diameter was determined through the electric mobility test, connected to the universal scanning mobility particle sizer (U-SMPS) unit. Due to the application of an electric voltage with a varying value, particles of a certain diameter were released from the column and then directed to the pneumatic holder with the tested filter material. The produced aerosol had a face velocity of 0.1 m/s. The particles were counted with a universal fluid condensation particle counter (UF-CPC). The MFP Nano Plus stand enables the efficiency measurement for the particles most penetrating the filtration structure, having the so-called most penetrating particle size (MPPS). The stand was connected to a computer that allowed data recording and analysis.
Each filter sample was tested three times, and the mean value of these three measurements was taken. A single measurement lasted 380 s and the break 60 s.

3. Results and Discussion

3.1. Properties of the Coconut Fiber Support Layer

The average values of the filtration efficiency, pressure drop, and mass of the coconut fiber mat samples used as PLA support layer were 5.24 ± 1.30%, 1.52 ± 1.66 Pa, and 24.67 ± 3.70 g, respectively. As emphasized earlier, the backing layer should have the lowest possible pressure drop and filtration efficiency in the case of nanoparticles and high filtration efficiency for microparticles to function as a prefilter for PLA nanofibers, and the data below confirm that this was achieved. Moreover, it was observed that the formed PLA filaments are effectively and permanently deposited on the surface of the coconut mats.

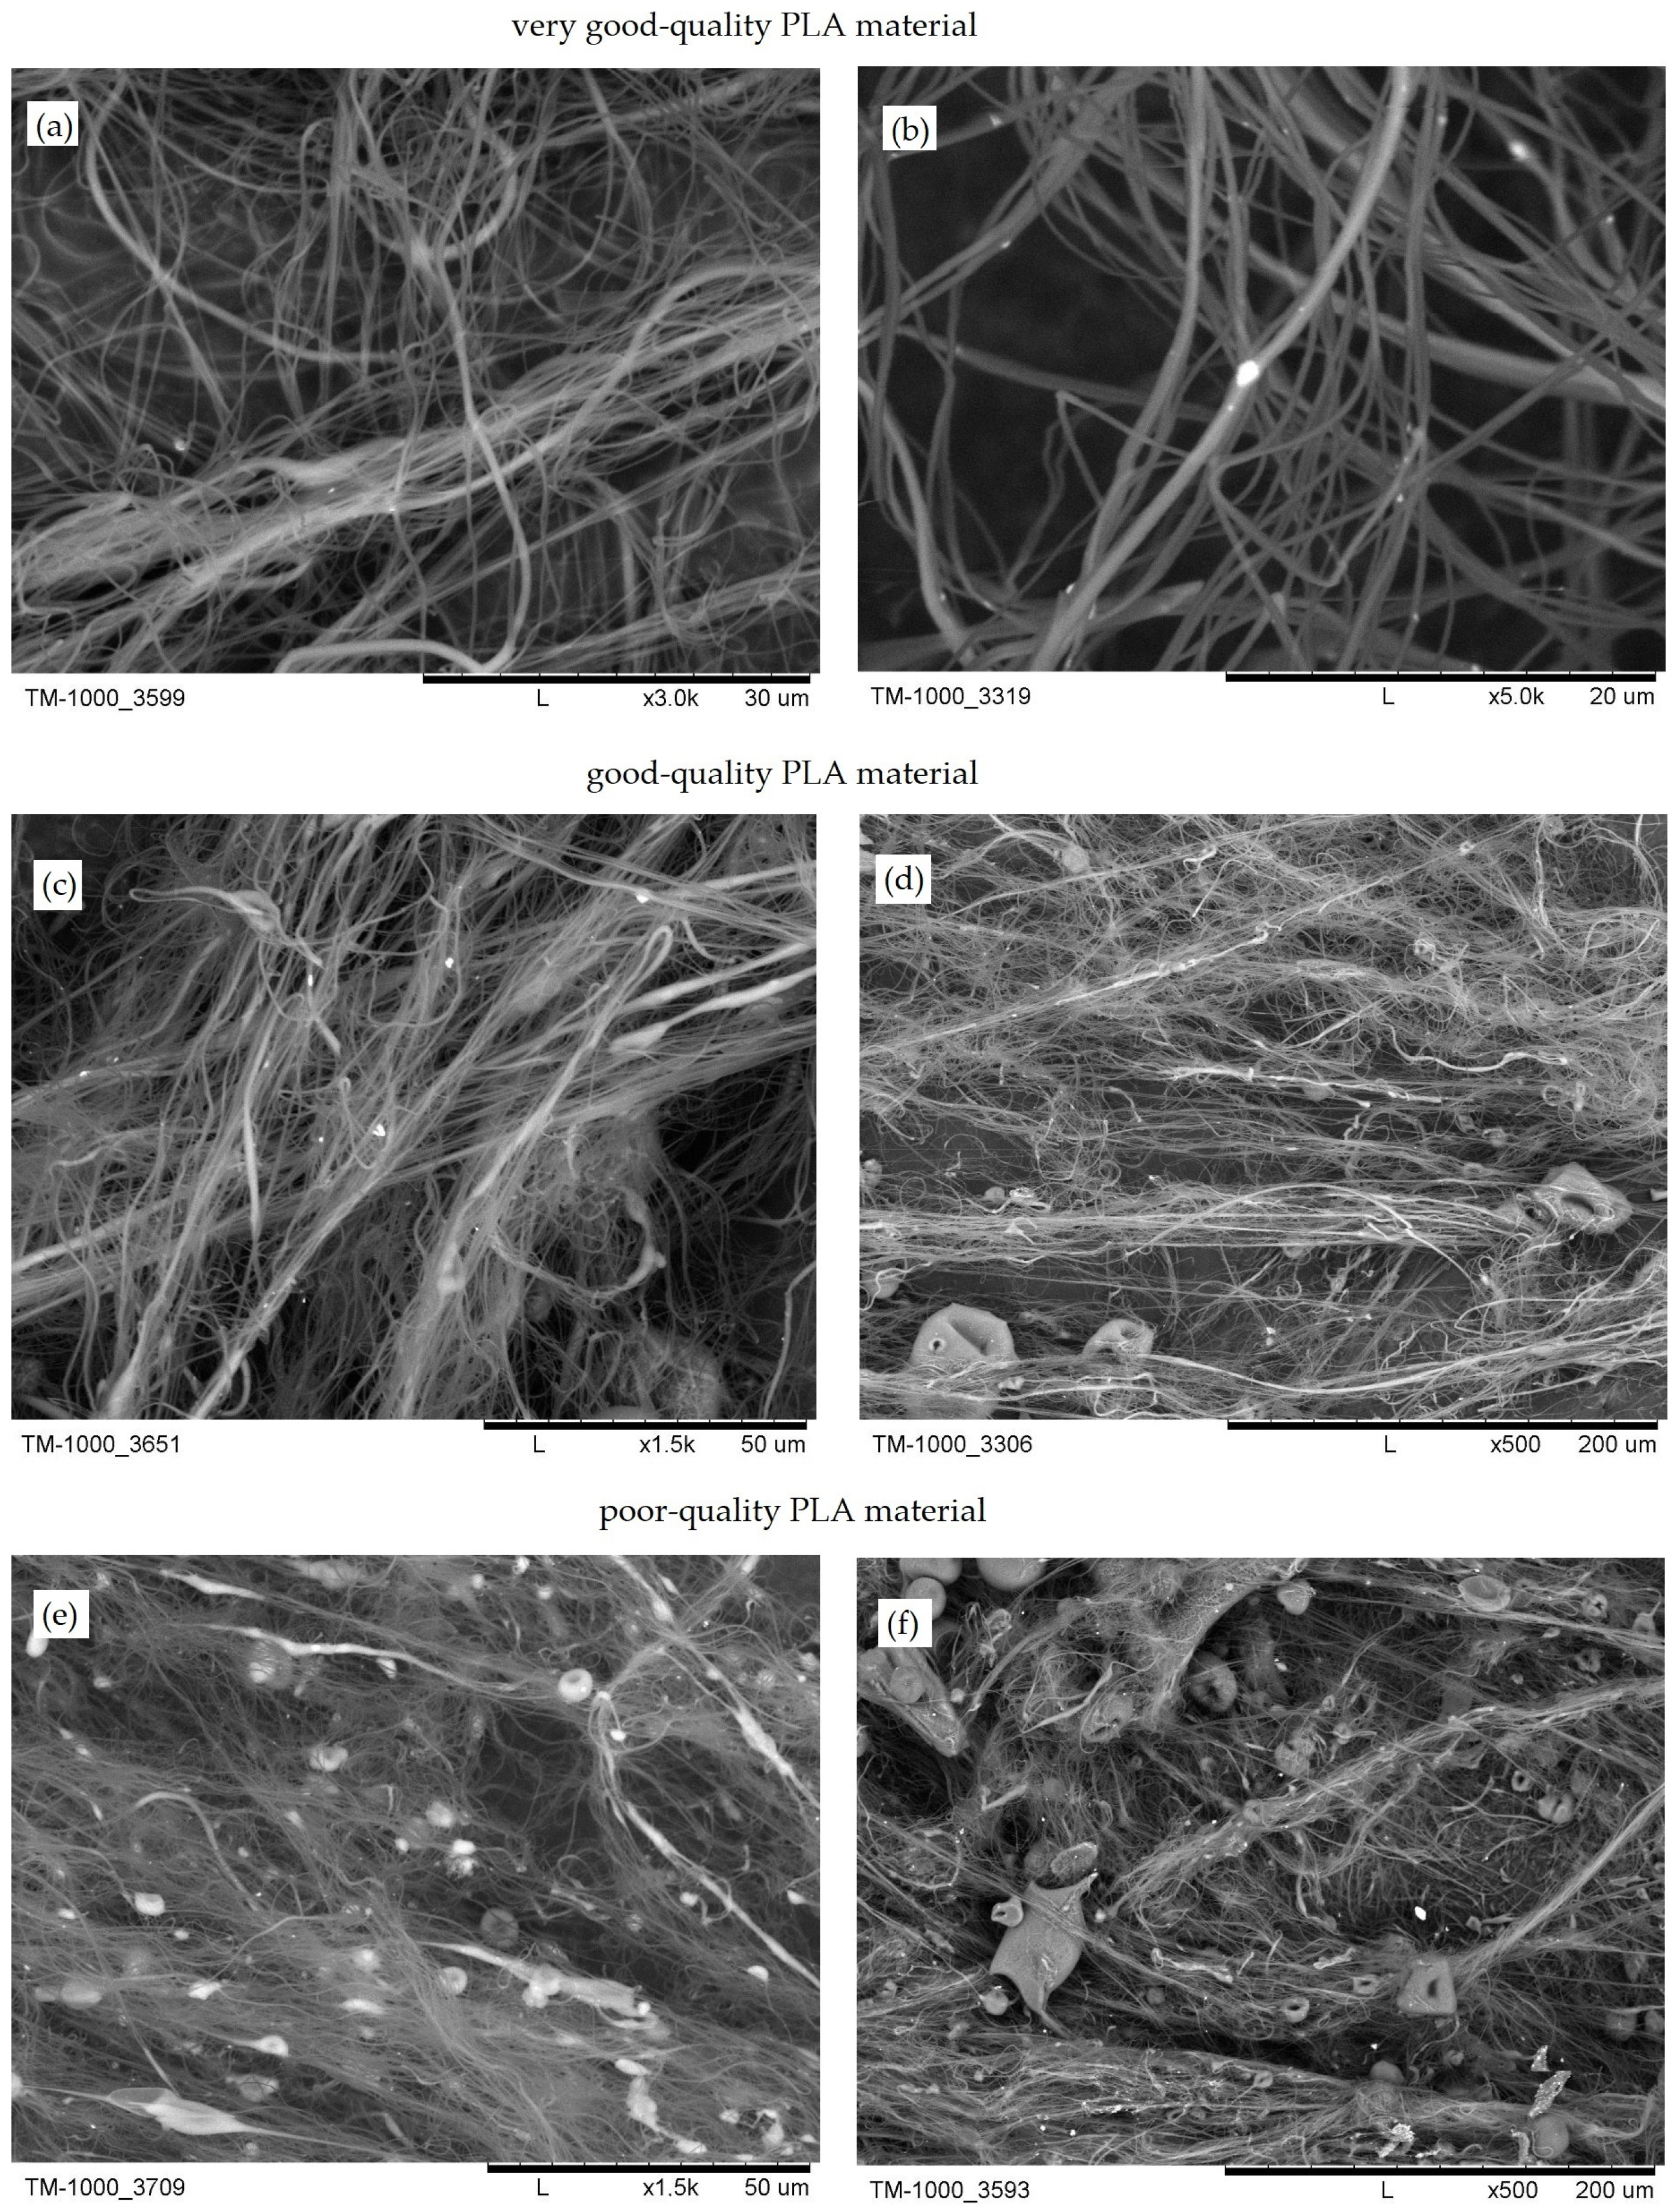
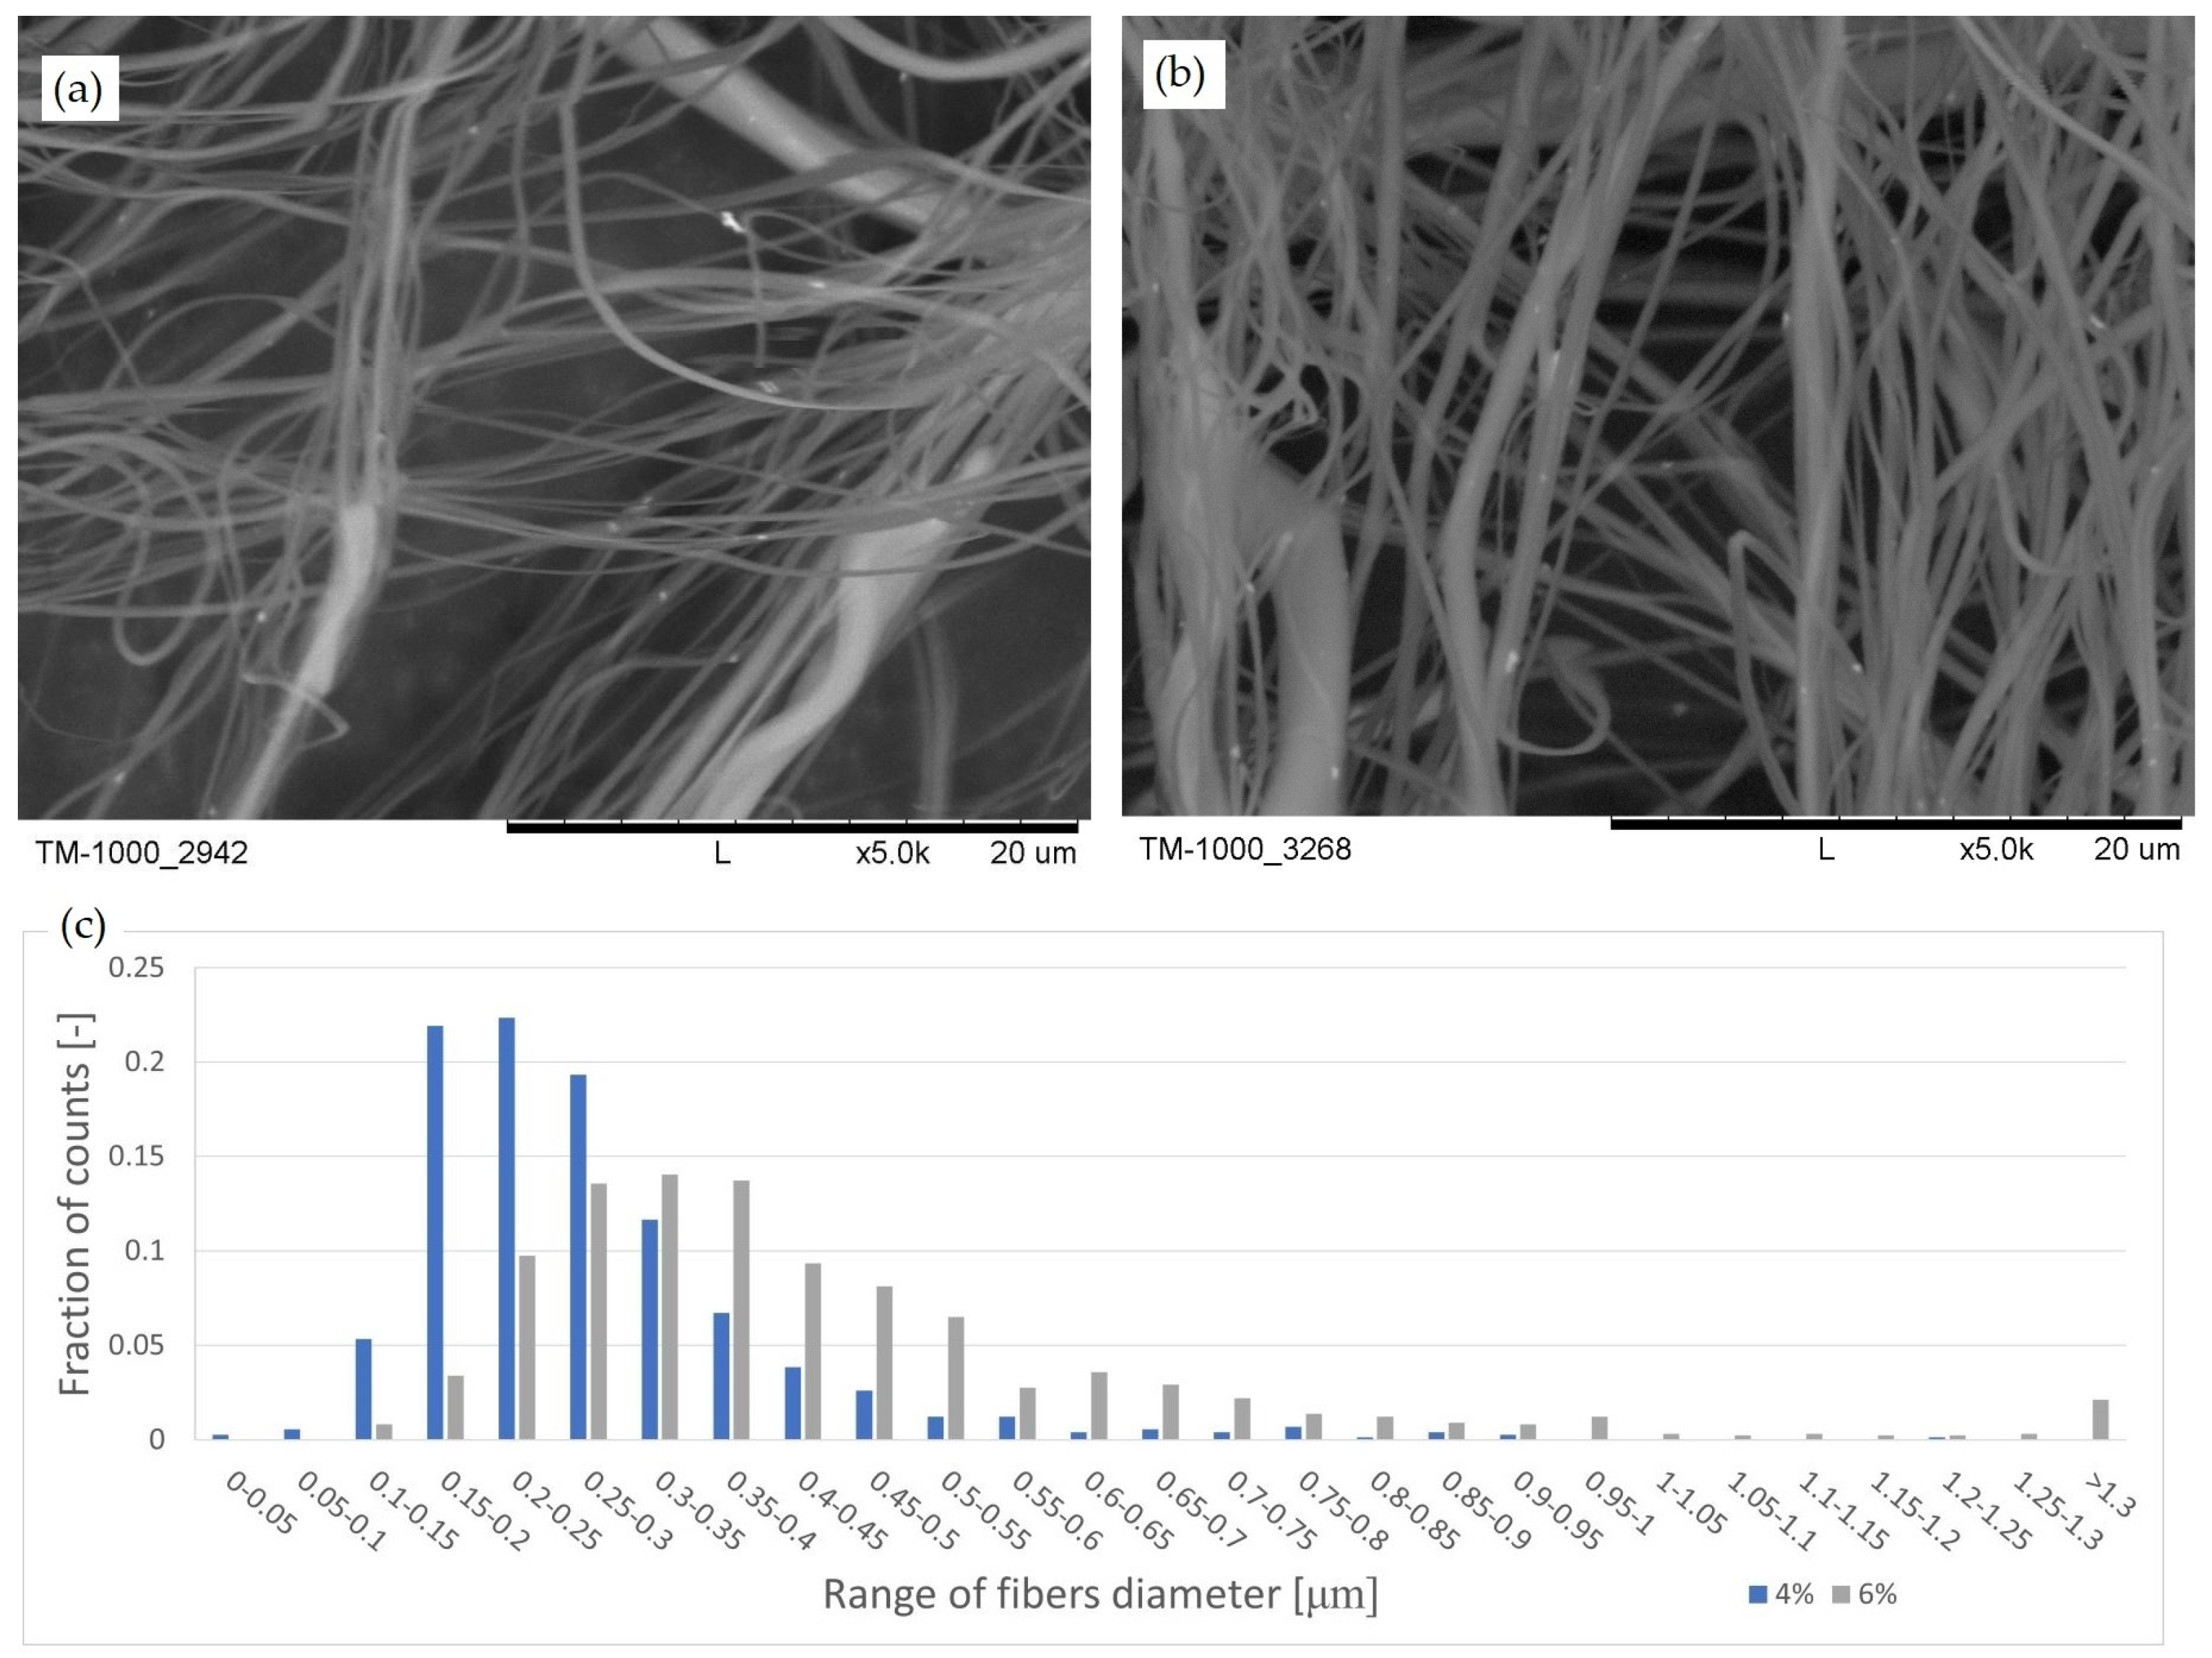
3.2. Influence of the Solution Concentration on the Obtained PLA Fibers’ Diameters

A series of SEM photos were taken of the structures produced by the SBS method (examples are shown in Figure 6a,b). Their analysis allowed us to determine the PLA fibers’ diameter distributions (see Figure 6c) obtained for two concentrations of the solution used for blowing while maintaining the other process parameters.
For the concentration of 4%, the most considerable portion is represented by fibers with diameters in the range of 0.15–0.4 μm, which is 82% of the total number of fibers. For the concentration of 6%, the highest number of fibers was observed in the diameter range of 0.2–0.55 μm, which is 75% of all fibers. Fibers of a minor diameter were observed for a solution concentration of 4%. For two analyzed concentrations, the number of fibers with diameters below 0.1 μm is negligible. Moreover, fibers with diameters above approximately 0.8 μm are rarely observed.
Table 2 shows the minimum, maximum, and average PLA fiber diameters. The mean fiber diameter increases as the solution concentration increases, so does the standard deviation.

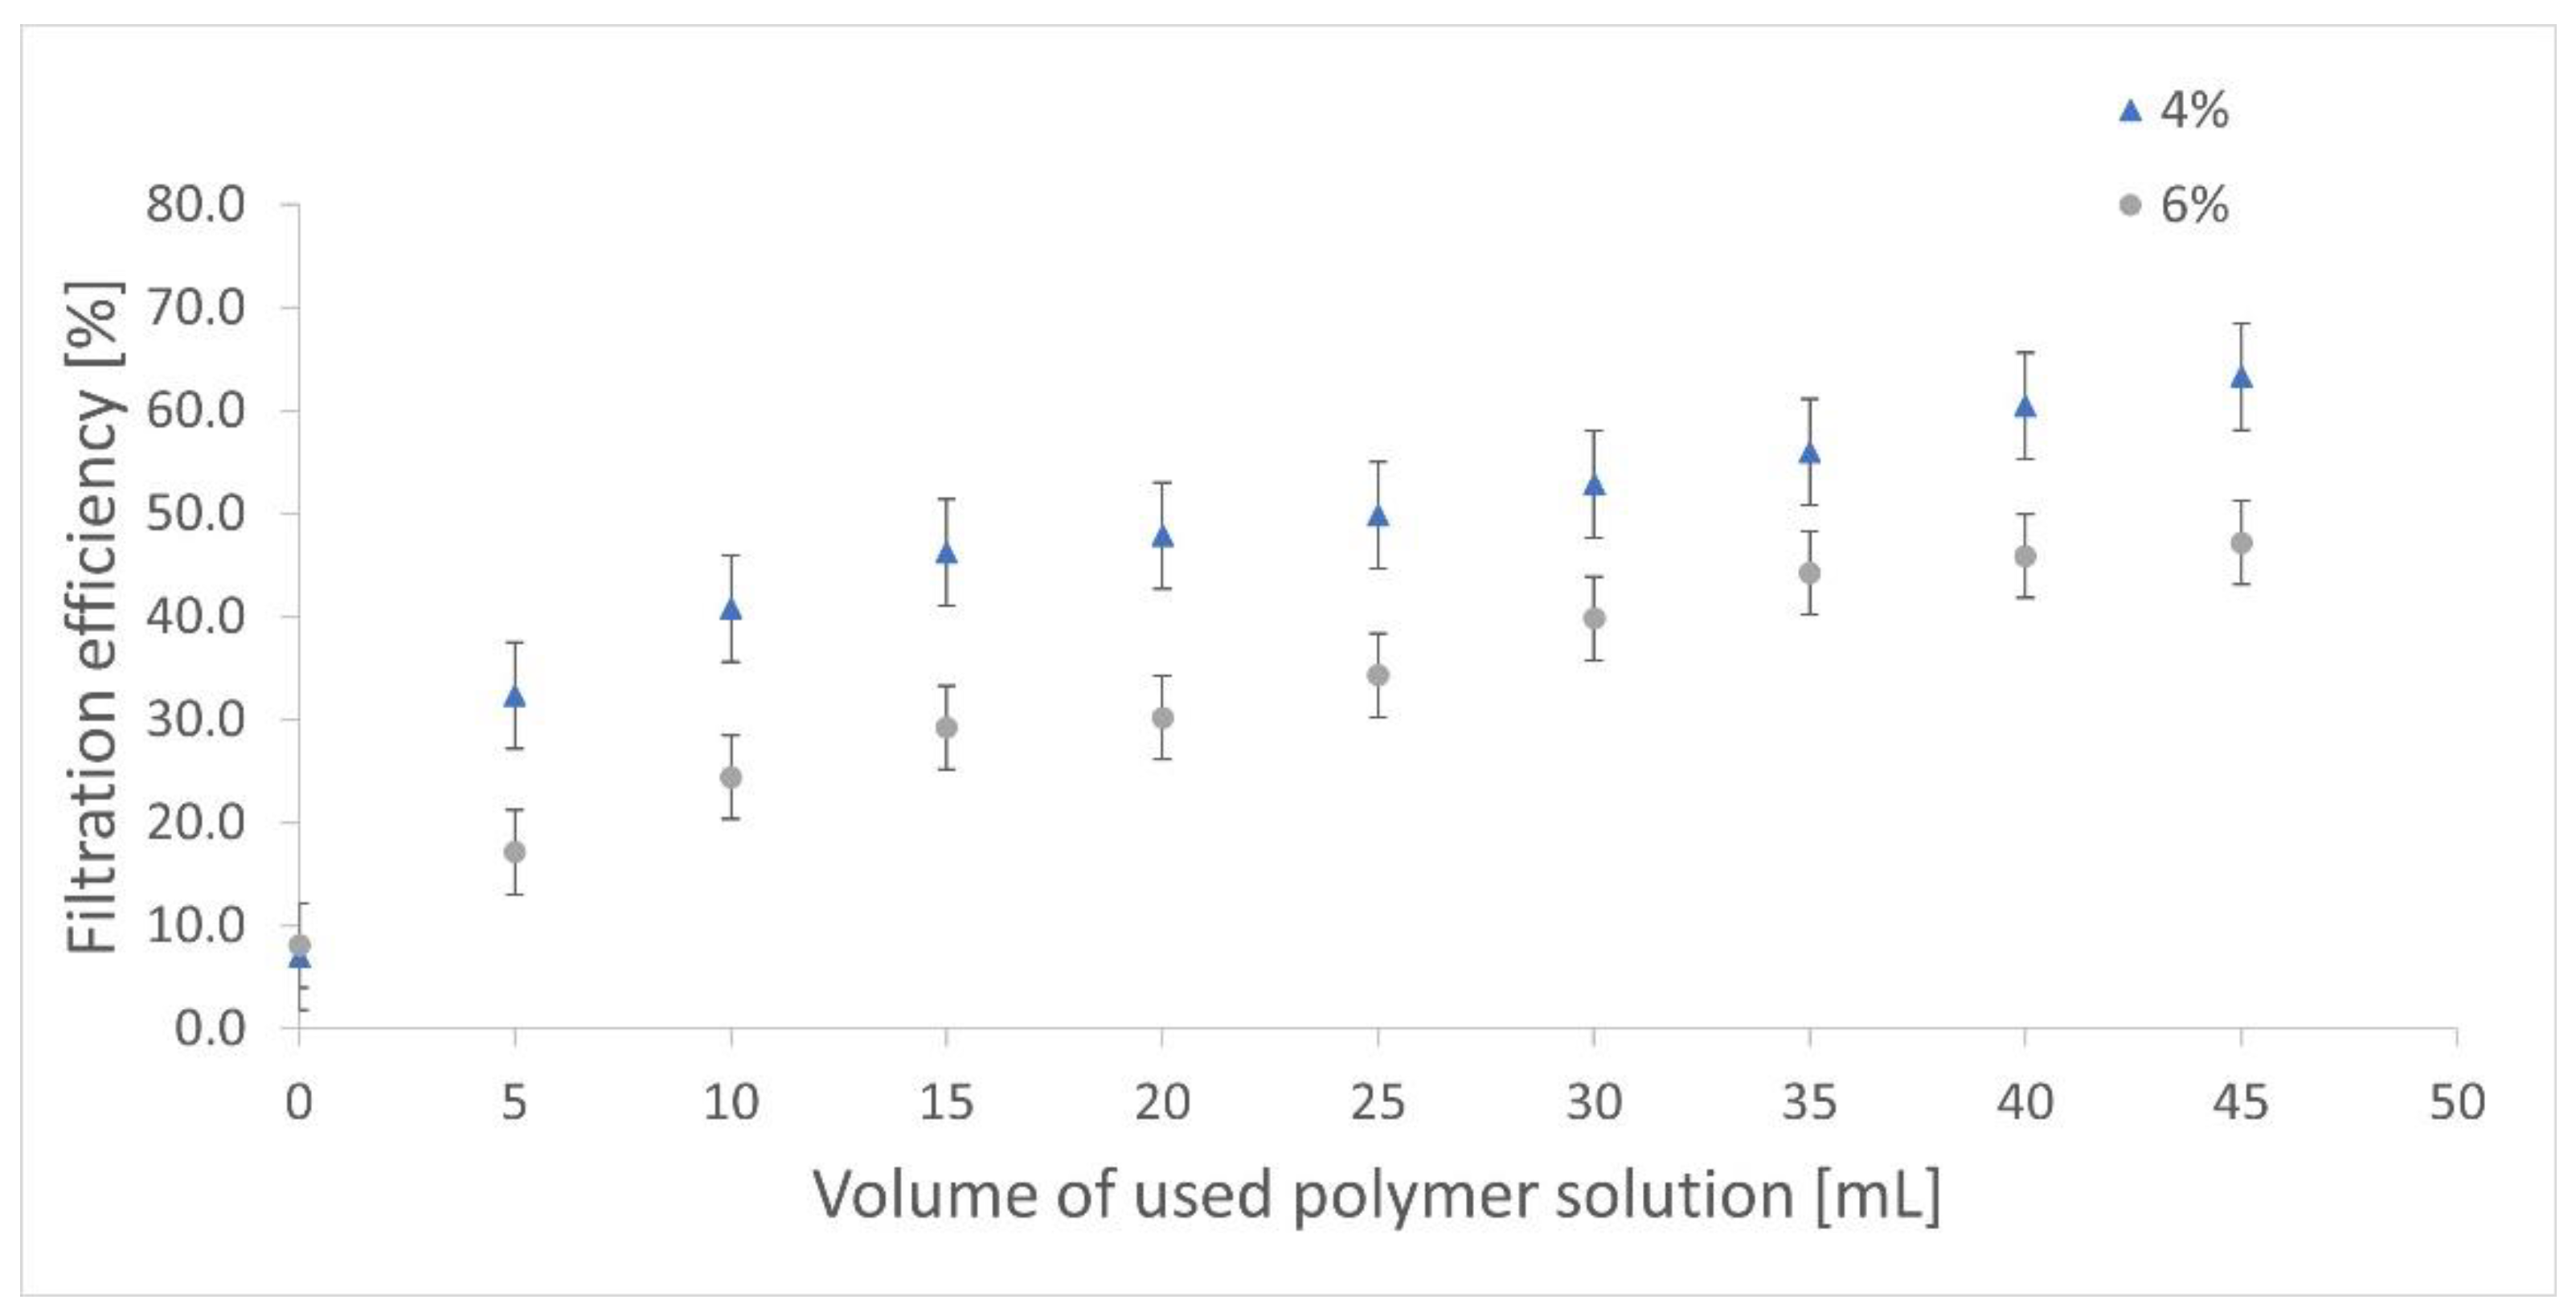
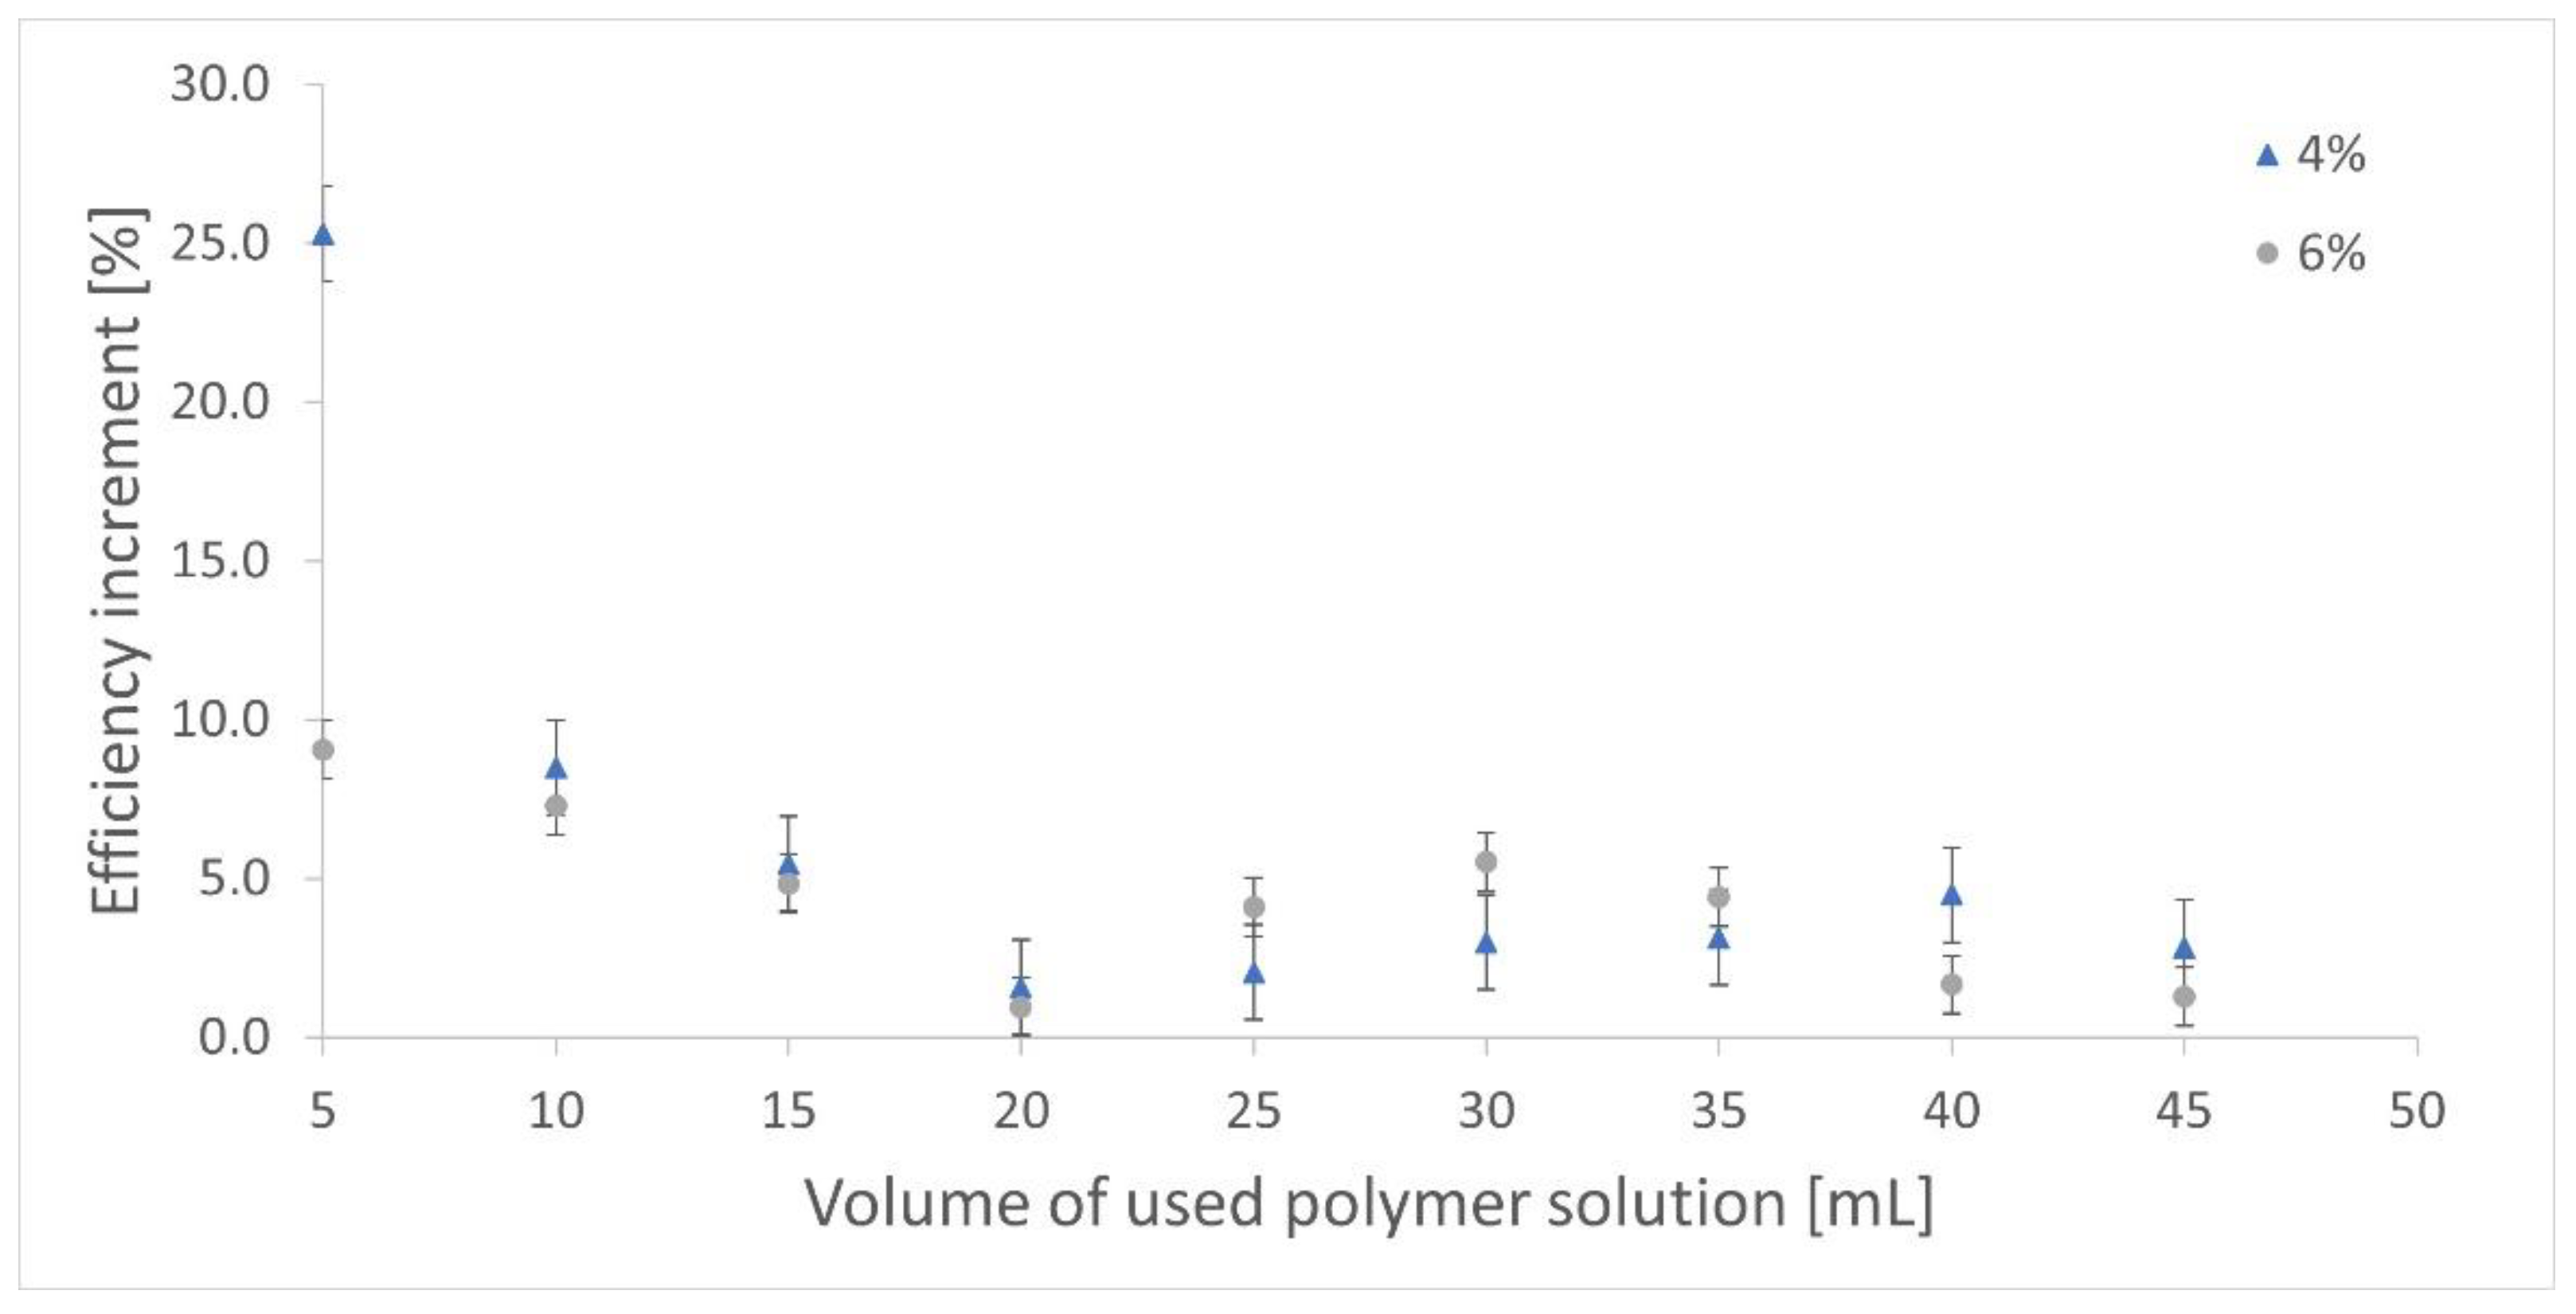
3.3. Influence of the Solution Concentration on the Filter Performance

The two main parameters that characterize filter behavior are pressure drop and filtration efficiency. Both were determined for produced non-woven structures.

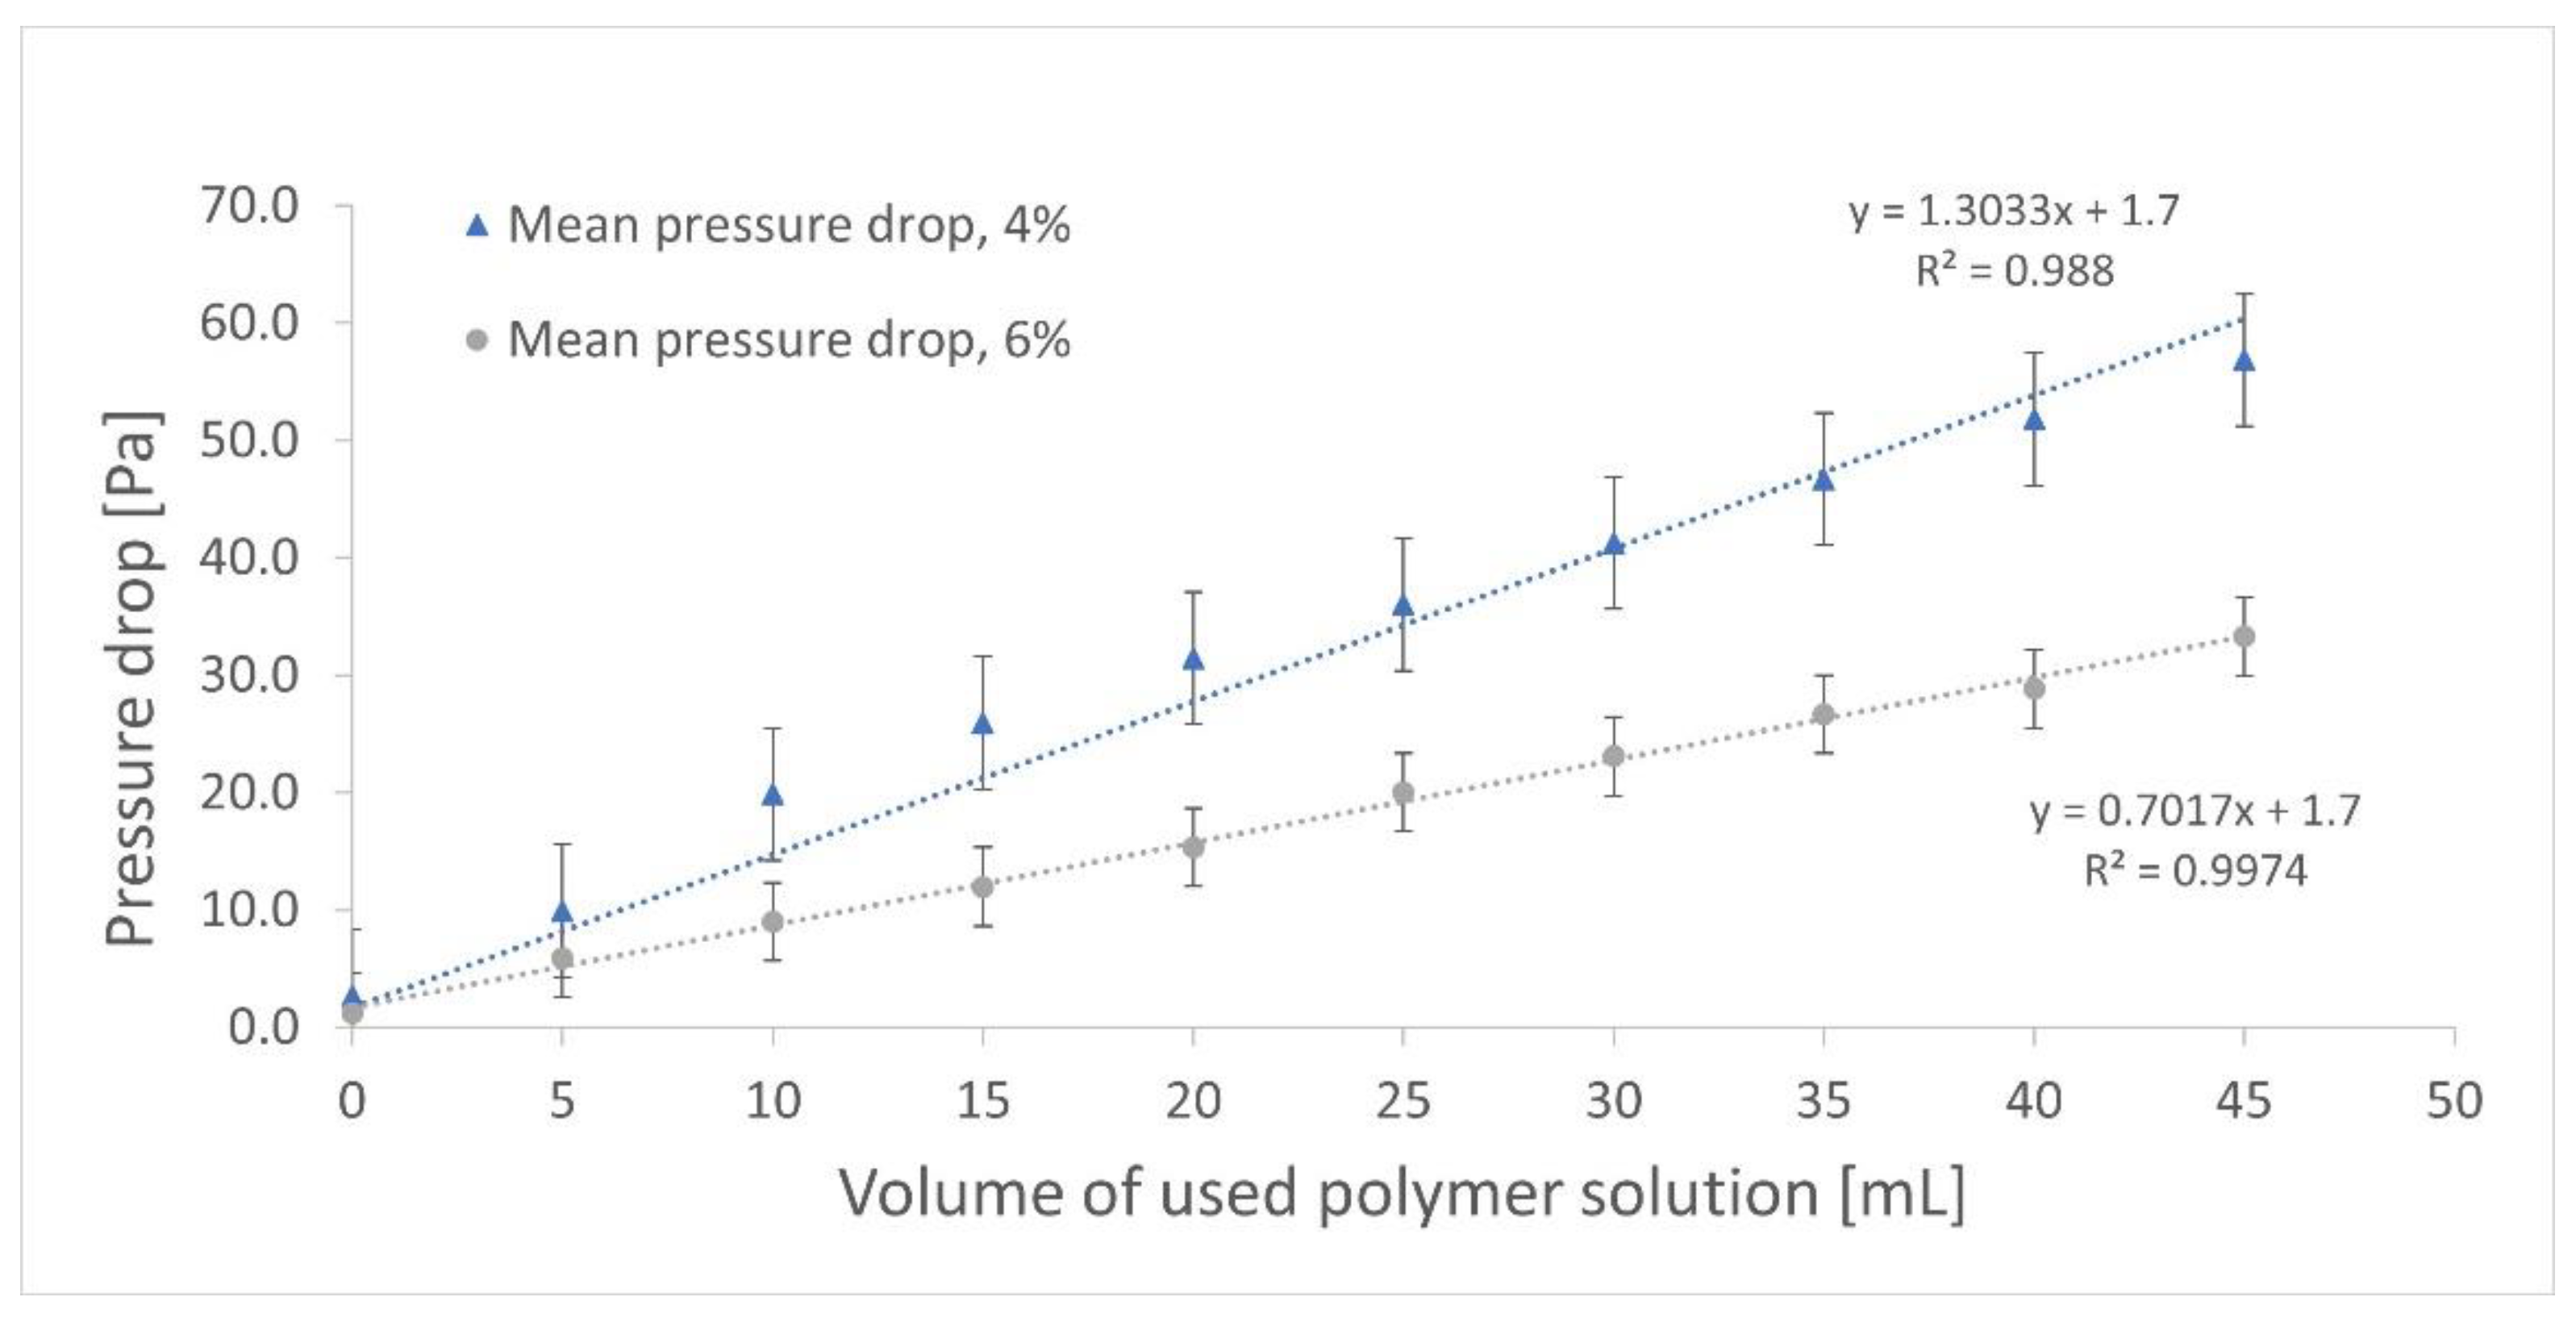
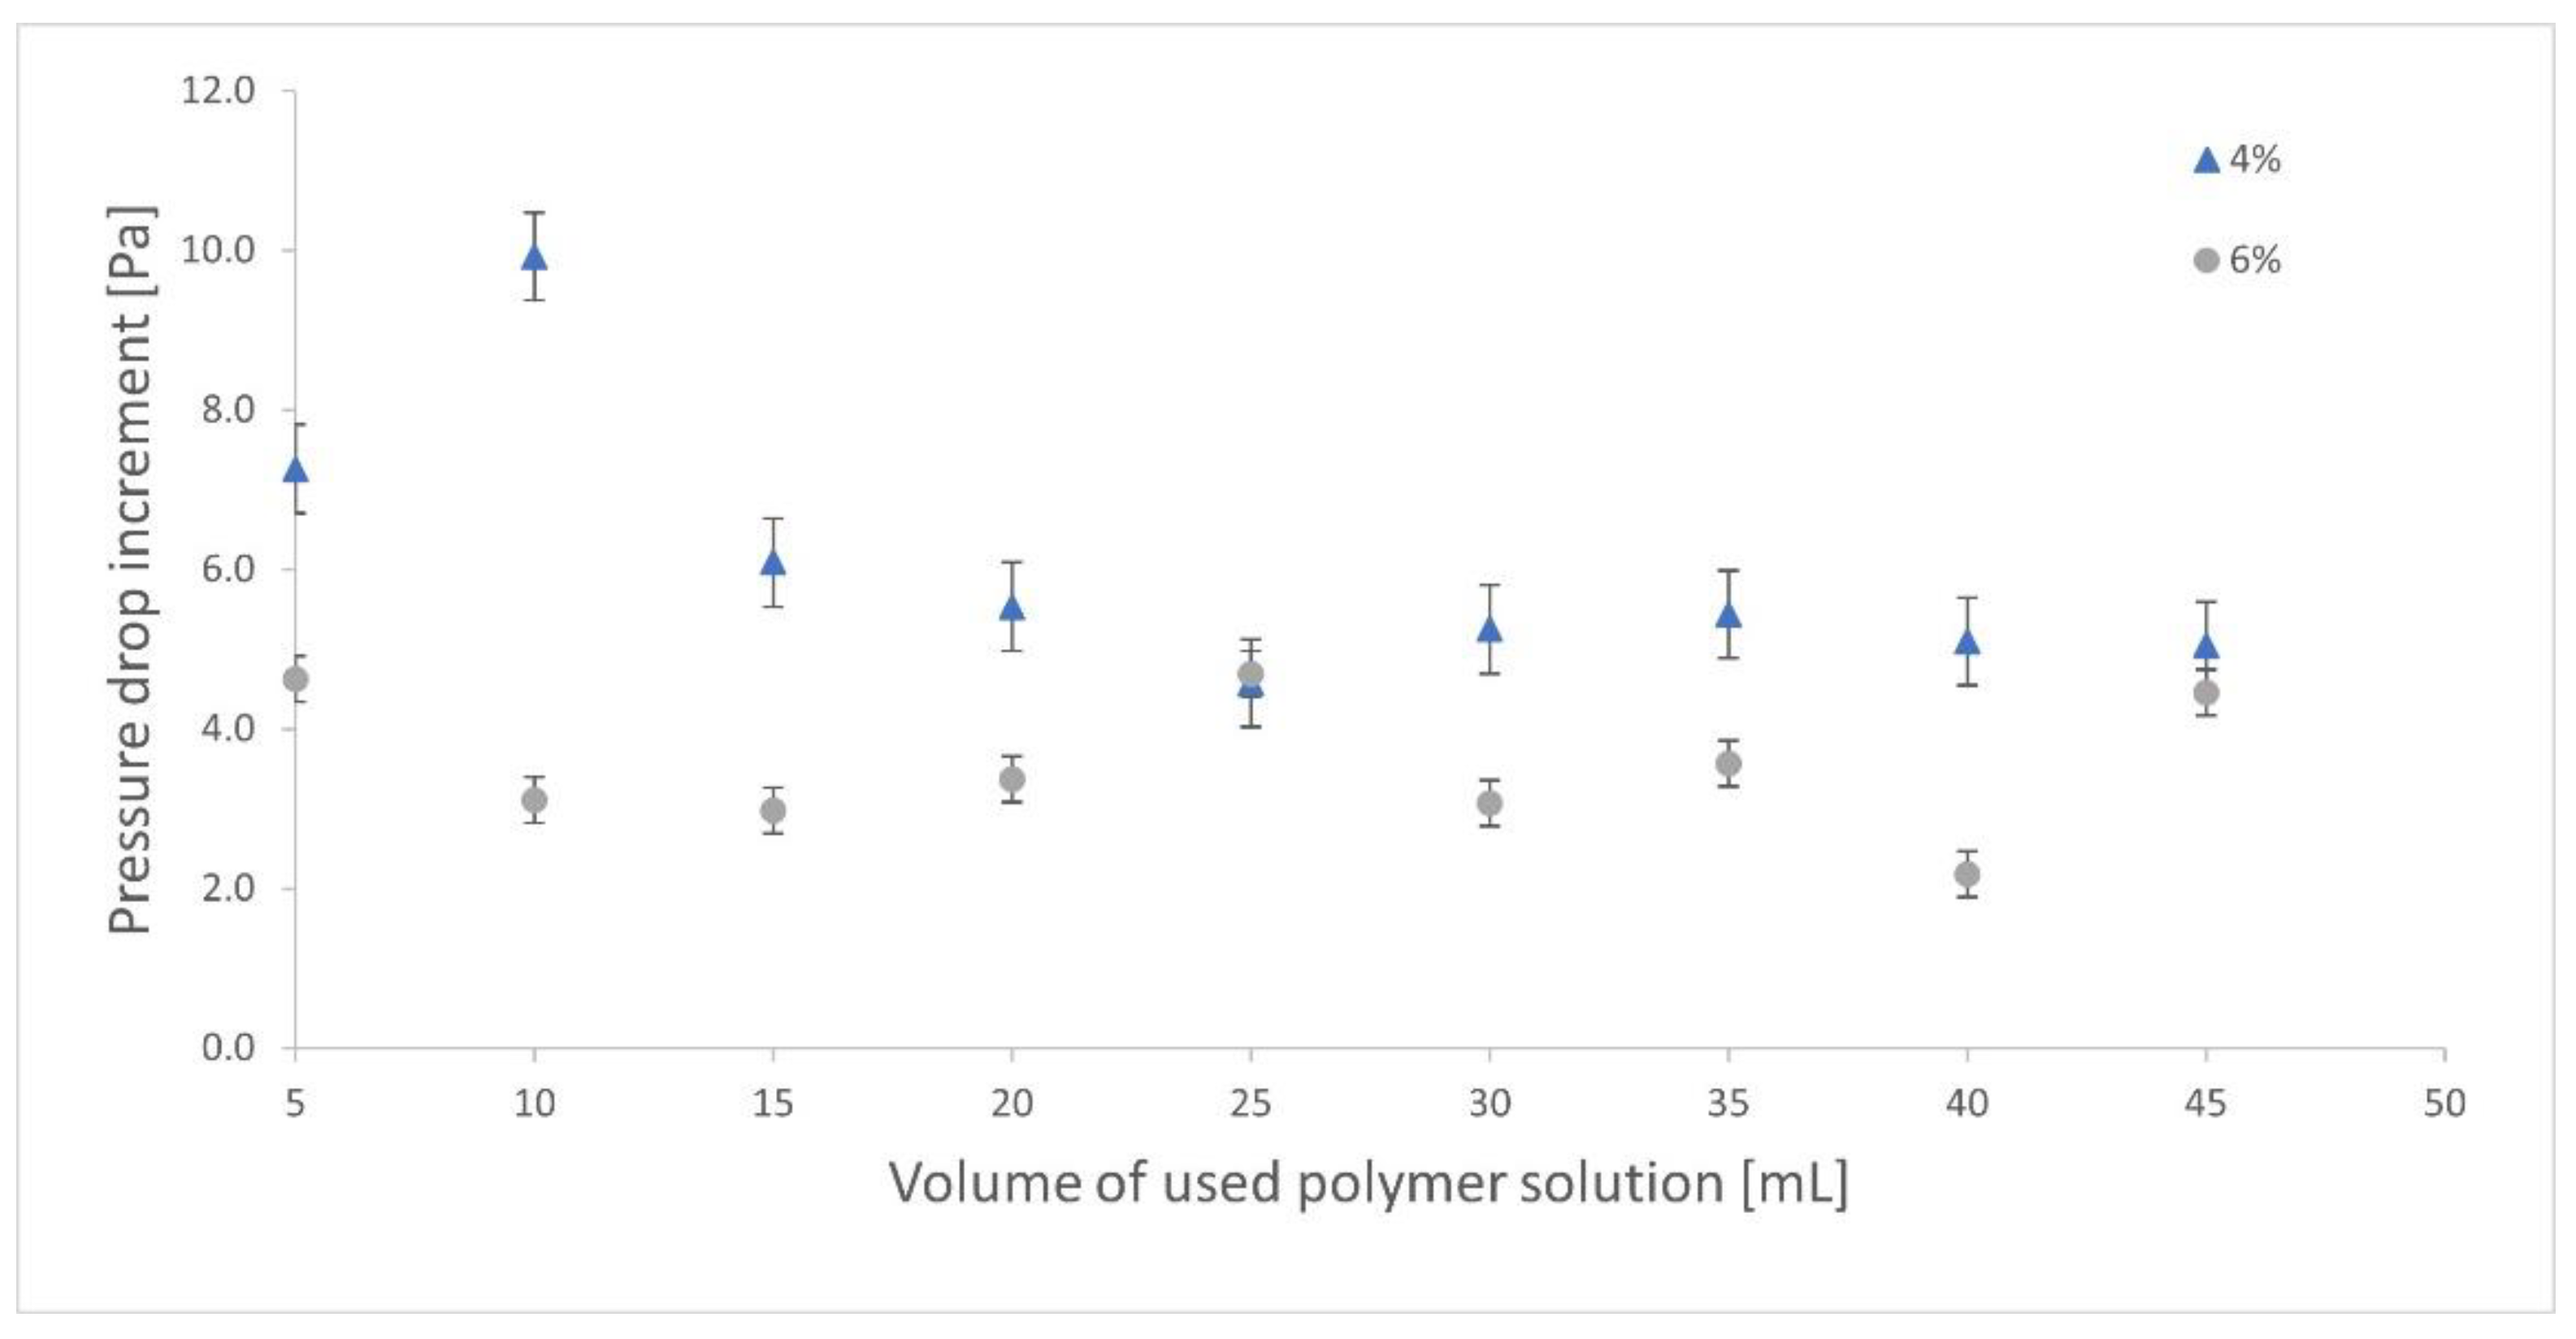
3.3.1. Pressure Drop

Figure 7 shows the average values of total pressure drops for produced filters as a function of the amount of applied polymer, while Figure 8 shows the pressure drop increments measured for each added portion of polymer used.
A higher pressure drop was observed for the non-woven fabric made of a 4% solution than for the 6% solution, as shown in Figure 7. It is explained by the smaller value of the average fiber diameter formed when the 4% solution was blown. The pressure drop as a function of the amount of defibrated polymer for used process conditions can be approximated with reasonable accuracy by a linear function for both concentrations.
In the case of the pressure drop increment, after each 5 mL polymer defibration, it remains at a similar level for both analyzed solution concentrations. The more significant discrepancy can be seen for the 4% solution, where the pressure drop increment is initially higher and then decreases and stabilizes. This phenomenon may be due to the previously indicated presence of non-fibrous structures in the filter material. The pressure drop increase indicates the stability of the process and the collection of a similar amount of material on the coconut collector in each cycle.

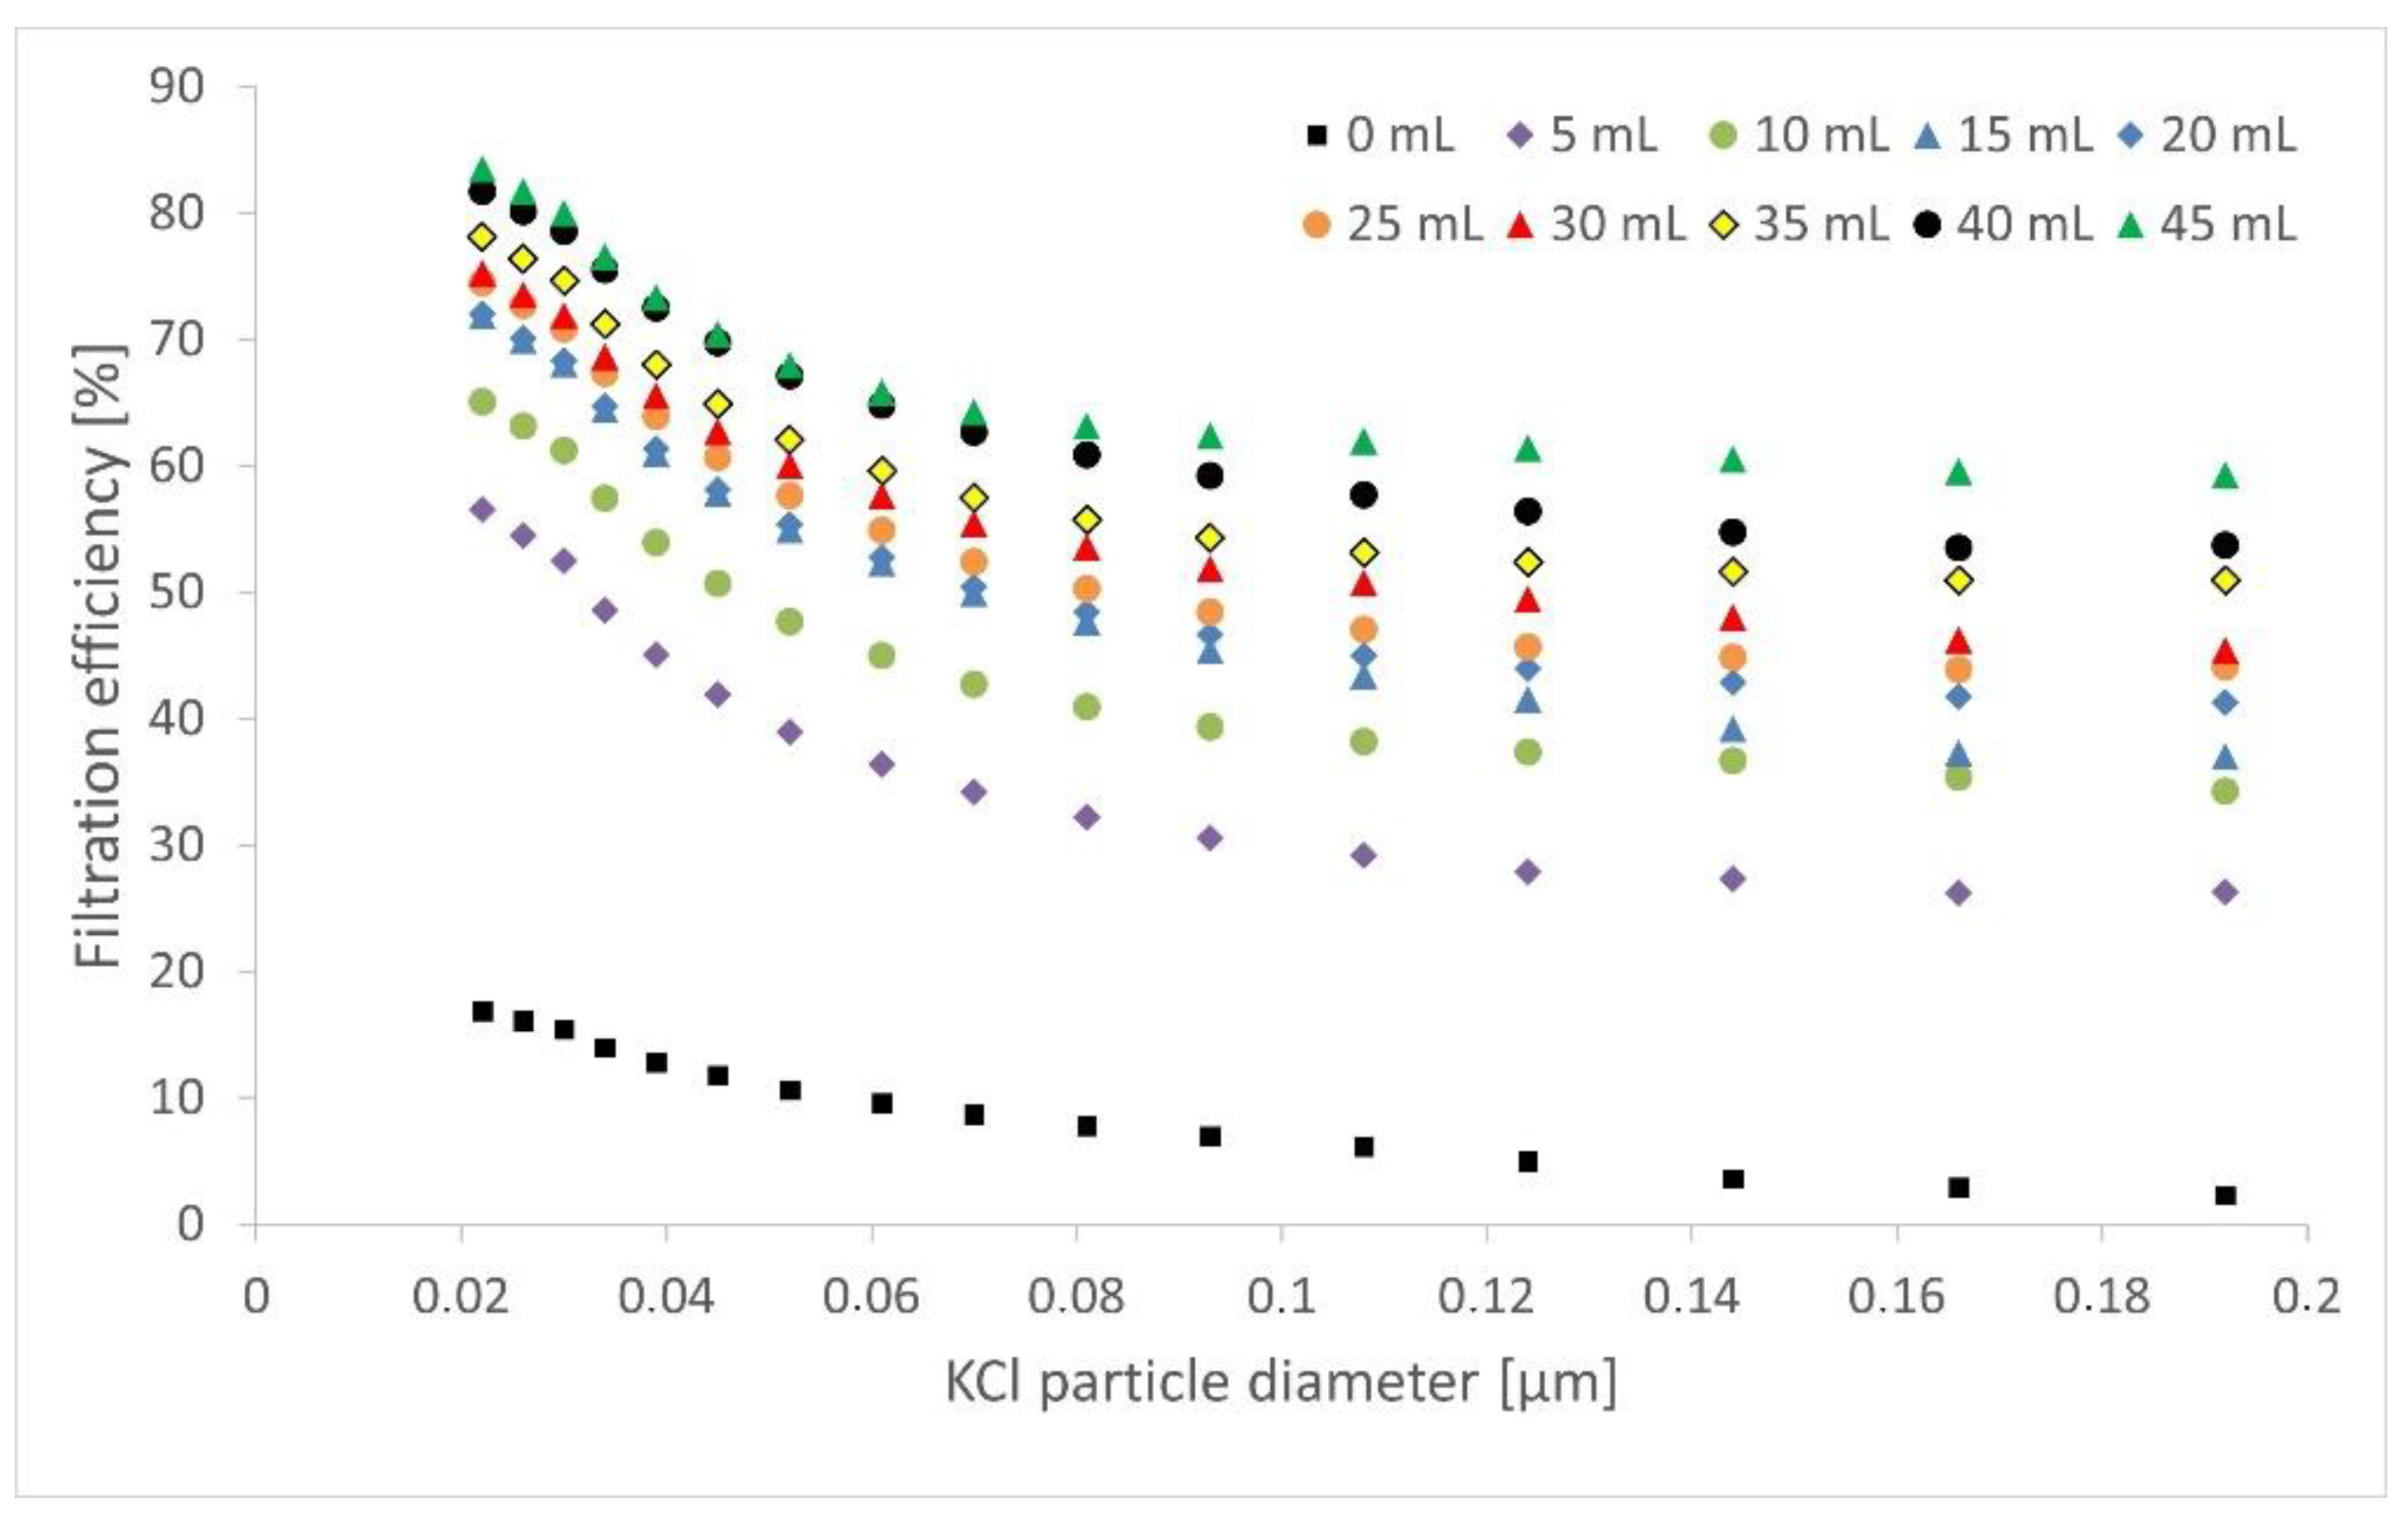
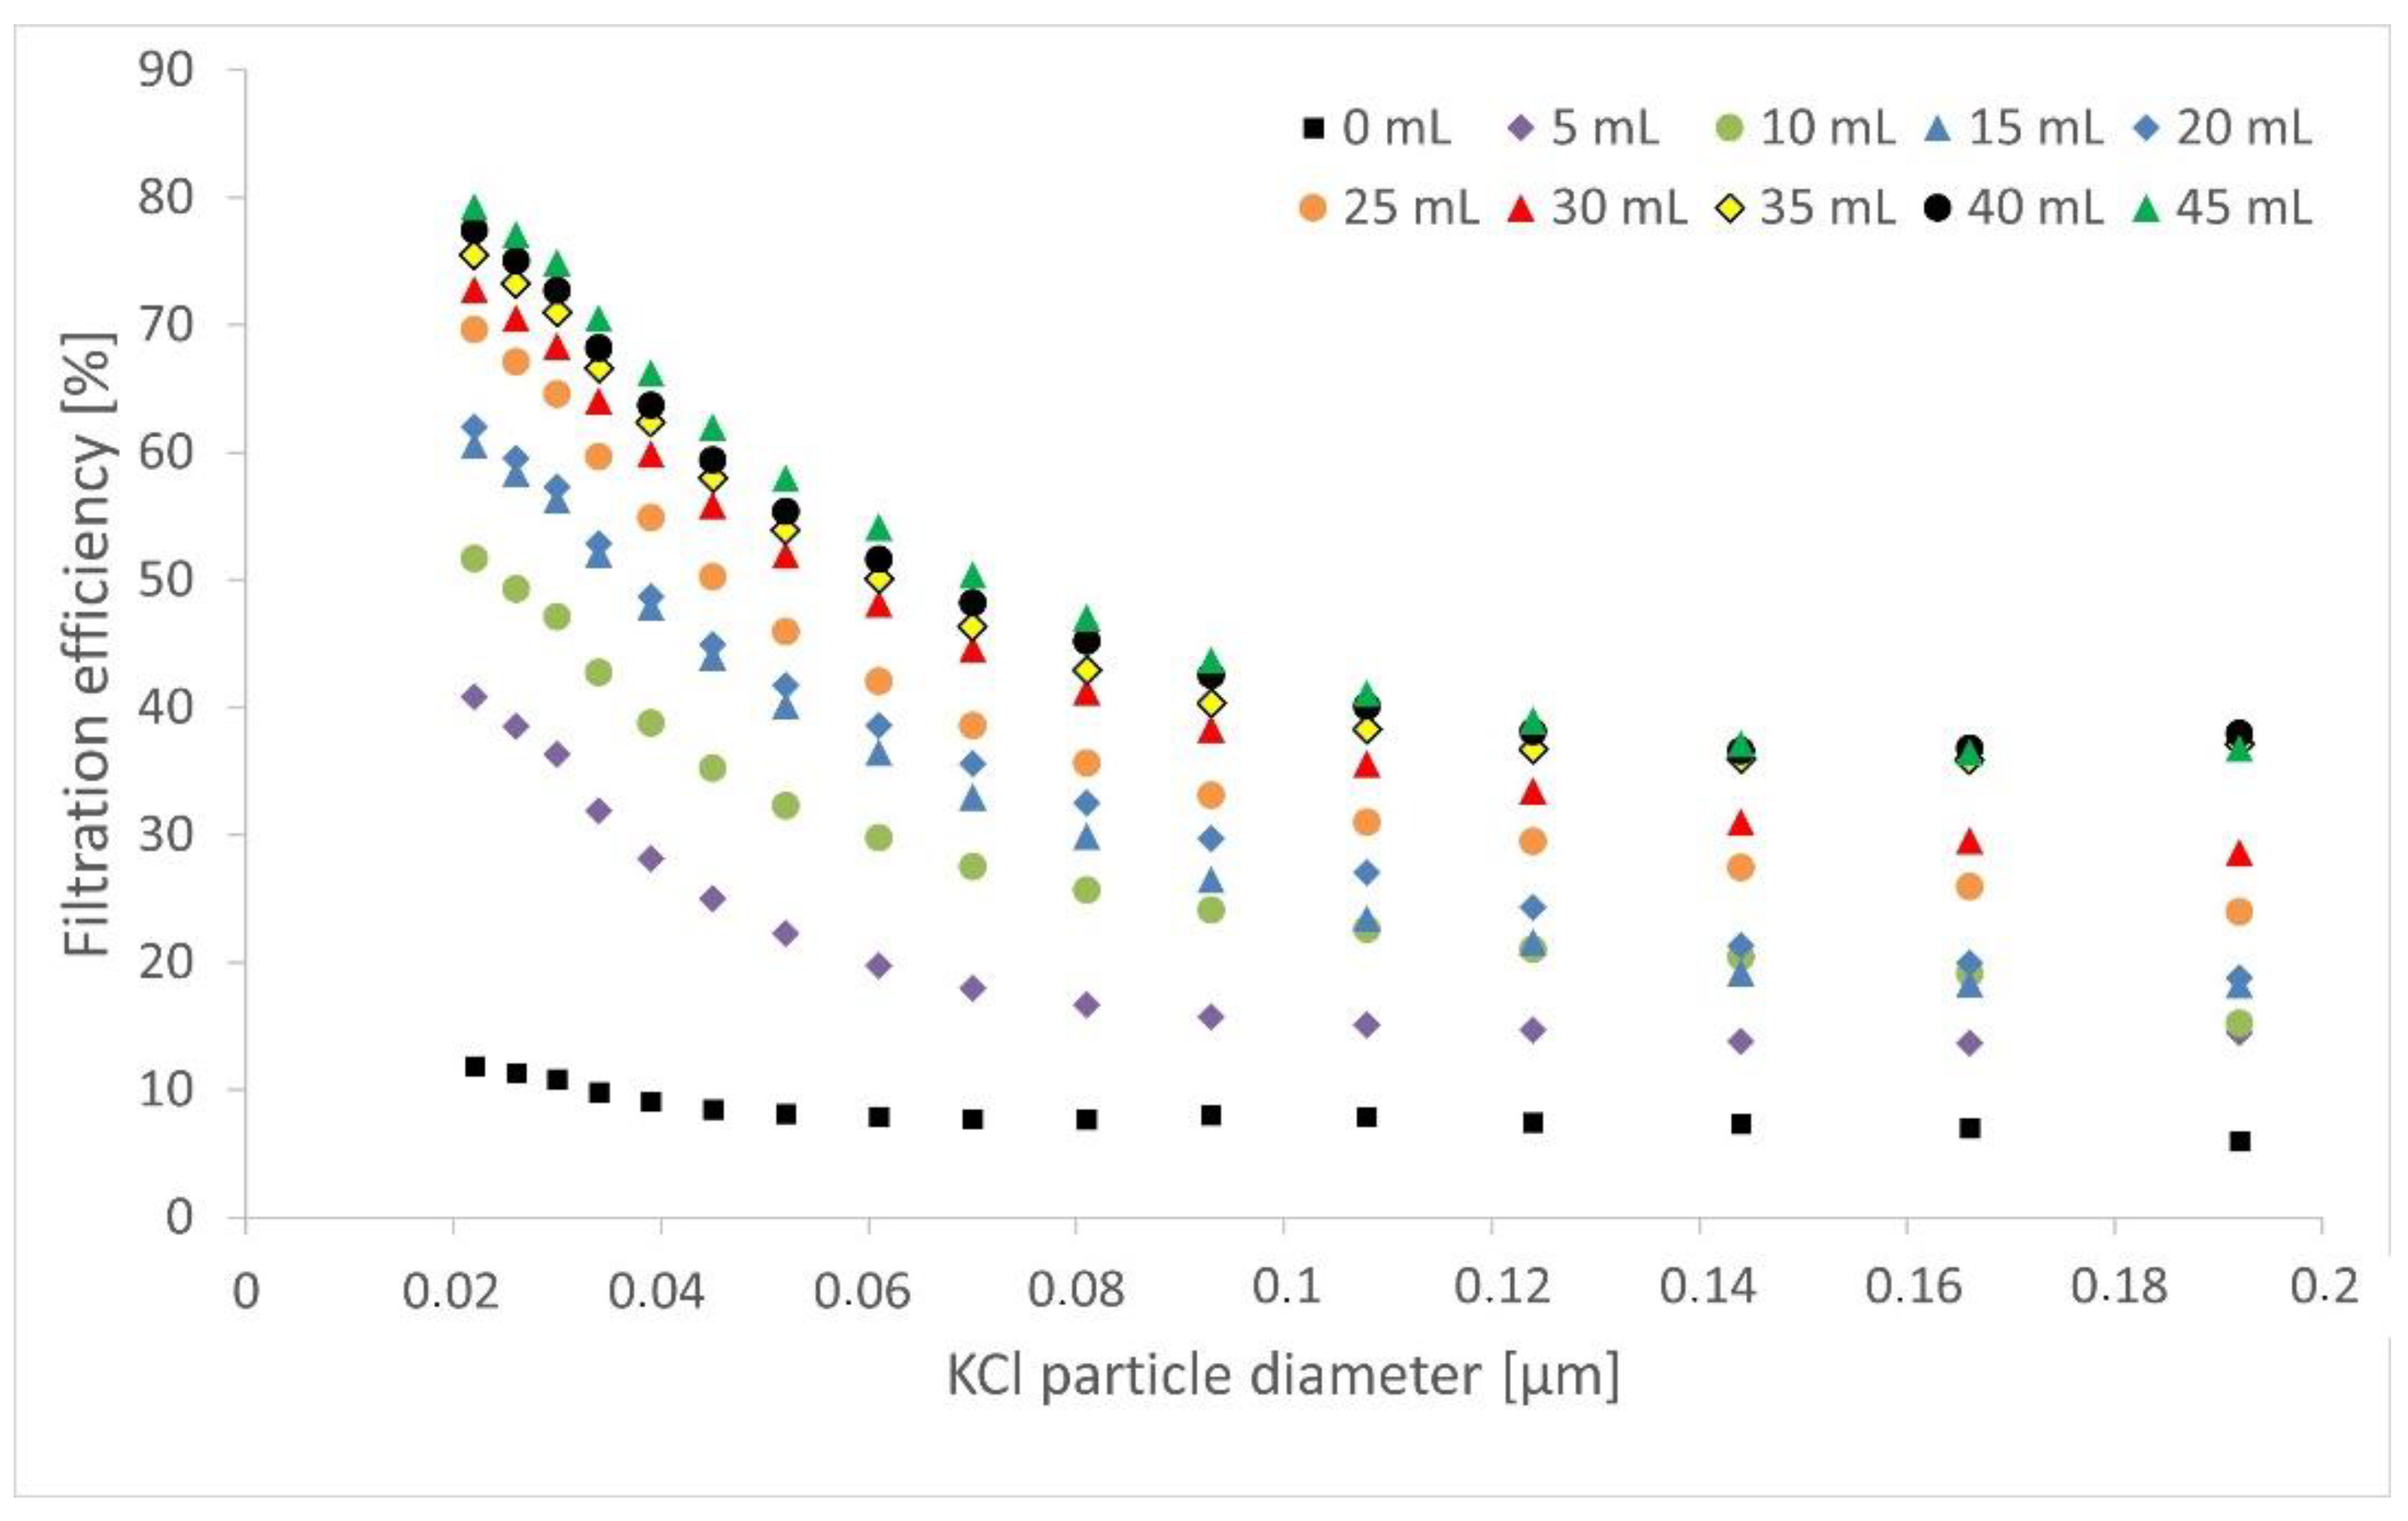
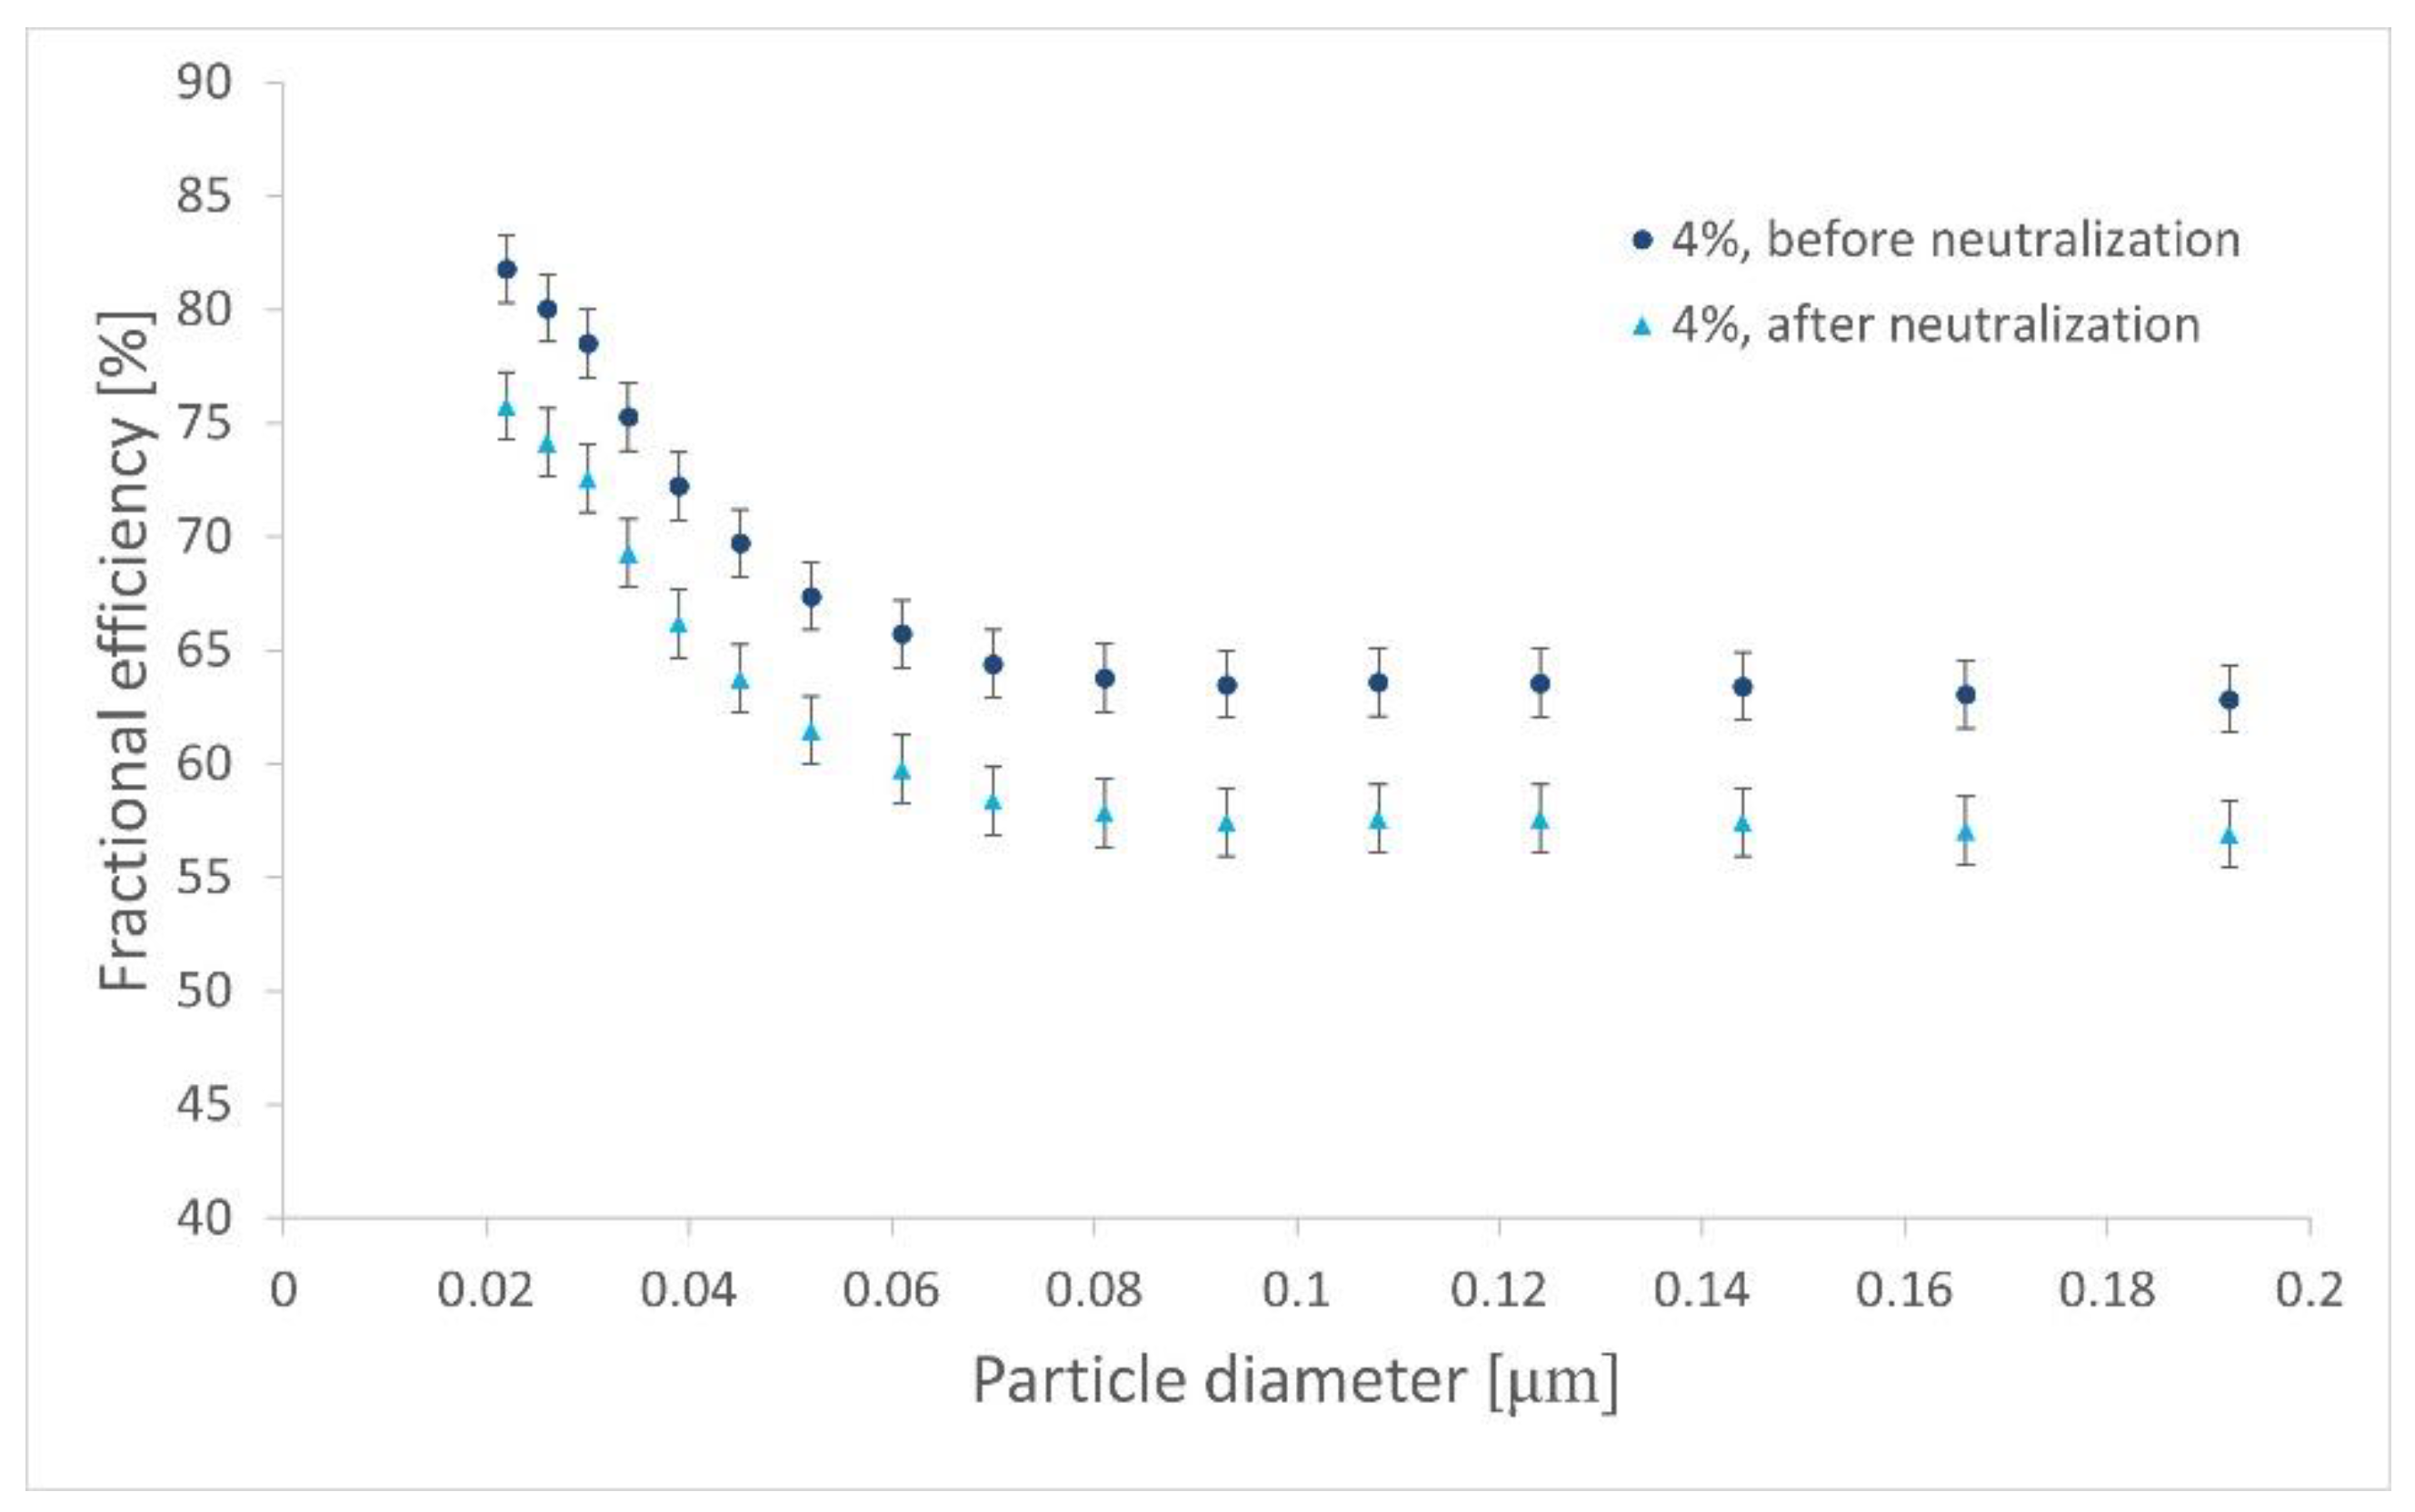
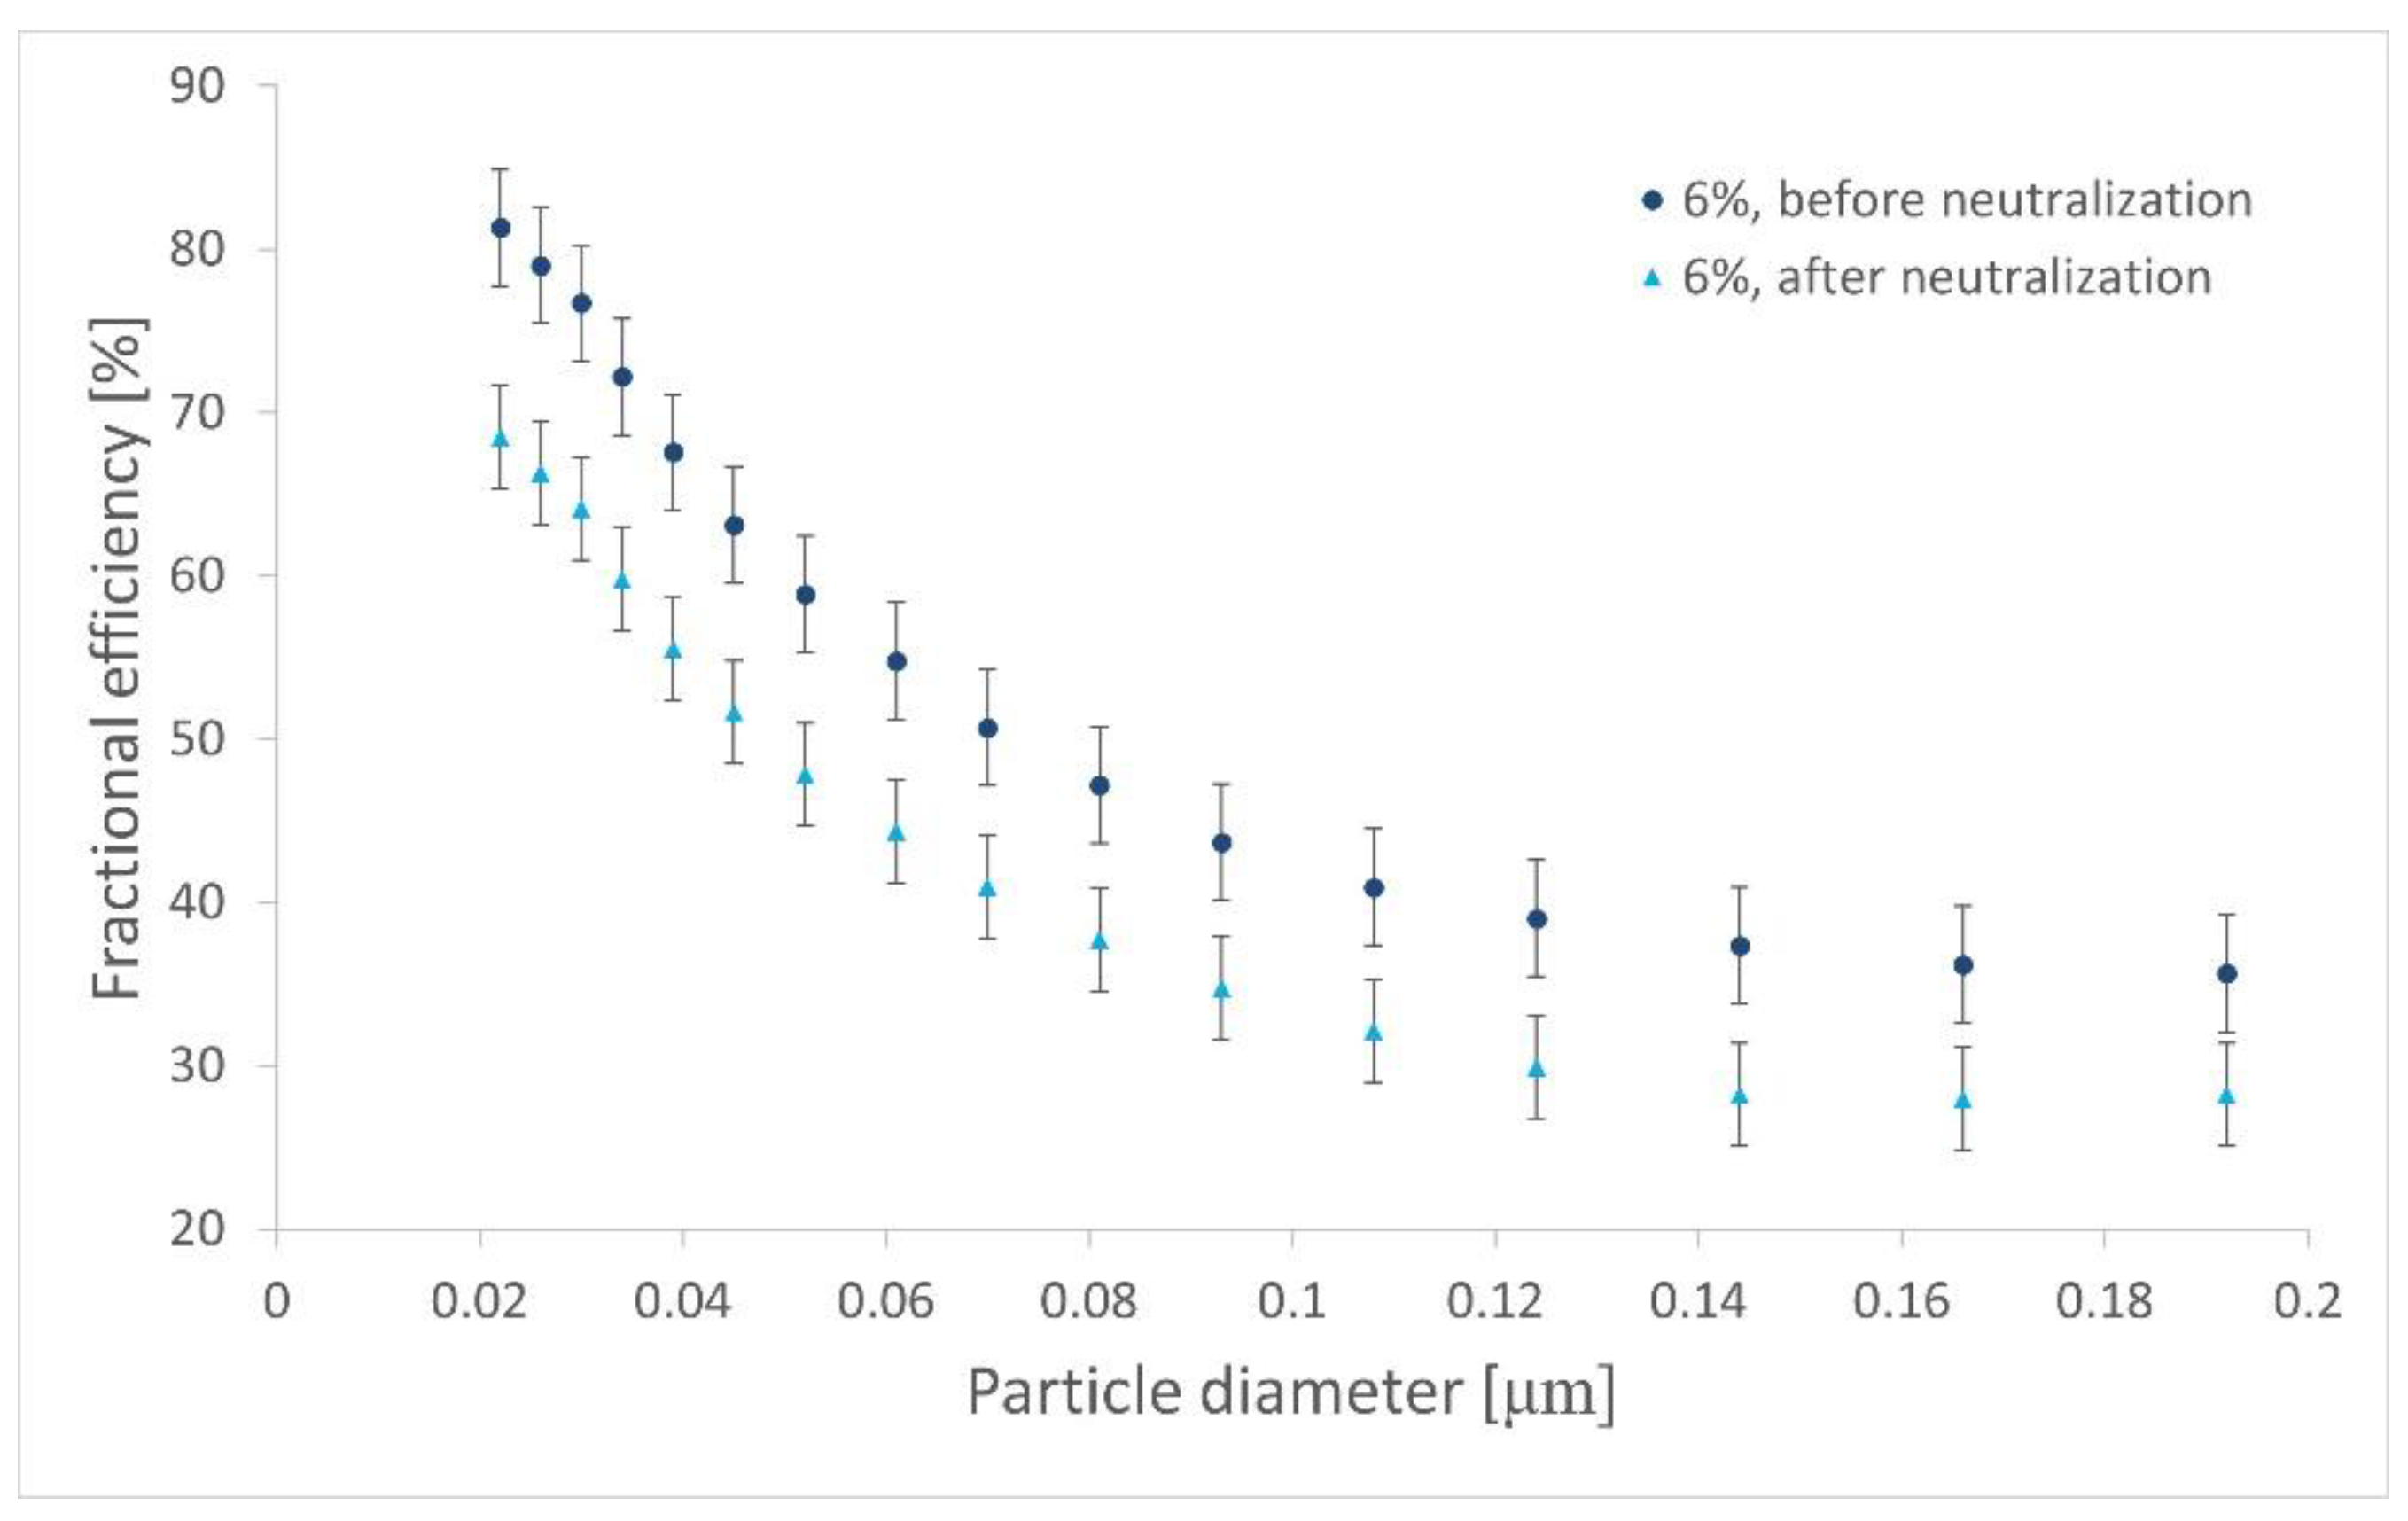
3.3.2. Filtration Efficiency

The results of the fractional filtration efficiency measurements as a function of the volume of the defibrated polymer solution for individual filter materials are presented in Figure 9 and Figure 10.
Classical filtration theory states that the thinner the fiber diameter, the greater the particle deposition efficiency, especially in the case of nanoparticles for which diffusion is the dominant deposition mechanism. In the SBS technique, a lower concentration of the polymer solution is used to obtain a smaller average diameter of the fibers produced. Another feature of the filter that strongly affects the efficiency of its work is its thickness. Thicker filters have a higher filtration efficiency but also have a higher pressure drop across the filter. With the increase in the amount of blowing polymer, the filtration efficiency increases over the entire range of the tested particle diameters for both used solution concentrations. The results obtained during the study confirmed the trend consistent with the classical filtration theory. The more fibers were introduced into the structure (the greater the amount of blown polymer solution), the higher was the filtration efficiency and pressure drop.
It can be observed that filtration efficiency decreased for the tiniest particles (less than about 0.1 µm) as the particles’ diameter increased. For every tested sample, a minimum efficiency can be observed in the range of 0.1–0.15 µm. This is the most penetrating particle size (MPPS), for which penetration through the filtration structure is the greatest. This is related to the influence of the diffusion mechanism that tends to decrease with an increase in the particle diameter and the growing influence of the direct interception mechanism. The coconut support layer, i.e., measurements for 0 mL, accounts for only a tiny part of the overall filtration efficiency of the filter material (less than 10%).
Figure 11 compares the overall filtration efficiency for samples made of solutions of a given concentration, and Figure 12 presents the overall efficiency increment.
The resulting linear correlation between the volume of PLA and filtration efficiency shown in Figure 11 allows us to easily predict the newly designed filter’s performance.
It is worth paying attention to the trend of non-woven efficiency produced by the solution concentration of 4% shown in Figure 12. It is characterized by a large increase in filtration efficiency after the application of the first layer of PLA fibers. However, with the next portion of the solution, the rate of filtration efficiency increment significantly decreases. For a concentration of 6%, this effect does not occur. The gain in filtration efficiency after defibration of each portion of the polymer is around five percentage points and, in any case, does not exceed ten percentage points. The reason for this phenomenon for samples made from the 4% solution may be the inhomogeneity of the filter structure, i.e., the presence of many non-fibrous structures, which, although initially providing high efficiency gains, also cause a high pressure drop, as presented earlier. The further efficiency gains for this material can be explained by the deposition of more and more fibers on the support mat, increasing the filtration efficiency. At the same time resulting non-fibrous structures have little effect on the efficiency, only increasing the pressure drop.

3.4. Effect of the Electrostatic Mechanism on Filtration in PLA Filters

The mean fractional efficiencies of fibers made of 4% and 6% solutions before and after neutralization in isopropanol vapor are shown in Figure 13 and Figure 14, respectively.
After neutralization, a decrease in fractional efficiency was observed for every sample. For the material prepared from the 4% solution, the drop was kept constant at approximately five percentage points over the entire range of the analyzed particle diameters. For the filter blowing from the 6% solution, a constant decrease in efficiency could also be observed for all particle diameters, but it was greater and amounted to approximately ten percentage points.
The presented data suggest a significant impact of the electrostatic mechanism on the filtration performance of fibrous filters produced from PLA using the SBS technique. However, the origin of the present charges was not clear. One hypothesis is that there was charging of fibers during their production, collection on a backing layer, storage, and preparation for testing mainly due to the presence of a tribology mechanism. The KCl particles used to study the filtration process were neutralized; therefore, the possibility that they could induce charges on the fibers was rejected. Due to the above, the electrostatic interactions, and more specifically, the Coulombic and polarization forces, are responsible for the higher efficiency of non-woven materials before neutralization.

4. Conclusions

It was presented that using the SBS technique, material appropriate for nanoparticle filtration may be produced as a nanofiber layer collected on a biodegradable coconut mat. The process conditions significantly affect fiber quality, directly influencing their filtration performance. If the polymer solution concentration decreases, the average of the produced fibers diameter shifts to a smaller value. For 4% wt, the nanofibers with a diameter equal to approximately 280 nm were created. The air pressure in the nozzle was found optimal for fiber production at the level of 1 × 10⁵ Pa. It was tested that a polymer solution flow of 0.5 mL/min produces mats from fibers with a minimum number of non-fiber structures. The adhesion of PLA nanofibers to the coconut mat is strong enough to provide the efficient collection of fibers during the SBS process, even for a distance between the nozzle and collector equal to 80 cm. The final structures have approximately 70% filtration efficiency for particles ranging from 0.02 to 0.2 μm with a pressure drop of less than 60 Pa. The obtained results show the benefits of introducing nanofibers to the filter structure. The SBS technique can be easily scaled up to an industrial scale by, e.g., using multi nozzle equipment. Moreover, thanks to the obtained dependence of the filtration efficiency on the amount of PLA used, one can predict what amount of polymer is needed to obtain a filter for a specific application with the desired efficiency.
The biodegradable filter production process needs further investigation, especially to produce structures where nanosized fibers will be introduced inside, not only on the surface. Furthermore, the biodegradation efficiency of PLA filters needs to be evaluated. Obtained results are very promising and are a step in producing efficient biodegradable filters for air purification.

Author Contributions

Conceptualization, A.M., A.P. and A.J.-Z.; methodology, A.M., A.P. and A.J.-Z.; investigation, K.M., A.M., A.P. and A.J.-Z.; writing—original draft preparation, A.J.-Z. and K.M.; writing—review and editing, A.J.-Z., A.P., A.M. and K.M. All authors have read and agreed to the published version of the manuscript.

Funding

This research received no funding.

Institutional Review Board Statement

Not applicable.

Informed Consent Statement

Not applicable.

Data Availability Statement

Not applicable.

Conflicts of Interest

The authors declare no conflict of interest.

References

  1. Calderón-Garcidueñas, L.; Solt, A.C.; Henríquez-Roldán, C.; Torres-Jardón, R.; Nuse, B.; Herritt, L.; Villarreal-Calderón, R.; Osnaya, N.; Stone, I.; García, R.; et al. Long-Term Air Pollution Exposure Is Associated with Neuroinflammation, an Altered Innate Immune Response, Disruption of the Blood-Brain Barrier, Ultrafine Particulate Deposition, and Accumulation of Amyloid Beta-42 and Alpha-Synuclein in Children and Young Adults. Toxicol. Pathol. 2008, 36, 289–310. [Google Scholar] [CrossRef] [PubMed]
  2. Wu, Y.-C.; Lin, Y.-C.; Yu, H.-L.; Chen, J.-H.; Chen, T.-F.; Sun, Y.; Wen, L.-L.; Yip, P.-K.; Chu, Y.-M.; Chen, Y.-C. Association between Air Pollutants and Dementia Risk in the Elderly. Alzheimers Dement. 2015, 1, 220–228. [Google Scholar] [CrossRef] [PubMed] [Green Version]
  3. Kioumourtzoglou, M.-A.; Schwartz, J.D.; Weisskopf, M.G.; Melly, S.J.; Wang, Y.; Dominici, F.; Zanobetti, A. Long-Term PM2.5 Exposure and Neurological Hospital Admissions in the Northeastern United States. Environ. Health Perspect. 2016, 124, 23–29. [Google Scholar] [CrossRef] [PubMed] [Green Version]
  4. Brunekreef, B.; Holgate, S.T. Air Pollution and Health. Lancet 2002, 360, 1233–1242. [Google Scholar] [CrossRef]
  5. Hasler, P.; Nussbaumer, T. Gas Cleaning for IC Engine Applications from Fixed Bed Biomass Gasification. Biomass Bioenergy 1999, 16, 385–395. [Google Scholar] [CrossRef]
  6. Hinds, W.C. Aerosol Technology, Properties, Behaviour, and Measurement of Airborne Particles; John Wiley & Sons Inc.: New York, NY, USA, 1999. [Google Scholar]
  7. Jackiewicz, A.; Podgórski, A.; Gradoń, L.; Michalski, J. Nanostructured Media to Improve the Performance of Fibrous Filters. KONA Powder Part. J. 2013, 30, 244–255. [Google Scholar] [CrossRef] [Green Version]
  8. Shi, L.; Zhuang, X.; Tao, X.; Cheng, B.; Kang, W. Solution Blowing Nylon 6 Nanofiber Mats for Air Filtration. Fibers Polym. 2013, 14, 1485–1490. [Google Scholar] [CrossRef]
  9. Qin, X.-H.; Wang, S.-Y. Filtration Properties of Electrospinning Nanofibers. J. Appl. Polym. Sci. 2006, 102, 1285–1290. [Google Scholar] [CrossRef]
  10. Przekop, R.; Gradoń, L. Deposition and Filtration of Nanoparticles in the Composites of Nano and Microsized Fibers. Aerosol Sci. Technol. 2008, 42, 483–493. [Google Scholar] [CrossRef]
  11. Wasim, M.; Sabir, A.; Shafiq, M.; Jamil, T. Chapter 11-Electrospinning: A Fiber Fabrication Technique for Water Purification. In Nanoscale Materials in Water Purification; Thomas, S., Pasquini, D., Leu, S.-Y., Gopakumar, D.A., Eds.; Micro and Nano Technologies; Elsevier: Amsterdam, The Netherlands, 2019; pp. 289–308. [Google Scholar] [CrossRef]
  12. Tan, D.H.; Zhou, C.; Ellison, C.J.; Kumar, S.; Macosko, C.W.; Bates, F.S. Meltblown Fibers: Influence of Viscosity and Elasticity on Diameter Distribution. J. Non-Newton. Fluid Mech. 2010, 165, 892–900. [Google Scholar] [CrossRef]
  13. Zhou, F.-L.; Gong, R.-H. Manufacturing Technologies of Polymeric Nanofibres and Nanofibre Yarns. Polym. Int. 2008, 57, 837–845. [Google Scholar] [CrossRef]
  14. Mirabedini, A. Developing Novel Spinning Methods to Fabricate Continuous Multifunctional Fibres for Bioapplications; Springer Theses; Springer International Publishing: Cham, Switzerland, 2018. [Google Scholar] [CrossRef] [Green Version]
  15. Wagterveld, R.M.; Marijnissen, J.C.M.; Gradoń, L.; Moskal, A.; Westerbos, M.; Sosnowski, T.R.; Wojasiński, M.; Ciach, T.; Leslie, H.A.; Peffer, L.; et al. Synthetic Nano- and Microfibers; Wetsus, European Centre of Excellence for Sustainable Water Technology: Leeuwarden, The Netherlands, 2020. [Google Scholar] [CrossRef]
  16. Agrawal, S.; Ranjan, R.; Lal, B.; Rahman, A.; Singh, S.P.; Selvaratnam, T.; Nawaz, T. Synthesis and Water Treatment Applications of Nanofibers by Electrospinning. Processes 2021, 9, 1779. [Google Scholar] [CrossRef]
  17. Huang, Z.-X.; Liu, X.; Zhang, X.; Wong, S.-C.; Chase, G.G.; Qu, J.-P.; Baji, A. Electrospun Polyvinylidene Fluoride Containing Nanoscale Graphite Platelets as Electret Membrane and Its Application in Air Filtration under Extreme Environment. Polymer 2017, 131, 143–150. [Google Scholar] [CrossRef]
  18. Su, J.; Yang, G.; Cheng, C.; Huang, C.; Xu, H.; Ke, Q. Hierarchically Structured TiO2/PAN Nanofibrous Membranes for High-Efficiency Air Filtration and Toluene Degradation. J. Colloid Interface Sci. 2017, 507, 386–396. [Google Scholar] [CrossRef] [PubMed]
  19. Yang, Y.; Zhang, S.; Zhao, X.; Yu, J.; Ding, B. Sandwich Structured Polyamide-6/Polyacrylonitrile Nanonets/Bead-on-String Composite Membrane for Effective Air Filtration. Sep. Purif. Technol. 2015, 152, 14–22. [Google Scholar] [CrossRef]
  20. Zhu, M.; Hua, D.; Pan, H.; Wang, F.; Manshian, B.; Soenen, S.J.; Xiong, R.; Huang, C. Green Electrospun and Crosslinked Poly(Vinyl Alcohol)/Poly(Acrylic Acid) Composite Membranes for Antibacterial Effective Air Filtration. J. Colloid Interface Sci. 2018, 511, 411–423. [Google Scholar] [CrossRef]
  21. Desai, K.; Kit, K.; Li, J.; Michael Davidson, P.; Zivanovic, S.; Meyer, H. Nanofibrous Chitosan Non-Wovens for Filtration Applications. Polymer 2009, 50, 3661–3669. [Google Scholar] [CrossRef]
  22. Fang, Q.; Zhu, M.; Yu, S.; Sui, G.; Yang, X. Studies on Soy Protein Isolate/Polyvinyl Alcohol Hybrid Nanofiber Membranes as Multi-Functional Eco-Friendly Filtration Materials. Mater. Sci. Eng. B 2016, 214, 1–10. [Google Scholar] [CrossRef]
  23. Matulevicius, J.; Kliucininkas, L.; Prasauskas, T.; Buivydiene, D.; Martuzevicius, D. The Comparative Study of Aerosol Filtration by Electrospun Polyamide, Polyvinyl Acetate, Polyacrylonitrile and Cellulose Acetate Nanofiber Media. J. Aerosol Sci. 2016, 92, 27–37. [Google Scholar] [CrossRef]
  24. Böttjer, R.; Grothe, T.; Wehlage, D.; Ehrmann, A. Electrospraying Poloxamer/(Bio-)Polymer Blends Using a Needleless Electrospinning Machine. J. Text. Fibrous Mater. 2018, 1, 2515221117743079. [Google Scholar] [CrossRef]
  25. Tang, Z.; Kong, N.; Zhang, X.; Liu, Y.; Hu, P.; Mou, S.; Liljeström, P.; Shi, J.; Tan, W.; Kim, J.S.; et al. A Materials-Science Perspective on Tackling COVID-19. Nat. Rev. Mater. 2020, 5, 847–860. [Google Scholar] [CrossRef] [PubMed]
  26. Pandey, L.K.; Singh, V.V.; Sharma, P.K.; Meher, D.; Biswas, U.; Sathe, M.; Ganesan, K.; Thakare, V.B.; Agarwal, K. Screening of Core Filter Layer for the Development of Respiratory Mask to Combat COVID-19. Sci. Rep. 2021, 11, 10187. [Google Scholar] [CrossRef] [PubMed]
  27. Dadol, G.C.; Kilic, A.; Tijing, L.D.; Lim, K.J.A.; Cabatingan, L.K.; Tan, N.P.B.; Stojanovska, E.; Polat, Y. Solution Blow Spinning (SBS) and SBS-Spun Nanofibers: Materials, Methods, and Applications. Mater. Today Commun. 2020, 25, 101656. [Google Scholar] [CrossRef]
  28. Gao, D.; Zhao, R.; Yang, X.; Chen, F.; Ning, X. Bicomponent PLA Nanofiber Nonwovens as Highly Efficient Filtration Media for Particulate Pollutants and Pathogens. Membranes 2021, 11, 819. [Google Scholar] [CrossRef] [PubMed]
  29. Pierpaoli, M.; Giosuè, C.; Czerwińska, N.; Rycewicz, M.; Wieloszyńska, A.; Bogdanowicz, R.; Ruello, M.L. Characterization and Filtration Efficiency of Sustainable PLA Fibers Obtained via a Hybrid 3D-Printed/Electrospinning Technique. Materials 2021, 14, 6766. [Google Scholar] [CrossRef] [PubMed]
  30. Jafari, M.; Shim, E.; Joijode, A. Fabrication of Poly(Lactic Acid) Filter Media via the Meltblowing Process and Their Filtration Performances: A Comparative Study with Polypropylene Meltblown. Sep. Purif. Technol. 2021, 260, 118185. [Google Scholar] [CrossRef]
  31. Jackiewicz, A.; Werner, L. Separation of Nanoparticles from Air Using Melt-Blown Filtering Media. Aerosol Air Qual. Res. 2015, 15, 2422–2435. [Google Scholar] [CrossRef]
  32. Abd Ali, S.A.Z.; Joubert, A.; Andrès, Y. Evaluation of Antimicrobial Effect of Zinc Pyrithione against Airborne Fungi and Bacteria Growth Collected onto New and Loaded HVAC Fibrous Filters. Processes 2021, 9, 1528. [Google Scholar] [CrossRef]
  33. Yun, K.M.; Hogan, C.J.; Matsubayashi, Y.; Kawabe, M.; Iskandar, F.; Okuyama, K. Nanoparticle Filtration by Electrospun Polymer Fibers. Chem. Eng. Sci. 2007, 62, 4751–4759. [Google Scholar] [CrossRef]
  34. Daristotle, J.L.; Behrens, A.M.; Sandler, A.D.; Kofinas, P. A Review of the Fundamental Principles and Applications of Solution Blow Spinning. ACS Appl. Mater. Interfaces 2016, 8, 34951–34963. [Google Scholar] [CrossRef] [PubMed] [Green Version]
  35. Wojasiński, M.; Ciach, T. Solution Blow Spun Poly-L-Lactic Acid/Ceramic Fibrous Composites for Bone Implant Applications. Inżynieria Chem. I Proces. 2021, 42, 275–289. [Google Scholar] [CrossRef]
  36. Oliveira, J.; Moraes, E.; Costa, R.; Afonso, A.; Mattoso, L.; Orts, W.J.; Medeiros, E. Nano and Submicrometric Fibers of Poly(D,L-Lactide) Obtained by Solution Blow Spinning: Process and Solution Variables. J. Appl. Polym. Sci. 2011, 122, 3396–3405. [Google Scholar] [CrossRef]
Figure 1. Support coconut mat for PLA fibers.
Processes 10 02598 g001
Figure 2. Scheme of the solution blow spinning setup (a) and cross-section through the nozzle (b).
Processes 10 02598 g002
Figure 3. Exemplary very-good-quality materials: (a) 4% PLA, 0.2 mL/min, 0.5 × 10⁵ Pa; (b) 6% PLA, 0.4 mL/min, 1 × 10⁵ Pa; good-quality materials: (c) 4% PLA, 0.2 mL/min, 1 × 10⁵ Pa; (d) 6% PLA, 0.2 mL/min, 1 × 10⁵ Pa; poor-quality materials: (e) 4% PLA, 0.5 mL/min, 1 × 10⁵ Pa; (f) 6% PLA, 0.5 mL/min, 0.5 × 10⁵ Pa.
Processes 10 02598 g003
Figure 4. KCl particles size distribution.
Processes 10 02598 g004
Figure 5. Test bench for testing flat filtration materials.
Processes 10 02598 g005
Figure 6. Fibers produced at a flow rate of 0.4 mL/min and air pressure equal to 1 × 10⁵ Pa from 4% solution (a) and from 6% solution (b). Distribution of fibers’ diameters for materials made of 4% and 6% solution (c).
Processes 10 02598 g006
Figure 7. Pressure drop as a function of solution volume.
Processes 10 02598 g007
Figure 8. Pressure drop increment as a function of volume of used solution.
Processes 10 02598 g008
Figure 9. Dependence of the fractional filtration efficiency on the volume of 4% PLA solution used for the production of fibers.
Processes 10 02598 g009
Figure 10. Dependence of the fractional filtration efficiency on the volume of 6% PLA solution used for the production of fibers.
Processes 10 02598 g010
Figure 11. Dependence of the overall filtration efficiency on the volume of 4% and 6% PLA solution used for the fibers production.
Processes 10 02598 g011
Figure 12. Overall filtration efficiency increments as a function of the polymer solution’s volume.
Processes 10 02598 g012
Figure 13. Fractional efficiency of material made from 4% solution, before and after neutralization.
Processes 10 02598 g013
Figure 14. Fractional efficiency of material made from 6% solution, before and after neutralization.
Processes 10 02598 g014
Table 1. Tested parameters of PLA defibration.
Concentration
[%]
Pressure
[×105 Pa]
Flow
[mL/min]
Mean Fiber
Diameter [μm]
Standard
Deviation [μm]
Ratio of Undefibrated PLA Surface Area to Fibers Area [-]Overall Quality
40.50.10.4110.1440.120Good
410.10.3960.1570.108Good
40.50.20.3410.1020.056Very good
410.20.4120.1290.077Good
40.50.30.4000.1290.093Good
410.30.3460.1440.083Good
40.50.40.4610.3290.172Poor
410.40.2790.0870.038Very good
40.50.50.4250.1970.061Good
410.50.4490.2230.451Poor
60.50.10.6370.2710.767Poor
610.10.5040.2630.028Very good
60.50.20.8120.6870.343Poor
610.20.5240.1990.141Good
60.50.30.6020.2890.054Good
610.30.4990.3810.173Poor
60.50.40.6310.4120.600Poor
610.40.4520.2660.039Very good
60.50.50.8150.4090.424Poor
610.50.5820.2260.066Good
Table 2. Parameters of PLA fibers.
PLA Solution Concentration [%]Minimum Fiber Diameter [μm]Maximum Fiber Diameter [μm]Arithmetic Mean Fiber Diameter [μm]Standard
Deviation [μm]
40.0421.2080.2790.087
60.1042.6720.4520.266
Publisher’s Note: MDPI stays neutral with regard to jurisdictional claims in published maps and institutional affiliations.

