Article

Identification and Analysis of Factors Influencing Green Growth of Manufacturing Enterprises Based on DEMATEL Method—Wooden Flooring Manufacturing Companies as a Case

College of Applied Science and Technology, Beijing Union University, Beijing 100012, China
*
Author to whom correspondence should be addressed.
Processes 2022, 10(12), 2594; https://doi.org/10.3390/pr10122594
Submission received: 9 October 2022 / Revised: 14 November 2022 / Accepted: 22 November 2022 / Published: 5 December 2022

Abstract

:
It is significant to scientifically identify what factors influence the green growth of manufacturing enterprises and analyze the relationship among these factors, thus promoting green growth. Firstly, the corresponding conceptual model is designed; then, the DEMATEL method and steps used to identify the influencing factors are introduced; finally, the DEMATEL method is adopted to empirically analyze wooden flooring manufacturing companies so as to identify influencing factors of their green growth. According to the results, there are six reason factors, namely environmental standard constraints, green market demand, market competition, green technology advancement, upstream and downstream synergy of green industrial chain, and policy support, which provide the most important external support to enterprises’ green growth and main driving power to wooden flooring manufacturing ones.

1. Introduction

Crucial to the industrial economy, manufacturing is a typical and fundamental symbol of comprehensive national strength and international status. Over the past 40 years since the reform and opening-up of China, China’s manufacturing industry has made great progress, now with more than 30% of the world’s total manufacturing output, a comprehensive industrial system with all sectors, and a complete industrial chain [1], However, despite the huge volume, China is still not a manufacturing powerhouse [2] subject to scale expansion [3]; therefore, transformation is urgent to upgrade China’s manufacturing industry.
To pursue a higher quality of industrial development, green growth has become an important symbol [4]. In 2015, the Chinese government officially put forward the “Made in China 2025” Initiative, in which green growth was a guideline for strategic implementation, emphasizing that sustainable economic development should be coordinated with the natural environment towards fully green manufacturing [5]. In particular, manufacturing enterprises are required to shift from a traditional development model that was at the expense of the environment to foster green transformation and upgrading to realize green growth [6,7].
“Green growth” refers to the process that manufacturing enterprises grow stronger through green strategies and green behaviors, fewer pollutant residues, less consumption of resources and energy, and more environmentally friendly, safe, and healthy products, together with ever-increasing green competitiveness. In particular, the leading concept is green development throughout the production and management practices of manufacturing enterprises relying on relevant technological and management innovations, featured by less environmental pollution and higher resource efficiency [8,9].
It is clear that green growth essentially emphasizes sustainable development to realize both economic growth and environmental protection [10]. Enterprise behaviors should follow the basic green premise and corresponding requirements under green constraints, which is necessary for their survival and development.
Such green growth of manufacturing enterprises is a “systematic project” with a wide range, rich contents, and many influencing factors [11]. As a result, it is pragmatic to identify and refine these key factors.
This paper aims to effectively identify the influencing factors of manufacturing enterprises’ green growth, then further define and utilize key ones to promote green growth. Major contributions made in this paper include a conceptual model of the factors influencing the green growth of manufacturing enterprises and a method to further explore the relevant dynamic mechanisms and key influencing factors identified through the DEMATEL method and verify the effectiveness of the DEMATEL method. Finally, this paper concludes with six verified key influencing factors. In particular, the introduction of the “industrial chain” factor and the proposed “collaboration within the industrial chain” factor have improved comprehensiveness in analyzing green growth dynamics and provided more perspectives apart from previous individual enterprises.

2. The Research Objectives and Method

2.1. Setting up a Conceptual Model of Influencing Factors

Enterprise management pursues more values and shareholders’ maximum benefits. That is, green behaviors cannot sustain without more business values or better financial performance [12]; therefore, based on rational human assumption, manufacturing enterprises driven by their interests (including short-term and long-term gains) will be more willing to adopt green behaviors with various “green motivation” factors that add values. In this sense, effective identification of external factors that can improve such “green behavior willingness” [13] is necessary; thus, a conceptual model of influencing factors is designed as shown in Figure 1.
The model logic is that due to external influencing factors, manufacturing enterprises have a stronger willingness to green behaviors driven by their interests. Then these green behaviors realize green benefits and green growth in different ways. That is, “external influencing factors → manufacturing enterprises → stronger willingness to green behaviors → green behaviors → more revenues → green growth.”
Here are definitions of several relevant concepts in Figure 1.
(1) Green behavior willingness, with manufacturing enterprises as the subject. It refers to enterprises’ subjective readiness for green behaviors under comprehensive influencing factors, which is crucial to connect external and internal factors.
(2) Green input, mainly including capital input and technical staff input. The former one reflects emphasis and implementation of environmental protection, while the latter is key to ensuring deliveries and green competitive advantages.
(3) Green behaviors, namely a series of environmentally friendly actions. There are mainly four categories: Firstly, green product development, that is, relying on green technologies to develop new green products with less resource or energy consumption, emissions, and pollution. Secondly, green process improvement, including clean production and end-of-pipe management, that is, better new technologies, processes, and equipment are adopted to save energy and control pollution. Next is the research and development of green technologies so as to improve green competitiveness in pollution prevention and control. Finally, stronger green management. Through building up green corporate culture, staff training, and a green management system, employees can have and implement this concept with stronger green awareness and consciously fulfill their environmental responsibilities.
(4) Green benefits, namely, more environmental and economic benefits as a result of green behaviors. Specifically, environmental benefits are obvious in saving energy and reducing consumption, and further enhancing green image indirectly. However, economic benefits refer to revenue and profit increases, along with fewer costs and expenses.

2.2. Methods and Steps to Identify Influencing Factors

This paper adopts the widely recognized DEMATEL method to identify influencing factors of manufacturing enterprises’ green growth. Compared to methods such as structural equations, linear regression analysis, and system dynamics, the DEMATEL method can not only analyze the influence relationship between individual factors, but also show corresponding specific influence levels [14]. Simply, this method is powerful in simplifying intricate relationships. Firstly, the direct impact matrix is established by judging the logical relationships between factors in the system with the help of professional expertise and rich experience. The influence level of each factor on other factors and the degree of being influenced are analyzed using this matrix, thus calculating the centrality and the reason degree of each factor [15]. This helps to identify key influencing factors for system optimization decisions.
The major steps are as follows:
Firstly, selecting out influencing factors of green growth. As numerous relevant factors constrain and interact with each other, it is neither practical nor necessary to examine them one by one. Instead, “literature reference+ expert consultation” is more feasible to conduct preliminary screening and form the “alternative sets” { f 1 , f 2 ,   · · ·   , f n }, so as to have more sensible analysis and decisions from theoretical or practical perspectives.
Next is to determine the relationship between these factors through comparisons between each other. A panel of experts was invited to score each group from 0 and 4 according to “influence level”.
Corresponding figures are shown in Table 1.
Thirdly, direct impact matrix. Based on scores, direct impact matrix A of these influencing factors can be set up as A = a i j n × n ,   a i j representing the influence level of factor f i on factor f j .
The fourth step is to normalize the direct impact matrix so as to obtain the normalized influence matrix B: B = b i j n × n .
b i j = a i j × 1 max 1 i n j = 1 n   a i j   i , j = 1 ,   2 , ,   n
Then, the next step is to calculate the comprehensive impact matrix T according to the formula T = B I B 1 , where I is the unit matrix. That is, T = B I B 1 = [ t i j ] n n ,   t i j indicates the level of direct and indirect influence of factor f i on factor f j .
The sixth step is to calculate corresponding levels of influence and being influenced. According to the comprehensive impact matrix T, the relationship between each influencing factor is determined, specifically the influencing level D i and the level being influenced F i . The calculation formula is:
D i = j = 1 n t i j i = 1 ,   2 , ,   n
F i = i = 1 n t i j i = 1 ,   2 , ,   n
D i is a row-wise sum of the elements in T, which represents the comprehensive value of the influence level of X i on other factors.
F i is a column sum of the elements in T, which represents the comprehensive value of how much X i is influenced by other factors.
Finally, the centrality and reason degree of each factor are calculated. The formulas for the centrality H i and the reason degree J i are as follows:
H i = D i + F i i = 1 , 2 , , n
J i = D i F i i = 1 , 2 , , n
The centrality H i is the total sum of D i and F i , which indicates the position of the factor X i in the system. A larger H i indicates that X i has a higher position in the system and X i plays a larger role [16].
The reason degree J i is the difference between D i and F i . It indicates how the influence is realized among influencing factors, literally whether a factor is to influence or to be influenced. If J i > 0, it is called a reason factor, indicating that factor X i has a strong influence on other factors; but if J i < 0, it is called a result factor, indicating that factor X i is strongly influenced by other factors [17].
In summary, the DEMATEL method not only helps to identify key influencing factors, but also provides a preliminary analysis of the interaction mechanism among these factors according to centrality and reason degree, thus providing a reference for exploring the green growth mechanism of manufacturing enterprises.

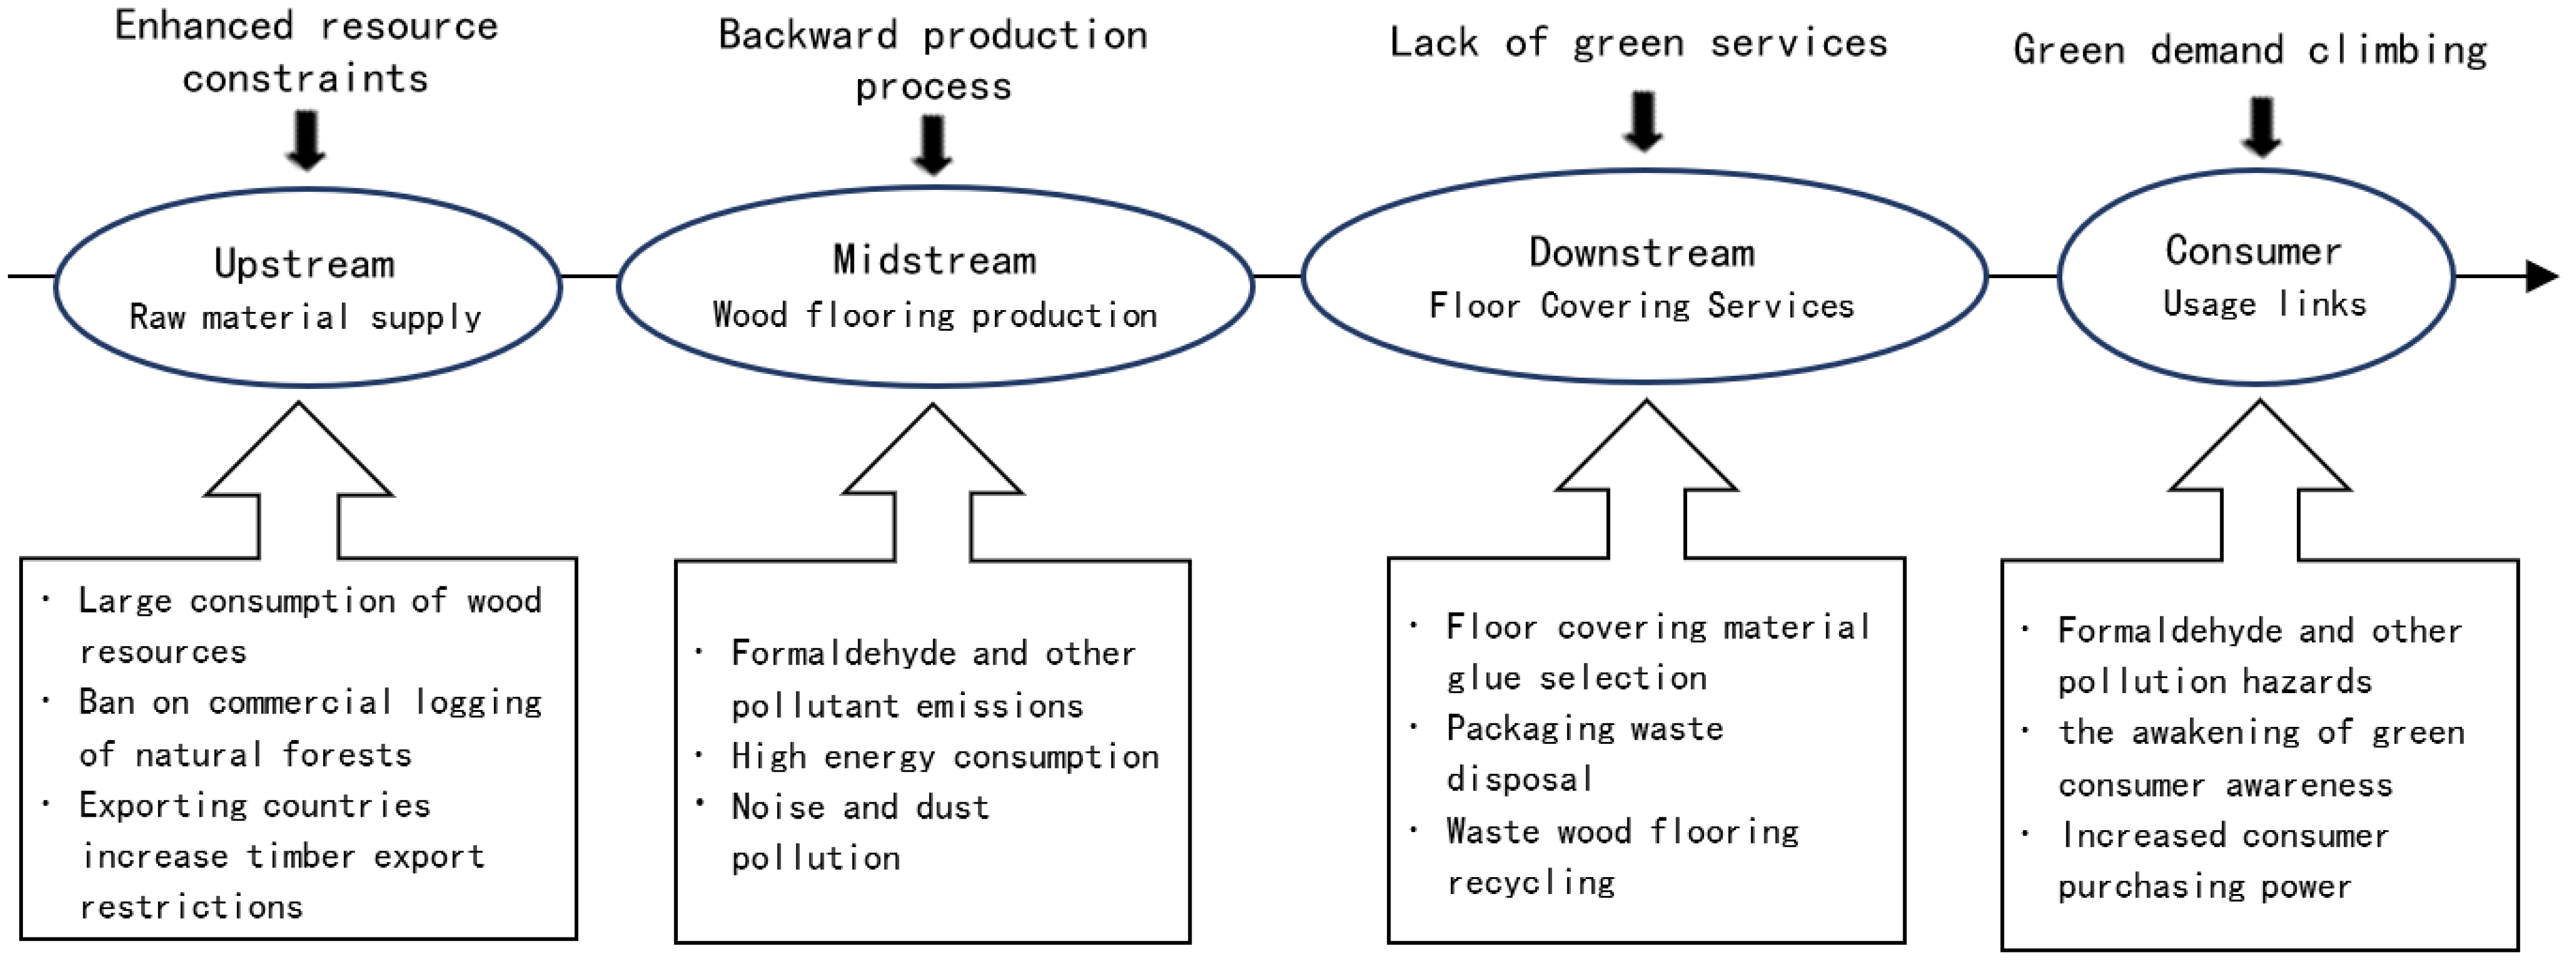
3. Empirical Analysis of Wooden Flooring Manufacturing Enterprises as a Case

Wooden flooring manufacturing is a typical traditional type. This industry in China grew rapidly from the 1980s, with an average production scale of 400 million m2 for many years and an annual output value of nearly 100 billion RMB, making China the world’s largest producer and consumer of wooden flooring [18]; however, along with rapid expansion, this industry also faces some environmental problems that cannot be ignored or yet to be fundamentally solved, especially low resource utilization, high unit energy consumption, harmful emissions, free formaldehyde residues [19]. The environmental pressure and utilization chain are shown in Figure 2.
Concerning increasing pressure on resources and the environment, the consumer demand for green wooden flooring products is growing. Faced with both challenges and opportunities brought by “greenness”, enterprises urgently need to identify and grasp key influencing factors of green growth so as to empower their sustainable growth [20].

3.1. The Main Factors Influencing Green Growth of Wooden Flooring Manufacturing Enterprises

Berry and Rondinelli [21] held that government, customer, employee, and competitor pressure are driving enterprises’ shift to proactive environmental management. Bansal and Roth [22] proposed competitiveness, legitimacy, and ecological responsibility as three main elements leading to the ecological responsiveness of enterprises. Zhu [23] identified through factor analysis that corporate awareness of laws and regulations, environmental strategies, supply chain pressure, market demand, and the cost of green activities are the major factors of pressure/motivation and practice of green supply chain management in companies, also pointed out that green supply chain management had become an effective means for companies to improve their competitiveness. Hao et al. [24] used the “entropy decision model” to investigate 30 enterprises and concluded that expected benefits, environmental regulations, ecological environment, cluster network characteristics, and corporate social responsibility are key factors affecting green behavior decisions of enterprises in resource-based industrial clusters. Jiang [25] found through an empirical study that demand pressure, competitive pressure, policy opportunities, demand opportunities, and competitive opportunities all contribute to green performance. Furthermore, Zeng [18] also found through an empirical study that command-and-control policy instruments in environmental regulation, international market pull in demand-pull factors, and ISO14001-certified firms in supply-side factors are all key factors influencing enterprises to engage in green innovations.
Based on relevant literature and characteristics, together with many rounds of discussions by the CGE, a prepared set of factors influencing the green growth of wooden flooring manufacturing enterprises was formed as follows.
(1) Policies, basically government policy support and environmental standard constraints. The former mainly promotes enterprises to adopt green behaviors and implement green growth through favorable, subsidy, and incentive policies; the latter sets relevant environmental standards to constrain and regulate enterprises’ behaviors [26].
(2) Industry, such as green market demand, market competition, green technology advancement, and local support. Among them, green market demand is a necessary precondition for green growth, which is mainly reflected comprehensively by population, purchasing power, and purchasing desire. Moreover, market competition mainly focuses on the status of competition between various industrial chains, with wooden flooring manufacturing enterprises as the core. Green technology advancement is crucial to support green innovations and a decisive factor for quality “greenness” [27]. In terms of local support, namely industrial support and other “hardware and software” in the area where an enterprise is located, it provides protection to enterprises’ green growth. Specifically, such support includes public service facilities, production factors’ trading market, logistics’ supporting network, local economy, and government–industry–university–research cooperation and innovation, along with industrial information environment.
(3) Industrial chain. This mainly refers to the green synergy of enterprises in the industry chain, which is represented by their cooperation level, the “green requirements” for wooden flooring manufacturing enterprises, and response levels of upstream and downstream enterprises.
(4) Green behavior willingness. It demonstrates how strong enterprises’ readiness are to adopt green behaviors, which is the key link to transforming the “external factors” of green growth into “internal ones”.
(5) Green input. This shows the quantity and quality of input resources and generates economic and environmental benefits through the process of “green input—green output”, which is mainly reflected by the green input intensity (such as upgrading green products, manufacturing processes, production equipment, end-of-pipe pollution control, etc.) and the number of technicians.
(6) Green management level. Led by the sustainable development idea, environmental protection is integrated into the whole process of enterprise production and operation so as to control pollution, save resources, shape the green image, and finally achieve sustainable growth of enterprises embodied in “green” comprehensive management capacity. To define such a level, symbol factors mainly refer to green strategies and their implementation, higher green quality of products, and enterprises’ green images.
(7) Green output. This refers to outcomes of enterprises’ green governance and green R&D through green inputs; for example, the number of patent applications, especially invention patents that can reflect the comprehensive strength of enterprise scientific research, which can be used as an important indicator reflecting green outputs.
Building a Direct Impact Matrix.Firstly, the major influencing factors of wooden flooring manufacturing enterprises’ green growth are named and listed in Table 2.
Next, a panel of nine professionals in business growth and green development was established, including four university professors, two researchers from research institutions, two senior consultants from consulting organizations, and one top executive from a wooden flooring manufacturing enterprise. They were invited to evaluate the above 14 influencing factors and score them according to Table 1, thus forming the quantitative relationship values between these factors. Each set of quantified influence relationship values indicates the direct effect of an influencing factor on another.
Finally, the experts’ scores are averaged and rounded to form a direct impact matrix A . Then A is sent back to experts for confirmation and correction so as to gain direct impact matrix A, as shown in Table 3.

3.2. Calculations and Results

3.2.1. The Comprehensive Influence Matrix

Based on matrix A, the normalized influence matrix B is calculated according to Equation (1). Then, according to T = B I B 1 = [ t i j ] n n , the comprehensive influence matrix T is obtained, as shown in Table 4.

3.2.2. The Levels of Influence, Being Influenced, the Reason Degree, and Centrality

According to Equations (2)–(5), the levels of influence, being influenced, reason degree, and centrality of each factor are calculated, respectively [18], as shown in Table 5.
Based on Table 5, factors’ positions in the plane coordinate system were marked to form a diagram of their integrated influence relationship. In this figure, centrality is the horizontal coordinate, reason degree is the vertical coordinate, the intersection of the horizontal and vertical coordinates is [k,0], and the distances from k to the maximum and minimum values of centrality are equal—see Figure 3.

3.3. Analysis of Results

By calculating factors in comprehensive influence matrix T, the levels of influence, being influenced, reason degree, and centrality of each factor are derived. Through further analysis of the results, the following conclusions were obtained.
(1) In terms of reason degree, each factor has positive and negative values, which indicates that how each factor influences wooden flooring manufacturing enterprises’ green growth is complicated. Among them, f 1 f 7 are positive or reason factors and f 8 f 14   are negative or result factors.
Reason factors (reason level greater than 0) are Green Market Demand f 3 > Environmental Standard Constraints f 2 > Government Policy Support f 1 , Market Competition f 4 > Upstream and Downstream Green Synergy f 7 > Green Technology Advancement f 5 > Local Support f 6 according to importance.
Result factors (reason level lower than 0) can contribute to green growth through the influence exerted by reason factors.
(2) Concerning centrality, Green Behavior Willingness f 8 demonstrates the largest value. Other influencing factors with a centrality level greater than 4 are Product Green Quality   f 12 , Green Input Intensity f 9 , and Green Strategy Formulation and Implementation f 11 , which should be the focus of corporate management.
(3) According to Figure 3, Environmental Standard Constraints f 2 , Green Market Demand f 3 , Market Competition f 4 , Green Technology Advancement f 5 , Upstream and Downstream Green Synergy f 7 in the first quadrant and are Driving Factors, with the greatest influence and most critical role in promoting the green growth of wooden flooring manufacturing enterprises [28,29,30].
Government Policy Support f 1 and Local Support f 6 in the second quadrant are called Voluntariness, which plays a supportive role in the model. Specifically, Local Support f 6 has the lowest centrality value, indicating that this factor has little influence on wooden flooring manufacturing enterprises’ green growth, which is the same as its reason level. As result, this factor can be excluded from the analysis. The reason level of Government Policy Support f 1 is higher with a certain centrality level, which will promote green growth.
Located in the fourth quadrant, Green Behavior Willingness f 8 , Green Input Intensity f 9 , Number of Technical Staff f 10 , Green Strategy Formulation and Implementation f 11 , Product Green Quality f 12 , Corporate Green Image f 13 , and Number of Patent Applications f 14 are called Core Problems. They are key elements vulnerable to other factors’ influence, which are involved in different ways in enterprise production and operation to promote green growth. Among them, Green Behavior Willingness f 8 is crucial to connect enterprises’ external motivating factors and internal influencing factors by transforming external motivation into internal actions.
To sum up, six factors, namely environmental standard constraints, green market demand, market competition, green technology advancement, upstream and downstream green synergy, and government policy support, work together to enhance enterprises’ willingness to conduct green behaviors, then generating green benefits to promote green growth of wooden flooring manufacturing enterprises. Therefore, driven by the ultimate goal of profit maximization, the above six factors provide the most important external support for the green growth of enterprises, especially the key driving force for wooden flooring manufacturing ones.

4. Conclusions

The green growth of manufacturing enterprises is certainly affected by interactions and joint influence of multiple factors, which is very complex and challenging to analyze the corresponding relationship.
This study uses the DEMATEL method to identify factors influencing the green growth of wooden flooring manufacturing enterprises, concluding with six factors, namely environmental standard constraints, green market demand, market competition, green technology advancement, upstream and downstream green synergy, together with government policy support as reason factors. They are the most important external support for enterprises’ green growth, particularly major driving factors for wooden flooring manufacturing ones.
The DEMATEL method is relatively easy to operate and can generate clear and straightforward outcomes; however, there are also limitations, such as the subjective part of experts’ scores and relatively few samples. In future studies, a larger scope and more samples can be utilized to obtain more reliable data. Apart from the DEMATEL method, fuzzy sets theory and the interpretative structural modeling method (ISM) can also be used to further analyze factors influencing the green growth of manufacturing enterprises [31].

Author Contributions

Conceptualization, W.L. and X.W.; methodology, W.L.; software, W.L.; validation, W.L. and X.W.; formal analysis, X.W.; investigation, W.L.; re-sources, W.L.; data curation, X.W.; writing—original draft preparation, W.L.; writing—review and editing, X.W.; visualization, W.L. and X.W.; supervision, X.W.; project administration, W.L.; funding acquisition, W.L. All authors have read and agreed to the published version of the manuscript.

Funding

This research was funded by the Research Project of Beijing Union University “Research on financial support for green technology innovation in manufacturing enterprises in Beijing, Tianjin and Hebei” (grant number: SK30202102).

Data Availability Statement

The data used to support findings in this study are available from corresponding authors upon request.

Acknowledgments

Appreciation to BUU for funding support. Thanks to the expert panel members for their professional ratings. Thanks to the reviewers for their rigorous review comments. We also thank the editors for their hard work in revising and typesetting.

Conflicts of Interest

The authors declare no conflict of interest.

References

  1. Liu, W. Economic Growth and the Goal of Well-Off Society in an All-Round Way under the Impact of Epidemic Situation. J. Manag. World 2020, 36, 1–8. [Google Scholar]
  2. He, W.B. Countermeasures for Digital Economy to Promote the Upgrading of China’s Manufacturing Industry under the Visual of Global-Value-Chain. Asia Pac. Econ. Rev. 2020, 3, 115–130. [Google Scholar]
  3. Kong, D.J.; Yan, J.L.; Yang, X.Y.; Qu, X.M. A Study on the Issues of Conducting China’s Manufacturing Power Strategy. Chin. J. Eng. Sci. 2017, 3, 6–13. [Google Scholar]
  4. Shi, D.; Li, P. Quality Evolution and Assessment of China’s Industry over the Past Seven Decades. China Ind. Econ. 2019, 9, 5–23. [Google Scholar]
  5. Gao, Q.S.; Li, T. Progress and Review in ‘China Manufacturing 2025’. J. Ind. Technol. Econ. 2018, 10, 59–66. [Google Scholar]
  6. Lin, H.; Hsu, I.; Lin, T.; Tung, L.; Ling, Y. After the Epidemic, Is the Smart Traffic Management System a Key Factor in Creating a Green Leisure and Tourism Environment in the Move towards Sustainable Urban Development? Sustainability 2022, 14, 3762. [Google Scholar] [CrossRef]
  7. Shen, L.; Fan, R.; Wang, Y.; Yu, Z.; Tang, R. Impacts of Environmental Regulation on the Green Transformation and Upgrading of Manufacturing Enterprises. Int. J. Environ. Res. Public Health 2020, 17, 7680. [Google Scholar] [CrossRef]
  8. Liu, X.; Tong, D.; Huang, J.; Zheng, W.; Kong, M.; Zhou, G. What Matters in the E-commerce Era? Modelling and Mapping Shop Rents in Guangzhou, China. Land Use Policy 2022, 123, 106430. [Google Scholar] [CrossRef]
  9. Qiu, L.; Jie, X.W.; Wang, Y.N.; Zhao, M.J. Green Product Innovation, Green Dynamic Capability, and Competitive Advantage: Evidence from Chinese Manufacturing Enterprises. Corp. Soc. Responsib. Environ. Manag. 2020, 27, 146–165. [Google Scholar] [CrossRef]
  10. Hong, D.Y. Economic Growth, Environmental Protection and Ecological Modernization: A Perspective from Environmental Sociology. Soc. Sci. China 2012, 9, 82–99. [Google Scholar]
  11. Qu, C.; Shao, J.; Cheng, Z.H. Can Embedding in Global Value Chain Drive Green Growth in China′s Manufacturing Industry? J. Clean. Prod. 2020, 268, 121962. [Google Scholar] [CrossRef]
  12. Alfaro, M.; Teresa, B.; Diaz, R.A. Impact of Green Initiatives on the Financial Performance of Small and Medium Enterprises: The Case of Manufacturing Firm in Central Luzon. Work. Pap. Oper. Manag. 2021, 12, 28–41. [Google Scholar] [CrossRef]
  13. Seth, D.; Rehman, M.A.A.; Shrivastava, R.L. Green Manufacturing Drivers and Their Relationships for Small and Medium (SME) and Large Industries. J. Clean. Prod. 2018, 198, 1381–1405. [Google Scholar] [CrossRef]
  14. Zhu, F.F.; Hu, H.; Xu, F. Risk Assessment Model for International Construction Projects Considering Risk Interdependence Using the DEMATEL Method. PLoS ONE 2022, 17, e0265972. [Google Scholar] [CrossRef] [PubMed]
  15. Yuan, T.; Wang, G.H.; Zhou, J.L. Evaluation on Growth of Enterprises in Technological-Cluster: From Perspective of Social Capital. Technol. Econ. 2014, 6, 1–6. [Google Scholar]
  16. Yang, W. Green Growth Key Influence Factors Study of 3PL Enterprises in China; Dalian University of Technology: Dalian, China, 2017. [Google Scholar]
  17. Ma, L.R.; Ma, D.C.; Li, X.F. Analysis on Influence Factors of Characteristic Agricultural Product Environmental Logistics Development Based on the DEMATEL in Gansu Province. Logist. SciTech 2016, 3, 102–105. [Google Scholar]
  18. Zeng, Y.Q. International Wood Industry. Int. Wood Ind. 2015, 10, 4–7. [Google Scholar]
  19. Lu, P.; Wen, Y.; Li, Z.H.; Ding, Y.; Chen, X.Y.; Han, L.L. The Impacts of Environmental Regulation on Regional Green Productivity Growth in China: From the Perspective of Local-neighborhood Effects. Econ. Res. Ekon. Istraz. 2022. [Google Scholar] [CrossRef]
  20. Wang, M.; Yin, S.; Lian, S. Collaborative Elicitation Process for Sustainable Manufacturing: A Novel Evolution Model of Green Technology Innovation Path Selection of Manufacturing Enterprises under Environmental Regulation. PLoS ONE 2022, 17, e0266169. [Google Scholar] [CrossRef] [PubMed]
  21. Berry, M.A.; Rondinelli, D.A. Proactive Corporate Environmental Management: A New Industrial Revolution. AMP 1998, 2, 38–50. [Google Scholar] [CrossRef] [Green Version]
  22. Bansal, P.; Roth, K. Why Companies Go Green: A Model of Ecological Responsiveness. Acad. Manag. J. 2000, 4, 717–736. [Google Scholar] [CrossRef]
  23. Zhu, Q.H. Models and Approaches of Green Supply Chain Based Product Eco-Design. Chin. J. Manag. 2008, 3, 360–365. [Google Scholar]
  24. Hao, Z.T.; Yan, L.; Xie, X.B.; Duan, X.H. Identification and Analysis on Critical Influential Factors of Green Behavior Decision-making for Enterprises in Resource-Based Industry Cluster. China Popul. Resour. Environ. 2014, 10, 170–176. [Google Scholar]
  25. Jiang, S.Y. The Impact of External Environmental Pressures and Perceived Opportunities on Corporate Green Performance. Sci. Technol. Prog. Policy 2015, 11, 72–76. [Google Scholar]
  26. Qian, Y.; Liu, J.; Forrest, J.; Lin, Y. Impact of Financial Agglomeration on Regional Green Economic Growth: Evidence from China. J. Environ. Plan. Manag. 2022, 65, 1611–1636. [Google Scholar] [CrossRef]
  27. Corrocher, N.; Malerba, F.; Morrison, A. Technological Regimes, Patent Growth, and Catching-up in Green Technologies. Ind. Corp. Chang. 2021, 30, 1084–1107. [Google Scholar] [CrossRef]
  28. Cuang, H.M.; Lin, C.K.; Chen, D.R.; Chen, Y.S. Evolving MCDM Applications Using Hybrid Expert based ISM and DEMATEL Models: An Example of Sustainable Ecotourism. Sci. World J. 2013, 2013, 751728. [Google Scholar]
  29. Lee, Y.C.; Li, M.L.; Yen, T.M.; Huang, T.H. Analysis of Adopting an Integrated Decision Making Trial and Evaluation Laboratory on a Technology Acceptance Model. Expert Syst. Appl. 2010, 37, 1745–1754. [Google Scholar] [CrossRef]
  30. Wu, K.J.; Liao, C.J.; Tseng, M.L.; Chiu, A.S.F. Exploring Decisive Factors in Green Supply Chain Practices under Uncertainty. Int. J. Prod. Econ. 2015, 159, 147–157. [Google Scholar] [CrossRef]
  31. Jalilibal, Z.; Bozorgi-Amiri, A. A Hybrid Grounded Theory, Fuzzy DEMATEL and ISM Method for Assessment of Sustainability Criteria for Project Portfolio Selection Problems. Iran. J. Manag. Stud. 2022, 15, 425–442. [Google Scholar]
Figure 1. Conceptual model of the main factors influencing green growth.
Processes 10 02594 g001
Figure 2. Environmental pressure from manufacturing to consumption.
Processes 10 02594 g002
Figure 3. Schematic diagram of comprehensive impacting factors.
Processes 10 02594 g003
Table 1. Judgment basis of impact degree.
Influence LevelNo influenceLittle InfluenceModerate InfluenceStronger InfluenceHuge Influence
Score01234
Table 2. The main factors impacting the green growth of wooden flooring manufacturing companies.
DimensionalityImpact Factors
PolicyGovernment Policy Support f 1 , Environmental Standard Constraints f 2
Industrial environmentGreen Market Demand f 3 , Market Competition f 4 ,
Green Technology Advancement f 5 , Local Support f 6
Industry ChainGreen Synergy Between Industry Upstream and Downstream f 7
Green Behavior WillingnessGreen Behavior Willingness f 8
Green InputGreen Input Intensity f 9 , Number of Technical Staff f 10
Green Management LevelGreen Strategy Formulation and Implementation f 11 , Product Green Quality f 12 ,
Corporate Green Image f 13
Green OutputNumber of Patent Applications f 14
Table 3. The direct impact matrix A.
f 1 f 2 f 3 f 4 f 5 f 6 f 7 f 8 f 9 f 10 f 11 f 12 f 13 f 14
Government Policy Support f 1 00121224313332
Environmental Standard Constraints f 2 00234224424433
Green Market Demand f 3 22043234424443
Market Competition f 4 13003234434443
Green Technology Advancement f 5 04220214433323
Local Support f 6 10212001111101
Green Synergy Between Industry Upstream and Downstream f 7 23221104314432
Green Behavior Willingness f 8 11021130444443
Green Input Intensity f 9 00022013042334
Number of Technical Staff f 10 00011001202323
Green Strategy Formulation and Implementation f 11 11011023430432
Product Green Quality f 12 00121023323042
Corporate Green Image f 13 00010013323202
Number of Patent Applications f 14 00023002222440
Table 4. The comprehensive influence matrix T.
f 1 f 2 f 3 f 4 f 5 f 6 f 7 f 8 f 9 f 10 f 11 f 12 f 13 f 14
f 1 0.02150.03630.04440.11650.08400.07120.10850.20580.19180.12640.18380.19760.19260.1485
f 2 0.02880.05590.07820.16940.18140.08320.13200.25330.26550.19160.25260.27300.24150.2144
f 3 0.07880.10680.03470.20190.16700.08820.16470.27190.28340.20390.27070.29190.28220.2282
f 4 0.04990.12040.03260.09760.15560.08080.15130.25070.26230.21070.25050.27070.26080.2122
f 5 0.02470.13760.07460.13760.08380.07930.09960.23370.24550.19790.21280.23220.20090.1999
f 6 0.03450.02120.05890.06040.07940.01510.03100.08100.08480.07340.08000.08740.06120.0748
f 7 0.07240.11400.07380.13610.10220.05640.07890.23580.22370.14980.23550.25210.22350.1734
f 8 0.04480.06190.02330.12400.09190.04770.13430.12910.22850.20590.21930.23740.23070.1854
f 9 0.01480.03090.01550.10510.09830.01870.07260.16420.10510.18040.14430.18100.17670.1805
f 10 0.00840.01740.00920.06070.05670.01030.03150.08460.11210.05660.10650.13860.11530.1247
f 11 0.03950.05340.01830.08750.07780.02010.10020.17230.20190.16280.10450.20840.18280.1418
f 12 0.01790.03230.03860.10590.07470.01960.09870.16750.17550.13640.16830.11270.19860.1361
f 13 0.01210.02030.00980.06620.03790.01200.06110.13800.14520.11340.13930.12880.07940.1120
f 14 0.01240.02900.01500.09880.11370.01750.04680.13470.14240.12740.13460.18870.18650.0800
Table 5. D i , F i , H i , J i of each index.
Factor D i F i J i H i
Government Policy Support f 1 1.72890.46071.26822.1896
Environmental Standard Constraints f 2 2.42070.83741.58333.2581
Green Market Demand f 3 2.67430.52702.14733.2014
Market Competition f 4 2.40611.56760.83853.9736
Green Technology Advancement f 5 2.16001.40440.75563.5644
Local Support f 6 0.84320.62020.22301.4634
Green Synergy Between Industry Upstream and Downstream f 7 2.12771.31120.81653.4389
Green Behavior Willingness f 8 1.96422.5225−0.55844.4867
Green Input Intensity f 9 1.48812.6678−1.17974.1558
Number of Technical Staff f 10 0.93252.1365−1.20403.0690
Green Strategy Formulation and Implementation f 11 1.57142.5027−0.93134.0740
Product Green Quality f 12 1.48282.8004−1.31764.2832
Corporate Green Image f 13 1.07542.6327−1.55733.7080
Number of Patent Applications f 14 1.32772.2120−0.88433.5397
Publisher’s Note: MDPI stays neutral with regard to jurisdictional claims in published maps and institutional affiliations.

