
Effect of Groundwater Depression Cone on the Hydrochemical Evolution Process in the People’s Victory Canal Irrigation Area, China

Abstract
:1. Introduction
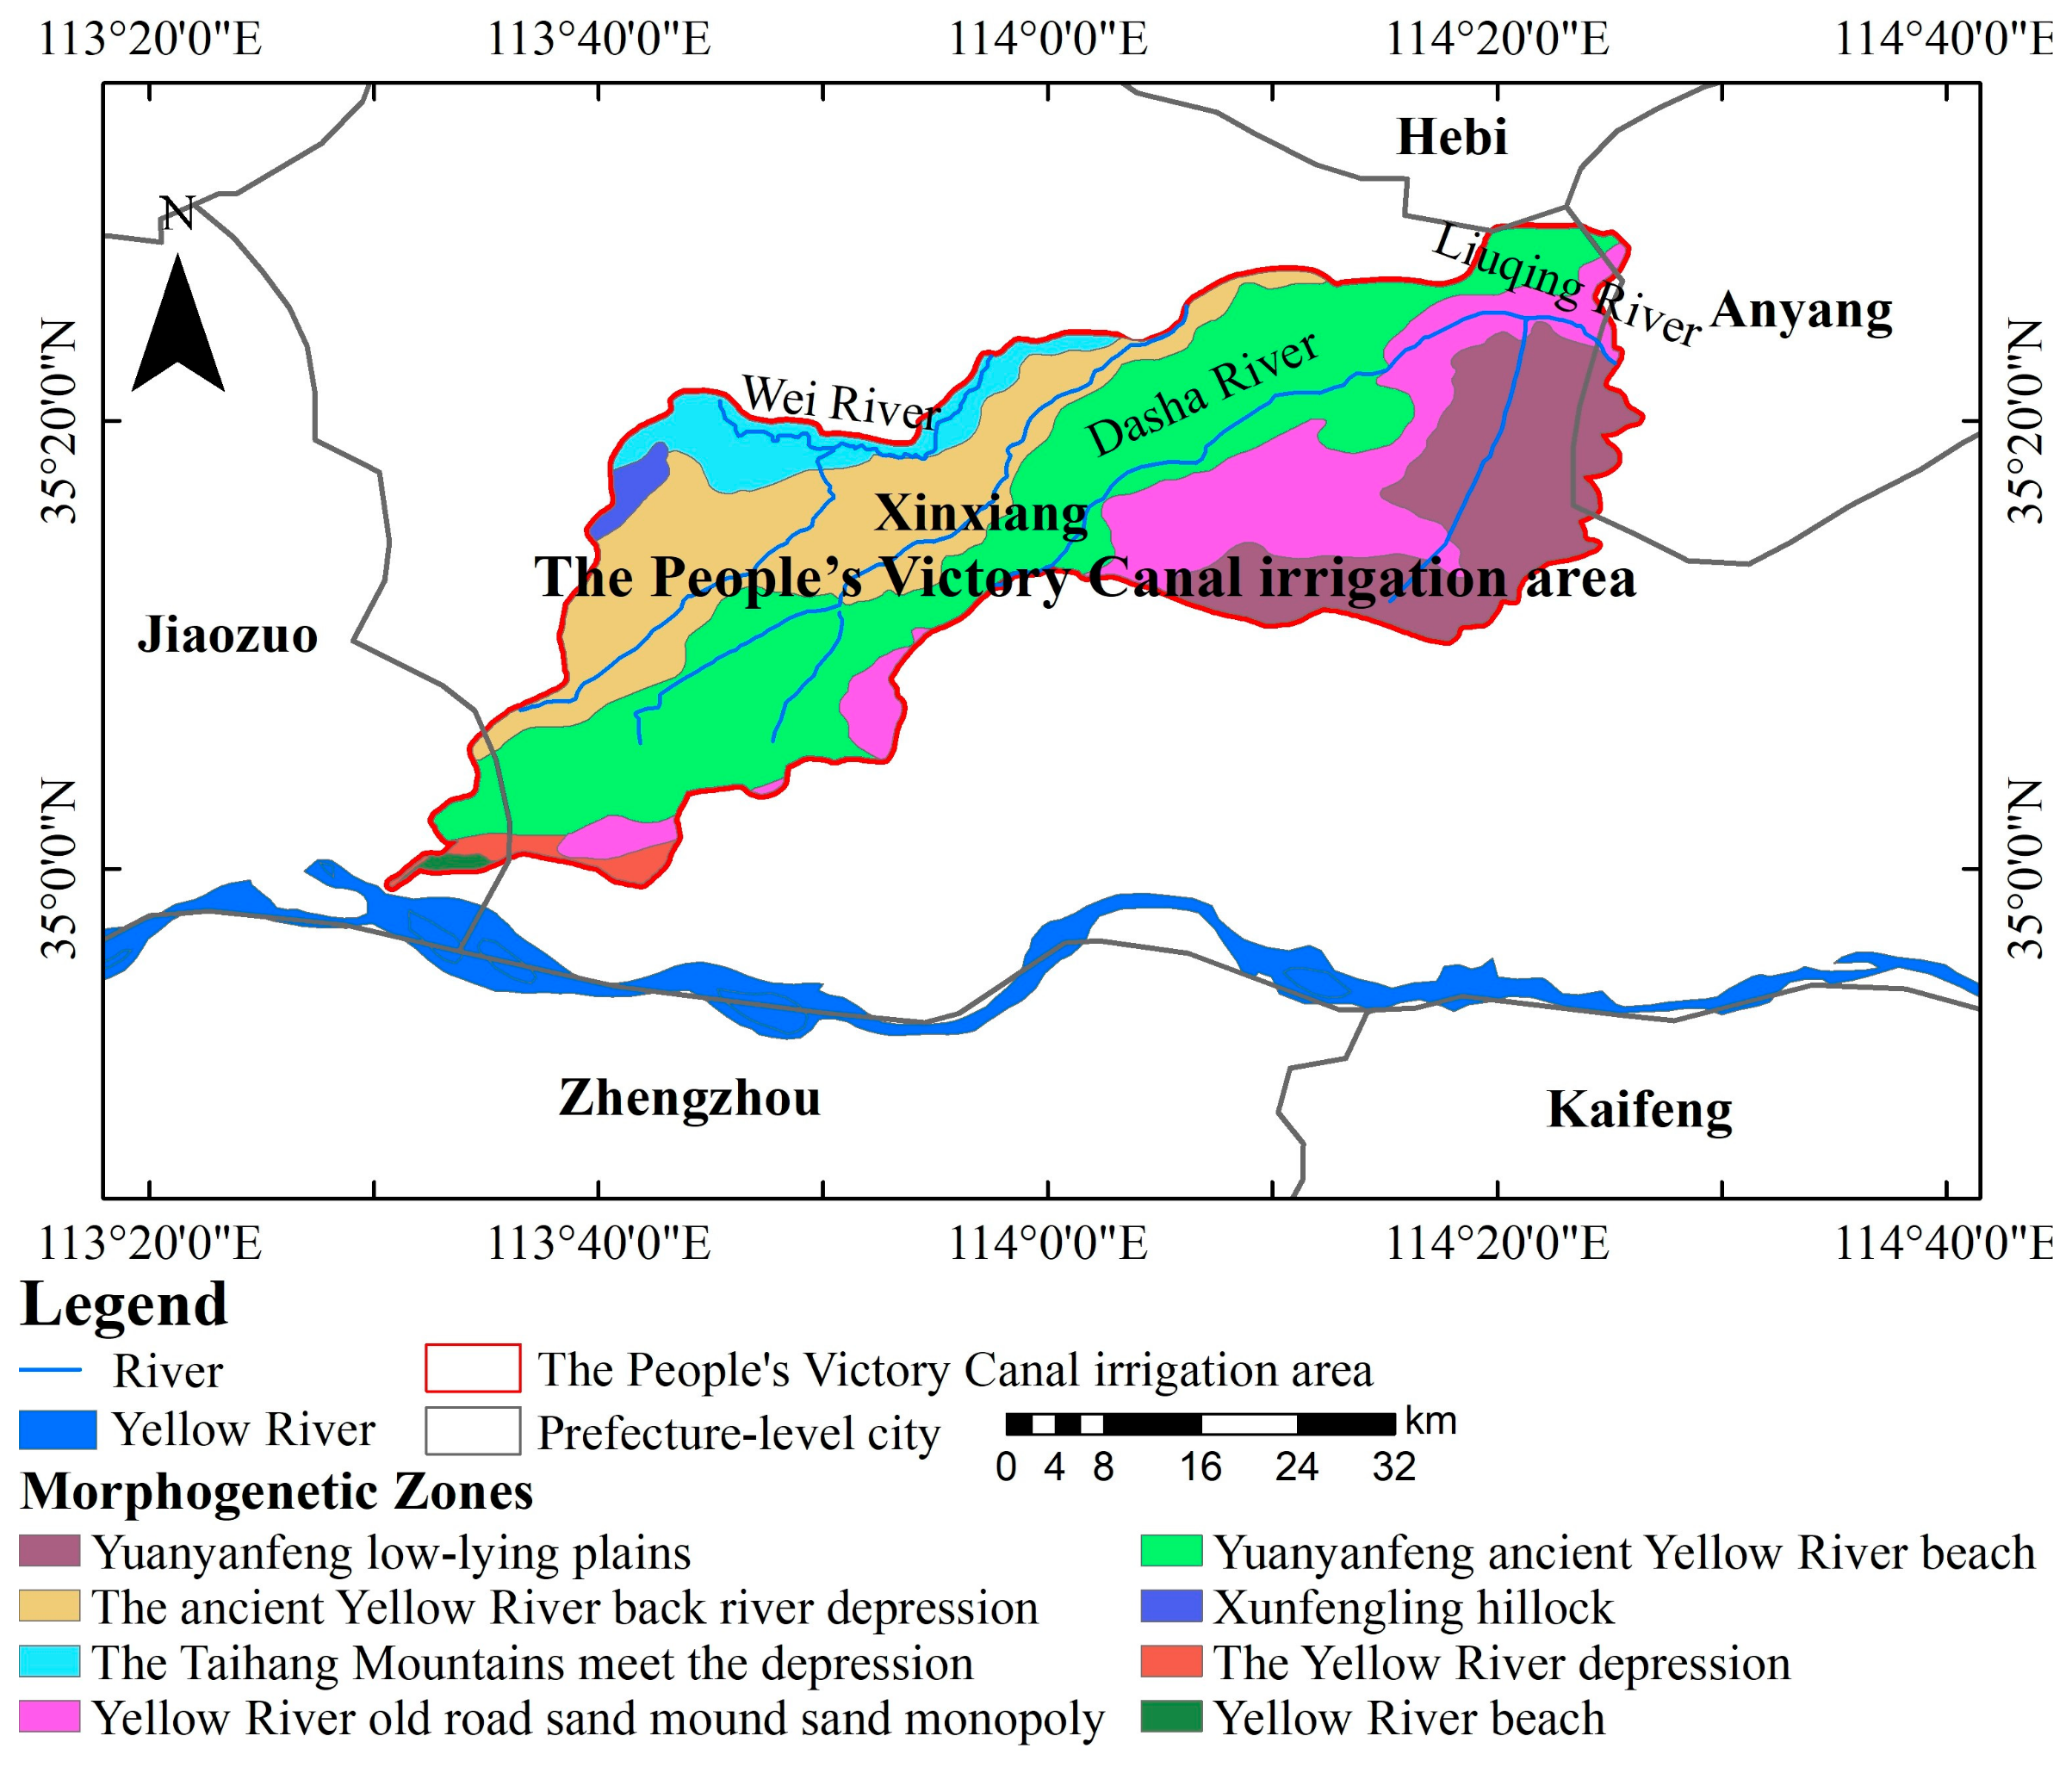
2. Study Area
3. Materials and Methods
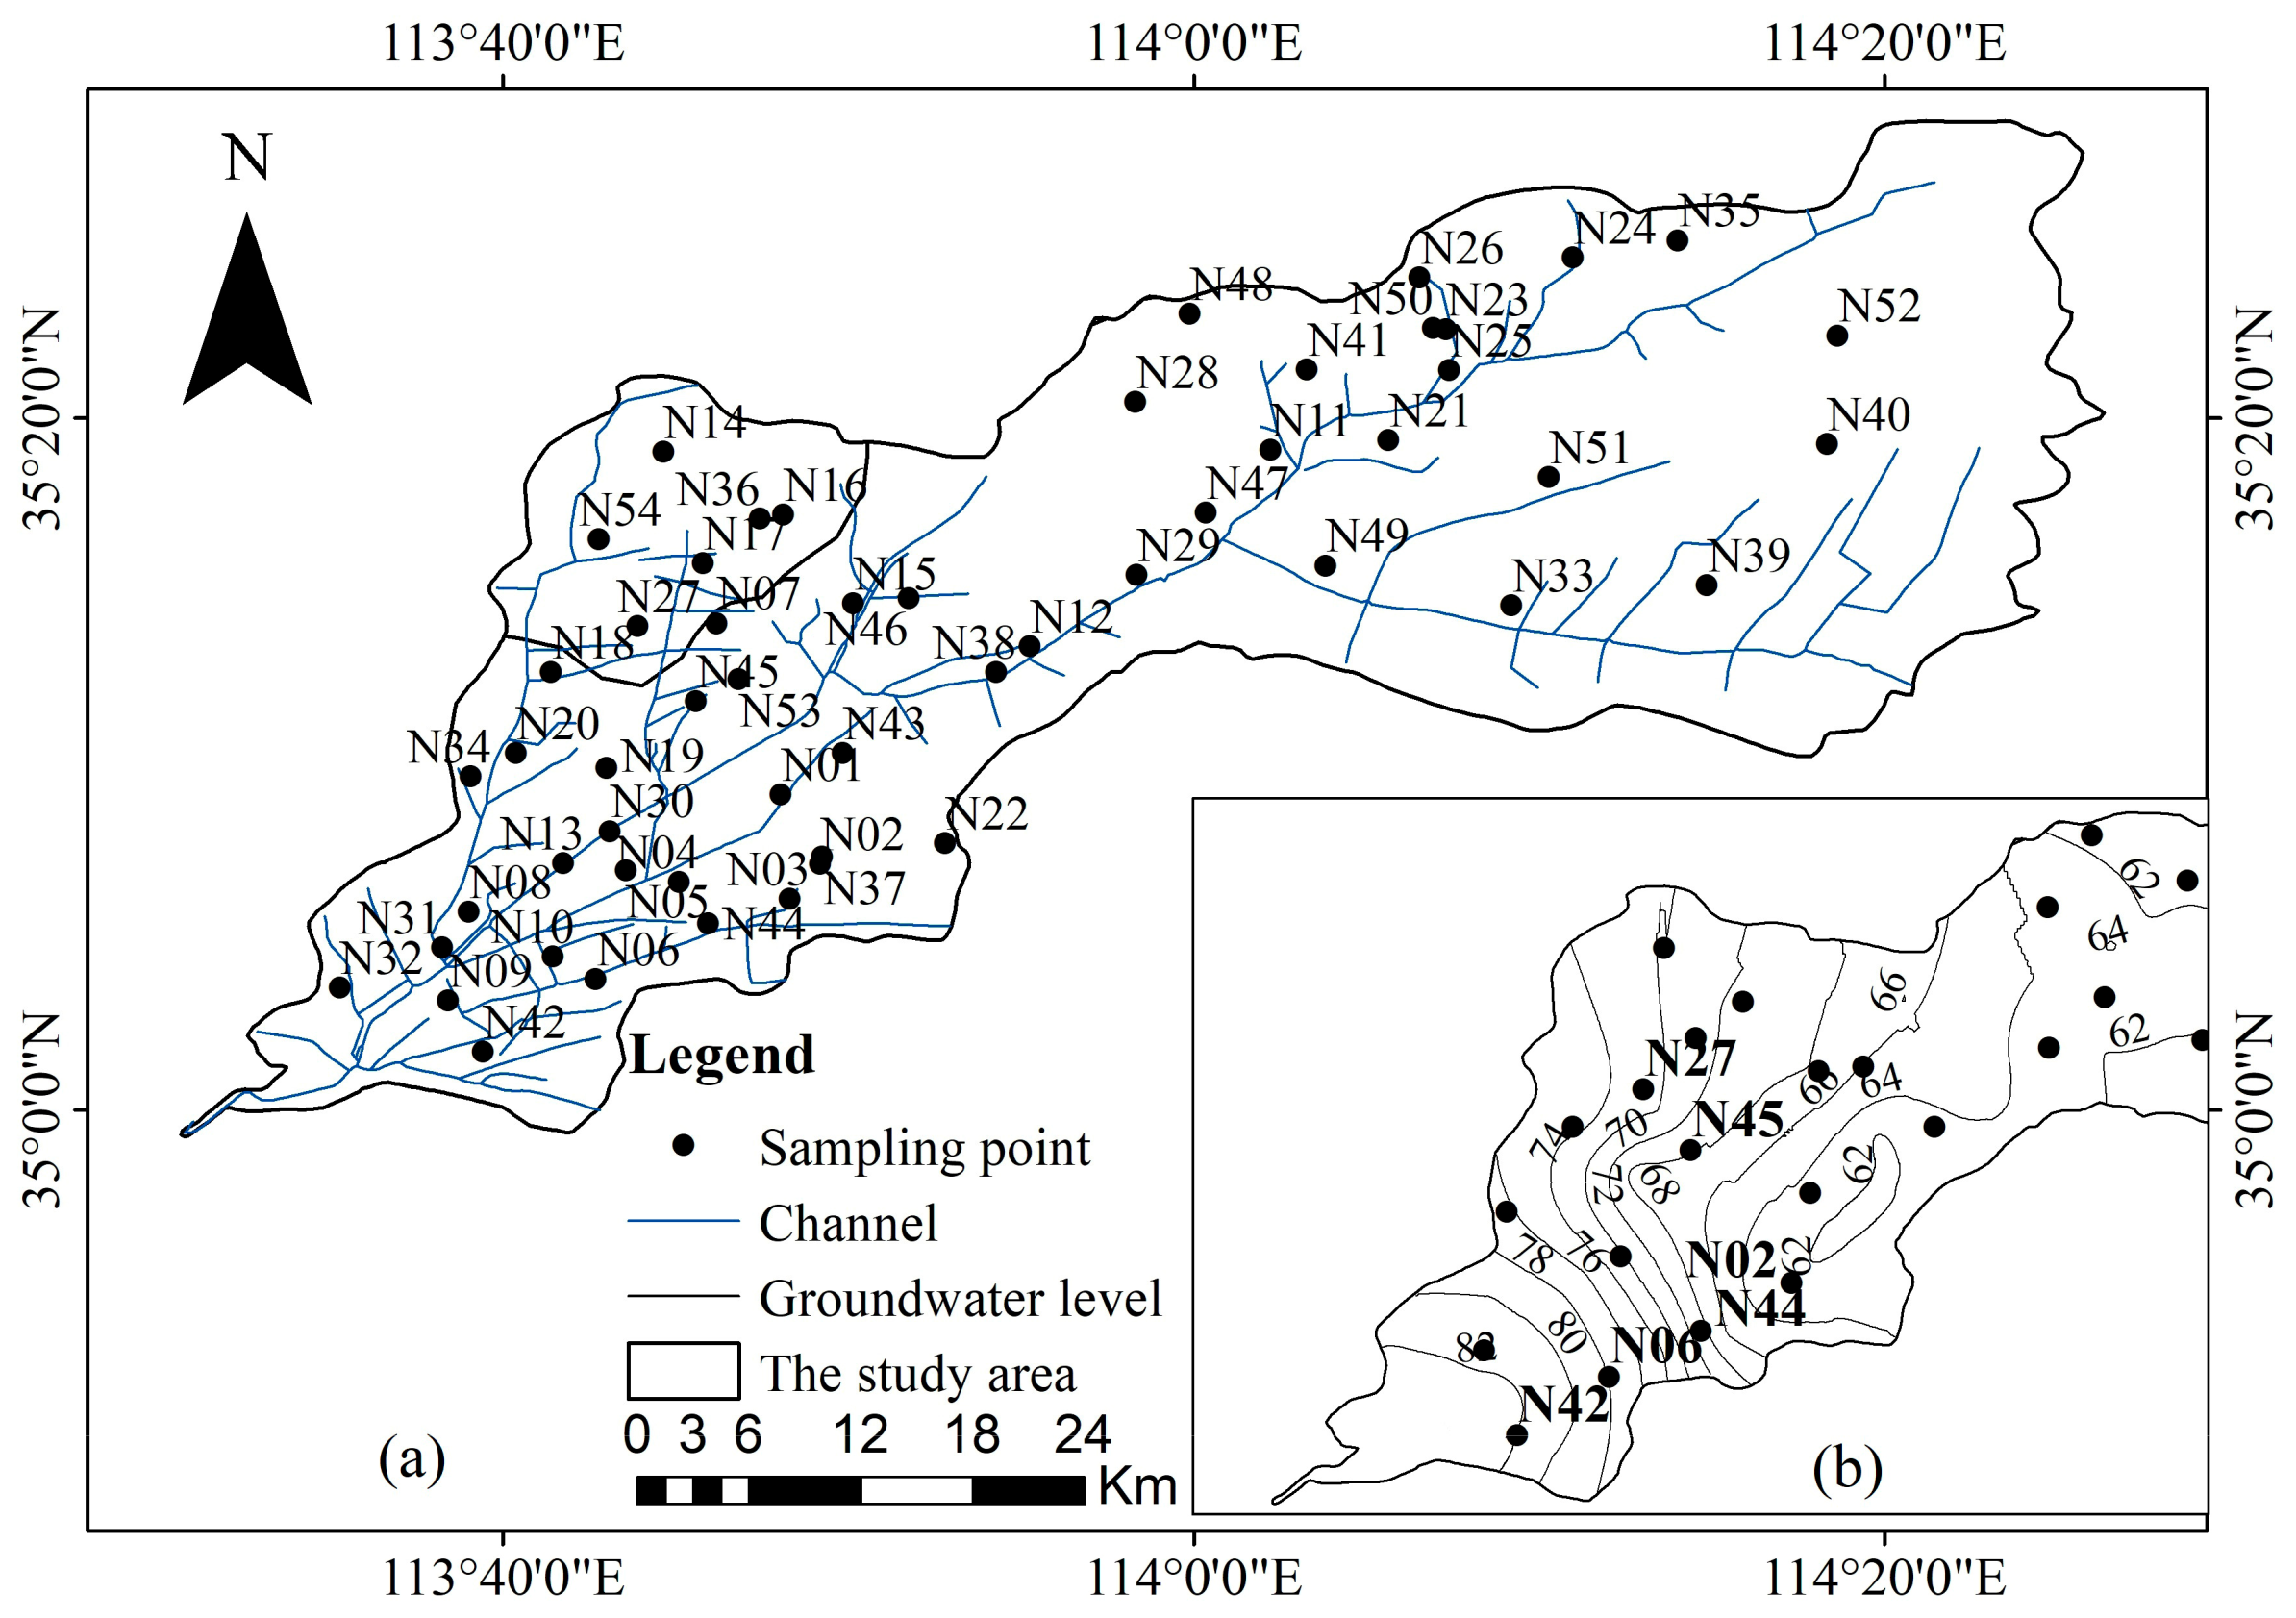
3.1. Sampling and Measurement
3.2. Data Processing and Analysis
4. Results and Discussion
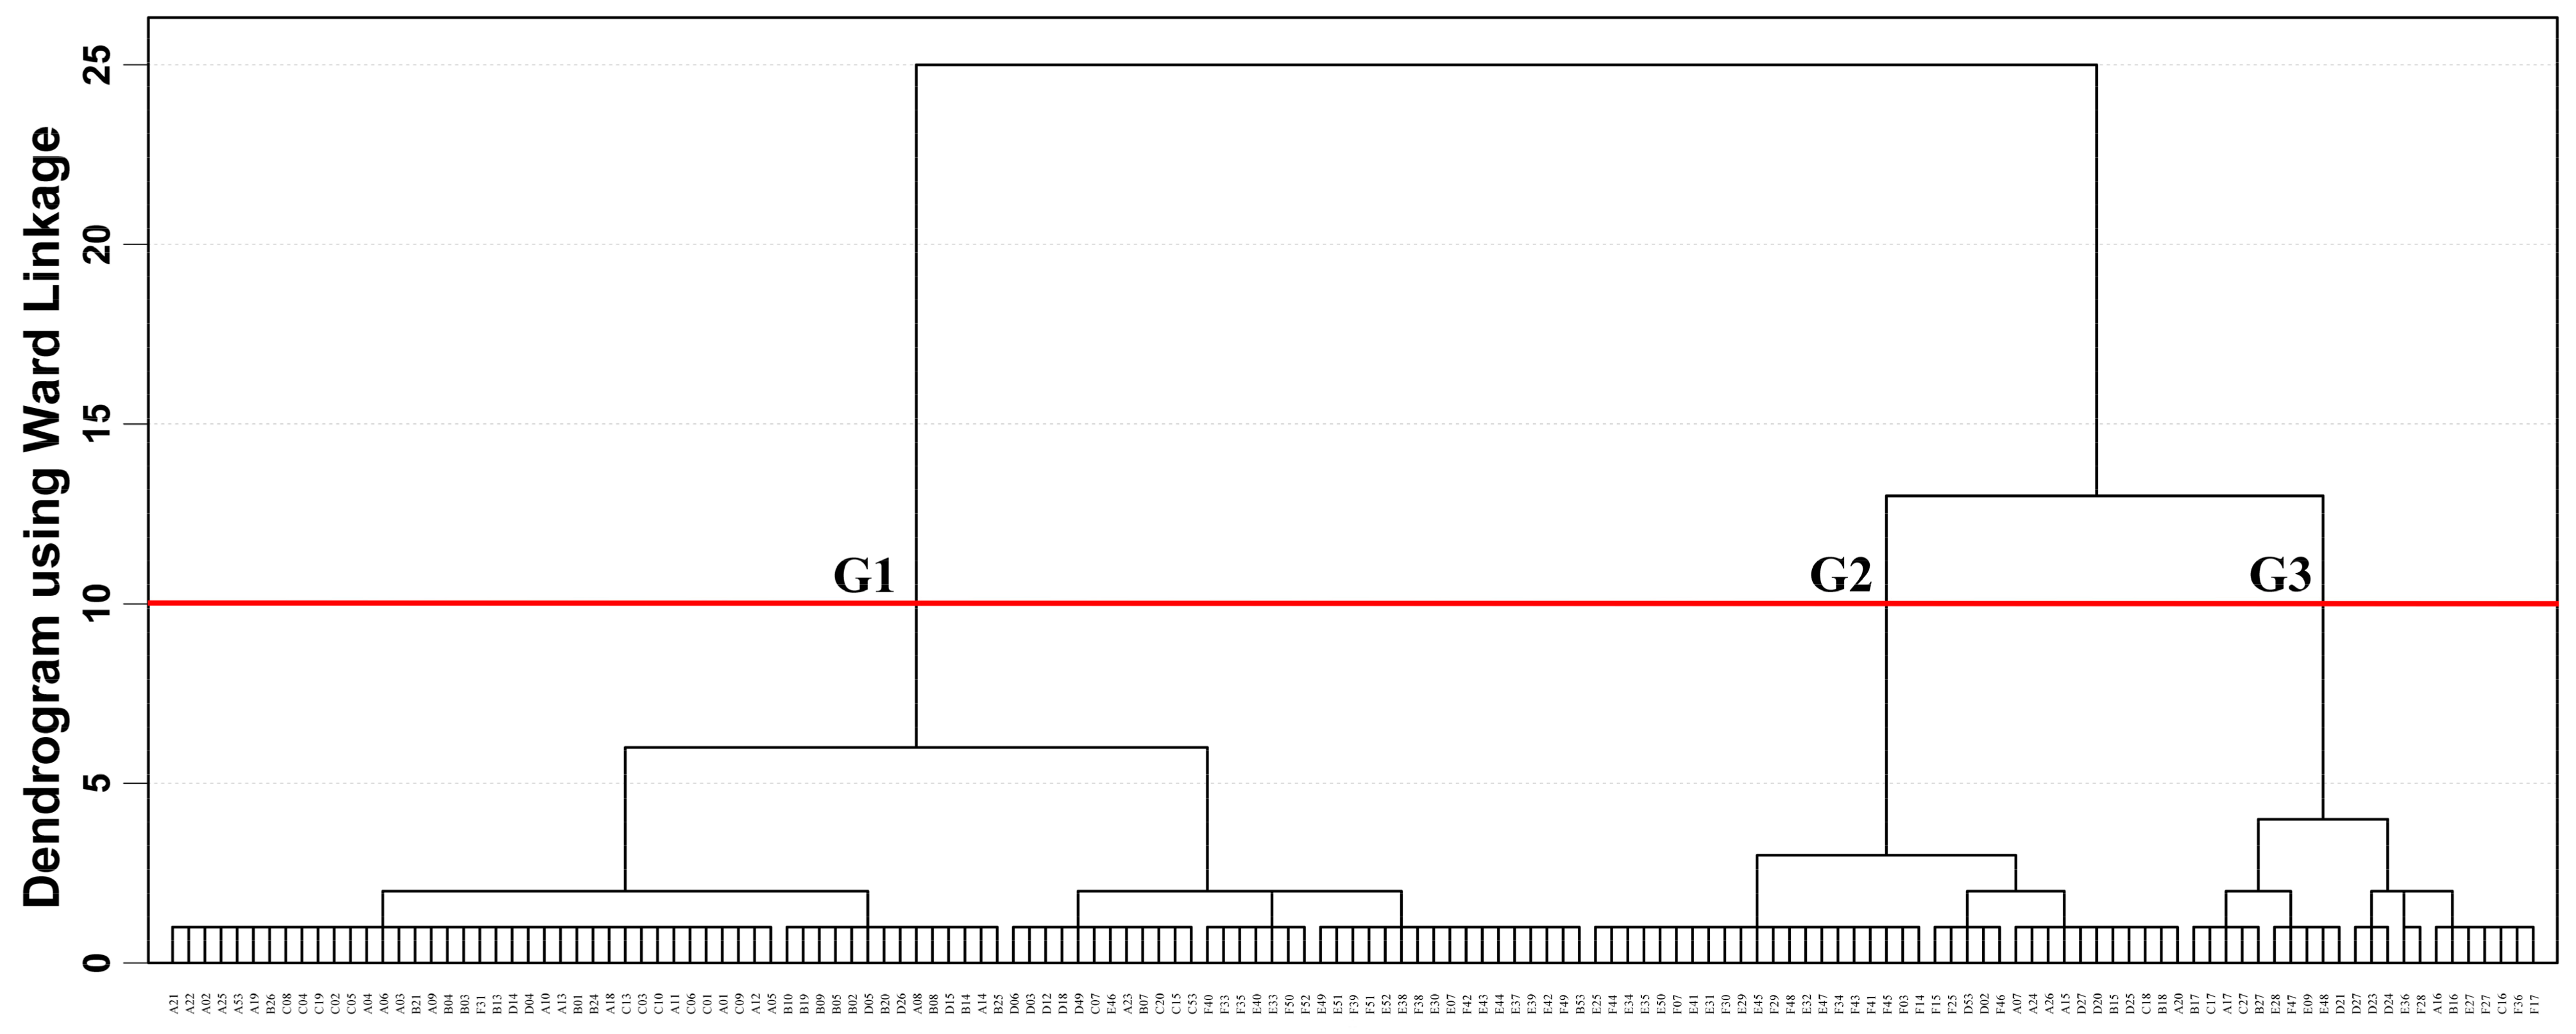
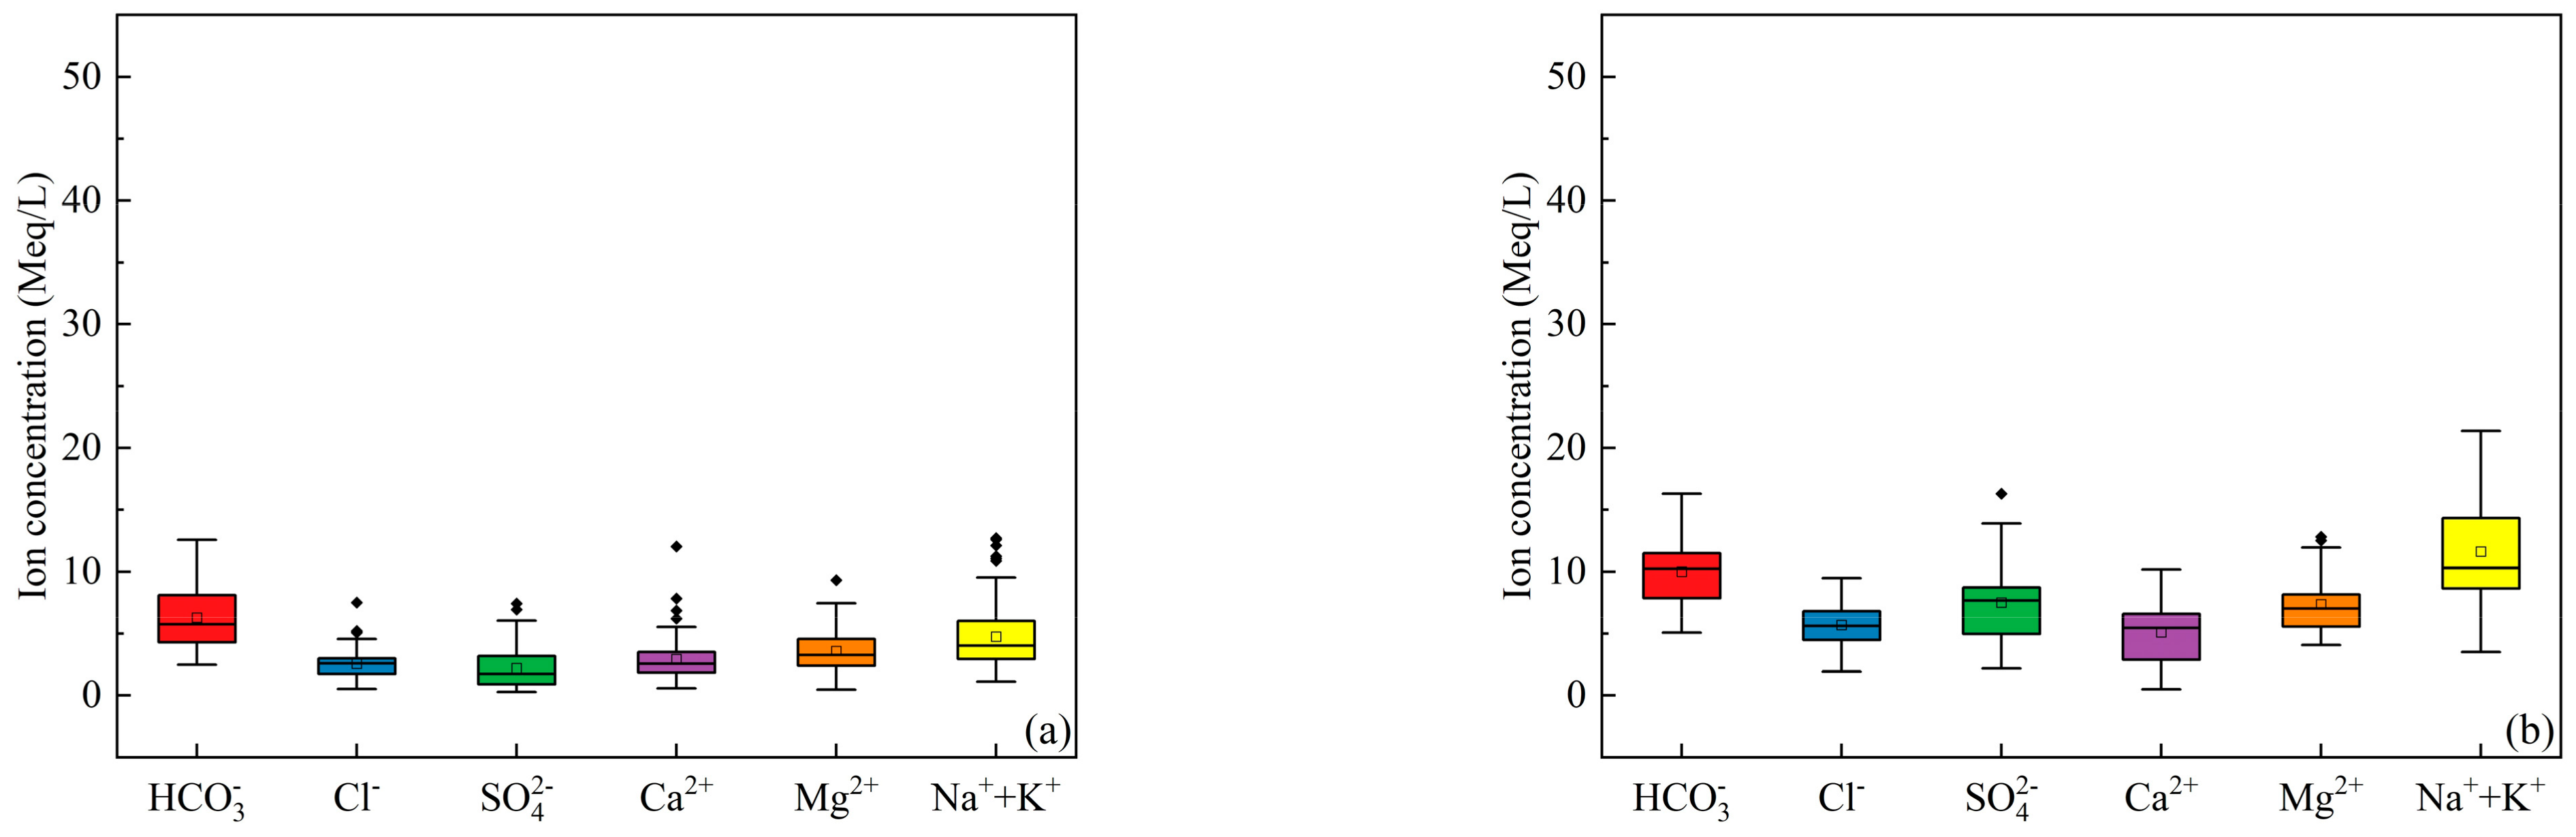
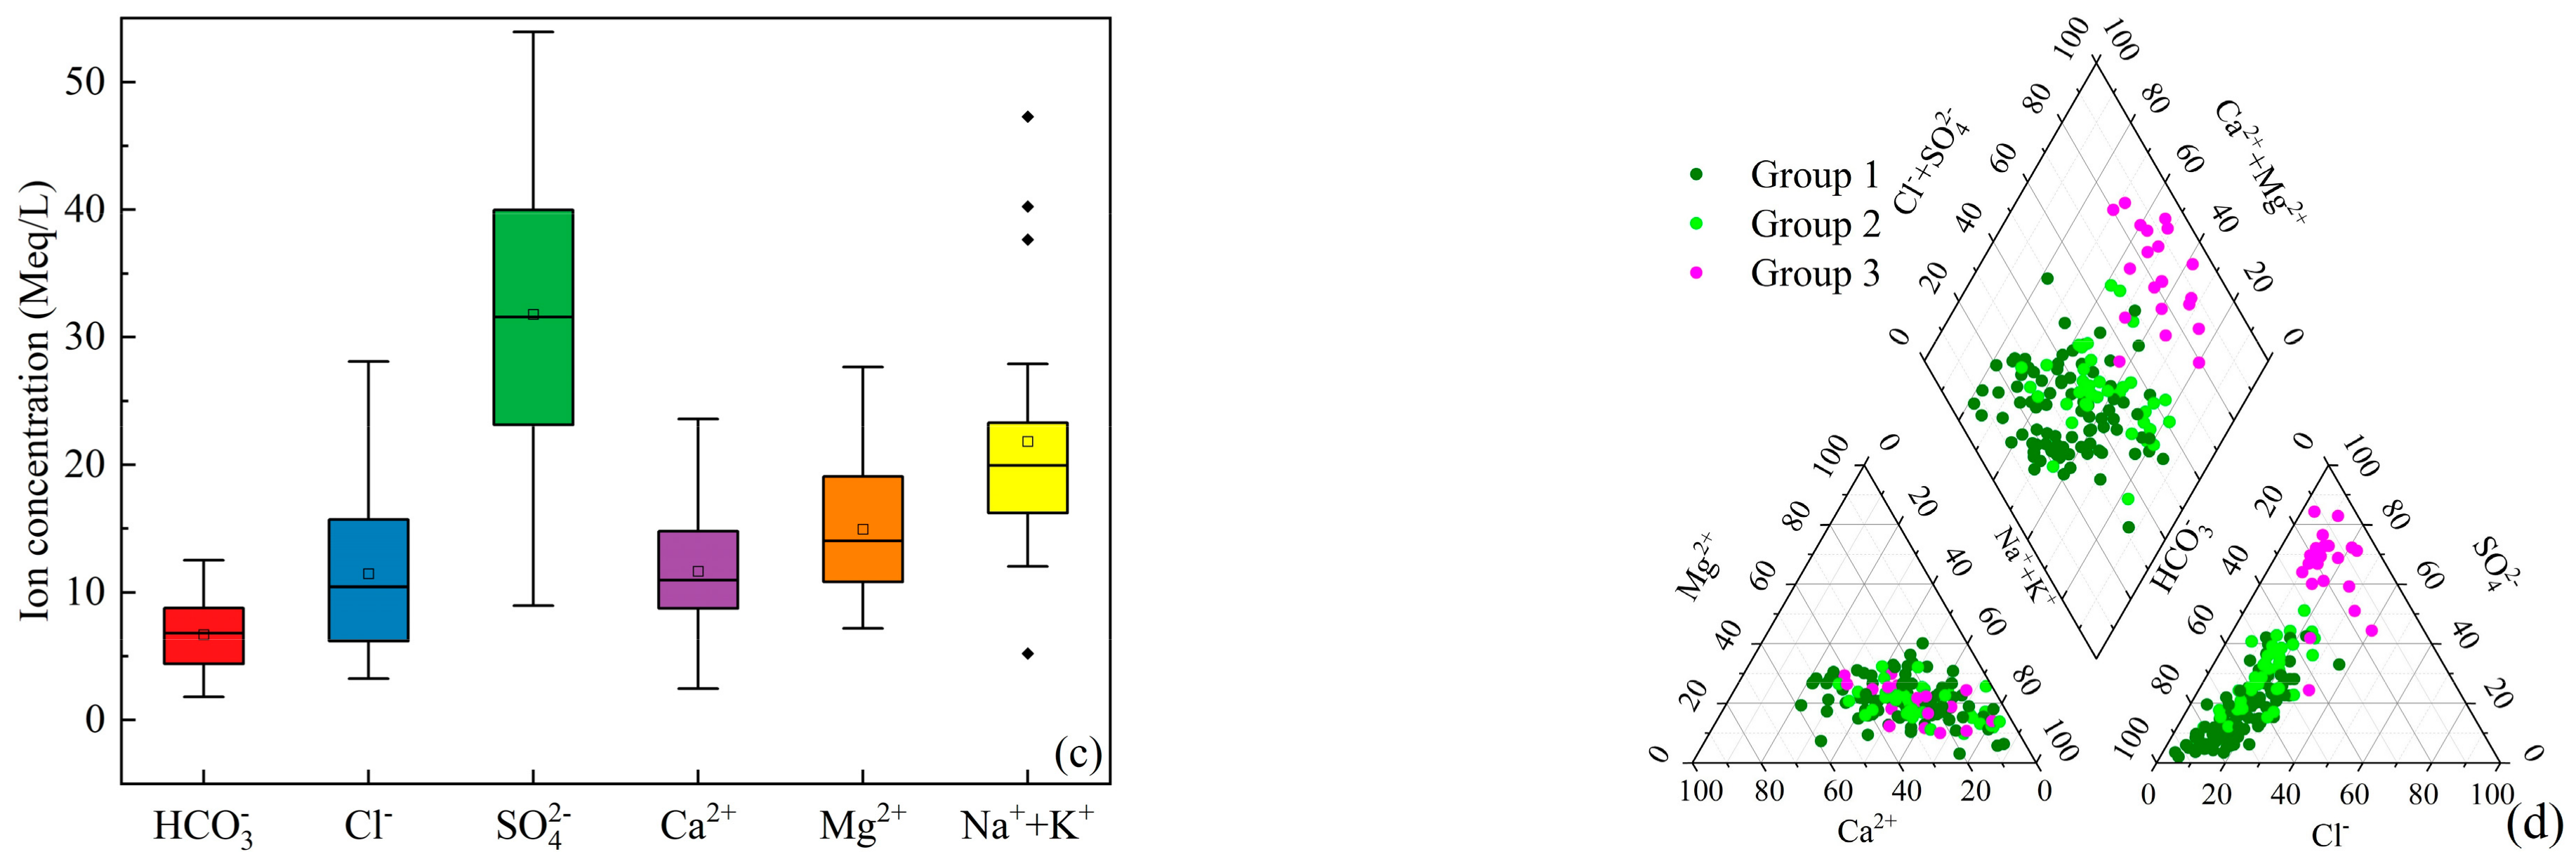
4.1. Clustering Analysis
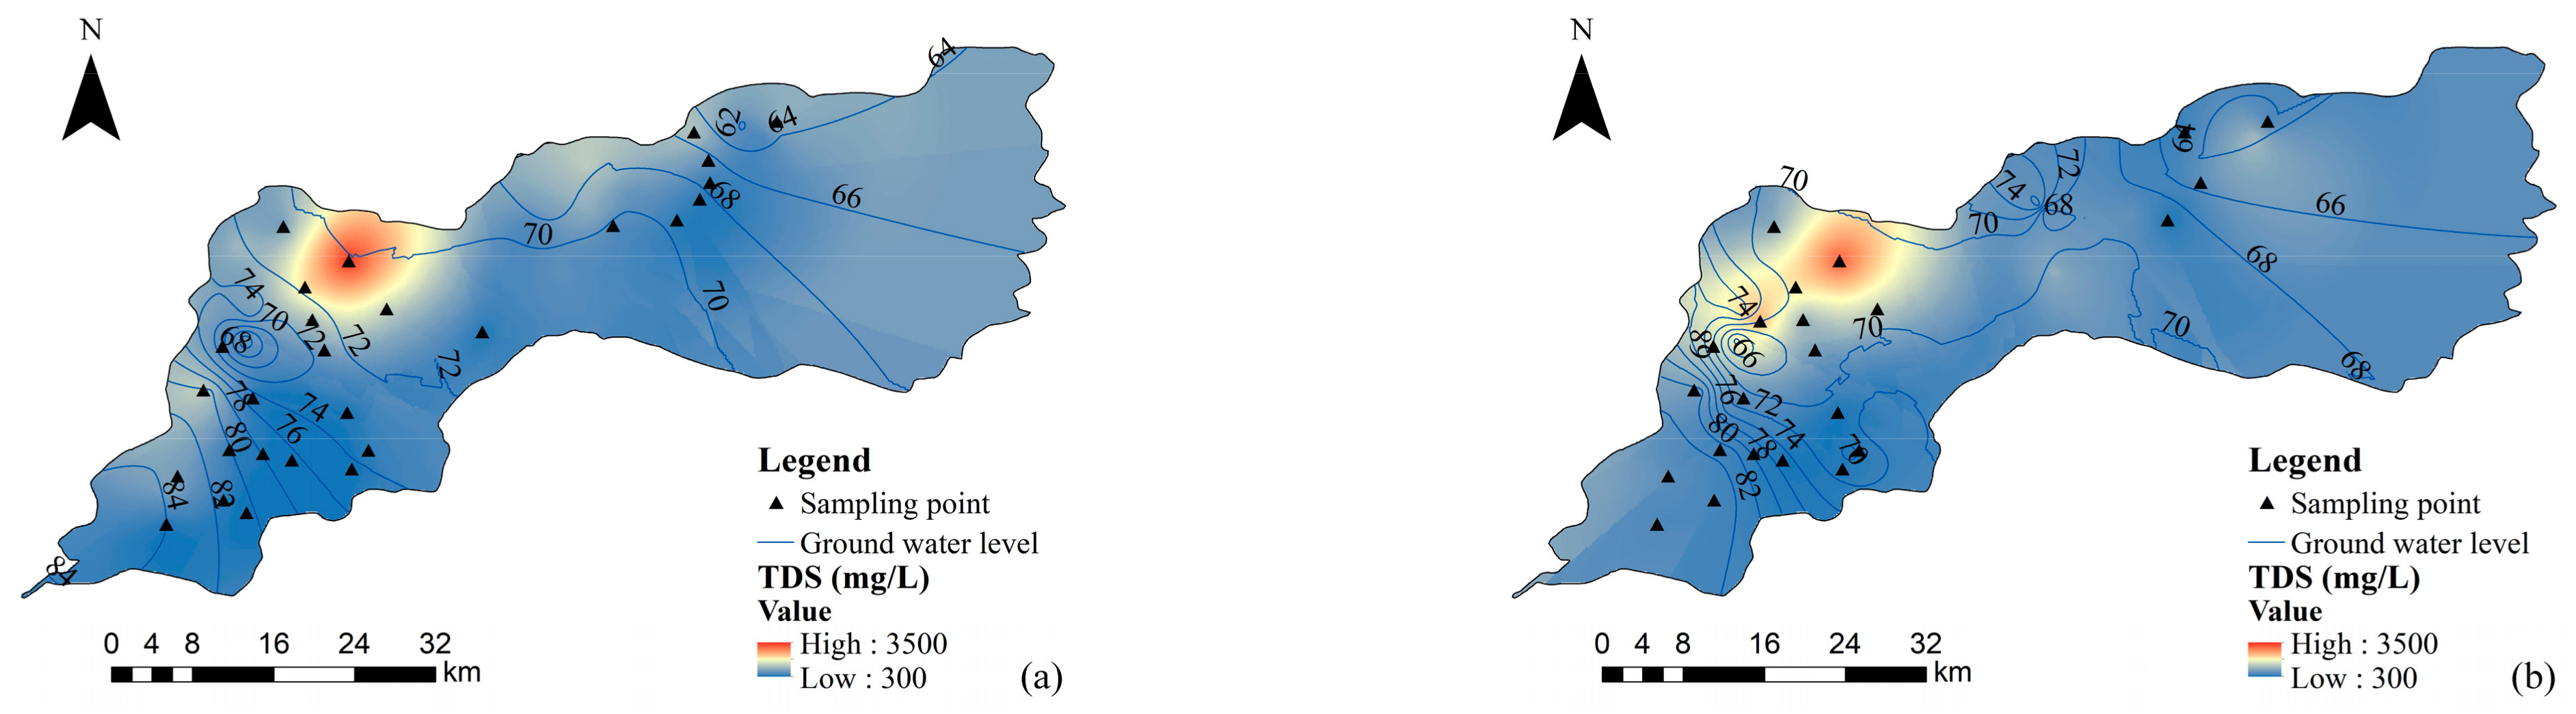
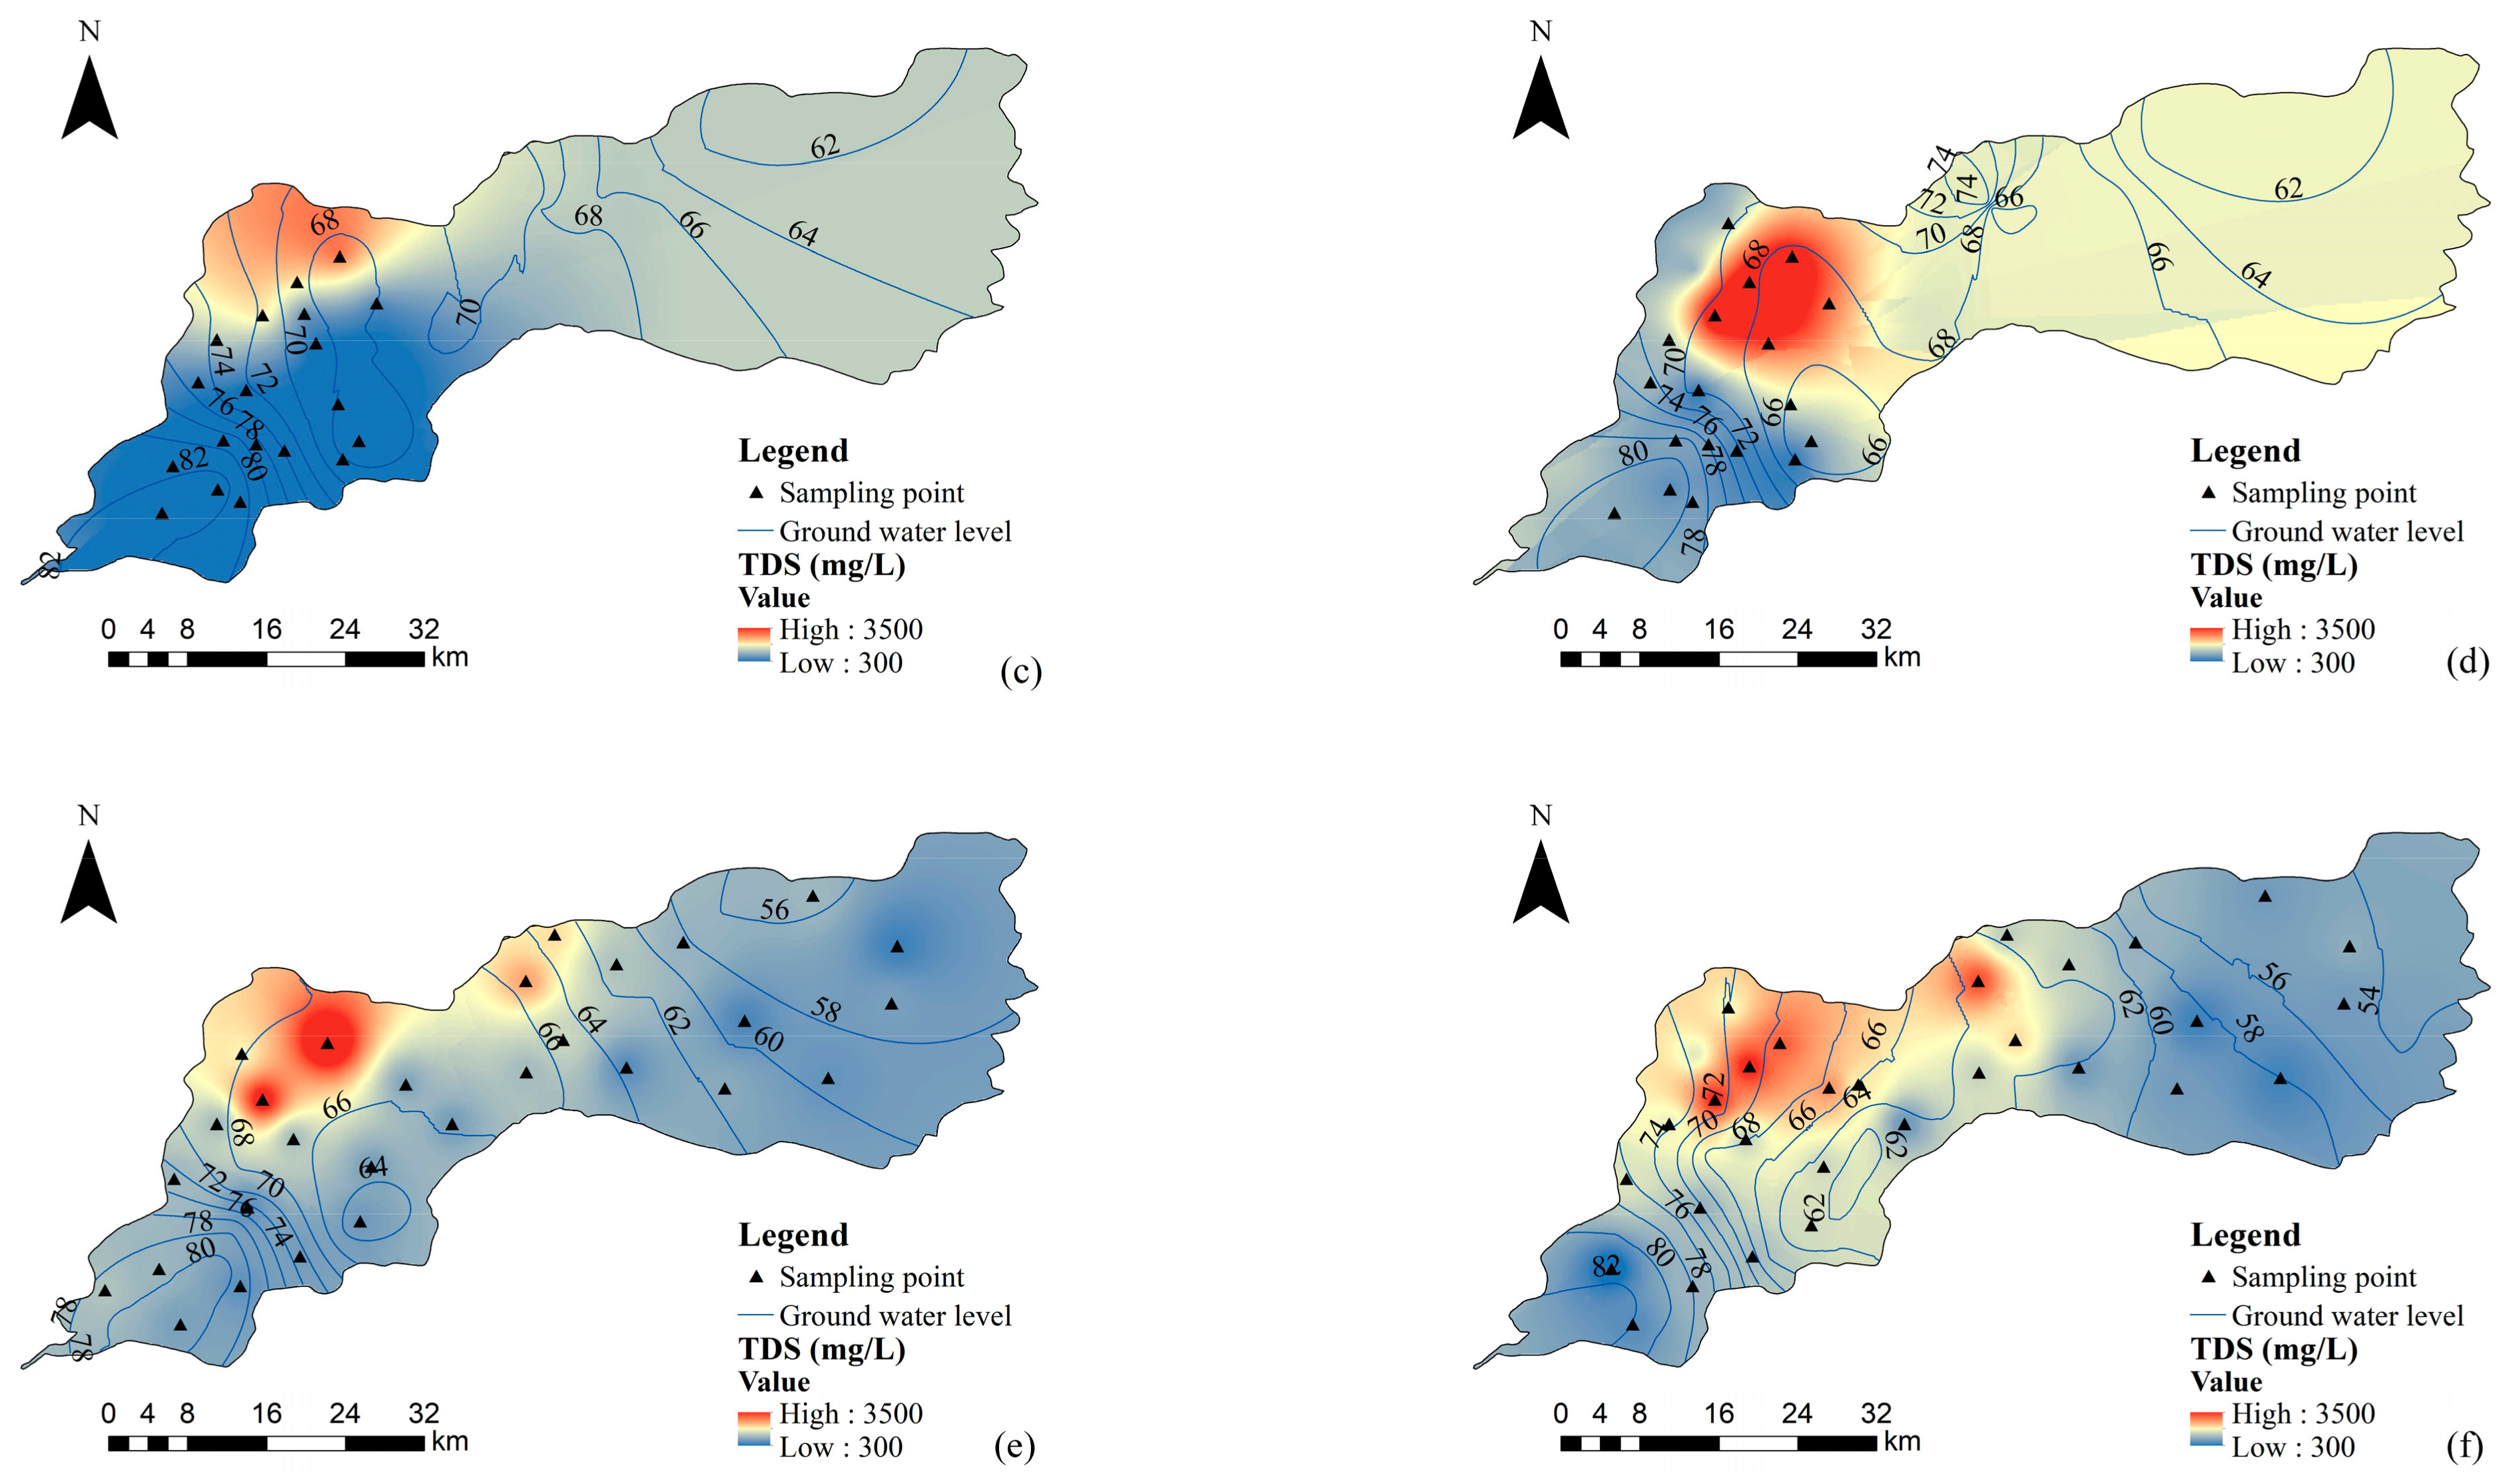
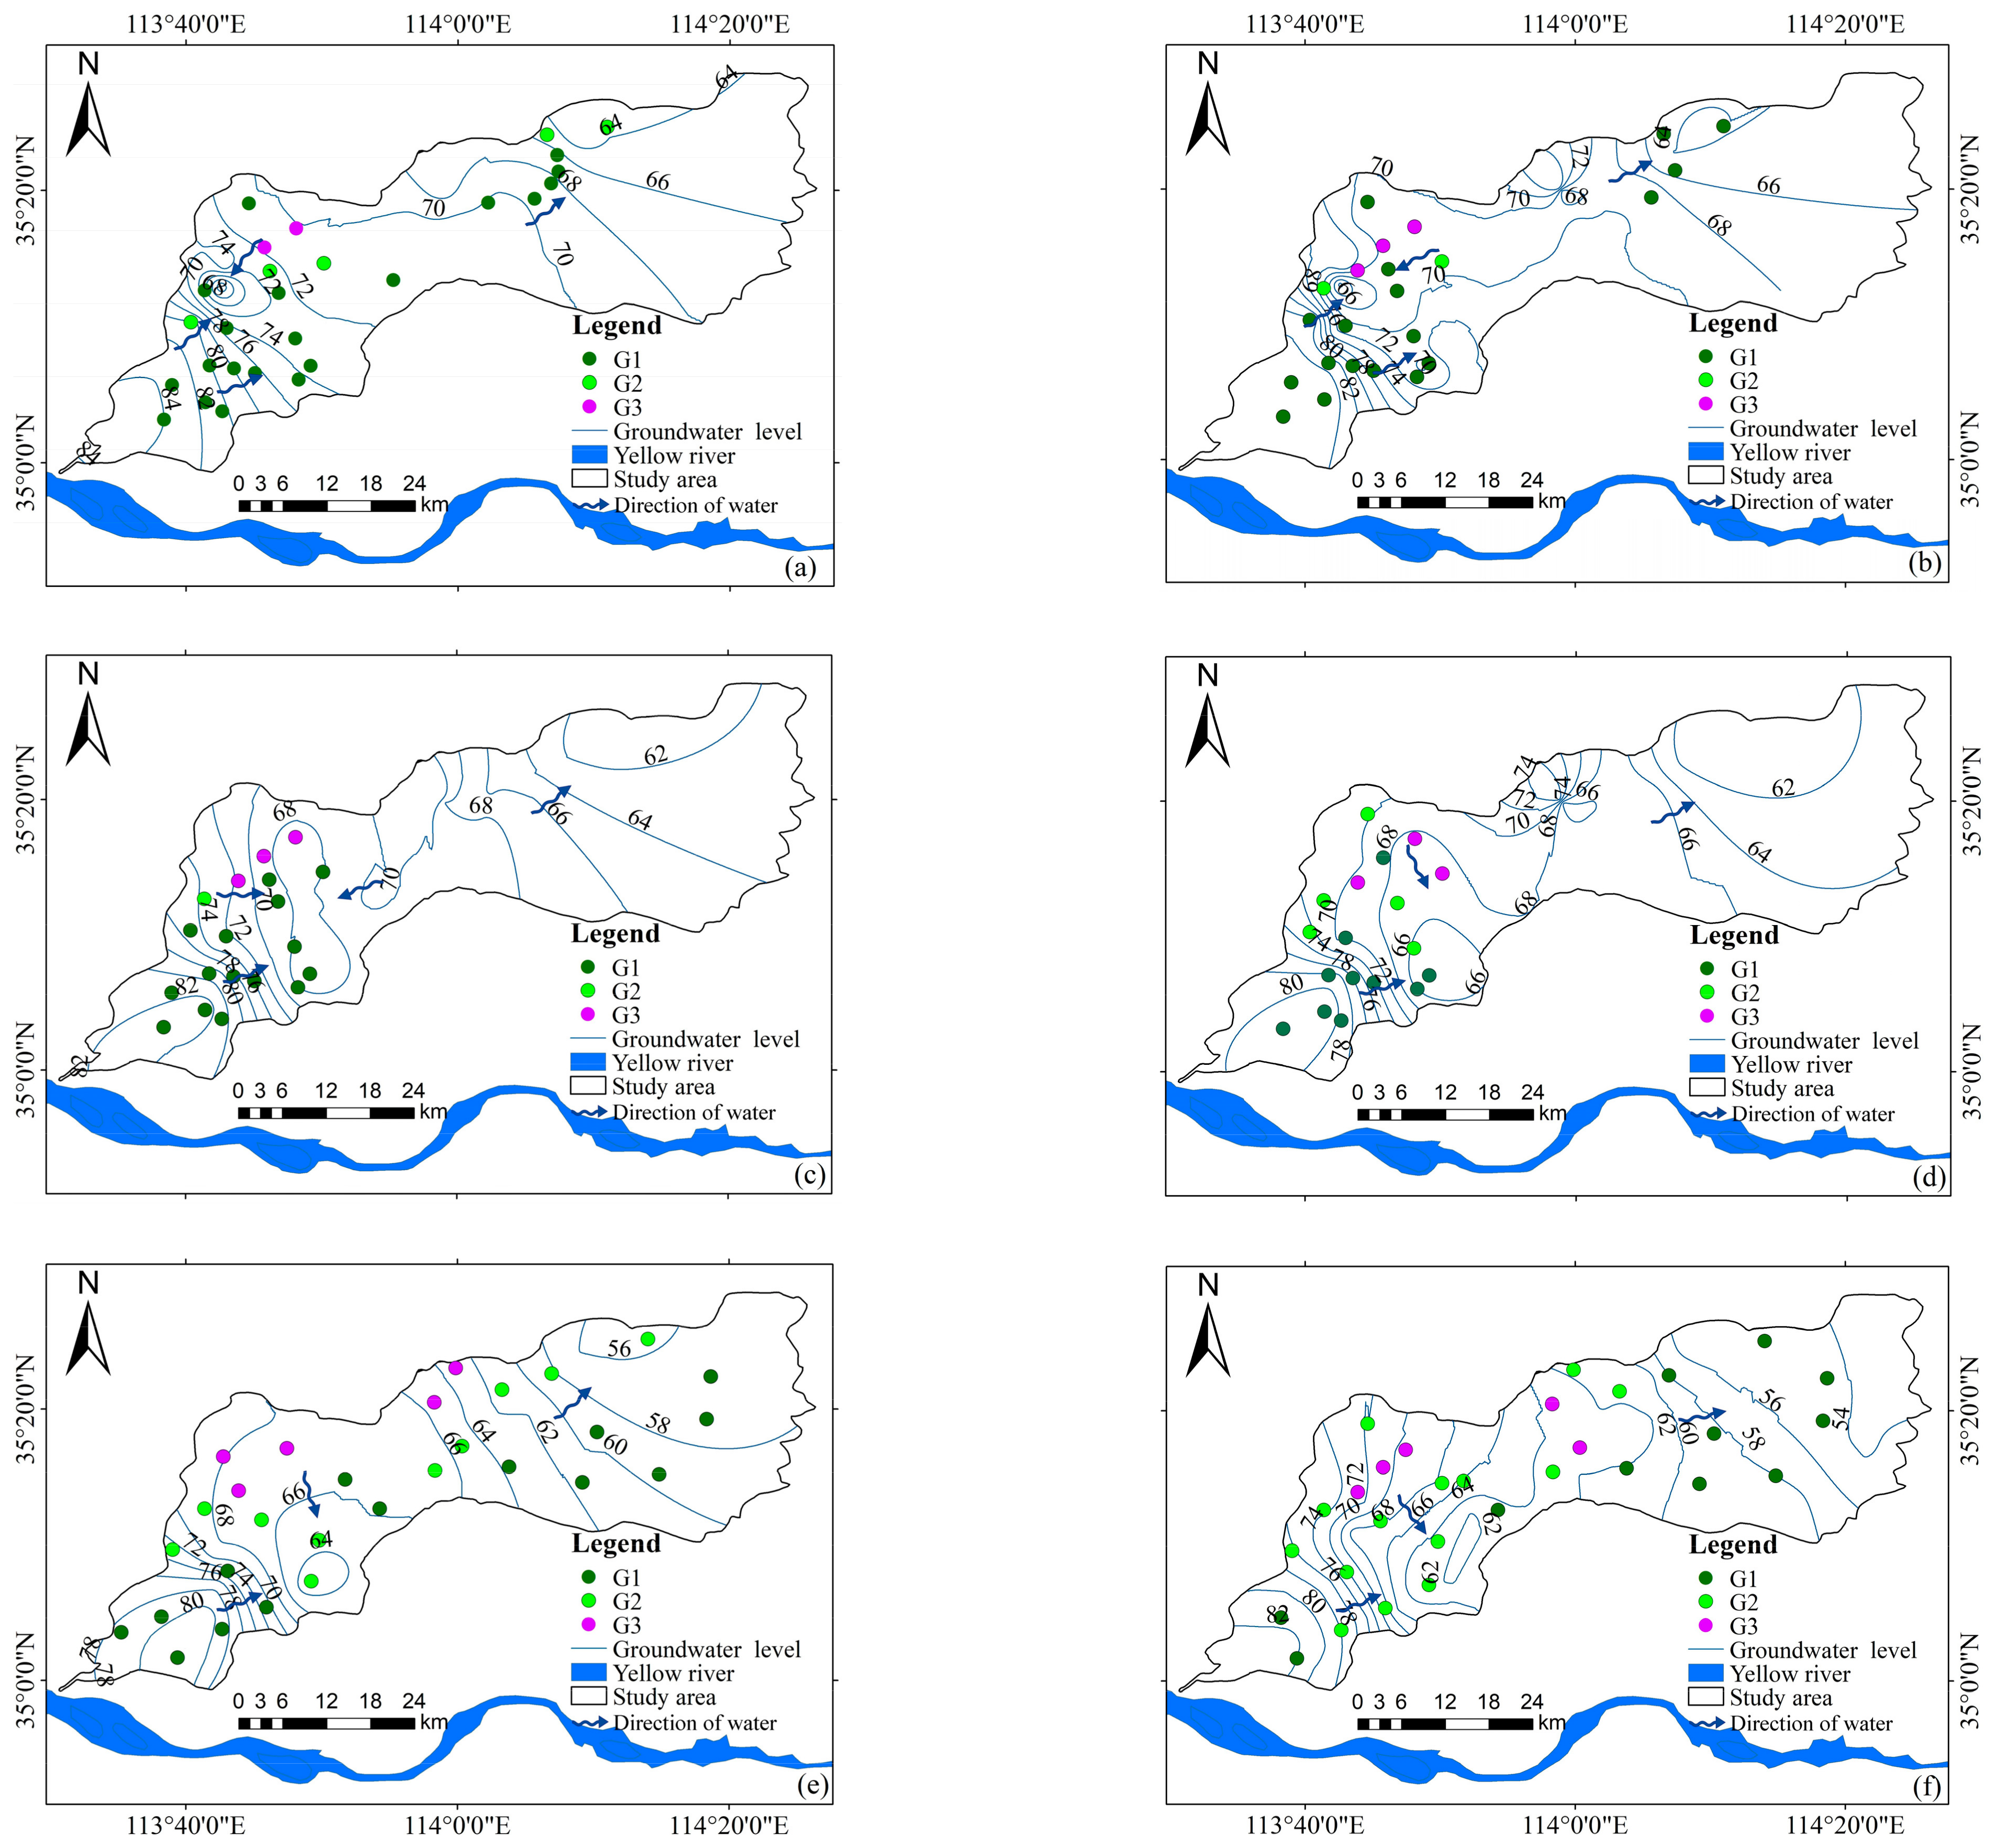
4.2. Groundwater Depression Cone and Clustering Spatial Distribution
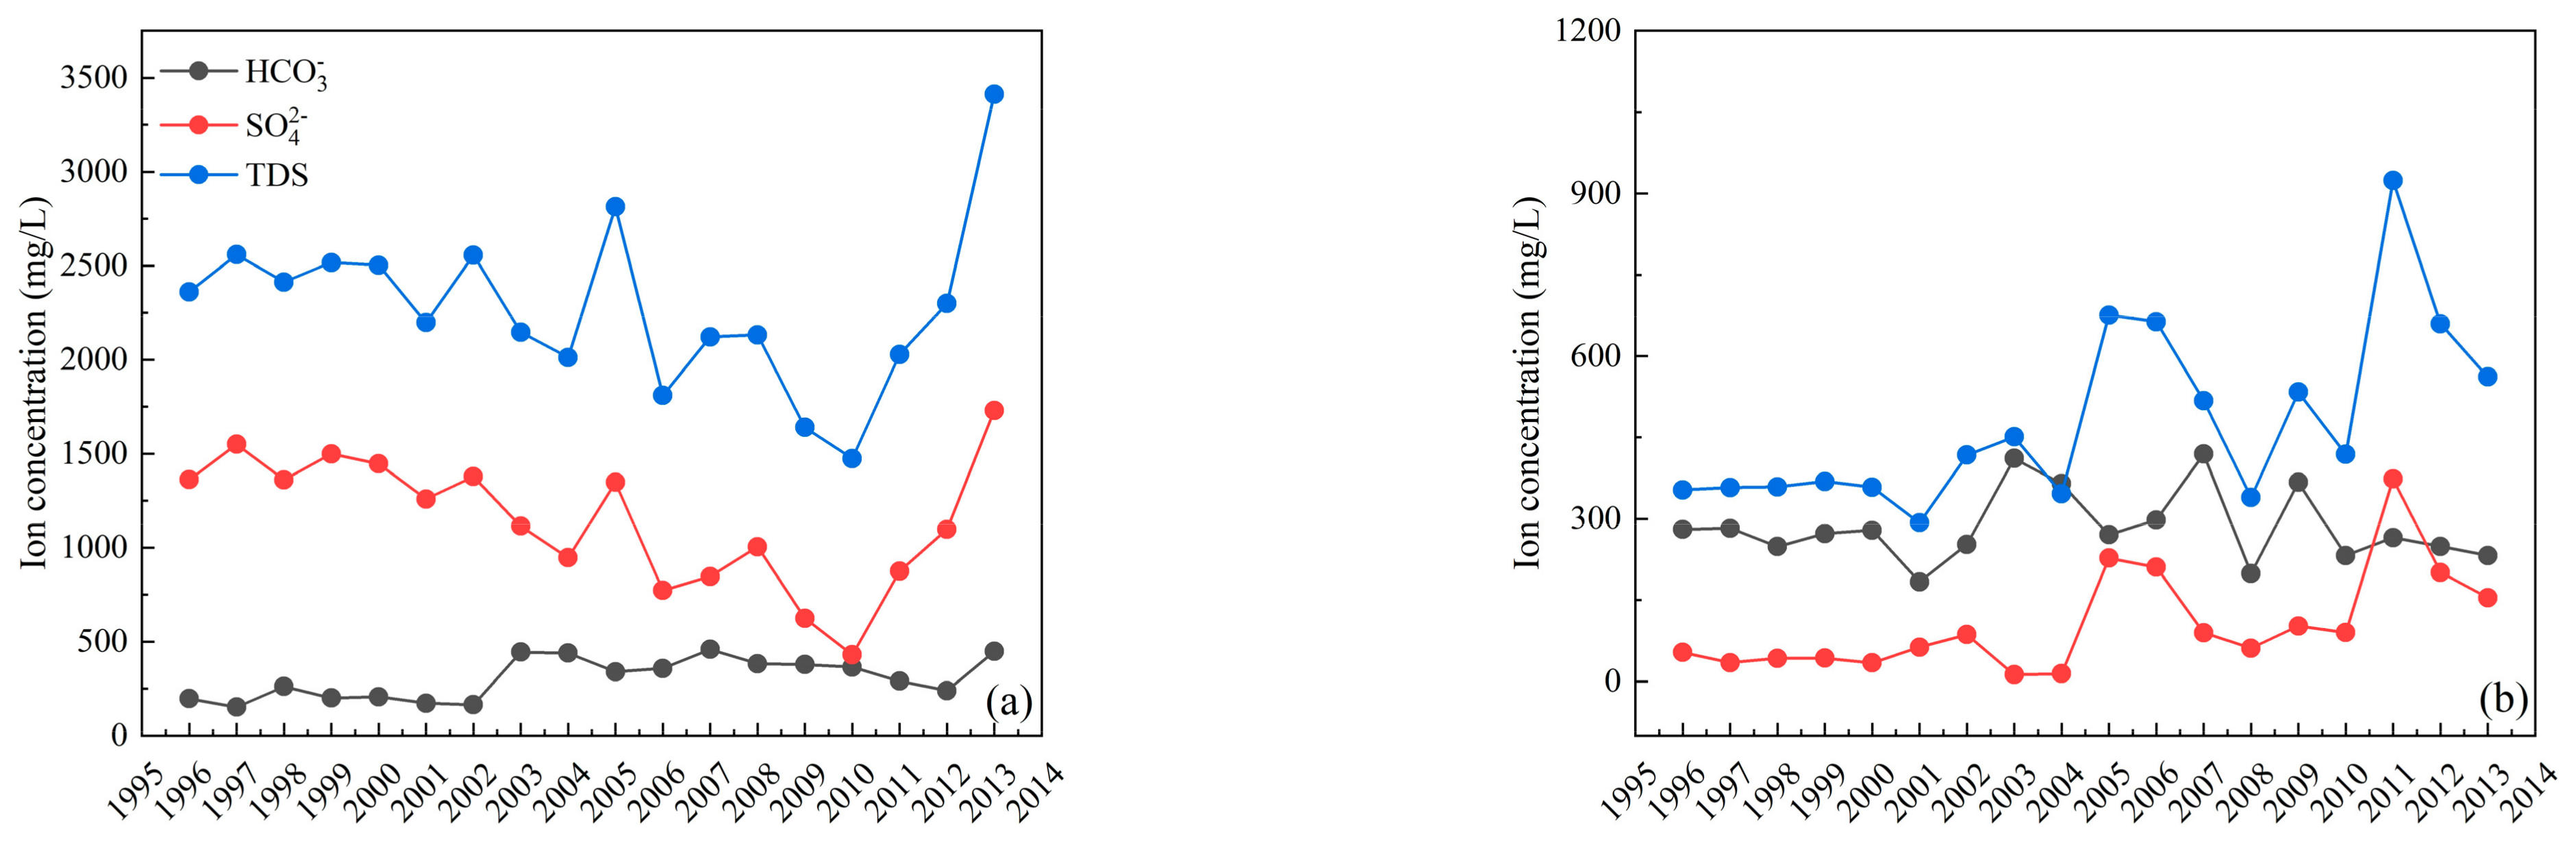
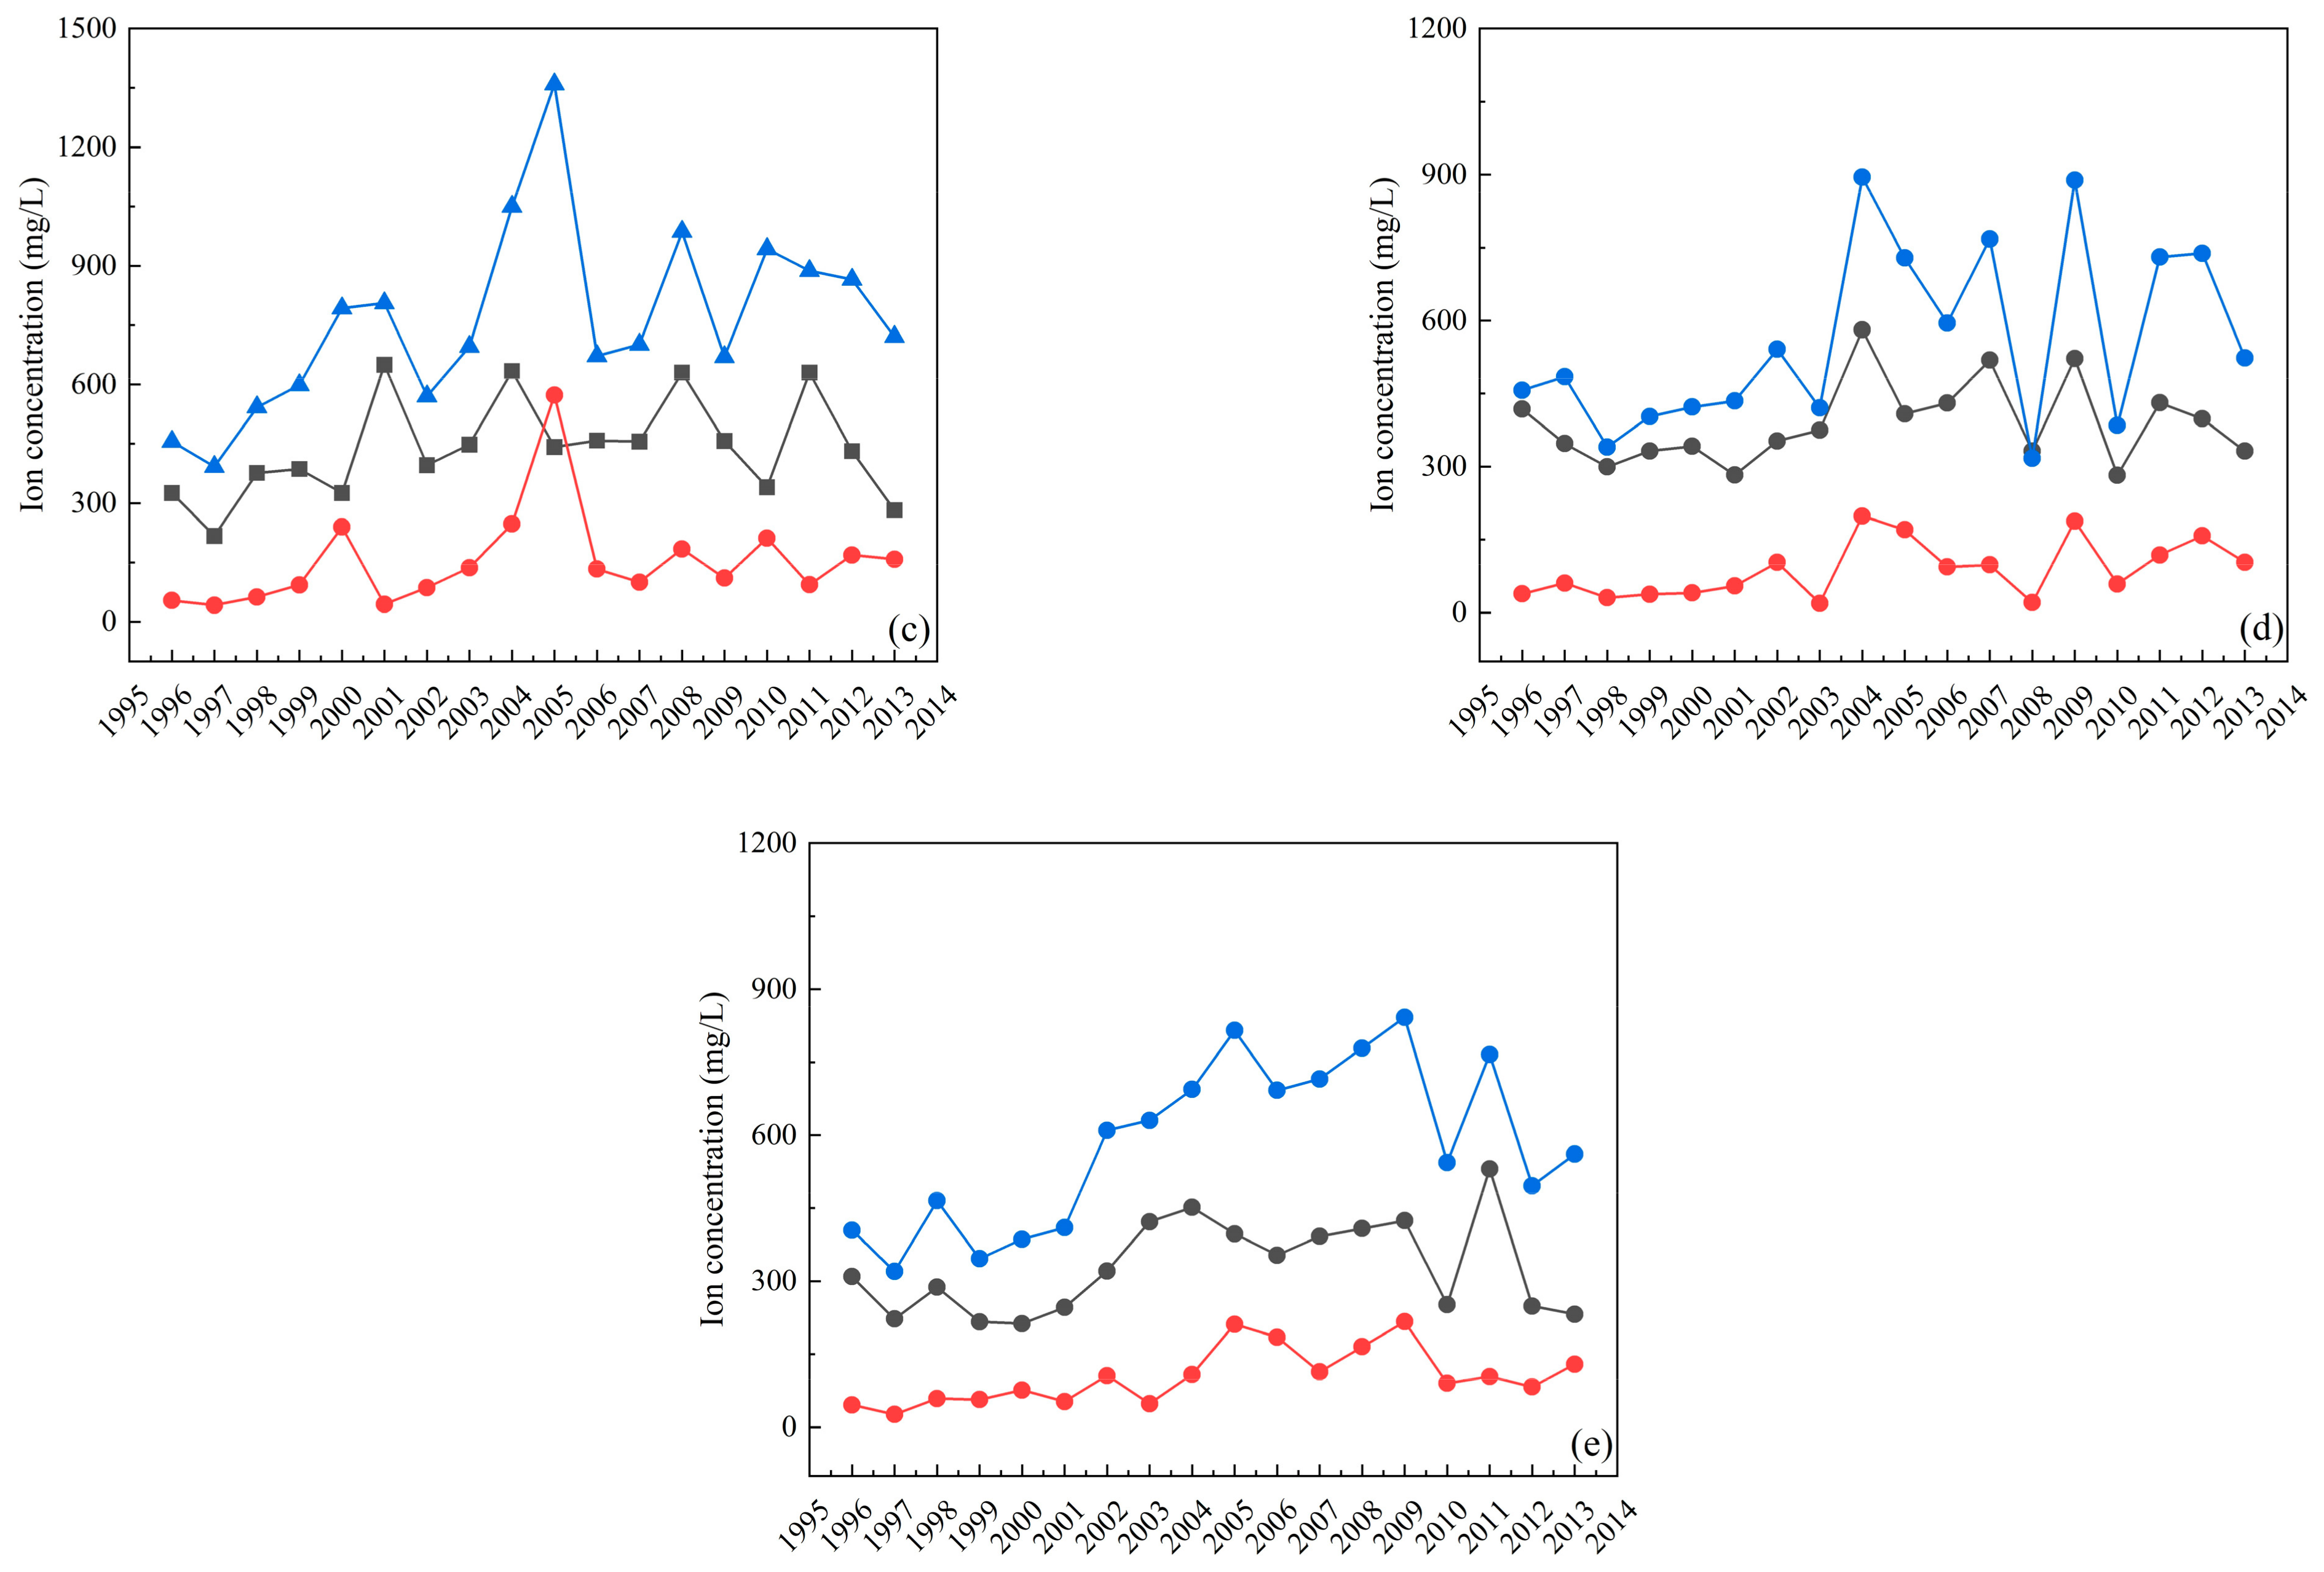
4.3. Influence of Groundwater Depression Cone on Hydrochemical Evolution
4.4. Inverse Geochemical Modeling
5. Conclusions
Author Contributions
Funding
Acknowledgments
Conflicts of Interest
References
- Wu, Y.Z.; Pan, C.F.; Lin, Y.; Cao, F.L.; Wang, Z.J. Hydrogeochemical characteristics and controlling factors of main water filled aquifers in the typical North China coalfield. Bull. Geol. Sci. Technol. 2018, 37, 191–199. [Google Scholar] [CrossRef]
- Asmael, N.M.; Huneau, F.; Garel, E.; Celle-Jeanton, H.; Le Coustumer, P.; Dupuy, A. Hydrochemistry to delineate groundwater flow conditions in the Mogher Al Mer area (Damascus Basin, Southwestern Syria). Environ. Earth Sci. 2014, 72, 3205–3225. [Google Scholar] [CrossRef]
- Chen, J.; Gao, Y.Y.; Qian, H.; Ren, W.H.; Qu, W.G. Hydrogeochemical evidence for fluoride behavior in groundwater and the associated risk to human health for a large irrigation plain in the Yellow River Basin. Sci. Total Environ. 2021, 800, 149428. [Google Scholar] [CrossRef] [PubMed]
- Wang, W.; Chen, Y.N.; Wang, W.H.; Xia, Z.H.; Li, X.Y.; Kayumba, P.M. Hydrochemical characteristics and evolution of groundwater in the dried-up river oasis of the Tarim Basin, Central Asia. J. Arid. Land 2021, 13, 977–994. [Google Scholar] [CrossRef]
- Yuan, H.; Yang, S.; Wang, B. Hydrochemistry characteristics of groundwater with the influence of spatial variability and water flow in Hetao Irrigation District, China. Environ. Sci. Pollut. Res. 2022, 29, 71150–71164. [Google Scholar] [CrossRef] [PubMed]
- Xiao, J.; Lv, G.; Chai, N.; Hu, J.; Jin, Z. Hydrochemistry and source apportionment of boron, sulfate, and nitrate in the Fen River, a typical loess covered area in the eastern Chinese Loess Plateau. Environ. Res. 2022, 206, 112570. [Google Scholar] [CrossRef]
- Wang, L.; He, Z.; Li, J. Assessing the land use type and environment factors affecting groundwater nitrogen in an arid oasis in northwestern China. Environ. Sci. Pollut. Res. 2020, 27, 40061–40074. [Google Scholar] [CrossRef]
- Yang, Q.C.; Li, Z.J.; Xie, C.; Liang, J.; Ma, H.Y. Risk assessment of groundwater hydrochemistry for irrigation suitability in Ordos Basin, China. Nat. Hazards 2020, 101, 309–325. [Google Scholar] [CrossRef]
- Guo, X.J.; Wang, W.H.; Wang, J.S.; Wang, W. Hydrochemical characteristics and evolution pattern of groundwater system in Baiyangdian wetland. North Chian Plain. Acta Geol. Sin. 2022, 96, 656–672. [Google Scholar] [CrossRef]
- Rodriguez, M.; Ohlanders, N.; Pellicciotti, F.; Williams, M.W.; McPhee, J. Estimating runoff from a glacierized catchment using natural tracers in the semi-arid Andes cordillera. Hydrol. Processes 2016, 30, 3609–3626. [Google Scholar] [CrossRef]
- Tran, D.A.; Tsujimura, M.; Vo, L.P.; Nguyen, V.T.; Nguyen, L.D.; Dang, T.D. Stable isotope characteristics of water resources in the coastal area of the Vietnamese Mekong Delta. Isot. Environ. Health Stud. 2019, 55, 566–587. [Google Scholar] [CrossRef]
- Qian, H.; Chen, J.; Howard, K.W.F. Assessing groundwater pollution and potential remediation processes in a multi-layer aquifer system. Environ. Pollut. 2020, 263, 114669. [Google Scholar] [CrossRef]
- Giri, A.; Bharti, V.K.; Kalia, S.; Kumar, K.; Khansu, M. Hydrochemical and quality assessment of irrigation water at the trans-himalayan high-altitude regions of Leh, Ladakh, India. Appl. Water Sci. 2022, 12, 1–20. [Google Scholar] [CrossRef]
- Zhao, X.F.; Chen, J.N.Y.; Tang, C.Y.; Zeng, S.Q.; Lu, Y.T. Hydrochemical characteristics and evolution of groundwater in a small catchment of Pearl River Delta. Ecol. Environ. Sci. 2007, 16, 1620–1626. [Google Scholar] [CrossRef]
- Zhang, Y.; Cheng, R.; Zou, L.; Liang, Z.J.; Lv, W.; Dou, M.; Li, P.; Hu, Y.L.; Qi, X.B. The Effects of Climate Change and Anthropogenic Activities on Groundwater in Irrigation District. J. Irrig. Drain. 2022, 41, 91–100. [Google Scholar] [CrossRef]
- Sun, H.Y.; Mao, Q.G.; Wei, X.F.; Zhang, H.Q.; Xi, Y.Z. Hydrogeochemical characteristics and formation evolutionary mechanism of the groundwater system in the Hami basin. Geol. China 2018, 45, 1128–1141. [Google Scholar]
- Bodrud-Doza, M.; Islam, A.R.M.T.; Ahmed, F.; Das, S.; Saha, N.; Rahman, M.S. Characterization of groundwater quality using water evaluation indices, multivariate statistics and geostatistics in central Bangladesh. Water Sci. 2016, 30, 19–40. [Google Scholar] [CrossRef] [Green Version]
- Fang, L.J.; Gao, R.Z.; Jia, D.B.; Yu, R.H.; Liu, X.Y.; Liu, T.X. Spatial-temporal characteristics of groundwater quality and its environmental driving factors of Steppe Basin—Taken Balaguer river basin of Inner Mongolia for instance. China Environ. Sci. 2021, 41, 2161–2169. [Google Scholar] [CrossRef]
- He, Z.H.; Unger-Shayesteh, K.; Vorogushyn, S.; Weise, S.M.; Duethmann, D.; Kalashnikova, O.; Gafurov, A.; Merz, B. Comparing Bayesian and traditional end-member mixing approaches for hydrograph separation in a glacierized basin. Hydrol. Earth Syst. Sci. 2020, 24, 3289–3309. [Google Scholar] [CrossRef]
- Liu, Z.; Qi, M.; Han, Y.; Cao, R.; Leng, J. Prediction of groundwater depression cone based on EMD-AR model in the irrigation area of the Lower Yellow River. J. Henan Norm. Univ. (Nat. Sci. Ed.) 2022, 50, 29–38. [Google Scholar] [CrossRef]
- Ahmad, S.; Singh, N.; Mazhar, S.N. Hydrochemical characteristics of the groundwater in Trans-Yamuna Alluvial aquifer, Palwal District, Haryana, India. Appl. Water Sci. 2020, 10, 75. [Google Scholar] [CrossRef]
- Cheng, C.H.; Deng, Y.X.; Zhuo, X.K.; Dai, D.; Yu, T. Changes in Water Chemistry and Driving Factors in the Middle and Lower Reaches of the Beijing-Hangzhou Grand Canal. Environ. Sci. 2021, 42, 2251–2259. [Google Scholar] [CrossRef]
- Egbi, C.D.; Anornu, G.; Appiah-Adjei, E.K.; Ganyaglo, S.Y.; Dampare, S.B. Evaluation of water quality using hydrochemistry, stable isotopes, and water quality indices in the Lower Volta River Basin of Ghana. Environ. Dev. Sustain. 2019, 21, 3033–3063. [Google Scholar] [CrossRef]
- Liu, F.; Zou, J.W.; Liu, J.R.; Zhang, J.K.; Zhen, P.N. Factors controlling groundwater chemical evolution with the impact of reduced exploitation. CATENA 2022, 214, 106261. [Google Scholar] [CrossRef]
- Liu, J.T.; Gao, Z.J.; Wang, M.; Li, Y.Z.; Ma, Y.Y.; Shi, M.J.; Zhang, H.Y. Study on the dynamic characteristics of groundwater in the valley plain of Lhasa City. Environ. Earth Sci. 2018, 77, 646. [Google Scholar] [CrossRef]
- Das, K.; Mukherjee, A. Depth-dependent groundwater response to coastal hydrodynamics in the tropical, Ganges river mega-delta front (the Sundarbans): Impact of hydraulic connectivity on drinking water vulnerability. J. Hydrol. 2019, 575, 499–512. [Google Scholar] [CrossRef]
- Doveri, M.; Natali, S.; Franceschi, L.; Menichini, M.; Trifiro, S.; Giannecchini, R. Carbonate aquifers threatened by legacy mining: Hydrodynamics, hydrochemistry, and water isotopes integrated approach for spring water management. J. Hydrol. 2021, 593, 125850. [Google Scholar] [CrossRef]
- Emvoutou, H.C.; Tandia, B.K.; Nkot, S.N.B.; Ebonji, R.C.S.; Nlend, Y.B.; Ekodeck, G.E.; Stumpp, C.; Maloszewski, P.; Faye, S. Geologic factors controlling groundwater chemistry in the coastal aquifer system of Douala/Cameroon: Implication for groundwater system functioning. Environ. Earth Sci. 2018, 77, 1–23. [Google Scholar] [CrossRef]
- Huang, H.; Chen, Z.H.; Wang, T.; Zhang, L.; Zhou, G.M.; Sun, B.T.; Wang, Y. Characteristics and processes of hydrogeochemical evolution induced by long-term mining activities in karst aquifers, southwestern China. Environ. Sci. Pollut. Res. 2019, 26, 30055–30068. [Google Scholar] [CrossRef]
- Liu, Z.; Zhao, Y.; Han, Y.; Wang, C.; Wang, F. Driving factors of the evolution of groundwater level in People’s Victory Canal Irrigation District, China. Desalination Water Treat. 2018, 112, 325–333. [Google Scholar] [CrossRef] [Green Version]
- GB 11904-89; Water Quality-Determination of Potassium and Sodium-Flame Atomic Absorption Spectrophotometry. MEE (Ministry of Ecology and Environment of the People’s Republic of China): Beijing, China, 1990.
- GB 7477-87; Water Quality-Determination of the Sum of Calcium and Magueslum—EDTA Titrimetrlc Method. MEE (Ministry of Ecology and Environment of the People’s Republic of China): Beijing, China, 1987.
- HJ 84-2016; Water Quality-Determination of Inorganic Anions(F−, Cl−, NO2−, Br−, NO3−, PO43−, SO32−, SO42−)-Ion Chromatography. MEE (Ministry of Ecology and Environment of the People’s Republic of China): Beijing, China, 2016.
- DZ/T 0064.49; Methods for Analysis of Groundwater Quality Part 49: Determination of Carbonate, Bicarbonate Ions, Hydroxy. MNR (Ministry of Natural Resources of the People’s Republic of China): Beijing, China, 1993.
- Cui, J.Q.; Li, X.Y.; Shi, H.B.; Sun, Y.N.; An, H.J.; Xing, J.P. Chemical Evolution and Formation Mechanism of Groundwater in Hetao Irrigation Area. Environ. Sci. 2020, 41, 4011–4020. [Google Scholar] [CrossRef]
- Cui, Y.H.; Wang, J.; Liu, Y.C.; HAO, S.; GAO, X. Hydro-chemical Characteristics and Ion Origin Analysis of Surface-groundwater in the Meeting Place of Shengjin Lake and Yangtze River. Environ. Sci. 2021, 42, 3223–3231. [Google Scholar] [CrossRef]
- El Alfy, M.; Abdalla, F.; Moubark, K.; Alharbi, T. Hydrochemical equilibrium and statistical approaches as effective tools for identifying groundwater evolution and pollution sources in arid areas. Geosci. J. 2019, 23, 299–314. [Google Scholar] [CrossRef]
- Huang, J.Z.; Xian, Y.; Li, W.; Zhang, D.Z.; Zhuang, X.M. Hydrogeochemical Evolution of Groundwater Flow System in the Typical Coastal Plain: A Case Study of Hangjiahu Plain. Earth Sci. 2021, 46, 2565–2582. [Google Scholar]
- Keesari, T.; Pant, D.; Roy, A.; Sinha, U.K.; Jaryal, A.; Singh, M.; Jain, S.K. Fluoride Geochemistry and Exposure Risk Through Groundwater Sources in Northeastern Parts of Rajasthan, India. Arch. Environ. Contam. Toxicol. 2021, 80, 294–307. [Google Scholar] [CrossRef]
- Marandi, A.; Shand, P. Groundwater chemistry and the Gibbs Diagram. Appl. Geochem. 2018, 97, 209–212. [Google Scholar] [CrossRef]
- Mirza, A.; Rahman, M.T.; Saadat, M.; Islam, M.S.; Al-mansur, M.A.; Ahmed, S. Groundwater characterization and selection of suitable water type for irrigation in the western region of Bangladesh. Appl. Water Sci. 2017, 7, 233–243. [Google Scholar] [CrossRef] [Green Version]
- Wali, S.; Umar, K.J.; Im, D.; Abubakar, S.D.; Ma, G.; Umar, A.; Aa, U. Groundwater Hydrochemical Characterization in Urban Areas of Southwestern Sokoto Basin, Nigeria. Appl. Water Sci. 2018, 9, 1006. [Google Scholar]
- Wang, Y.J.; Song, X.F.; Li, B.H.; Ma, Y.; Zhang, Y.H.; Yang, L.H.; Bu, H.M.; Holm, P.E. Temporal variation in groundwater hydrochemistry driven by natural and anthropogenic processes at a reclaimed water irrigation region. Hydrol. Res. 2018, 49, 1652–1668. [Google Scholar] [CrossRef] [Green Version]
- Wang, Y.S.; Li, S.; Li, H.X.; Cheng, X.X.; Li, W.P.; Zhang, M.N. Groundwater salinization characteristics and controlling factors in the Haiyuan Basin. Hydrogeol. Eng. Geol. 2019, 46, 10–17+57. [Google Scholar] [CrossRef]
- Li, S.L.; Li, B.H.; Liu, H.J.; Qi, W.X.; Yang, Y.F.; Yu, G.; Qu, J.H. The biogeochemical responses of hyporheic groundwater to the long-run managed aquifer recharge: Linking microbial communities to hydrochemistry and micropollutants. J. Hazard. Mater. 2022, 431, 128587. [Google Scholar] [CrossRef] [PubMed]
- Su, C.L.; Wang, Y.X.; Ge, S.M.; Li, Z.H.; Li, J.X. Origin of the Crescent Moon Spring in the Gobi Desert of northwestern China, based on understanding groundwater recharge. J. Hydrol. 2020, 580, 124344. [Google Scholar] [CrossRef]
- Wang, J.L.; Jin, M.G.; Lu, G.P.; Zhang, D.; Kang, F.X.; Jia, B.J. Investigation of discharge-area groundwaters for recharge source characterization on different scales: The case of Jinan in northern China. Hydrogeol. J. 2016, 24, 1723–1737. [Google Scholar] [CrossRef]
- Zhang, X.D.; Qian, H.; Wu, H.; Chen, J.; Qiao, L. Multivariate Analysis of Confined Groundwater Hydrochemistry of a Long-Exploited Sedimentary Basin in Northwest China. J. Chem. 2016, 2016, 3812125. [Google Scholar] [CrossRef]


| Mineral Phase | Chemical Formula | Runoff Path 1 | Runoff Path 2 | |||
|---|---|---|---|---|---|---|
| N42-N06 | N06-N44 | N44-N02 | N27-N45 | N45-N02 | ||
| Dolomite | CaMg(CO3)2 | 1.67 | ||||
| Calcite | CaCO3 | −1.41 | ||||
| Gypsum | CaSO4•2H2O | 1.33 | 0.75 | 1.80 | 0.37 | 12.67 |
| Halite | NaCl | 1.66 | 2.71 | |||
| CaX2 | CaX2 | −0.77 | −0.12 | −0.51 | −10.40 | |
| NaX | NaX | 1.53 | 0.25 | 1.02 | −3.00 | 16.13 |
| MgX2 | MgX2 | 1.50 | 2.33 | |||
| Kaolinite | Al2Si2O5(OH)4 | 0.06 | −0.11 | −0.08 | −0.88 | |
| K-mica | K(Mg,Fe)3AlSi3O10(F,OH)2 | −0.04 | 0.08 | 0.05 | 0.59 | |
| CO2(g) | CO2 | −0.50 | 0.78 | 1.35 | −1.37 | |
Publisher’s Note: MDPI stays neutral with regard to jurisdictional claims in published maps and institutional affiliations. |
© 2022 by the authors. Licensee MDPI, Basel, Switzerland. This article is an open access article distributed under the terms and conditions of the Creative Commons Attribution (CC BY) license (https://creativecommons.org/licenses/by/4.0/).
Share and Cite
Feng, S.; Liu, Z.; Han, Y.; Wang, L.; Hu, Z.; Qi, M. Effect of Groundwater Depression Cone on the Hydrochemical Evolution Process in the People’s Victory Canal Irrigation Area, China. Processes 2022, 10, 2563. https://doi.org/10.3390/pr10122563
Feng S, Liu Z, Han Y, Wang L, Hu Z, Qi M. Effect of Groundwater Depression Cone on the Hydrochemical Evolution Process in the People’s Victory Canal Irrigation Area, China. Processes. 2022; 10(12):2563. https://doi.org/10.3390/pr10122563
Chicago/Turabian StyleFeng, Shaoyi, Zhongpei Liu, Yuping Han, Lu Wang, Zhipeng Hu, and Mingkun Qi. 2022. "Effect of Groundwater Depression Cone on the Hydrochemical Evolution Process in the People’s Victory Canal Irrigation Area, China" Processes 10, no. 12: 2563. https://doi.org/10.3390/pr10122563