Article

The Effect of Water, Nanoparticulate Silica and Dry Water on the Flow Properties of Cohesionless Sand

Institute for Particle Technology, Technische Universität Braunschweig, Volkmaroder Straße 5, 38104 Braunschweig, Germany
*
Author to whom correspondence should be addressed.
Processes 2022, 10(11), 2438; https://doi.org/10.3390/pr10112438
Submission received: 31 October 2022 / Revised: 13 November 2022 / Accepted: 15 November 2022 / Published: 17 November 2022

Abstract

:
Cement hydration within particle bed concrete 3D printing processes can be benefited by storing water in the otherwise dry aggregate bulk material. Additional water also has the advantage of acting as a source of passive cooling. However, even small amounts of liquid lead to detrimental effects on bulk properties, such as the flowability. For that reason, this study proposes implementing dry water (DW) in order to store large amounts of water in a bulk material of non-absorbent, coarse sand whilst maintaining its initial bulk properties. DW is essentially created by mixing water and hydrophobic fumed silica in a high shear process, leading to water droplets surrounded by a protective silica shell. Herein, several DW variants, distinguished by their deionised water to hydrophobic silica ratio, were mixed with non-absorbent, coarse sand particles. In addition, mixtures were produced to contain a specific overall water content of up to wH2O = 5% within the bulk material. It was shown that dry water can be used to incorporate large amounts of water into a granular bulk material and simultaneously preserve flow properties. The decisive factor is the proportion of hydrophobic silica for a given water content as the DW capsules may otherwise not endure mechanical stress during mixing. However, even minimal quantities of silica can prevent liquid capillary bridges from forming and, thus, inhibit bulk property degradation.

Graphical Abstract

1. Introduction

The ever-growing demand for sustainable development within the construction sector has led to several innovative approaches. Hence, several additive manufacturing processes (AM) in construction have evolved in recent years, each able to fit specific requirements or perform a certain function within building components [1,2,3,4,5,6]. AM processes can produce free-form structures without additional formwork, leading to cost efficient as well as material efficient structures [7,8]. Of the many developing AM processes associated with construction, two main concrete 3D printing techniques are distinguishable, extrusion processes and selective binding methods [5,8]. Among the latter is the particle bed 3D printing technique designated as Selective Paste Intrusion (SPI). SPI principally constructs components by distributing or rather spreading a layer of coarse aggregate particles on a surface. Subsequently, the cement paste is extruded locally at the designated areas and penetrates the layer of non-absorbent aggregates, filling the porous networks between particles. These steps are repeated layer-by-layer until the desired element is completed. Once hardened, the finished component is removed from the remaining particle bed, leaving the remainder of material for further use [9].
Although high-strength components are achieved with SPI [10], a means of reinforcement must be devised in order to permit SPI for structural concrete elements. Structural concrete elements follow specified requirements, such as ductility or load-carrying capacity [11]. Consequently, Wire Arc Additive Manufacturing (WAAM) is combined with SPI as an approach to create steel reinforced concrete [12]. WAAM is an AM process that uses arc welding to produce parts with a high degree of geometric freedom. Furthermore, WAAM is characterised by high build rates and a diverse palette of usable materials, e.g., steel or aluminium [4].
However, the combination of SPI and WAAM does come at a cost. High temperatures during WAAM generate heat transfer into the particle bed, consequently reducing water required for concrete hardening and thereby decreasing its strength. Moreover, elevated temperatures influence the cement slurry viscosity and, thus, the penetration depth of the paste into the particle bed [12,13]. For that reason, the development of tailored aggregate particles is a crucial factor for the hybrid process of SPI and WAAM.
Within the framework of the presented study, the goal is to store water in the particle bed or rather bulk material by a novel approach and, thus, compensate for water loss as well as assist in cooling. Analogous to other particle bed AM processes, it is of utmost importance to maintain sufficient bulk properties in order to evenly distribute the aggregate particles on a surface or pre-existing layer [14]. Thereby, consistent components regarding strength and shape accuracy can be created. Small amounts of liquid, nonetheless, result in the formation of liquid capillary bridges, especially between non-absorbent particles. The liquid bridges generate attractive forces amongst particles [15], which, in turn, reduce the flowability of bulk granular materials [16].
One promising approach to counteract the detrimental effects of water, retain sufficient bulk properties for SPI and store large amounts of water within the bulk material may be realised by implementing dry water (DW) as an additive. DW, once only relevant for the cosmetic industry, has attracted interest from a number of sectors over the years. For instance, DW has the potential to store carbon dioxide or methane and, thus, capture greenhouse gas or enable safer transportation of toxic substances [17,18,19]. Further applications are emerging in the food or pharmaceutical industry as well as others [20,21]. The substance is defined as a free-flowing, water-rich powder, which is capable of containing up to 98 wt.% of water [22]. Essentially, DW consists of water droplets that are encapsulated with hydrophobic fumed silica nanoparticles. High shear mixing is used to form the droplets whereby the protective silica shell hinders coalescence [17]. The protective outer shell generally coheres due to van der Waals interactions between fumed silica particles. As DW capsules solely consist of water and an outer network of hydrophobic fumed silica, they are prone to mechanical stress [23,24,25]. As well as the particle size of fumed silica, the attraction between solid and liquid plays a major role. Particles of a hydrophilic nature commonly produce suspensions. Hydrophobic fumed silica, on the other hand, is able to produce DW depending on the grade of hydrophobicity. Moderate hydrophobicity leads to mousse-like substances, whereas super hydrophobic fumed silica contributes to creating the powdery substance used within this study. Extensive studies analysed the effects of solid surface free energy via contact angles and liquid surface tension on the created formulations, such as dry water or liquid marbles [24,26]. In sum, the decisive factors for successful water encapsulation are the supplied energy, the driving force (i.e., shear stress) and the interfacial energy of the solid material.
This study investigates DW as a means of incorporating large amounts of water into coarse bulk materials whilst maintaining initial flow and bulk properties that would otherwise be detrimentally affected by the formation of liquid capillary bridges between particles. Therefore, DW variants with alternating water contents were produced and subsequently mixed with non-absorbent, aggregate quartz particles of approximately 1 mm in size. The influence of various intended water contents in the whole bulk material as well as mixing times on bulk and flow properties were investigated. Single component mixtures, i.e., aggregate particles with water or hydrophobic silica, were also produced for comparison purposes. Thereby, all mixtures were analysed via the dynamic angle of repose, static angle of repose, ring shear tester and bulk density. Micro-computed tomography (µCT) and cryogenic scanning electron microscopy (SEM), including energy-dispersive X-ray spectroscopy (EDX), were also applied to examine the effects or rather the functionality of DW on cohesionless sand.

2. Materials and Methods

2.1. Material Processing

2.1.1. Preparation of Dry Water

Hydrophobic silica with a high specific surface area of 220 m2/g and primary particle size of 7 nm, namely Aerosil R812S by Evonik, was used to encapsulate deionised water and, thus, create dry water (DW). The physical properties of Aerosil R812S were provided by Evonik.
Similar to previous research [25,27], water was encapsulated with a high shear blender (MX 1250, Rommelsbacher) equipped with a blade rotor and six blades. Mixing was conducted at a constant speed of 22,000 min−1 (tip speed vt ≈ 80 m/s) for 60 s. Four variants of dry water, solely distinguished by the ratio of water to hydrophobic silica (H2O:R812S), were produced. Furthermore, the total mass filled into the mixing container amounted to 100 g. The chosen mixing ratios and cohering masses of each component are documented in Table 1.

2.1.2. Mixing Procedure of Sand with Dry Water

Coarse sand particles in the range from 0.7–1.2 mm were supplied by Quarzwerke GmbH and used as aggregates in the mixing process with DW. The sand was sieved at 500 µm in order to remove excess abraded material before experimental procedures, resulting in a median measured particle size of x50 ≈ 1 mm. In addition, the true density and the bulk density were 2.65 g/cm3 and 1.57 g/cm3, respectively.
Aggregate particles and DW were mixed using a lab-scale Turbula mixer (Willy A. Bachofen AG, Muttenz, Switzerland). Hence, coarse sand was mixed with DW to reach certain water contents within the whole bulk material. The calculated water content within the bulk varied from one to five percent by weight and mixing times were altered between 10, 20 and 30 min. Moreover, all mixing processes were performed at a low frequency of n = 49 min−1 as well as at a container filling degree of φ = 70%. An accurate overview of R812S contents (wR812S) and water contents (wH2O) for the individual used ratios is provided in Table 2. It must also be noted that reference examinations were conducted with the single substances combined with sand particles. Consequently, mixtures were created with 0.5 to 5 wt.% deionised water and three further mixtures were established solely with R812S.

2.2. Characterisation of Bulk Material

The dynamic angle of repose (AoR) was measured with the Granudrum by Granutools, which relies on the rotating cylinder method as described in [28,29,30]. In addition, the Granudrum measures the flow angle as well as the cohesion of a powder. Generally, the cylinder was filled to 50% with material by volume and measurements were conducted threefold. Velocities were increased stepwise after preconditioning from 2 to 50 min−1. Each step recorded 20 images at a rate of 1 image per second. Velocities were decreased in the same manner thereafter. It must also be mentioned that the glass screens were replaced with Perspex discs to avoid water from spreading across the screen, causing particles to stick and distort measurements. However, particle sticking was not entirely avoidable.
The static angle of repose was evaluated with a self-constructed measurement device, which was principally based on the hollow cylinder method mentioned in former studies [28,29]. The diameter and length of the cylinder were 60 mm and 120 mm, respectively. Additionally, the cylinder was filled with 150 mL of sample before it was elevated at a speed of 150 mm/min. Then, 4 images were taken of the resulting heap, each after a 90° rotation. Thereupon, the static AoR was calculated on the basis of an isosceles triangle with an equivalent area. Results with respect to the bulk density were also obtained as a consequence of filling the hollow cylinder.
A ring shear tester (RST-01, Dietmar Schulze GmbH, Wolfenbüttel, Germany) was applied for the bulk behaviour and consolidation characterisation. Measurements were performed at pre-consolidation stresses ranging from 125 Pa to 16 kPa and the steady-state flow properties were used to analyse bulk behaviour. The resulting shear stress was recorded over time during measurements. Mean values were calculated due to slip-stick oscillations during the steady-state. In addition, the shear cell had a volume of roughly 950 mL and the shear velocity was 1.0 mm/s. Supplementary theoretical information to the ring shear tester can be found in [31].
In addition, micro-computed tomography (µCT) images were taken of selected samples. The device used was the Xradia MicroXCT-400 (Carl Zeiss Microscopy Deutschland GmbH, Oberkochen, Germany). A cylindrical container was filled with samples without additional consolidation. Further image processing was carried out to highlight water and dry water within the particulate system.
Further imaging was conducted with the scanning electron microscope (SEM) Helios G4 CX by FEI/Thermo Fisher Scientific. Samples were initially frozen with liquid nitrogen before operating the SEM in cryogenic mode and additionally carrying out energy-dispersive X-ray spectroscopy (EDX).
Images and short descriptions of the applied apparatus are included in the Supplementary Materials.

3. Results and Discussion

3.1. Bulk Properties of Single Substance Mixtures with Sand

A full understanding of the possibilities dry water (DW) creates for the coarse bulk material is only possible if the influence of the single components, water and R812S, are considered separately in mixtures with sand. Accordingly, a brief introduction to the resulting dynamic angle of repose (AoR) and cohesive index (CI) in dependence of the water content as well as R812S content is presented in Figure 1. The mean value provides the AoR and fluctuations of the angle determine the CI. A CI of 0 implies that the bulk material flows ideally homogenously, whereas higher values suggest an irregular flow [30]. Moreover, the portrayed results emerged from a mixing time of tmix = 10 min as well as at a drum rotational speed of nDrum = 10 min−1.
Firstly, R812S marginally affects the flowability. The slight increase in AoR and CI may be associated with the added number or rather volume of fine silica particles. Thus, void volumes between aggregate particles are filled instead of solely coating the surface of aggregates, thereby obstructing the dynamic flow of mixtures. This assumption is substantiated by further inspecting the theoretical surface area coverage (SAC). The theoretical SACs of the aggregates with R812S at wR812S ≈ 0.1%, 0.25% and 0.75% are approximately 26 m2/m2, 59 m2/m2 and 177 m2/m2, respectively. Moreover, the high values of SAC are a result of the coarse sand particles and their corresponding specific surface area, which do not represent the SAC of later mixtures containing DW. An increase in nano-particulate-induced surface roughness presumptively has a minor effect on the dynamic flow, as seen for the mixture of aggregate sand and R812S at wR812S ≈ 0.1%. In contrast, Lüddecke showed that an increase in the surface roughness of finer host particles (≈40 µm) with nano-scale additives increases the flowability of metal powders due to the reduction in distance-dependent van der Waals forces between host particles [14]. However, the relation of van der Waals forces to weight forces decreases with increasing particle size [32]. For that reason, van der Waals forces are negligible in the size range of aggregates used within this study.
For mixtures containing water, on the other hand, severe effects on the dynamic flow properties of the coarse sand particles are evident. The dynamic AoR increases from an initial value of αd,r = 38.7° without water to αd,r = 56.2° at wH2O = 0.5 wt.%. The degrading flowability is attributed to liquid capillary bridges, which form once water is added to the granular material [33]. Furthermore, the theoretical degree of saturation for mixtures of aggregate sand and water at wH2O = 0.5%, 1%, 3% and 5% are roughly 1.6%, 3.2%, 9.6% and 16.0%, respectively. After the initial rise, the dynamic AoR does not increase significantly with higher amounts of water within the mixture. This is possibly due to the measurement procedure, as the Granudrum calculates a mean flow angle in the centre of the flow and fluctuations create CI [29]. At this point, it is important to state that mixtures containing wH2O = 5% could not be evaluated. Figure 2 underlines the aforementioned development of flowability with five consecutive images taken by the Granudrum at a rotating speed of n = 10 min−1.
For the starting material and wH2O = 0.5%, substantial irregularities in the angle and form of the bulk material are not visible during the five consecutive images. All other water-based mixtures nevertheless exhibit an inhomogeneous flow regime at the given rotational speed, labelled additionally by an earlier and more distinct avalanching effect with higher water contents. Avalanching is presumptively a consequence of liquid bridges forming and, thus, clustering at higher liquid contents, as described by Herminghaus [33]. For that reason, single particles are not able to flow independently, and a cohesive nature of the bulk material prevails.
Although the dynamic AoR may not reflect definite results from wH2O = 1% and higher, fluctuations of flow can perhaps assist with respect to mixture cohesiveness. Hence, the CI increases constantly with greater water contents, indicating the formation of extensive liquid bridges between single, non-absorbent particles and, thus, agglomerates or particle clusters emerge. As a result, an irregular flow of the bulk material emerges.
The physical properties of bulk granular materials cannot be described by one measurement method alone as the flow properties are subject to the stress state. Hence, multiple methods of analysis must be utilised to gain full knowledge of the flow behaviour of a bulk material and predict its behaviour for a given application [34]. Further knowledge of the existing mixtures and influence of prevailing forces on the mixtures may be derived from the static AoR. 
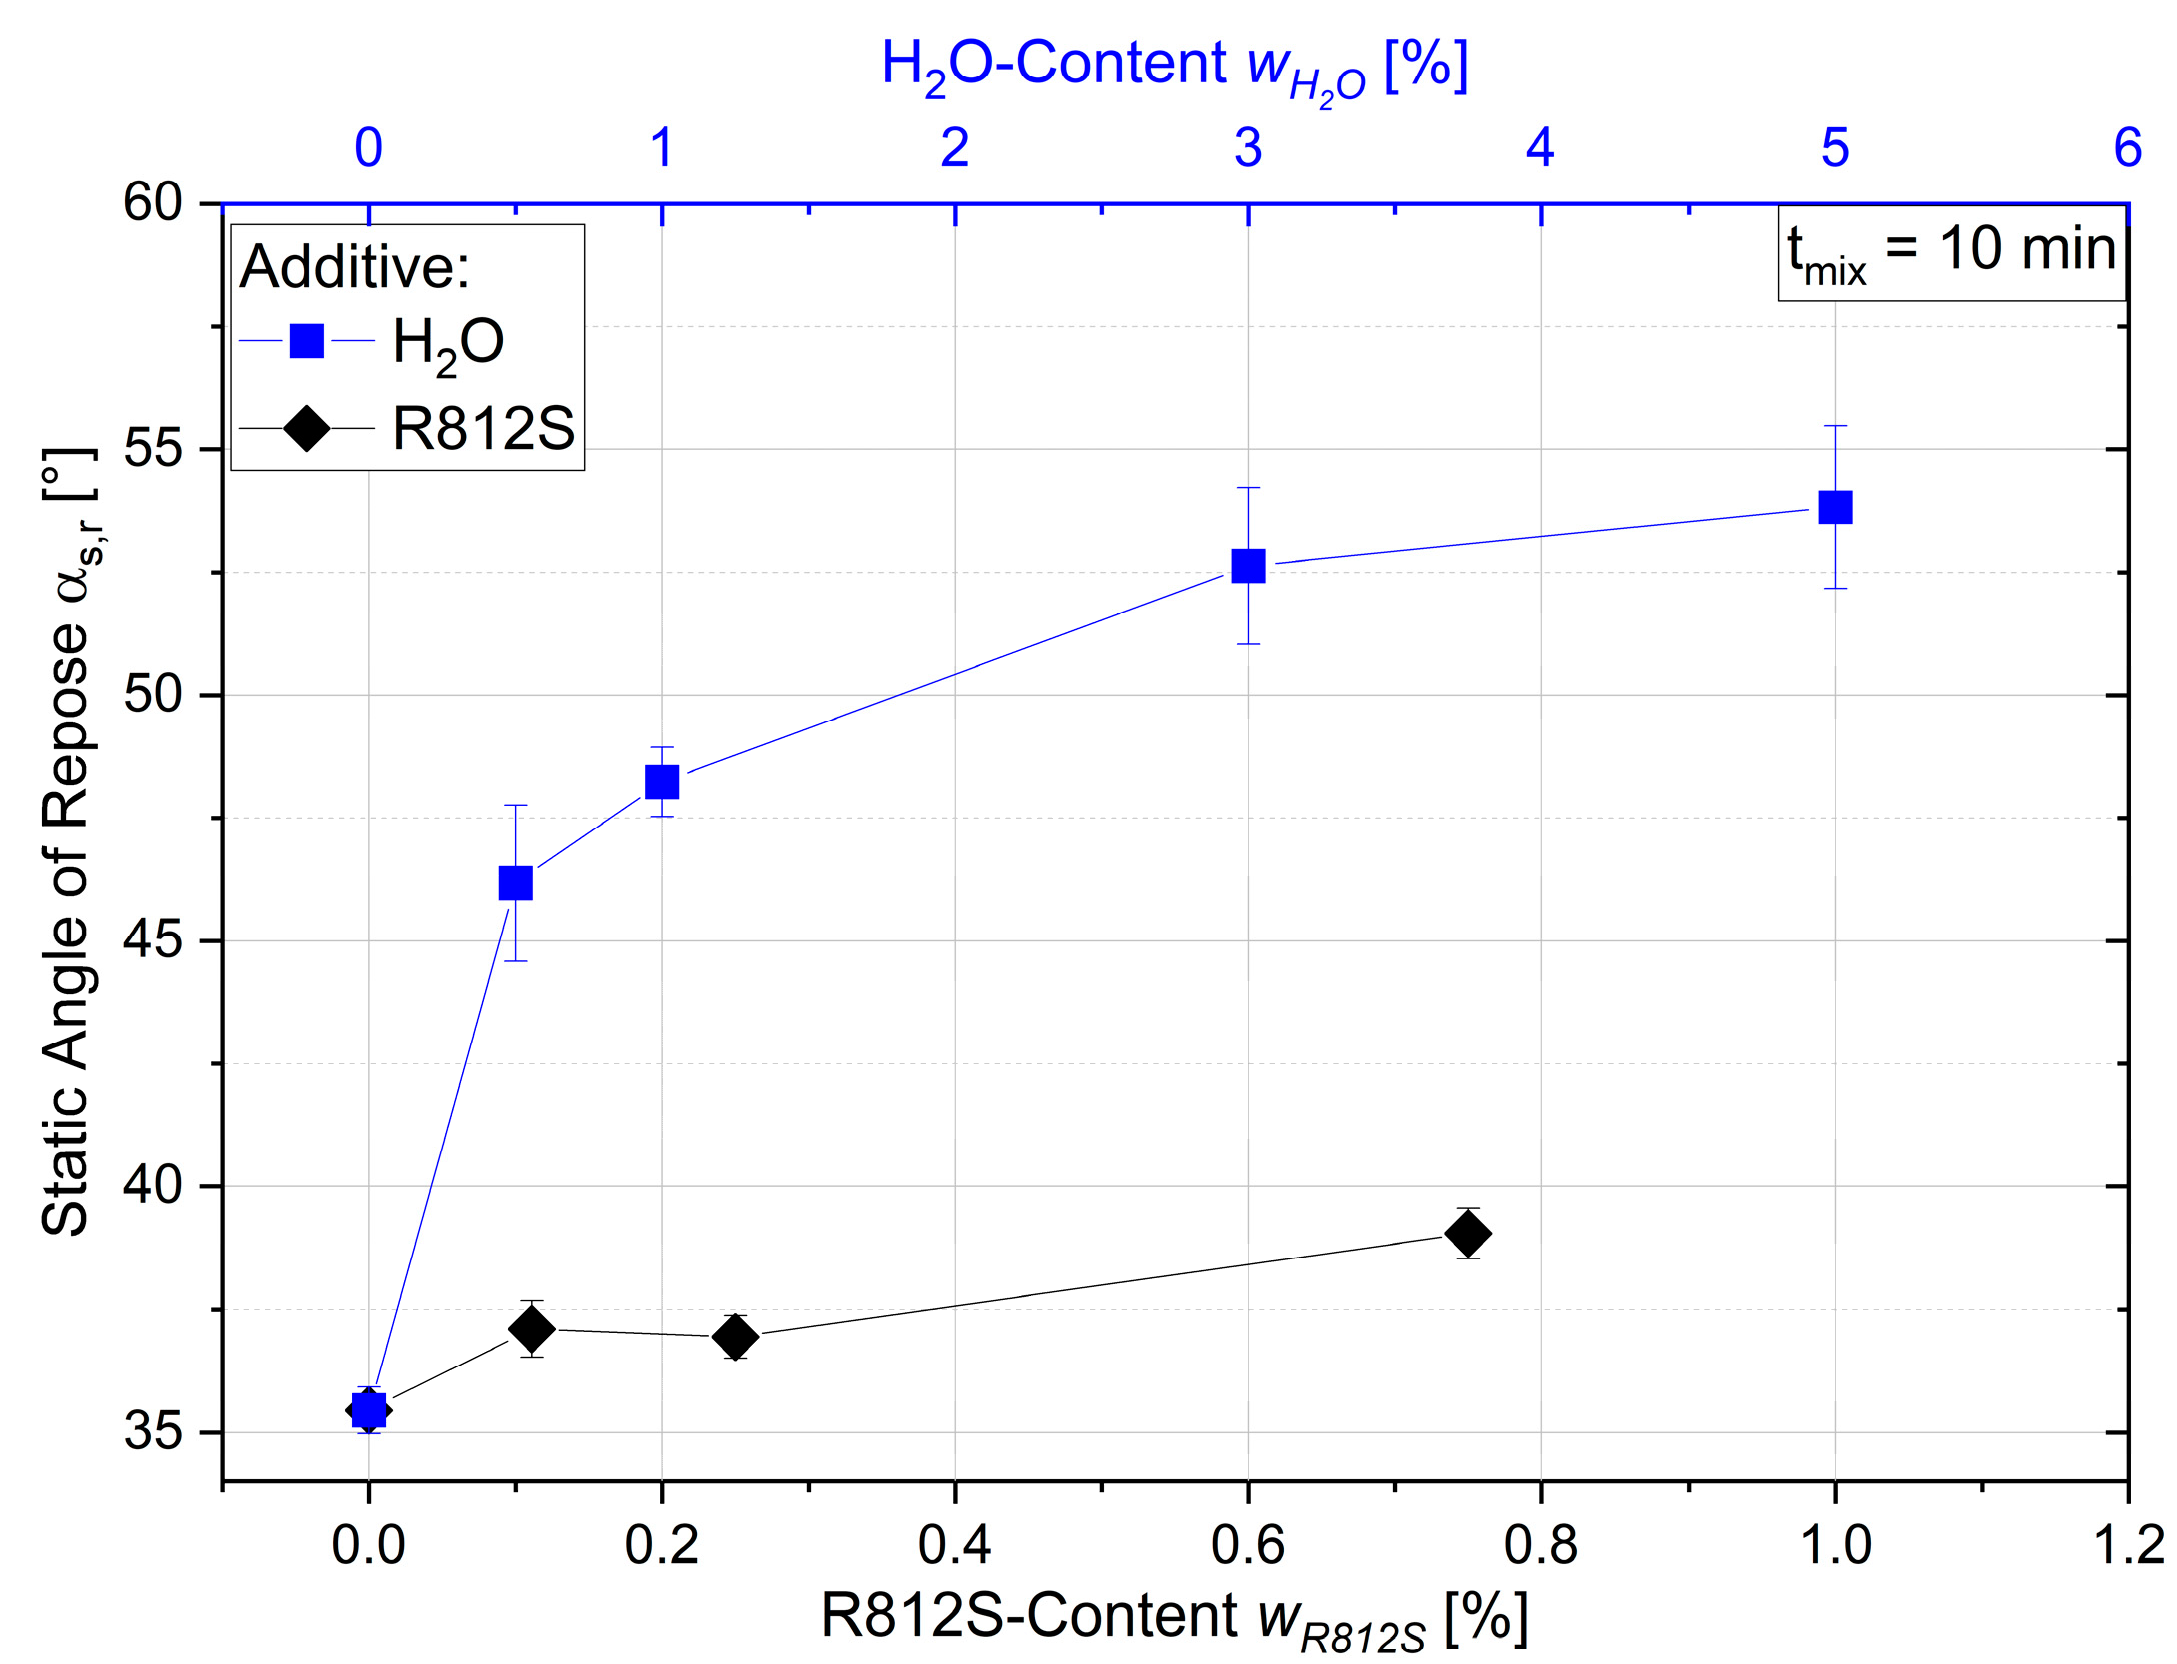
Figure 3 depicts the resulting AoR in a static environment for the single component mixtures with water and R812S. Moreover, the static AoR is displayed as a function of the contents for the respective substances and a mixing time tmix of 10 min.
Within Figure 3, R812S shows similar tendencies in the development of the static AoR when compared to the dynamic AoR in Figure 1. The static AoR is slightly higher than that of the starting material (wH2O = 0%), whereby a significant increase is not visible within the examined range. For mixtures including water, the static AoR is in agreement with the dynamic AoR to a certain extent. A sharp rise in the AoR is observed with the addition of water. The AoR begins at a value of αs,r = 35.5° and increases to αs,r = 46.2° for the starting material and the mixture with wH2O = 0.5%, respectively. Thereafter, the slope decreases with an increasing water content until it seemingly approximates to a constant value of αs,r ≈ 55°. These results coincide with the findings made by Samadani and Kudrolli [35]. They found that the AoR rises abruptly, increases and, subsequently, saturates as the volume of a fluid is increased. In addition, Samadani and Kudrolli detected a greater surface roughness of bulk material whilst adding water, explaining it as a consequence of clustering or rather cohesion between particles [35]. Clustering and cohesion can additionally be observed in Figure 4. Herein, illustrative images taken during the analysis of the static AoR are displayed for dry sand (starting material) and all mixtures containing water.
The influence of water on the bulk material can additionally be analysed in a quasi-static environment, namely by conducting measurements with a ring shear tester at various degrees of consolidation. Figure 5 demonstrates the termination locus resulting from the mean shear stress at steady-state flow for dry coarse sand as well as mixtures of coarse sand and water. Furthermore, mean shear stress values at steady-state flow were calculated as slip-stick effects were observed, especially for mixtures with coarse sand and water.
Noticeably, the shear stress of mixtures containing water does not deviate significantly from the values of the dry material at low consolidation stress. Mixtures containing water rather constantly demonstrate slightly lower shear stress at the lowest tested normal stress, which may be due to a lubricating effect between particles caused by liquid. These deviations are, however, minor in comparison to the effects at higher normal stress. The shear stress increases considerably at normal stresses of σ ≥ 1 kPa for mixtures with wH2O ≥ 3%, whereas increased shear stress is postponed for the mixture with the lowest water content of wH2O = 1%. Assuming water only resides on outer particle surfaces, higher normal stress consolidates the bulk solid and, consequently, forces the liquid downward between particles, thereby resulting in a higher water concentration within the given volume. Hence, tensile forces are presumably higher in the lateral direction and, thus, adhesive forces between particles increase. The shear stress increases accordingly under sufficient normal stress. For higher water contents, an increase in shear stress may occur at lower normal stress as a result of the degree of saturation within the bulk material, which, in turn, additionally increases when the bulk material is further consolidated. Cohesionless bulk materials are assumed to have a near linear progression that runs through the origin. However, similar nonlinearities were observed in previous studies once the Bond number, a dimensionless unit for cohesive strength, was increased [36].
Further insight can be gained by transferring the above-portrayed data into an angle of internal friction at steady-state flow, which results from the horizontal cutting plane of a bulk material during ring shear measurements. The angle of internal friction at steady-state flow φsf is calculated from the arc tangent of the ratio of shear stress at steady-state, defined in Figure 5 as τsf, to normal stress at pre-consolidation σpre [31]. 
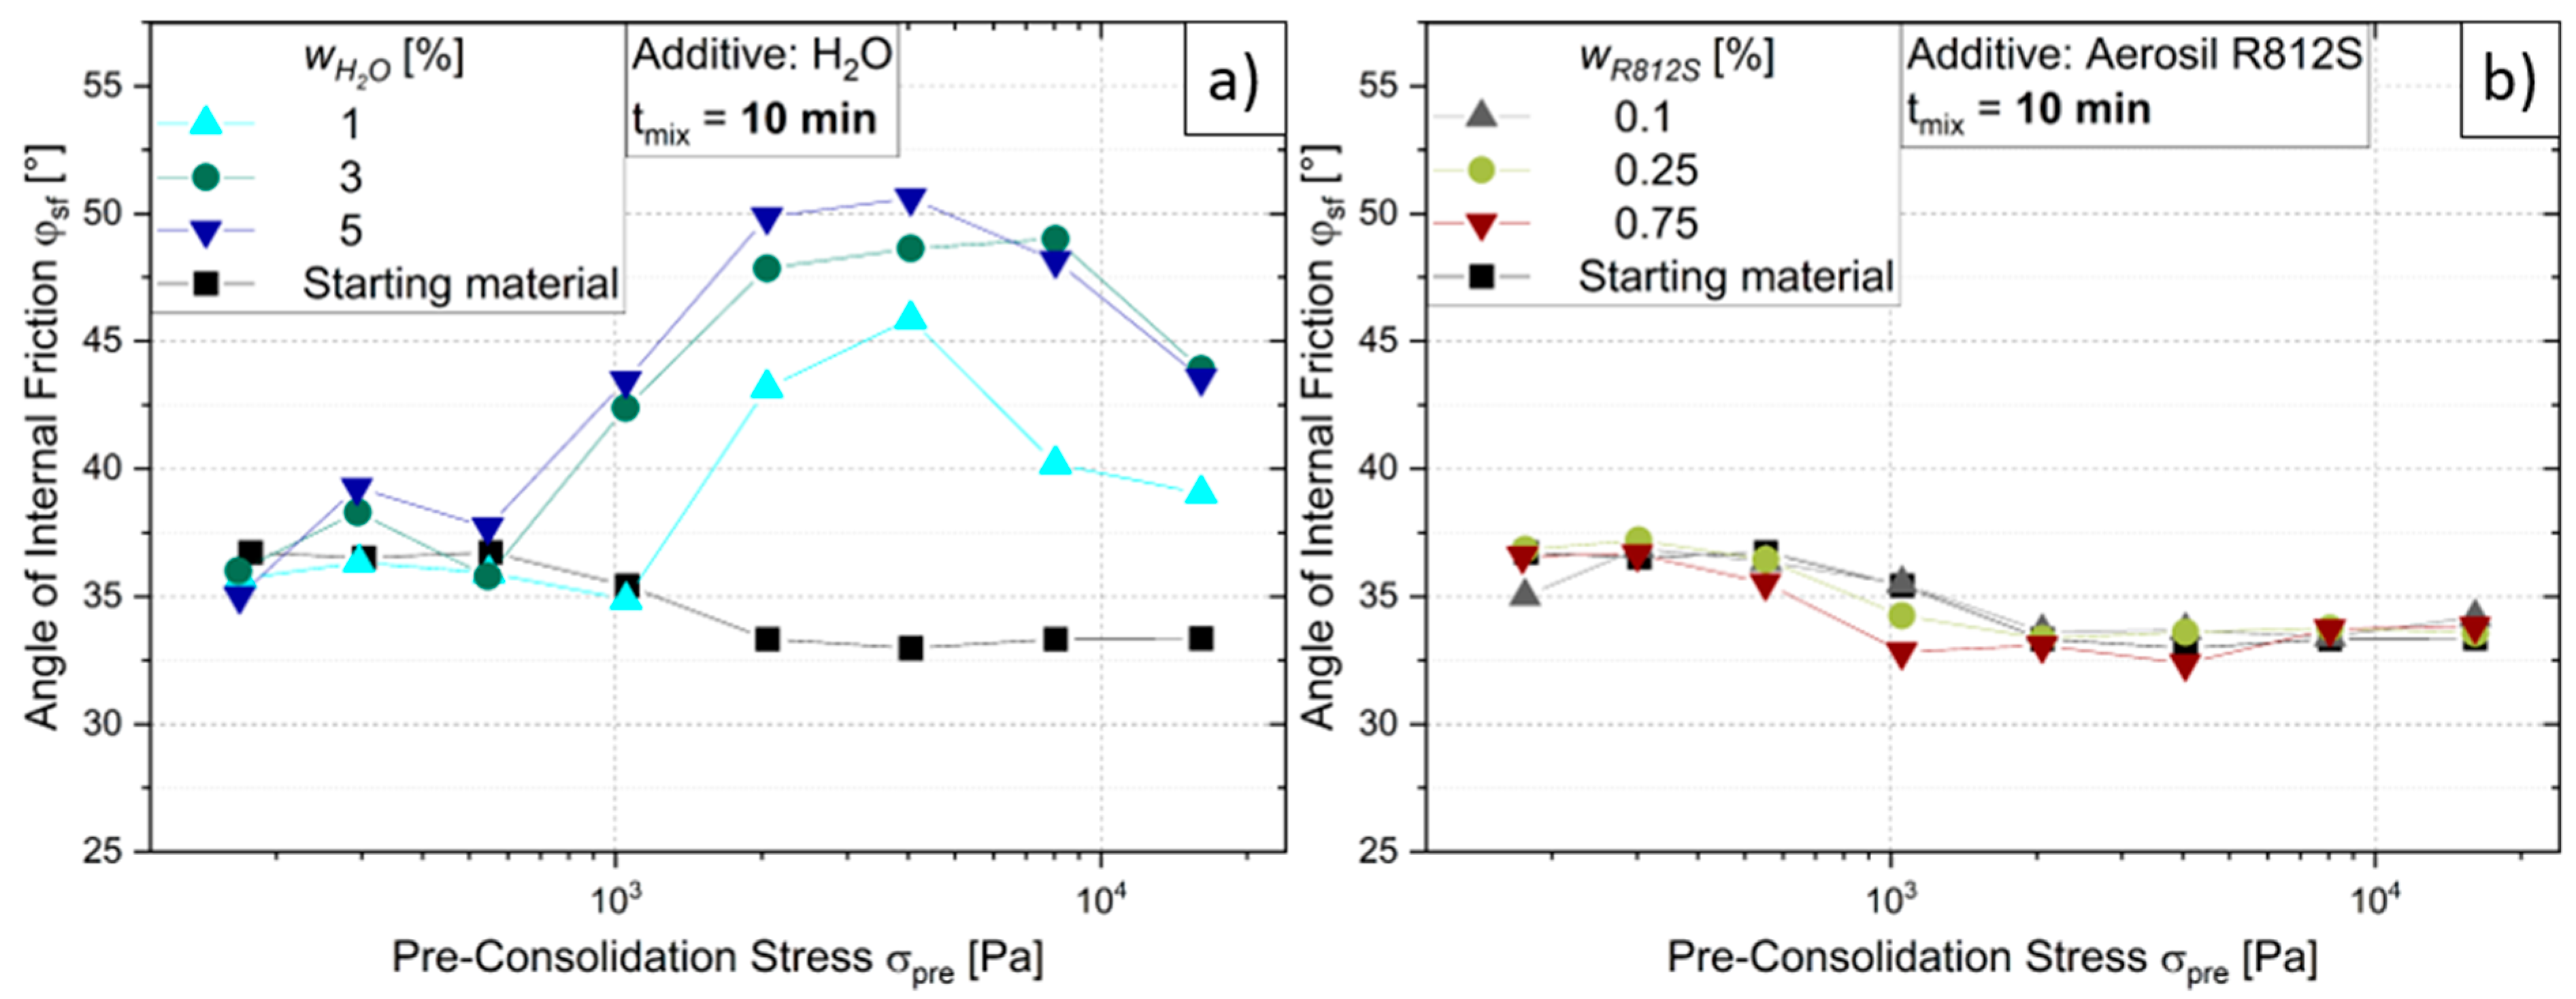
Figure 6a demonstrates the aforementioned angle of internal friction for different normal stresses of dry coarse sand and mixtures containing water and sand.
For dry coarse sand, φsf slightly decreases with increasing consolidation stress, which generally occurs due to the greater rise in frictional forces in comparison to adhesive forces at increased consolidation [31]. For mixtures containing water, on the other hand, φsf is primarily close to that of dry sand until σ = 1 kPa and σ = 500 Pa for wH2O = 1% and wH2O ≥ 3%, respectively. φsf subsequently increases with increasing consolidation stress and decreases at roughly σ = 8 kPa. In addition, φsf is principally higher for mixtures containing higher amounts of water. Higher values for φsf are presumptively a result of increased adhesive forces acting between particles due to liquid capillary bridges. The following decrease in φsf may be due to heightened frictional forces between particles as consolidation proceeds and water is pressed into otherwise porous regions within the bulk material, as discussed before. As a result, contact points or rather contact surfaces between particles presumptively increase, which promotes friction.
Figure 6b additionally demonstrates the effects of single component mixture with R812S. The angle of internal friction of mixtures containing R812S does not significantly differ from that of coarse sand alone. Minor deviations occur for higher amounts of R812S in the form of lower angles, once again hinting towards a slightly higher influence of frictional forces. This may be a result of the R812S particles filling porous volumes between coarse sand particles.
The porous structure, as well as porosity of the bulk material, is another important factor for Selective Paste Intrusion (SPI) as it influences the penetration depth of the cement paste, the uniformity of penetration and the amount of cement paste required to fill void spaces. Thereby, the bulk density can be considered a process-related form of analysis. The results for the bulk density are displayed as a function of the water content by mass in Figure 7. An increasing water content within the coarse bulk material evidently leads to lower bulk densities, which is inversely in accordance with the previously discussed results of the AoR. Thus, reduced flowability caused by accumulating liquid capillary bridges changes the porous structure by increasing the void spaces in the bulk material. Irregular porous structures, similar to the behaviour described in Figure 2 and Figure 4, were observed during experiments, which are validated by the combined given results.

3.2. Influence of Dry Water on Bulk Properties

The goal of utilising DW is primarily to incorporate water into the bulk material whilst counteracting the negative effects water has on bulk flowability and other properties, e.g., bulk density or inter-particle interactions. Naturally, the overall goal is to restore the aforementioned and, thus, reach the initial flowability of the starting material. From the previous investigation, it is also known that single component mixtures containing sand and R812S do not significantly affect bulk properties, thus, underlining the use of the starting material as a reference.
An example of typical curve progressions with respect to the dynamic AoR and related CI over the full spectrum of rotational speed are illustrated in Figure 8. Apart from the starting material, the mixtures of coarse sand and DW contained only the additive variant DW4:1. However, all water contents (wH2O = 1, 3, and 5%) within the whole mixture, resulting in proportionate R812S-contents (wR812S = 0.25, 0.75 and 1.25%), are included in Figure 8. Mixing times are constant at tmix = 10 min.
First and foremost, the mixture with wH2O = 1% demonstrates a near equivalent dynamic AoR and CI to that of the starting material. This can be considered a significant improvement compared to water alone, where already wH2O = 0.5% resulted in a sharp increase in the aforementioned values (cf. Figure 1). Thereafter, in Figure 8, the dynamic AoR and CI tend to increase with higher water contents. Noticeably, the dynamic AoR tends to start at higher values and, thus, initially decreases, followed by increasing angles at higher velocities. wH2O = 5% does pose an exception in the tendency as the dynamic AoR does not decrease, but rather remains constant before increasing. The aforementioned findings with respect to initially decreasing values are clearer for the CI, whereby an initial cohesion must be overcome before approximately constant values are achieved between nDrum = 10 min−1 and nDrum = 25 min−1. Presumptively, the particles within the bulk are not in full motion at lower rotational speeds, carrying the whole bulk material to its maximum angle of stability before it slips or collapses within the cylinder. This form of inconsistent flow is followed by a continuous flow regime at higher velocities, which may be supported by a closer inspection of the CI at different rotational speeds. Hence, adhesive forces must initially be overcome in order to ensure dynamic flow, similar to the state of a fluidised bed [37].
A closer inspection of the CI progression at two different drum rotational speeds is presented in Figure 9. Within Figure 9, mixing times are constant and all dry water additive variants are considered with different water contents within the entire mixtures.
Evidently, there is a slight decrease in the CI of the starting material (sand) from n = 2 min−1 to n = 10 min−1. These deviating values may be considered minor in comparison to the development of the CI for the mixtures containing DW. Firstly, the cohesive index at n = 2 min−1 increases with DW variants consisting of less R812S, possibly signifying the reduced prevention of liquid capillary bridges between particles. As a result, less R812S leads to an increase in cohesion at slow drum rotational speed. With the exception of the DW variant with the lowest R812S content (DW19:1), the CI in dependence of the total water content remains near constant for the other three variants at n = 10 min−1. The values for wH2O = 1% are exceptionally close to the values for pure sand (dry), which is a considerable improvement in comparison to results obtained with sand and water alone. For a mixture solely with water, the CI increases sixfold (cf. Figure 1). Potentially, higher rotational speeds increase the porosity between particles, which, in turn, results in less friction between the particles, subsequently maintaining initial flow properties. This assumption is only plausible as long as dry water particles are able to sustain friction and, thus, liquid bridging is prohibited.
Similar commencing cohesion was observed by Forny et al. for dry water alone. They determined that slight agitation is required in order to overcome persisting cohesion and initiate flow [25]. Corresponding effects were noticed whilst handling the complete mixtures within this study. However, according to Lumay et al., an intermittent flow within the rotating drum is not necessarily only the case for cohesive powders, but rather a general powder flow property related to low angular velocities as well as low Froude numbers [29,38].
Considerations must be made whether DW capsules are able to sustain stress during mixing for longer periods of time, especially with respect to later large-scale construction assignments. Hence, mixing times were varied as a method to increase the number of stress events within the created mixtures. The influence of DW variants and mixing times for different water contents wH2O are depicted in Figure 10. Furthermore, the DW variants are associated with the amount of R812S within the mixture, labelled as wR812S. Values obtained by measuring the starting material (coarse dry sand) are represented henceforth by a red line, as these target values are the desired outcome.
For wH2O = 1%, the dynamic AoR tends to increase with lower proportions of R812S within the DW. For shorter mixing times, the first significant reduction in bulk flowability, i.e., increasing AoR, is apparent for the mixture with DW19:1, implying insufficient R812S to counteract cohesive effects caused by water. Moreover, longer mixing times seem to be counterproductive for bulk flowability at wH2O = 1%, as the dynamic AoR increases over mixing time. Degradation of bulk flowability is exclusively postponed for the DW variant with the highest R812S content (DW4:1), where the dynamic AoR increases after tmix = 20 min. The aforementioned tendency is presumptively a consequence of the prevailing mechanical stress induced by considerably coarser sand particles during mixing combined with lower R812S contents. Several previous studies describe the sensitivity of dry water capsules towards mechanical stress, leading to the release of water [23,24,25]. These findings suggest that a specific amount of R812S may be required to prevent liquid capillary bridges from forming. Another hypothesis may correspond with the particle size of DW capsules and their resistance to mechanical stress. Figure 11 exhibits the characteristic particle sizes x10, x50 as well as x90 for each produced DW variant.
It becomes evident in Figure 11 that the ratio of water and R812S roughly correlates with the resulting particle size, which is possibly not only a consequence of the amount of R812S particles required to cover a given specific surface area of water droplets, but also the process conditions or parameters. For instance, deviations in the filling degree may influence the particle size distribution of the ensuing product. In Figure 11, the x10 values remain near constant for all DW variants. Furthermore, the median particle sizes (x50) are approximately equal for the three DW variants with the highest proportions of R812S, whereas the variant DW19:1 with the lowest R812S content has a significantly higher x50. A moderately different tendency can be observed for the x90 values, where the global progression shows an increase in particle size for DW variants with higher water contents. Altogether, DW19:1 has the coarsest particles with the highest span within its particle size distribution.
Regarding the aforementioned hypothesis and Figure 10, coarser DW particles are presumptively more vulnerable towards mechanical stress, whether pressure or friction, during mixing and thereby are more prone to releasing water into the bulk material. The occurrence of liquid bridges is, therefore, prolonged with higher proportions of R812S as well as finer particles at wH2O = 1% in Figure 10. In general, shorter mixing times are advantageous for wH2O = 1%, as a higher number of stress events may result in eventual capsule disintegration.
Interestingly, for higher water contents of wH2O ≥ 3%, on the other hand, longer mixing times lead to a lower dynamic AoR (cf. Figure 10 centre and bottom). This is possibly due to the decreasing bulk density of the DW variants, resulting in higher volumes of additive within the mixture. As an example, the added volumes of DW4:1 at wH2O = 1% and wH2O = 5% resulted in ratios of DW volume to sand volume (VDW/VSand) of approximately 0.16 and 0.80, respectively. Consequently, longer mixing times are necessary to reach higher mixing qualities for a given water content. The DW variant DW19:1 poses an exception of the aforementioned tendency. Shorter mixing times are still advantageous and the dynamic AoR of mixtures containing DW19:1 increases thereafter to values similar to mixtures of sand and water alone (cf. Figure 1). This outcome further suggests coalescence of water over the mixing time for DW variants containing insufficient amounts of R812S and coarser DW capsules. Sufficient stress events of DW capsules between coarse sand particles thereby result in DW fragmentation, allowing liquid bridges to form. However, the added volume of each DW variant with respect to their bulk density may have an additional effect. Higher numbers of R812S particles within DW variants (DW4:1 > DW6.66:1 > DW9:1 > D
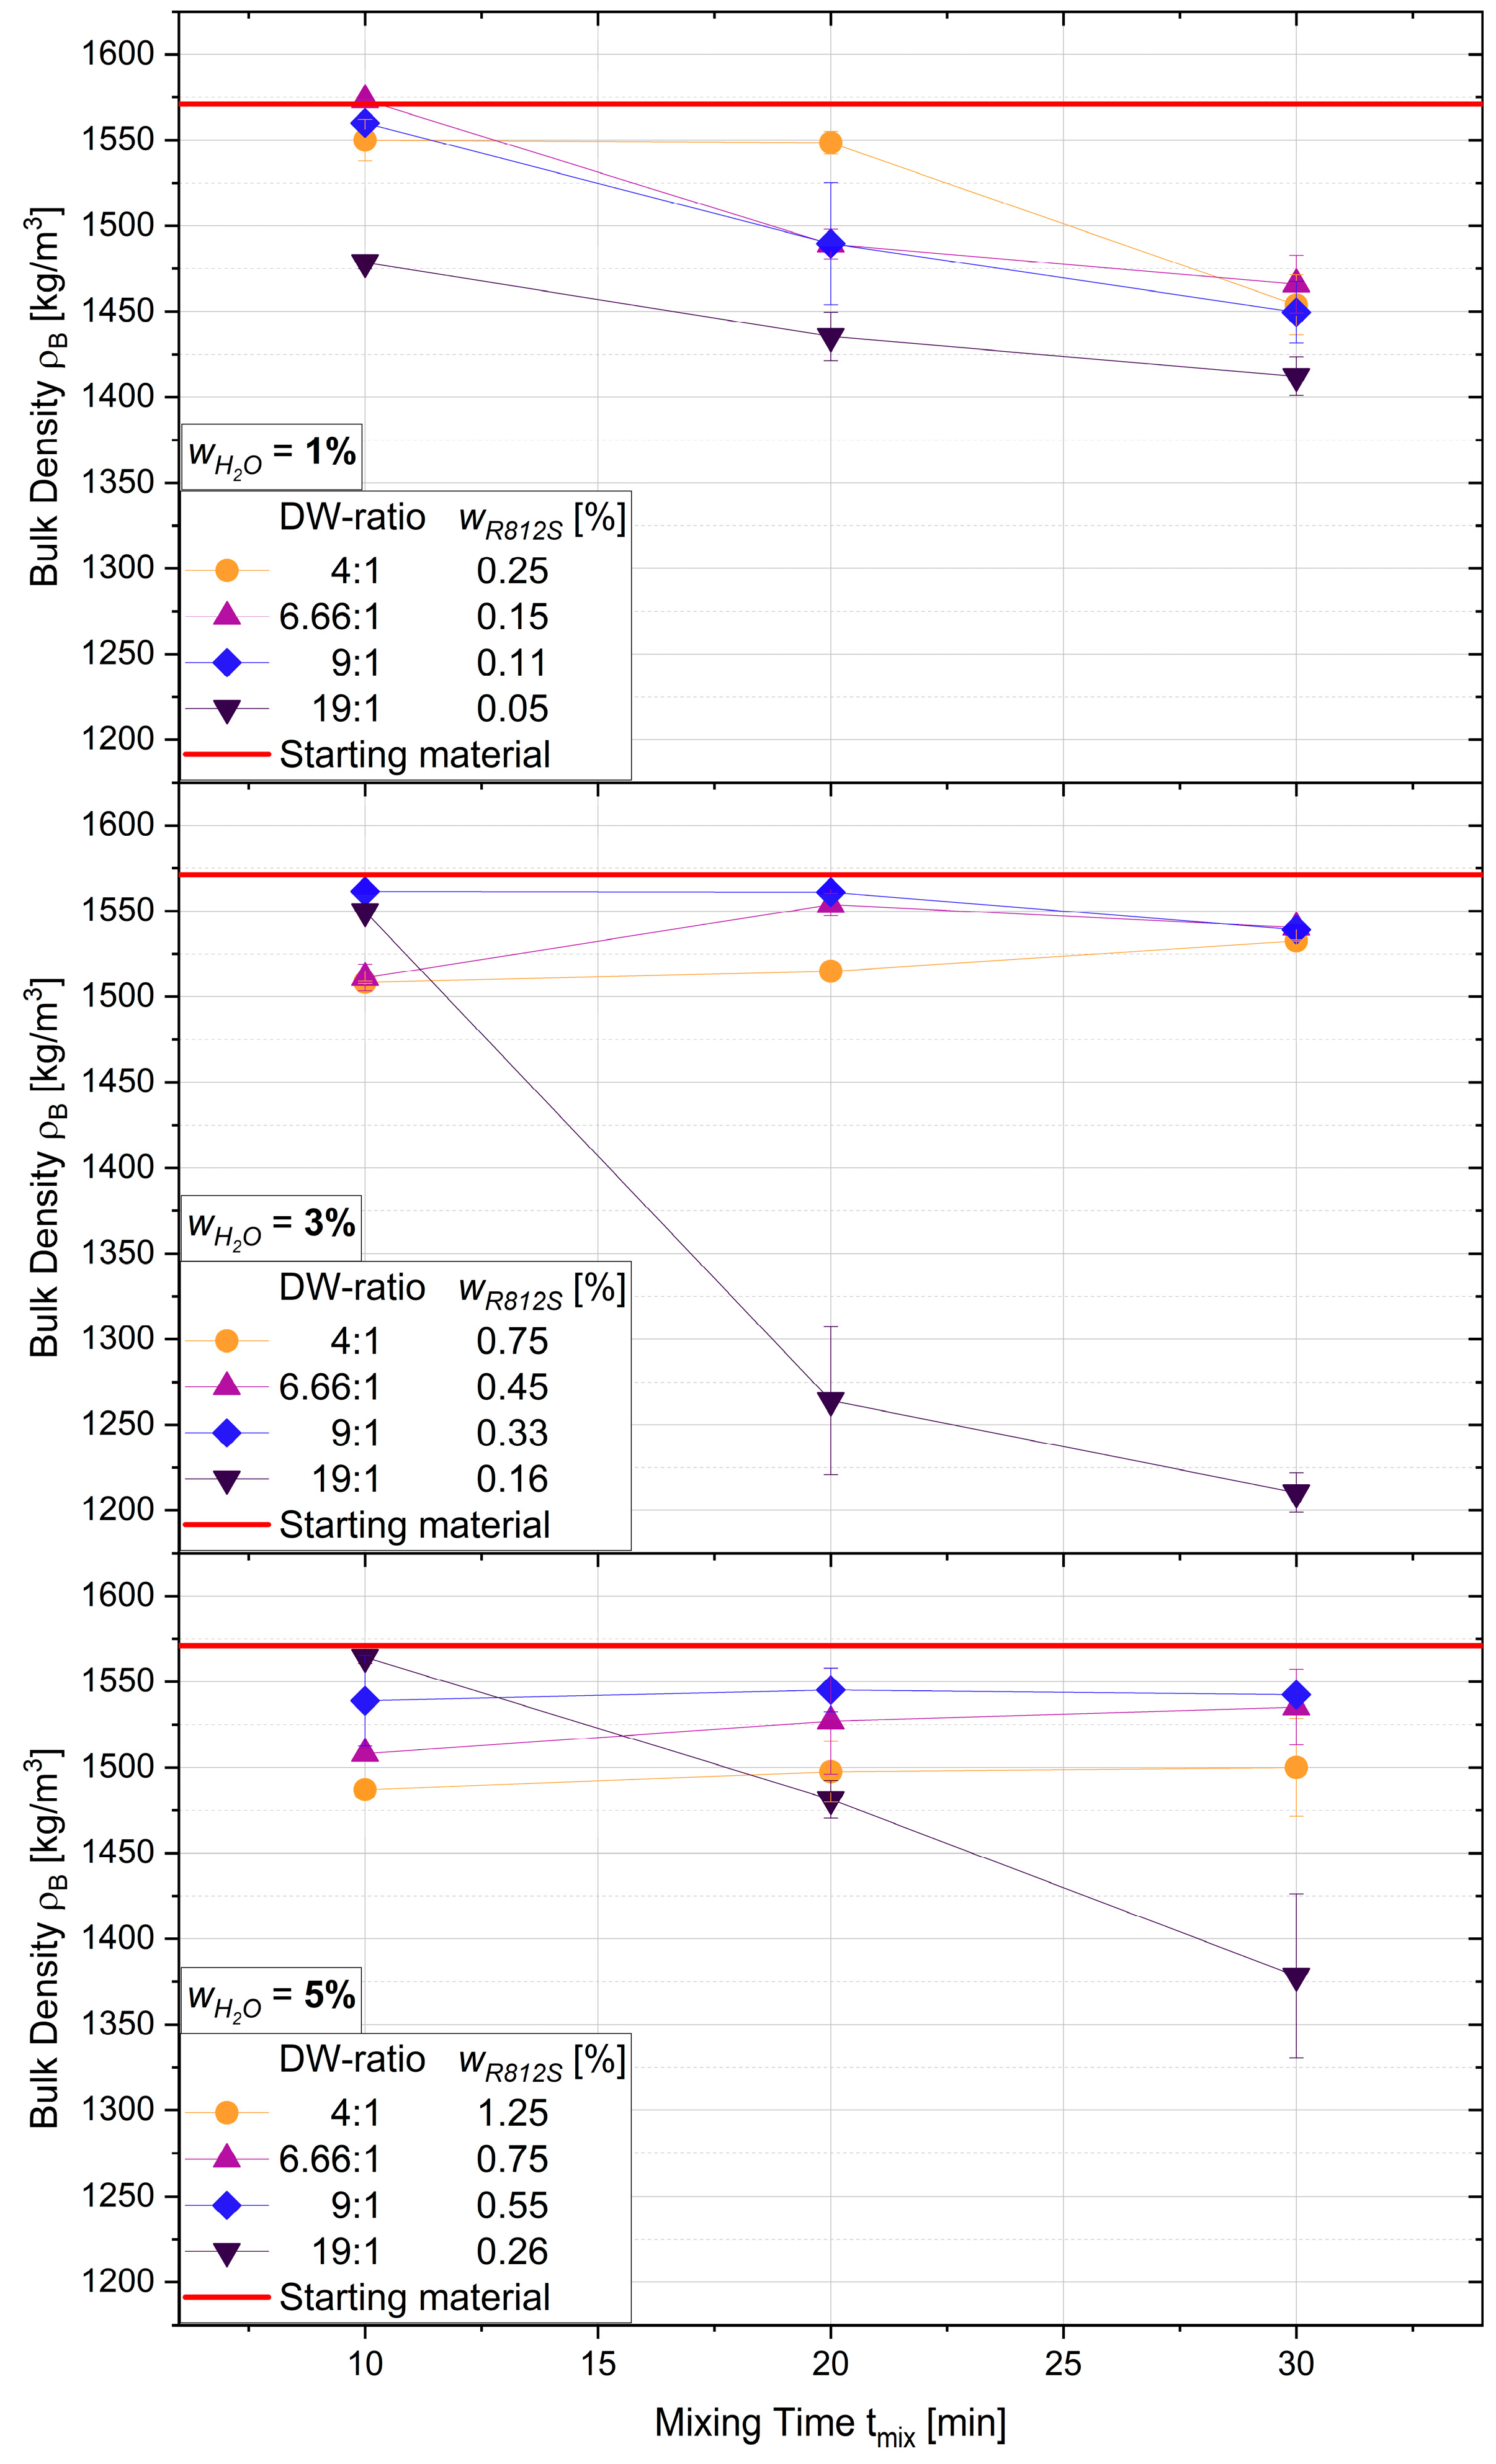
19:1) and their correlated volumes for a given water content within a mixture presumably cause attenuation of stress for the capsules. In addition, the total porosity of complete mixtures (sand and DW) is likely correlated with the aforementioned number of R812S particles and would, therefore, contribute to the dampening of stress events of DW capsules between aggregate sand particles.
Comparable developments are reflected with the CI as a function of the mixing time for all DW variants in Figure 12. In general, the CI is significantly higher for the DW variant with the least amount of R812S and largest particle size (DW19:1). The CI for the aforementioned variant also increases sharply at longer mixing times for all water contents, supporting previous assumptions with respect to capsule fragmentation. As opposed to the dynamic AoR, however, the CI does not converge to the values generated by mixtures with sand and water alone. In comparison, the highest value achieved with DW19:1 at wH2O = 3% is CI ≈ 38, whereas a mixture solely containing water lies at CI ≈ 85. Hence, minimal contents of R812S still contribute to a steadier flow of bulk granular materials containing water at shorter mixing times. Regarding the mixtures with the other DW variants, the CI increases slightly at longer mixing times with wH2O = 1% but stays approximately constant for the other water contents. Moreover, the CI values are close to the reference starting material. In conclusion, the data emphasises the potential of DW as an additive with the function of storing water in coarse bulk materials and simultaneously maintaining initial flow properties. In comparison to the starting material (dry sand), results show that mixtures containing DW with water contents up to wH2O = 3% have near equivalent dynamic flow properties. A minimum requirement of R812S as well as DW particle size, characterised by DW9:1, is, however, necessary for stable mixtures. Long-term storage, nevertheless, may pose a problem due to constantly evaporating water whilst R812S remains in the mixture.
Further insight into the functionality of DW is demonstrated in Figure 13, where micro-computed tomography (µCT) images of a mixture of coarse sand (grey) and water (blue) is depicted on the left as well as a mixture of coarse sand (grey) and DW (light blue) presented on the right. µCT images were taken of selected samples intending to explore events that prevail between DW and sand during mixing or rather the effect of mixing on the final product. The presented mixtures contain water contents of wH2O = 5% for both solely water (left) as well as DW6.66:1 (right). Figure 13 demonstrates complete networks of liquid capillary bridges, which occur by adding the aforementioned water content without DW. For mixtures of aggregate sand and DW, DW mainly resides in the valleys of the particle surface and does not seem to create an even coating on sand particle surfaces. A clear distinction between DW and water alone was not achieved by µCT imaging. Possibly, layers of R812S are too thin to be detected or the difference in density between sand and hydrophobic silica is insufficient for a clear distinction of the respective materials. Liquid capillary bridges, however, are predominantly not visible, partially explaining the reason for maintaining flow properties with high water contents. Unfortunately, a clear distinction between water and R812S and, thus, whether DW capsules sustain mechanical stress, is not possible via µCT imaging. Multiple theories are plausible at this point as to whether capsules are fractured and how water and R812S are distributed on sand particle surfaces. The present µCT images do not portray dynamic events during the mixing process, but rather represent bulk behaviour in a static environment.
A closer inspection of DW capsule development during, or rather, after mixing, is possible via scanning electron cyromicroscopy (CyroSEM) imaging, which is displayed exemplarily with different magnifications in Figure 14. These images do not demonstrate the exact outcome, as DW capsules did partially detach from sand particle surfaces due to sample pre-cooling with liquid nitrogen beforehand. Nevertheless, DW capsules in a variety of sizes are clearly visible within Figure 14. In addition, the main proportion of DW capsules are found in the valleys of the particle surface, which supports findings from µCT imaging. Hence, DW particles are able to sustain mechanical stress during mixing until they are transported to protective cavities upon the surfaces of sand particles.
Further energy-dispersive X-ray spectroscopy (EDX) confirms the main components within the mixtures of this study. Figure 15 visualises results from EDX measurements for both DW alone as well as DW on a coarse sand surface. Within Figure 15a,b, the dominating element of solely DW is oxygen (blue) with traces of silicon (yellow) and carbon (green). This is a result of the abundance of water within the tested variant DW9:1 as well as oxygen being an integral part of fumed silica (SiO2). Note, hydrogen is not detectable in EDX measurements, for it does not have core electrons. Supplementary information to this topic can be found in [39]. Mixtures of coarse sand and dry water, on the other hand, do have a higher proportion of silicon, as seen in Figure 15c,d. Naturally, the higher amount of the element silicon is attributed to the coarse quartz particle. Moreover, the DW capsule is highly visible upon the quartz particle surface, once again denominated by an increased proportion of oxygen. The surface surrounding the DW capsule in Figure 15d presents a fairly even distribution of silicon and oxygen, which coincides with estimated weight percentages of approximately 52 wt.% and 45 wt.%, respectively. Traces of carbon are found in Figure 15b as well as c and presumably occur from hexamethyldisilazane (HMDS), which is used to treat Aerosil R812S. Further information with respect to the EDX measurements conducted here is available in the Supplementary Materials.
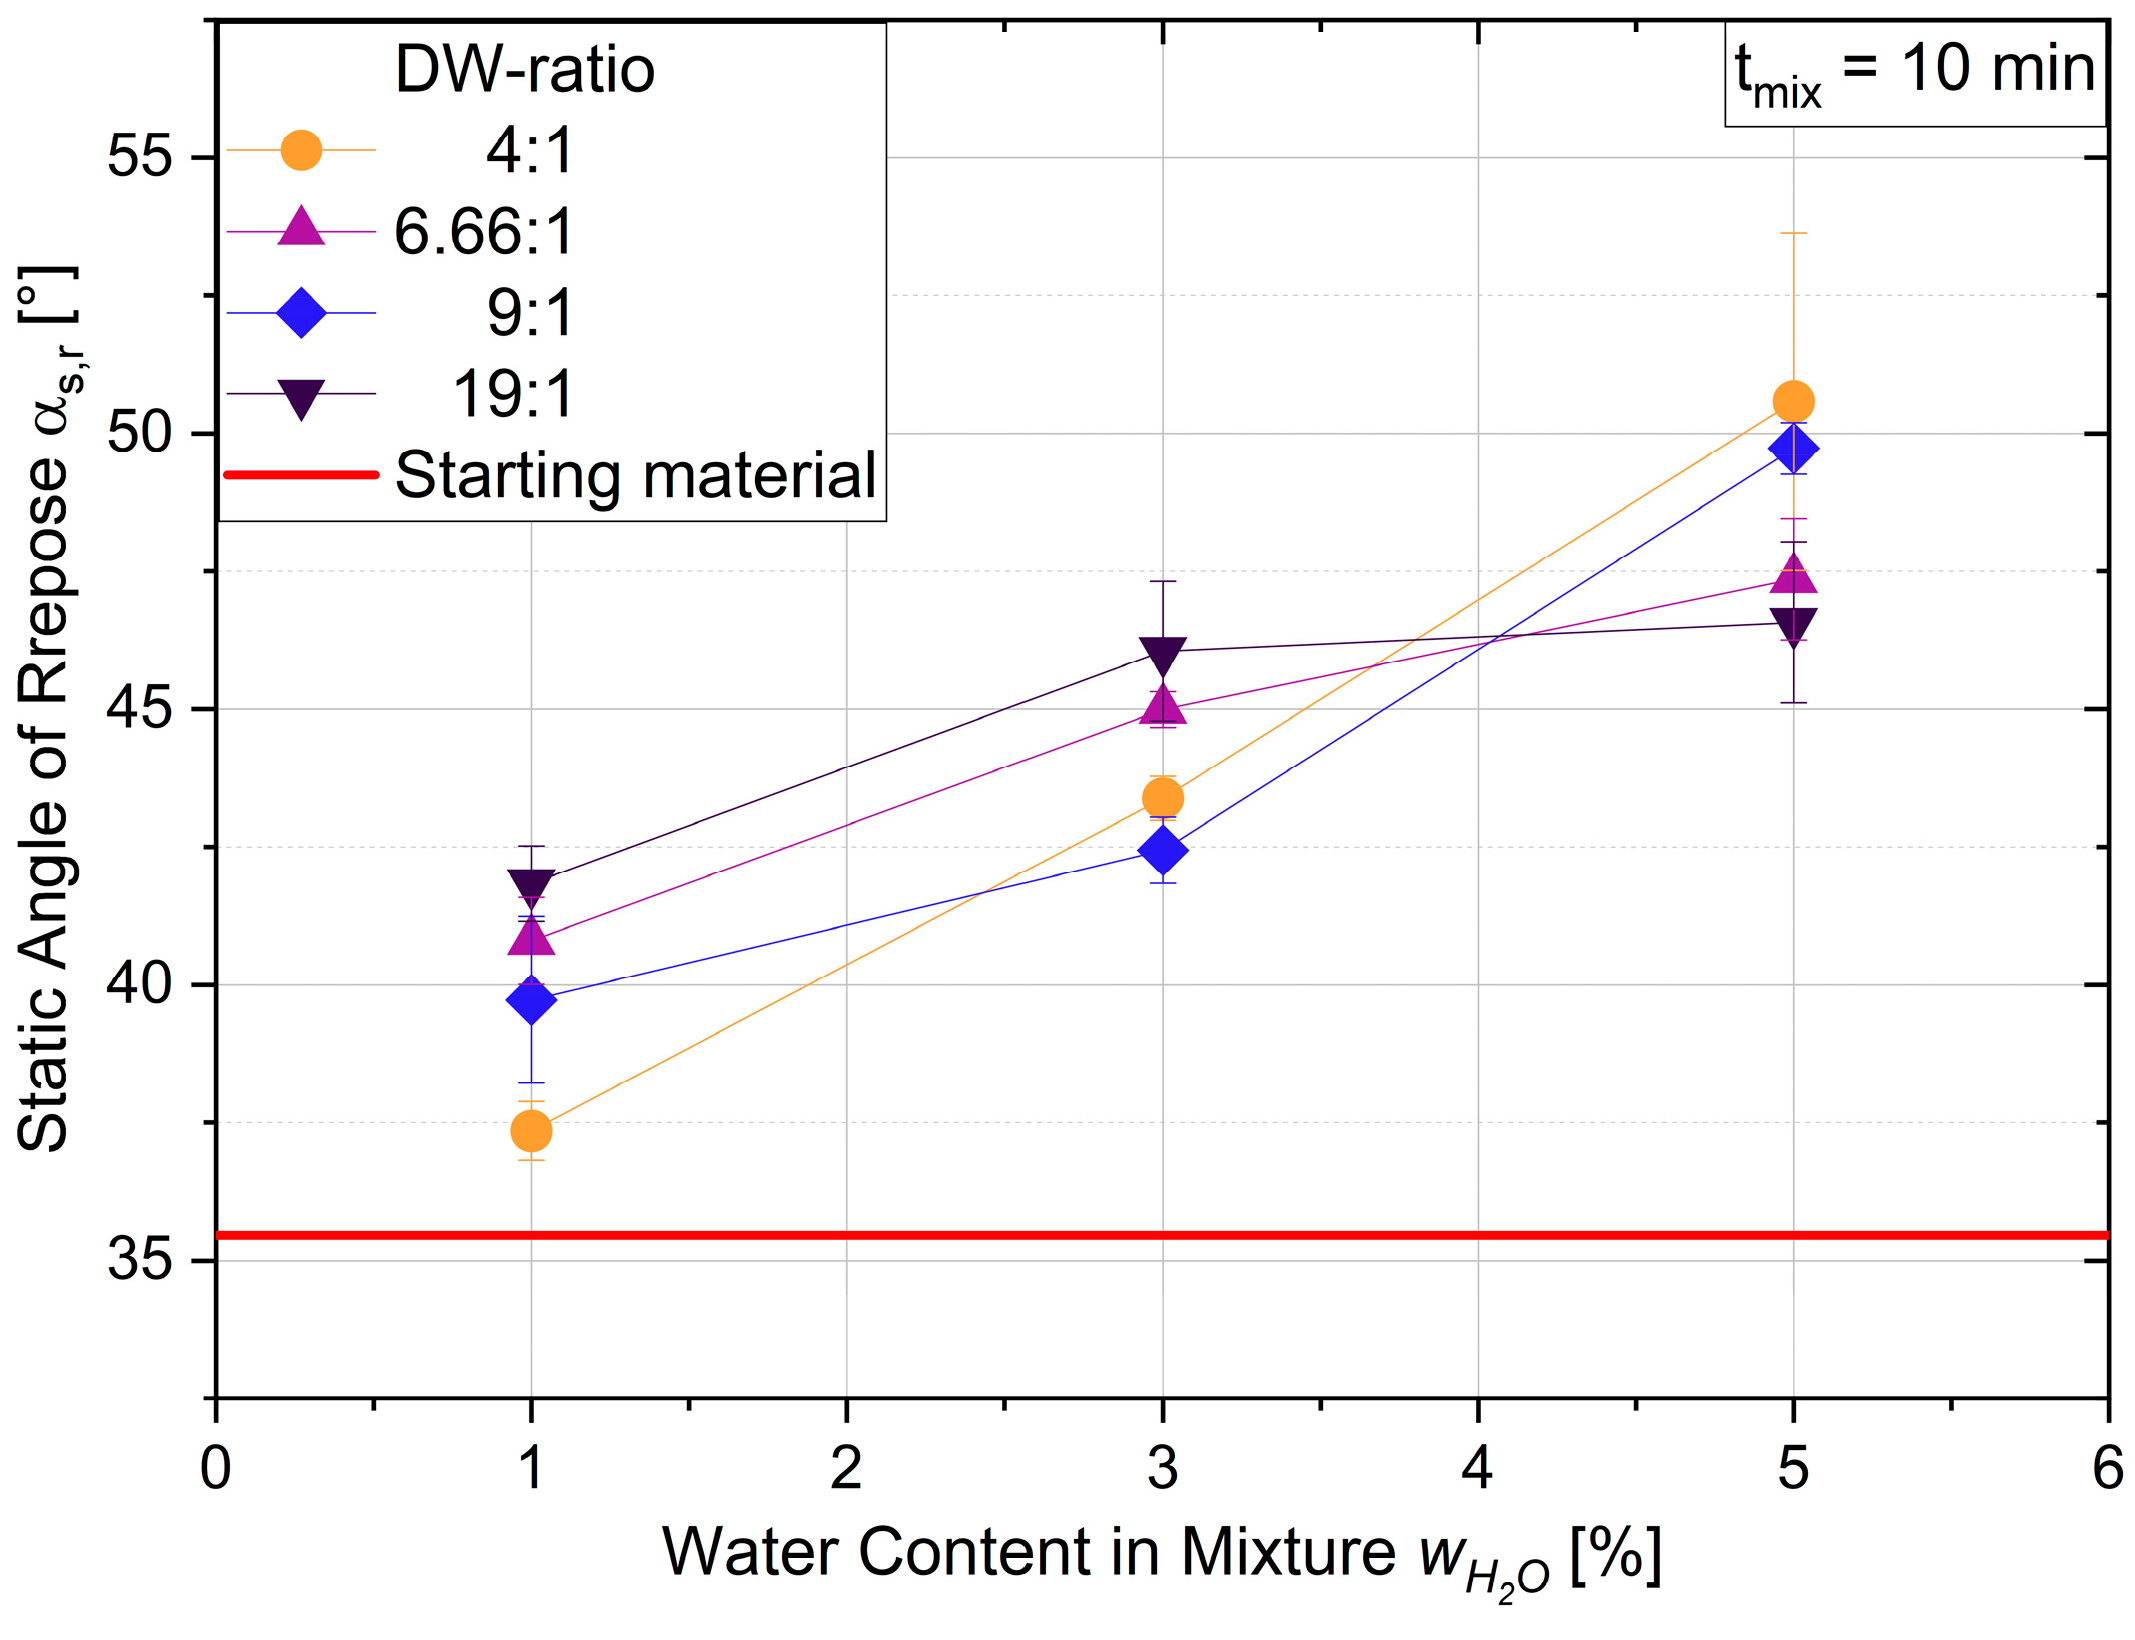
Although the rotating drum method relates to flow properties at low consolidation stress and thereby particle bed additive manufacturing processes [30], complementary information may be derived from flowability tests in a static or quasi-static surrounding. In relation to SPI, the static environment may also describe bulk behaviour in storage, shortly before the bulk material is transported to its designated surface. Consequently, results obtained regarding the static AoR as a function of the water content wH2O for all DW variants are presented in Figure 16.
The global tendency in Figure 16 principally indicates that the static AoR increases with the water content (wH2O) and, thus, the amount of DW is increased. The previous relation of static AoR to the DW variant is not evident for higher wH2O. In contrast to the dynamic AoR, DW variant 19:1 does not pose an exception in regard to significantly higher AoR values. As a matter of fact, DW variant 19:1 marginally demonstrates the highest static AoR until wH2O = 3%. Noticeable distinctions between samples were, however, observed, i.e., mixtures turning from quasi-dry to wet, which indicates the emergence of liquid capillary bridges as discussed and supported by the dynamic AoR. The aforementioned results are presumably a consequence of similar static friction that exists between particles. In addition, the prevailing mechanisms are the gravitational force and cohesion for a bulk material in a static environment. Once the bulk material at hand is set in motion, the cohesive forces become less dominant due to an increase in inter-particle porosity, or rather, void volume between particles. As mentioned beforehand, the decisive factor to overcome initial cohesion is, to an extent, the amount of hydrophobic silica in a mixture. Consequently, the effect of rolling friction in relation to adhesive forces caused by capillary liquid bridges increases once in motion. Noticeably, the mixture containing DW4:1 and wH2O = 1% has a near equivalent static AoR compared to the mixture of sand and R812S with the same wR812S = 0.25% (cf. Figure 3). In this case, water does not seem to have an effect on the AoR, presumably due to sufficient quantities of R812S particles and adequate DW particle size to protect capsules from fracturing. At water contents wH2O ≥ 3%, the decisive factor characterising static bulk behaviour at higher water contents within mixtures, however, seems to be the water content and not the content of hydrophobic silica.
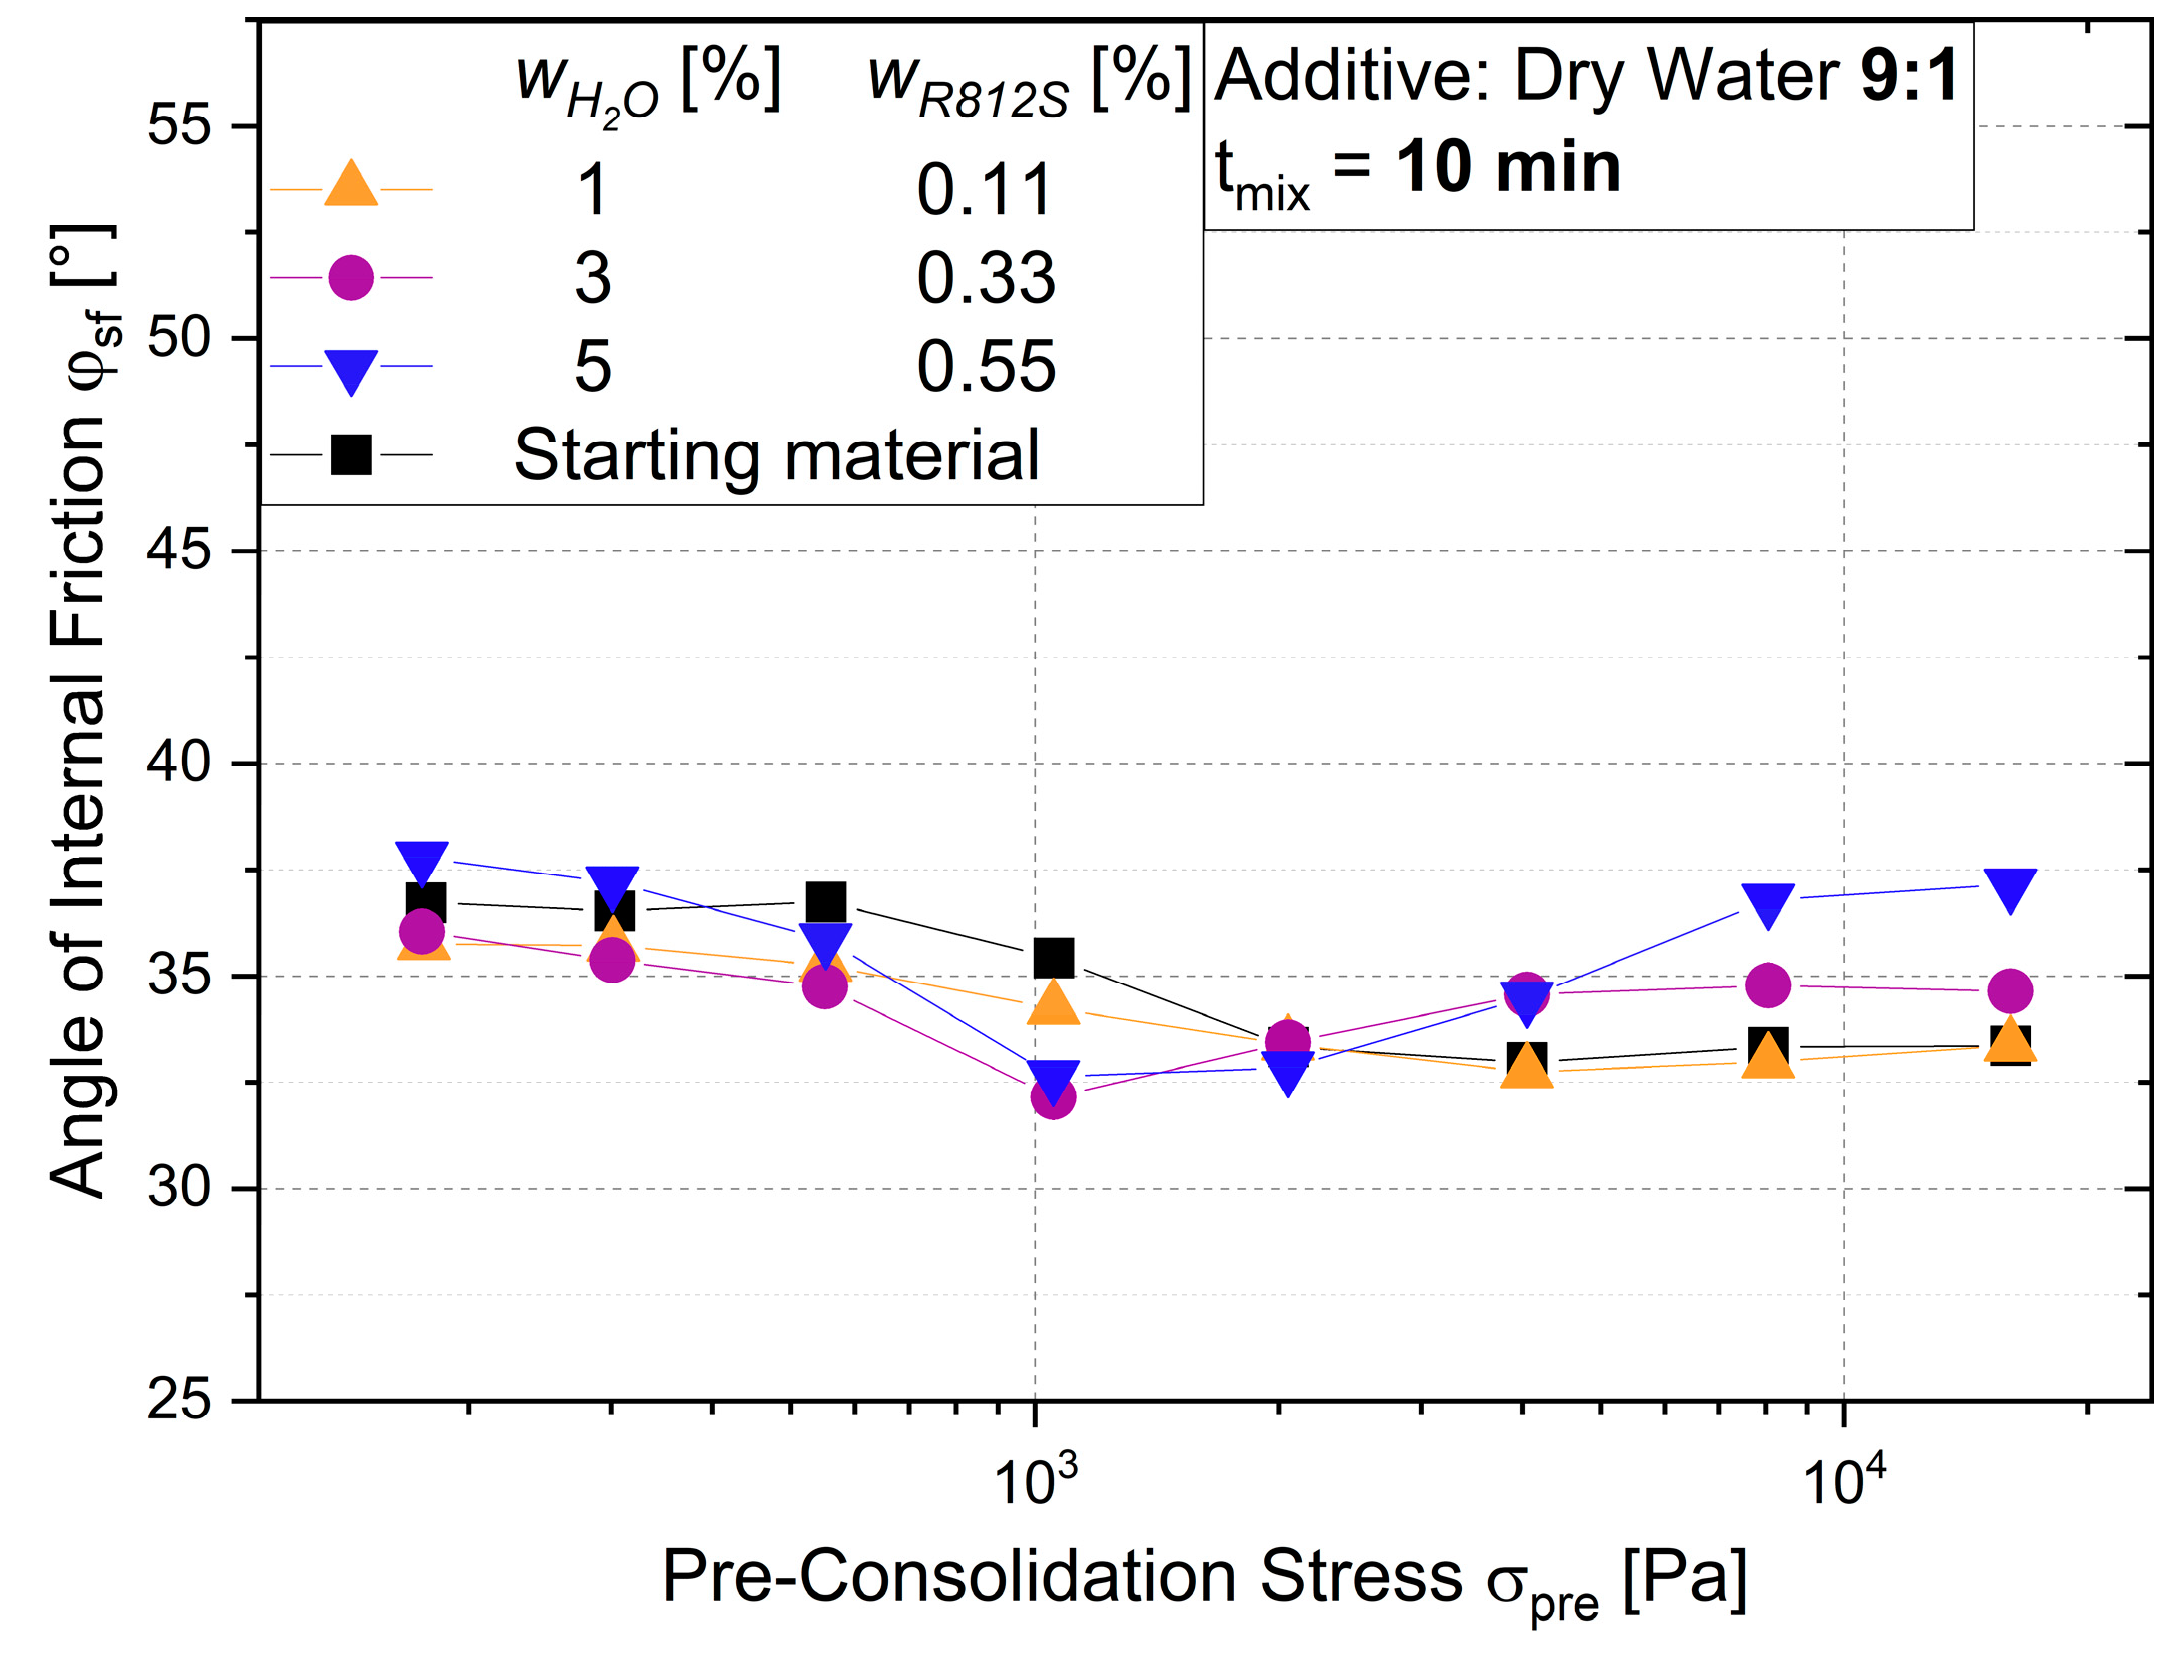
Results from the ring shear tester of mixtures containing one dry water variant, 9:1 (ratio H2O:R812S), and different water contents are presented in Figure 17. Herein, the angle of internal friction at steady-state flow φsf is depicted for different levels of normal stress or rather pre-consolidation stress.
Whilst observing Figure 17, it becomes evident that the results of the mixtures containing dry water are not clearly distinguishable from the results obtained from dry coarse sand. However, mixtures containing wH2O ≥ 3% show a slight decrease in their angles of internal friction, which coincides with results obtained for single component mixtures of coarse sand and R812S until σ = 1 kPa (cf. Figure 6). Interestingly, φsf increases thereafter, signifying an increased effect of adhesive forces acting between coarse sand particles. An explanation for these occurrences at higher water contents presumably involves two combined effects. Firstly, less capsules are protected within the valleys of the pores with an increased amount of dry water added to the mixture. Secondly, sufficient normal stress during shear experiments may fracture unprotected capsules, thereby resulting in liquid bridging. As a consequence, adhesive forces become slightly more dominant in comparison to frictional forces between particles.

3.3. The Bulk Density of Mixtures

The packing density, porosity and bulk structure are important factors for SPI due to their influence on the penetration behaviour of the cement paste or the amount of cement required to fill void spaces. A means to describe the aforementioned factors is the bulk density. Accordingly, the bulk density of all created mixtures is presented as a final means of investigation in this study. The results are depicted in Figure 18 for the given parameters. Resembling the results for mixtures containing water alone, the bulk density reproduces the flowability portrayed through the dynamic AoR. Nonetheless, there is a stronger correlation between the bulk density and dynamic AoR as opposed to the static AoR. A prime example can be derived from the DW19:1, as this variant poses an exception in the bulk density with significantly lower values concurring with decreased flowability. Especially for wH2O = 3%, the bulk density approximates towards the bulk density for mixtures of sand and water without R812S. Hence, these samples also constitute wet bulk materials in handling rather than quasi-dry bulk materials as desired. At wH2O = 5%, DW4:1 generally has the lowest bulk density, and an increase in bulk density occurs for variants with less R812S. This may be due to the filling of porous volumes between particles once higher amounts of R812S are implemented. All things considered, the bulk density can be used as a quick measure to identify whether a bulk material containing dry water is suitable for the AM process SPI. The bulk density should resemble that of dry sand. A lower bulk density signifies higher inter-particle porosity and possible irregular void volumes, resulting in higher cement slurry consumption and unequal cement penetration into the aggregate particle bed, respectively. These factors directly affect, i.e., sustainable development or concrete component precision.

4. Conclusions

Within this study, a novel use of dry water (DW) was investigated as a means of storing large amounts of water within non-absorbent coarse sand as a bulk granular material whilst maintaining initial bulk properties. Four variants of DW were produced and subsequently mixed with the coarse sand via a Turbula mixer.
Single component mixtures, i.e., sand with deionised water or hydrophobic fumed silica, were initially created in order to emphasise the detrimental effects water has on bulk properties in the given context and, thus, fully comprehend the advantages of dry water. The results obtained with mixtures containing water alone demonstrated a sharp increase in the dynamic and static angle of repose (AoR) with the addition of minimal quantities, followed by a lower increase thereafter. The increase in AoR is presumptively related to the increase in cohesion created by capillary bridges between particles. Therefore, independent particle flow is hindered, resulting in irregular bulk flowability.
The true potential of DW was demonstrated thereafter. DW was shown to be a viable alternative to incorporate water in bulk granular material without deteriorating the initial bulk properties. A near complete restoration of the dynamic flow properties was achieved for water contents up to wH2O = 3% with DW variants containing sufficient amounts of hydrophobic fumed silica. However, increasing and decreasing dynamic angles of reposes were observed depending on the mixing times. Shorter mixing times seemed advantageous at lower water contents and vice versa. Sharp increases in the dynamic AoR were associated with capsule fragmentation after sufficient stress events during mixing with aggregate sand. First results indicate that DW fragmentation occurs at a given number of stress events during mixing. Fragmentation can presumptively be delayed with sufficient hydrophobic silica particles as well as finer dry water particle sizes. Furthermore, higher cohesive values were noticed at low speeds during rotating drum measurements. The cohesive index (CI) increased for increasing water contents and DW variants with lower silica contents. Nevertheless, the aforementioned tendency was not evident at a higher drum rotational speed of n = 10 min−1, meaning a minimum speed was necessary to establish full particle movement and a constant flow. Considering the cohesive values of all experiments, constant flow properties were completely restored at wH2O = 1% and slightly higher values were obtained thereafter. A full replenishment of the static angle of repose was solely possible for one mixture with dry water at wH2O = 1%. At higher water contents, the amount of water and filling of porous volumes appear to be the dominant factors, resulting in a higher static AoR. Nonetheless, promising results were obtained that slightly correspond to the aforementioned cohesion at low rotational speed in a dynamic environment. Further investigation showed that the bulk density primarily correlates with the dynamic AoR, possibly making it a useful instrument for quality control. The bulk behaviour of mixtures in a quasi-static environment and additional normal stress was investigated with a ring shear tester. With respect to the angle of internal friction, results interestingly showed an interchange between adhesive and frictional forces depending on the amount of water within the mixture as well as normal load during measurements. Finally, µCT images revealed that dry water mainly resides in the valleys of uneven surfaces and the hydrophobic silica counteracts the formation of liquid bridges, thus, potentially maintaining initial flow properties. A clear distinction of hydrophobic silica and water was not visible with µCT. Accordingly, scanning electron cyromicroscopy (CyroSEM) images confirmed that dry water capsules are able to sustain mechanical stress during mixing until they reside in the protected cavities of sand particle surfaces. Bulk properties were successfully maintained where they would have otherwise been deteriorated by water alone. Hence, a near cohesionless water-storing bulk material was created via simple mixing processes within the framework of this feasibility study. Cohesive properties were thereby counteracted with DW and its hydrophobic nature. As a result, DW is a viable additive for water storage in bulk materials that are otherwise unable to retain water within the given particles.
Future research will be conducted with respect to dynamics during mixing in order to investigate events during mixing processes. In addition, the applicability of DW will be examined for different coarse sand size ranges, helping to understand capsule breakage. With respect to capsule breakage, further studies will include studies of the strength of DW capsules. Most importantly, the practical application of DW in the printing process of SPI will have to be studied thoroughly, thereby investigating the printability as well as comparing the strength of finished concrete elements.

Supplementary Materials

The following supporting information can be downloaded at https://www.mdpi.com/article/10.3390/pr10112438/s1, Figure S1: MX 1250, Rommelsbacher: A high shear blender equipped with a rotor and six blades used to produce dry water. The maximum speed is 22,000 min−1 and the blade diameter is approximately 0.07 m.; Figure S2: Turbula mixer, Willy A. Bachofen AG: A 3D shaker mixer applied to create mixtures of coarse sand and dry water. The frequency during mixing was 49 min−1 and the container filling degree was 70%.; Figure S3: GranuDrum by GranuTools: A device to measure the dynamic angle of repose based on the rotating drum method. The black cylinder was filled to 50% by volume and speeds were varied between 2 min−1 and 50 min−1. Note, the glass screens were replaced with Perspex discs to avoid problems during measurements (water spreading on the screen). Image source: https://www.granutools.com/en/granudrum (accessed on 30 October 2022); Figure S4: Device constructed at the Institute for Particle Technology, TU Braunschweig: A device to measure the static angle of repose based on the hollow cylinder method. The cylinder was filled with 150 mL sample before it was elevated at 150 mm/min. Cylinder length and diameter were 60 mm and 120 mm, respectively.; Figure S5: Ring shear tester, RST-01, by Dietmar Schulze GmbH: A device used to measure bulk behaviour in a quasi-static environment under normal stress. The normal stress ranged from 125 Pa to 16 kPa. The shear cell had a volume of approximately 950 mL and the shear velocity was 1.0 mm/s. FN is the normal force, F1 and F2 are forces resulting from the pull rods, and ω is the angular velocity. Table S1: List of Symbols; Figure S6: Sum Spectrum EDX: Analysis of dry water.; Figure S7: Sum Spectrum EDX: Analysis of coarse sand particle surface after mixing with dry water.

Author Contributions

Conceptualization, L.D.H., H.Z. and A.K.; methodology, L.D.H.; validation, H.Z. and A.K.; formal analysis, L.D.H.; investigation, L.D.H.; resources, A.K.; data curation, L.D.H.; writing—original draft preparation, L.D.H.; writing—review and editing, H.Z. and A.K.; visualization, L.D.H.; supervision, H.Z. and A.K; project administration, H.Z. and A.K.; funding acquisition, H.Z. and A.K. All authors have read and agreed to the published version of the manuscript.

Funding

This research was funded by the German Research Foundation (DFG) within the collaborative research centre “Transregio 277-Additive Manufacturing in Construction (AMC)”, project number 414265976.

Institutional Review Board Statement

Not applicable.

Informed Consent Statement

Not applicable.

Data Availability Statement

Not applicable.

Acknowledgments

The authors are grateful for the funding from the DFG as well as financial support from the TU Braunschweig Open Access Publication Fund. Additionally, a special thanks is also given to Christoph Peppersack for fruitful discussions, input and proofreading the manuscript.

Conflicts of Interest

The authors declare no conflict of interest.

References

  1. Mai, I.; Brohmann, L.; Freund, N.; Gantner, S.; Kloft, H.; Lowke, D.; Hack, N. Large Particle 3D Concrete Printing-A Green and Viable Solution. Materials 2021, 14, 6125. [Google Scholar] [CrossRef] [PubMed]
  2. Buschmann, B.; Henke, K.; Talke, D.; Saile, B.; Asshoff, C.; Bunzel, F. Additive Manufacturing of Wood Composite Panels for Individual Layer Fabrication (ILF). Polymers 2021, 13, 3423. [Google Scholar] [CrossRef] [PubMed]
  3. Slepicka, M. BIM für die Additive Fertigung im Bauwesen. In Building Information Modeling; Borrmann, A., König, M., Koch, C., Beetz, J., Eds.; Springer Fachmedien Wiesbaden: Wiesbaden, Germany, 2021; pp. 545–561. ISBN 978-3-658-33360-7. [Google Scholar]
  4. Müller, J.; Hensel, J.; Dilger, K. Mechanical properties of wire and arc additively manufactured high-strength steel structures. Weld. World 2021, 88, 203. [Google Scholar] [CrossRef]
  5. Lowke, D.; Dini, E.; Perrot, A.; Weger, D.; Gehlen, C.; Dillenburger, B. Particle-bed 3D printing in concrete construction–Possibilities and challenges. Cem. Concr. Res. 2018, 112, 50–65. [Google Scholar] [CrossRef]
  6. Bos, F.; Wolfs, R.; Ahmed, Z.; Salet, T. Additive manufacturing of concrete in construction: Potentials and challenges of 3D concrete printing. Virtual Phys. Prototyp. 2016, 11, 209–225. [Google Scholar] [CrossRef] [Green Version]
  7. Placzek, G.; Brohmann, L.; Mawas, K.; Schwerdtner, P.; Hack, N.; Maboudi, M.; Gerke, M. A Lean-based Production Approach for Shotcrete 3D Printed Concrete Components. In Proceedings of the 38th International Symposium on Automation and Robotics in Construction (ISARC), Dubai, United Arab Emirates, 2–4 November 2021. [Google Scholar]
  8. Pierre, A.; Weger, D.; Perrot, A.; Lowke, D. Penetration of cement pastes into sand packings during 3D printing: Analytical and experimental study. Mater. Struct. 2018, 51, 1221. [Google Scholar] [CrossRef]
  9. Pierre, A.; Weger, D.; Perrot, A.; Lowke, D. Additive Manufacturing of Cementitious Materials by Selective Paste Intrusion: Numerical Modeling of the Flow Using a 2D Axisymmetric Phase Field Method. Materials 2020, 13, 5024. [Google Scholar] [CrossRef]
  10. Weger, D.; Gehlen, C. Particle-Bed Binding by Selective Paste Intrusion-Strength and Durability of Printed Fine-Grain Concrete Members. Materials 2021, 14, 586. [Google Scholar] [CrossRef]
  11. Mechtcherine, V.; Buswell, R.; Kloft, H.; Bos, F.P.; Hack, N.; Wolfs, R.; Sanjayan, J.; Nematollahi, B.; Ivaniuk, E.; Neef, T. Integrating reinforcement in digital fabrication with concrete: A review and classification framework. Cem. Concr. Compos. 2021, 119, 103964. [Google Scholar] [CrossRef]
  12. Weger, D.; Baier, D.; Straßer, A.; Prottung, S.; Kränkel, T.; Bachmann, A.; Gehlen, C.; Zäh, M. Reinforced Particle-Bed Printing by Combination of the Selective Paste Intrusion Method with Wire and Arc Additive Manufacturing–A First Feasibility Study. In Second RILEM International Conference on Concrete and Digital Fabrication, Eindhoven, The Netherlands, 6–8 July 2020; Bos, F.P., Lucas, S.S., Wolfs, R.J.M., Salet, T.A.M., Eds.; Springer International Publishing: Cham, Switzerland, 2020; pp. 978–987. ISBN 978-3-030-49915-0. [Google Scholar]
  13. Straßer, A.; Weger, D.; Matthäus, C.; Kränkel, T.; Gehlen, C. Combining Wire and Arc Additive Manufacturing and Selective Paste Intrusion for Additively Manufactured Structural Concrete. Open Conf. Proc. 2022, 1, 61–72. [Google Scholar] [CrossRef]
  14. Lüddecke, A.; Pannitz, O.; Zetzener, H.; Sehrt, J.T.; Kwade, A. Powder properties and flowability measurements of tailored nanocomposites for powder bed fusion applications. Mater. Des. 2021, 202, 109536. [Google Scholar] [CrossRef]
  15. Kudrolli, A. Granular matter: Sticky sand. Nat. Mater. 2008, 7, 174–175. [Google Scholar] [CrossRef] [PubMed]
  16. Hornbaker, D.J.; Albert, R.; Albert, I.; Barabási, A.-L.; Schiffer, P. What keeps sandcastles standing? Nature 1997, 387, 765. [Google Scholar] [CrossRef]
  17. Carter, B.O.; Adams, D.J.; Cooper, A.I. Pausing a stir: Heterogeneous catalysis in “dry water”. Green Chem. 2010, 12, 783. [Google Scholar] [CrossRef]
  18. Al-Wabel, M.; Elfaki, J.; Usman, A.; Hussain, Q.; Ok, Y.S. Performance of dry water- and porous carbon-based sorbents for carbon dioxide capture. Environ. Res. 2019, 174, 69–79. [Google Scholar] [CrossRef] [PubMed]
  19. Tan, T.T.Y.; Ahsan, A.; Reithofer, M.R.; Tay, S.W.; Tan, S.Y.; Hor, T.S.A.; Chin, J.M.; Chew, B.K.J.; Wang, X. Photoresponsive liquid marbles and dry water. Langmuir 2014, 30, 3448–3454. [Google Scholar] [CrossRef]
  20. Binks, B.P.; Murakami, R. Phase inversion of particle-stabilized materials from foams to dry water. Nat. Mater. 2006, 5, 865–869. [Google Scholar] [CrossRef]
  21. Han, Z.; Zhang, Y.; Du, Z.; Xu, F.; Li, S.; Zhang, J. New-type gel dry-water extinguishants and its effectiveness. J. Clean. Prod. 2017, 166, 590–600. [Google Scholar] [CrossRef]
  22. Forny, L.; Saleh, K.; Pezron, I.; Komunjer, L.; Guigon, P. Influence of mixing characteristics for water encapsulation by self-assembling hydrophobic silica nanoparticles. Powder Technol. 2009, 189, 263–269. [Google Scholar] [CrossRef]
  23. Saleh, K.; Forny, L.; Guigon, P.; Pezron, I. Dry water: From physico-chemical aspects to process-related parameters. Chem. Eng. Res. Des. 2011, 89, 537–544. [Google Scholar] [CrossRef]
  24. Forny, L.; Saleh, K.; Denoyel, R.; Pezron, I. Contact angle assessment of hydrophobic silica nanoparticles related to the mechanisms of dry water formation. Langmuir 2010, 26, 2333–2338. [Google Scholar] [CrossRef] [PubMed]
  25. Forny, L.; Pezron, I.; Saleh, K.; Guigon, P.; Komunjer, L. Storing water in powder form by self-assembling hydrophobic silica nanoparticles. Powder Technol. 2007, 171, 15–24. [Google Scholar] [CrossRef]
  26. McHale, G.; Newton, M.I. Liquid marbles: Principles and applications. Soft Matter 2011, 7, 5473. [Google Scholar] [CrossRef]
  27. Wang, W.; Bray, C.L.; Adams, D.J.; Cooper, A.I. Methane storage in dry water gas hydrates. J. Am. Chem. Soc. 2008, 130, 11608–11609. [Google Scholar] [CrossRef] [PubMed]
  28. Beakawi Al-Hashemi, H.M.; Baghabra Al-Amoudi, O.S. A review on the angle of repose of granular materials. Powder Technol. 2018, 330, 397–417. [Google Scholar] [CrossRef]
  29. Lumay, G.; Boschini, F.; Traina, K.; Bontempi, S.; Remy, J.-C.; Cloots, R.; Vandewalle, N. Measuring the flowing properties of powders and grains. Powder Technol. 2012, 224, 19–27. [Google Scholar] [CrossRef]
  30. Preud’homme, N.; Neveu, A.; Francqui, F.; Opsomer, E.; Vandewalle, N.; Lumay, G. Simulating Powder Bed Based Additive Manufacturing Processes: From DEM Calibration to Experimental Validation. In Proceedings of the 14th WCCM-ECCOMAS Congress, Paris, France, 11–15 January 2021; CIMNE: Barcelona, Spain, 2021. [Google Scholar]
  31. Flow Properties of Bulk Solids. Powders and Bulk Solids; Springer International Publishing: Cham, Switzerland, 2021; pp. 57–139. ISBN 978-3-030-76719-8. [Google Scholar]
  32. Rumpf, H. Grundlagen und Methoden des Granulierens. Chem. Ing. Tech. 1958, 30, 144–158. [Google Scholar] [CrossRef]
  33. Herminghaus, S. Dynamics of wet granular matter. Adv. Phys. 2005, 54, 221–261. [Google Scholar] [CrossRef]
  34. Krantz, M.; Zhang, H.; Zhu, J. Characterization of powder flow: Static and dynamic testing. Powder Technol. 2009, 194, 239–245. [Google Scholar] [CrossRef]
  35. Samadani, A.; Kudrolli, A. Angle of repose and segregation in cohesive granular matter. Phys. Rev. E Stat. Nonlinear Soft Matter Phys. 2001, 64, 51301. [Google Scholar] [CrossRef]
  36. Luding, S.; Alonso-Marroquín, F. The critical-state yield stress (termination locus) of adhesive powders from a single numerical experiment. Granul. Matter 2011, 13, 109–119. [Google Scholar] [CrossRef] [Green Version]
  37. Stieß, M. (Ed.) Wirbelschichten und pneumatische Förderung. In Mechanische Verfahrenstechnik; Springer: Berlin/Heidelberg, Germany, 1997; pp. 343–389. ISBN 978-3-540-55852-1. [Google Scholar]
  38. Mellmann, J. The transverse motion of solids in rotating cylinders—Forms of motion and transition behaviour. Powder Techno. 2001, 118, 251–270. [Google Scholar] [CrossRef]
  39. Stojilovic, N. Why Can’t We See Hydrogen in X-ray Photoelectron Spectroscopy? J. Chem. Educ. 2012, 89, 1331–1332. [Google Scholar] [CrossRef]
Figure 1. Dynamic angle of repose (left) and cohesive index (right) as a function of the H2O content (top) and R812S content (bottom).
Processes 10 02438 g001
Figure 2. Five consecutive images taken by the Granudrum at 10 min−1 for various water contents within the bulk sand wH2O: (a) 0% (starting material), (b) 0.5%, (c) 1%, (d) 3% and (e) 5%.
Processes 10 02438 g002
Figure 3. Static angle of repose as a function of the added mass fraction for mixtures with water and R812S.
Processes 10 02438 g003
Figure 4. Images of heaps during static angle of repose measurements of mixtures containing wH2O: (a) 0% (starting material), (b) 0.5%, (c) 1%, (d) 3%, (e) 5%.
Processes 10 02438 g004
Figure 5. Mean shear stress at steady-state flow in dependence of the pre-consolidation stress for coarse sand as well as mixtures of coarse sand and water at: wH2O = 1%, wH2O = 3% and wH2O = 5%.
Processes 10 02438 g005
Figure 6. Angle of internal friction at steady-state flow in dependence of the consolidation stress for (a) coarse sand as well as mixtures of coarse sand and water at: wH2O = 1%, wH2O = 3% and wH2O = 5%; (b) Coarse sand as well as mixtures of coarse sand and R812S at wR812S = 0.1%, wR812S = 0.25% and wR812S = 0.75%.
Processes 10 02438 g006
Figure 7. Bulk density as a function of the water content by weight.
Processes 10 02438 g007
Figure 8. Typical curve progression regarding the dynamic angle of repose and cohesive index for mixtures with dry water (H2O:R812S) in dependence of the drum rotational speed and varying water contents.
Processes 10 02438 g008
Figure 9. Cohesive index for mixtures containing different variants of dry water at the drum rotating speeds: n = 2 min−1 (top) and n = 10 min−1 (bottom).
Processes 10 02438 g009
Figure 10. Dynamic angle of repose in dependence of the mixing time for mixtures containing different dry water variants and total water contents: wH2O = 1% (top), wH2O = 3% (centre) and wH2O = 5% (bottom).
Processes 10 02438 g010
Figure 11. Characteristic particle sizes x10, x50 and x90 for each dry water variant (ratio H2O:R812S) created in a high shear blender at n = 22,000 min−1 for t = 60 s.
Processes 10 02438 g011
Figure 12. Cohesive index in dependence of the mixing time for mixtures containing different dry water variants and total water contents: wH2O = 1% (top), wH2O = 3% (centre), and wH2O = 5% (bottom).
Processes 10 02438 g012
Figure 13. µCT-images of mixtures containing coarse sand (grey) and: (1) water (blue) with wH2O = 5% (left) and (2) dry water DW6.66:1 (light blue) with wH2O = 5% (right).
Processes 10 02438 g013
Figure 14. Cryo-SEM images of dry water particles on coarse sand particle surfaces after mixing. Magnifications were as follows: (a) 1500×, (b) 3500× and (c) 5000×.
Processes 10 02438 g014
Figure 15. SEM-EDX analysis of dry water (DW9:1) in (a) and (b) as well as dry water capsule on sand particle surface in (c) and (d). Furthermore, (a) and (c) are live map images; (c) and (d) display the element overlay. The following elements are visible: oxygen (blue), silicon (yellow) and carbon (green).
Processes 10 02438 g015
Figure 16. Static angle of repose in dependence of the water content wH2O for mixtures containing different dry water variants.
Processes 10 02438 g016
Figure 17. Angle of internal friction at steady-state flow φsf in dependence of the pre-consolidation stress for coarse sand and mixtures of coarse sand and dry water (ratio 9:1) at: wH2O = 1%, wH2O = 3% and wH2O = 5%.
Processes 10 02438 g017
Figure 18. Bulk density in dependence of the mixing time for mixtures containing different dry water variants and total water contents: wH2O = 1% (top), wH2O = 3% (centre) and wH2O = 5% (bottom).
Processes 10 02438 g018
Table 1. Summary of dry water mixing ratios, associated masses and bulk density.
Ratio H2O:R812S4:16.66:19:119:1
Mass of Water mH2O [g]8086.959095
Mass of R812S mR812S [g]2013.05105
Measured Solids Content ws,m [%]22.4913.3310.055.19
Bulk Density ρB [g/cm3]0.110.190.250.46
Table 2. Mixing Quantities by Weight Percentage of Aggregate Sand Particles.
Dry Water Variant
H2O:R812S
H2O Content in Mixture wH2O [%]R812S Content in Mixture wR812S [%]Mean Measured Solids Content in Mixture [%]
4:1 (DW4:1)1; 3; 50.25; 0.75; 1.2599.1; 97.2; 95.3
6.66:1 (DW6.66:1)1; 3; 50.15; 0.45; 0.7599.0; 97.1; 95.4
9:1 (DW9:1)1; 3; 50.11; 0.33; 0.5599.1; 97.1; 95.3
19:1 (DW19:1)1; 3; 50.05; 0.16; 0.2699.1; 97.4; 95.6
1:0 (Only H2O)0.5; 1; 3; 5 -99.5; 99.0; 96.6; 95.6
0:1 (Only R812S)-0.11; 0.25; 0.75-
Publisher’s Note: MDPI stays neutral with regard to jurisdictional claims in published maps and institutional affiliations.

