Article

Effects of Low-Level Organic Mercury Exposure on Oxidative Stress Profile

by
Radu Ciprian Tincu
1,2,
Cristian Cobilinschi
2,3,*,
Iulia Alexandra Florea
2,*,
Ana-Maria Cotae
2,3,
Alexandru Emil Băetu
3,4,
Sebastian Isac
5,6,
Raluca Ungureanu
2,3,
Gabriela Droc
3,6,
Ioana Marina Grintescu
2,3 and
Liliana Mirea
2,3
1
Clinical Toxicology, Department of Orthopedics and Anesthesiology, Faculty of Medicine, Carol Davila University of Medicine and Pharmacy, 020021 Bucharest, Romania
2
Bucharest Clinical Emergency Hospital, 014461 Bucharest, Romania
3
Anesthesiology, Department of Orthopedics and Anesthesiology, Faculty of Medicine, Carol Davila University of Medicine and Pharmacy, 020021 Bucharest, Romania
4
“Grigore Alexandrescu” Clinical Emergency Hospital for Children, 011743 Bucharest, Romania
5
Physiology, Functional Science, Faculty of Medicine, Carol Davila University of Medicine and Pharmacy, 020021 Bucharest, Romania
6
Fundeni Clinical Institute, 022328 Bucharest, Romania
*
Authors to whom correspondence should be addressed.
Processes 2022, 10(11), 2388; https://doi.org/10.3390/pr10112388
Submission received: 20 August 2022 / Revised: 17 October 2022 / Accepted: 9 November 2022 / Published: 14 November 2022
(This article belongs to the Topic Advanced Oxidation Process: Applications and Prospects)

Abstract

:
Background: The fish-based diet is known for its potential health benefits, but it is less known for its association with mercury (Hg) exposure, which, in turn, can lead to neurological and cardiovascular diseases through the exacerbation of oxidative stress. The aim of this study was to evaluate the correlations between Hg blood concentration and specific biomarkers for oxidative stress. Methods: We present a cross-sectional, analytical, observational study, including primary quantitative data obtained from 67 patients who presented with unspecific complaints and had high levels of blood Hg. Oxidative stress markers, such as superoxide dismutase (SOD), glutathione peroxidase (GPX), malondialdehyde (MLD), lymphocyte glutathione (GSH-Ly), selenium (Se), and vitamin D were determined. Results: We found positive, strong correlations between Hg levels and SOD (r = 0.88, p < 0.0001), GPx (r = 0.92, p < 0.0001), and MLD (r = 0.94, p < 0.0001). We also found inverted correlations between GSH-Ly and vitamin D and Hg blood levels (r = −0.86, r = −0.91, respectively, both with p < 0.0001). Se had a weak correlation with Hg plasma levels, but this did not reach statistical significance (r = −0.2, p > 0.05). Conclusions: Thus, we can conclude that low-level Hg exposure can be an inductor of oxidative stress.

1. Introduction

Mercury (Hg) is included in the top ten chemicals of major public health concern by the World Health Organization (WHO), mainly because of its deleterious effects on the nervous, digestive, and immune systems, as well as on lungs, kidneys, skin, and eyes [1]. There are three forms of Hg in the environment: elemental (metallic), inorganic, and organic, each with its own chemical properties. One can be exposed to all three of these forms. Elemental mercury is the only liquid metal at normal pressure and ambient temperature, and it is mainly used in industrial processes, lightbulbs, and mining [2]. Not so long ago, it was used for various dental amalgams and thermometers, but nowadays, given its high risk, its everyday use is limited. Exposure to elemental mercury occurs through exposure to air containing mercury vapors. Inorganic mercury is a combination of mercury and other elements, and it is also mainly used in industrial processes. Therefore, exposure to inorganic mercury is usually related to the working environment. Exposure to organic mercury is the most frequent type of exposure, and it is caused by dietary intake, usually of fish and other types of seafood [3]. At a cellular level, consequences of Hg exposure include changes in membranes’ permeability and macromolecular structure, mitochondrial metabolism, energy production, and DNA alterations [4,5]. Remodeling the oxidative stress balance through alterations in the structural integrity of the mitochondrial membrane, impairment of oxidative phosphorylation, adenosine 5′-triphosphate (ATP) depletion, porphyrinogen oxidation, depletion of reduced glutathione, and alterations in mitochondrial calcium (Ca2+) homeostasis represent some of the most important cellular alterations caused by Hg [6]. Superoxide dismutase (SOD), glutathione peroxidase (GPx), malondialdehyde (MLD), selenium (Se), and lymphocyte glutathione (GSH-ly) are some of the biomarkers used to assess oxidative stress [7,8,9,10,11]. Few studies have been published in our country regarding the consequences of low-level exposure to mercury, and even fewer have described the possible associations between heavy metals and oxidative stress biomarkers.
This study aimed to evaluate the impact of mercury blood levels (HgBL) through low-level exposure on the oxidative stress balance, including GSH-ly, SOD, MLD, GPx, vitamin D, and Se. Obtaining an overview of the relationship between Hg and oxidative stress balance is one of the first steps in establishing directions regarding preventive measures that can be included in the day-to-day lifestyle, but also in hospitals/toxicology units, aiming to reduce the short- and long-term negative effects associated with Hg exposure.

2. Materials and Methods
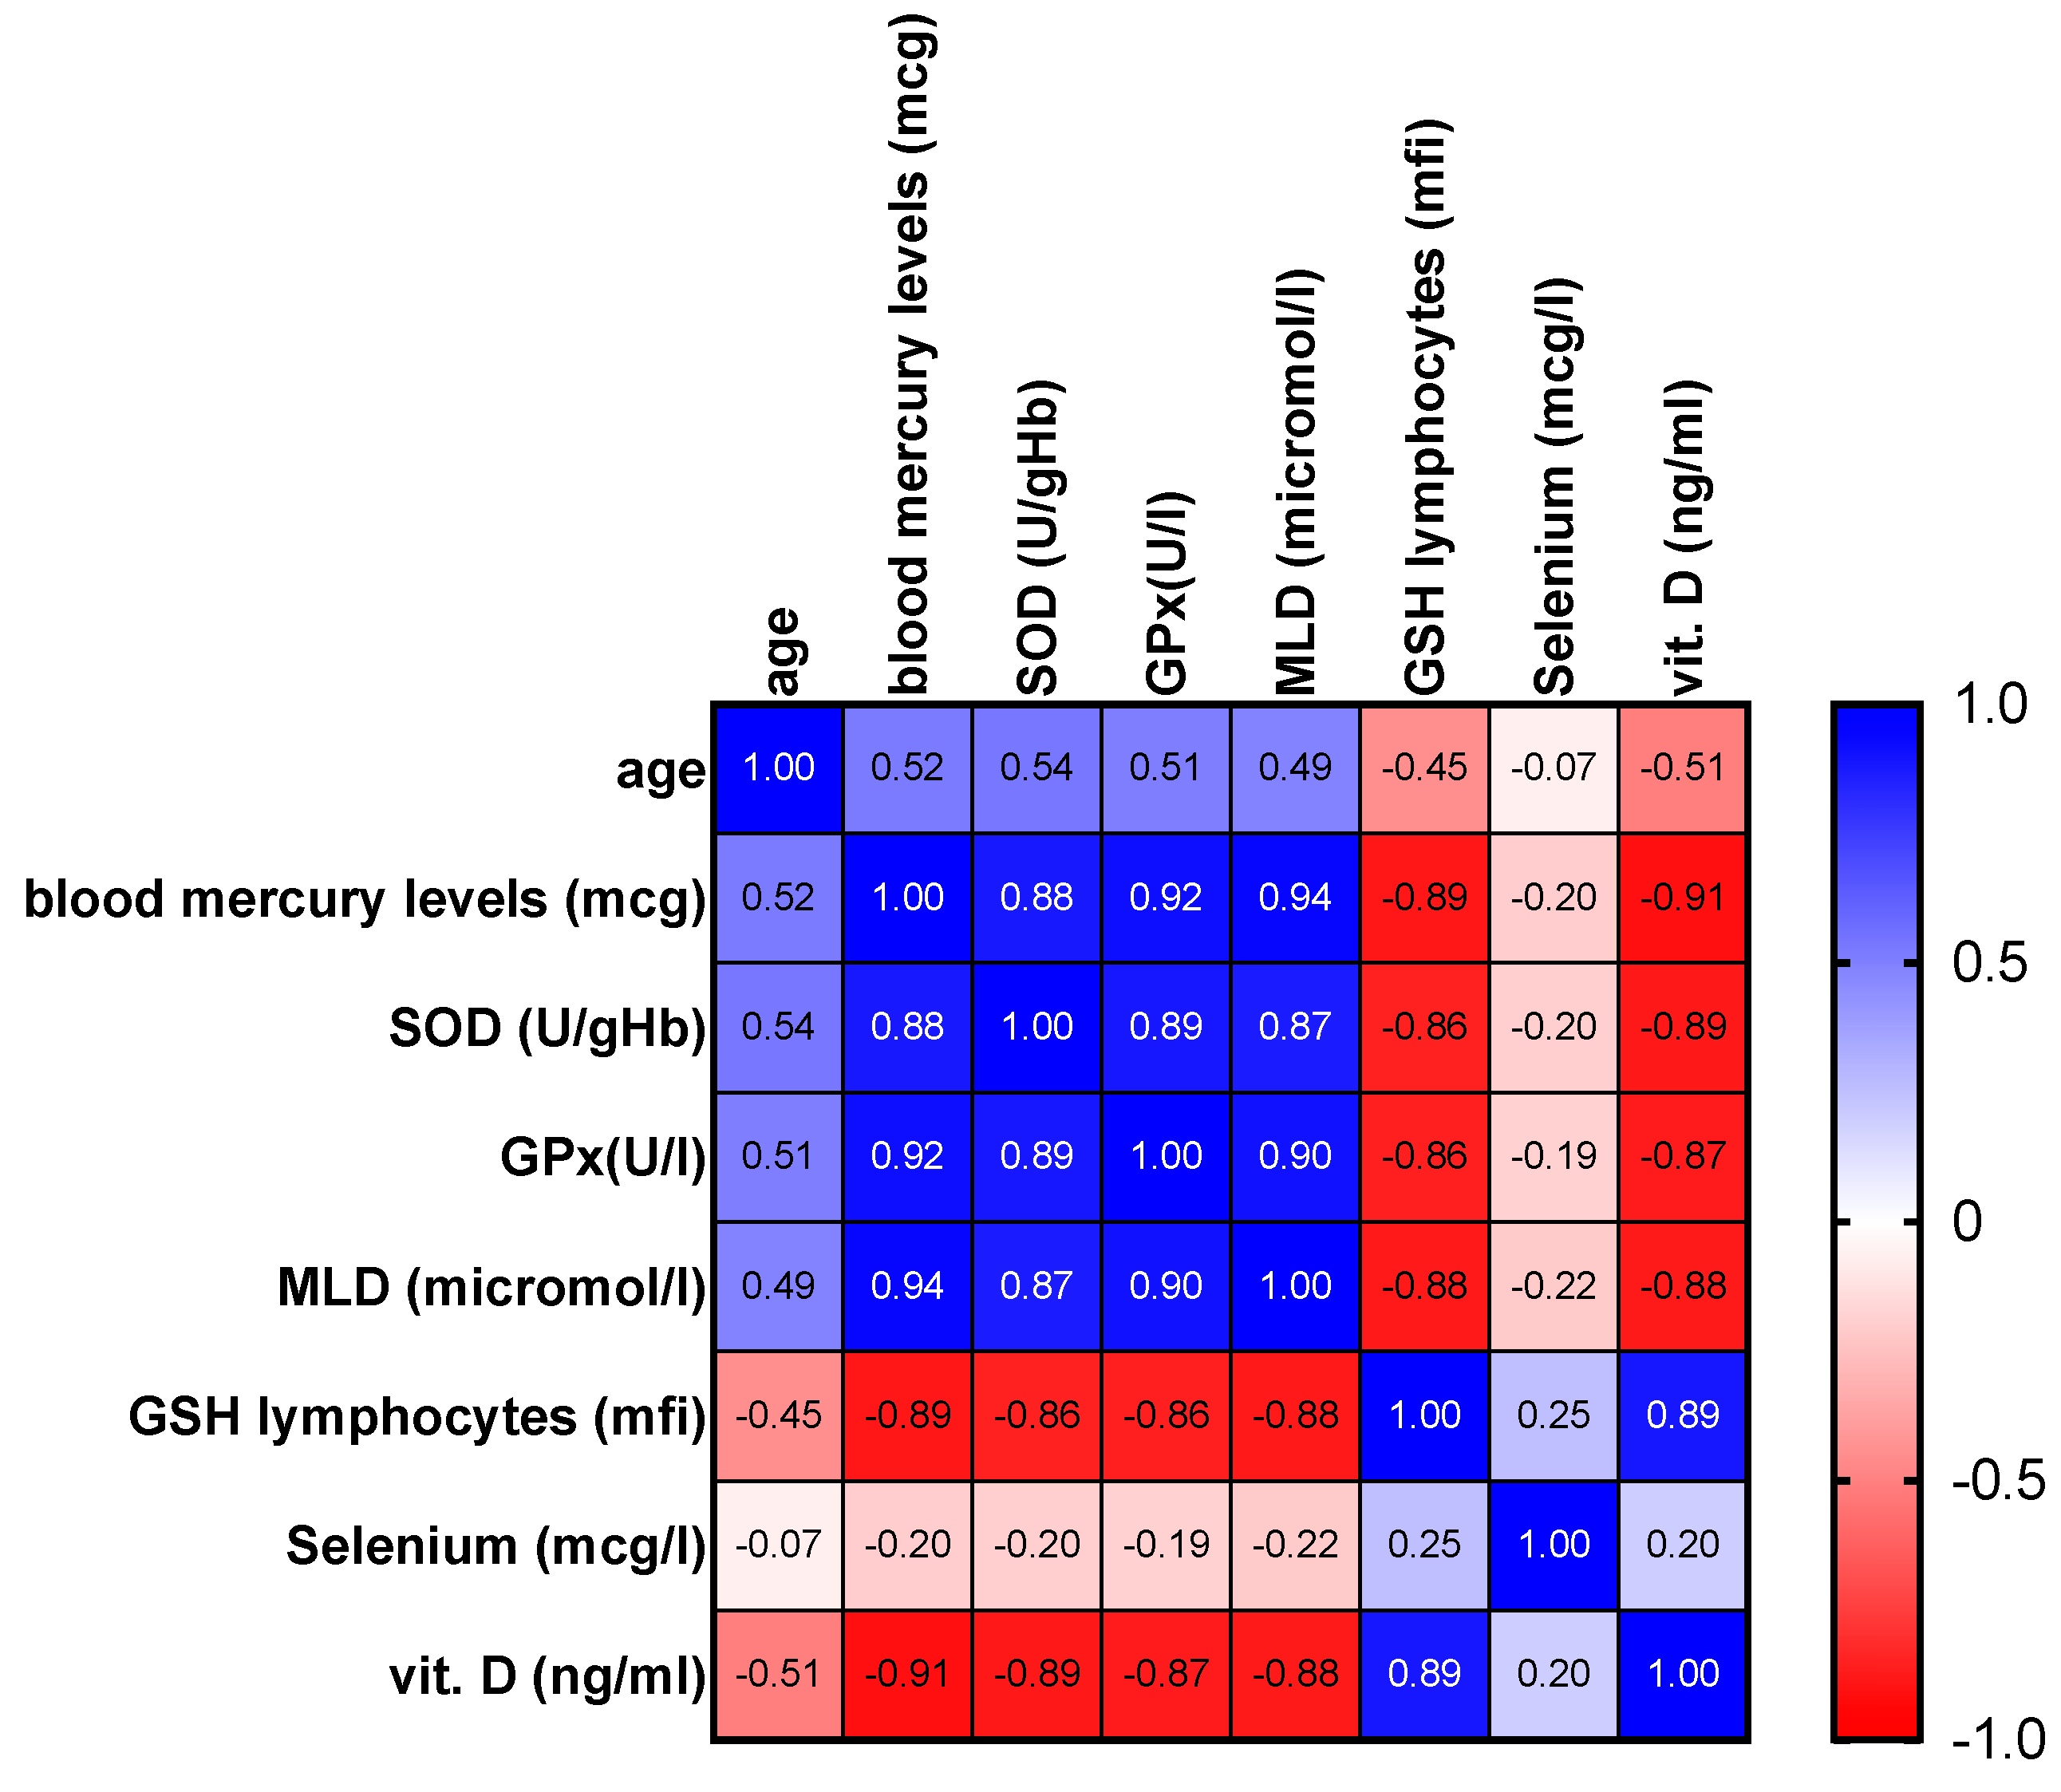
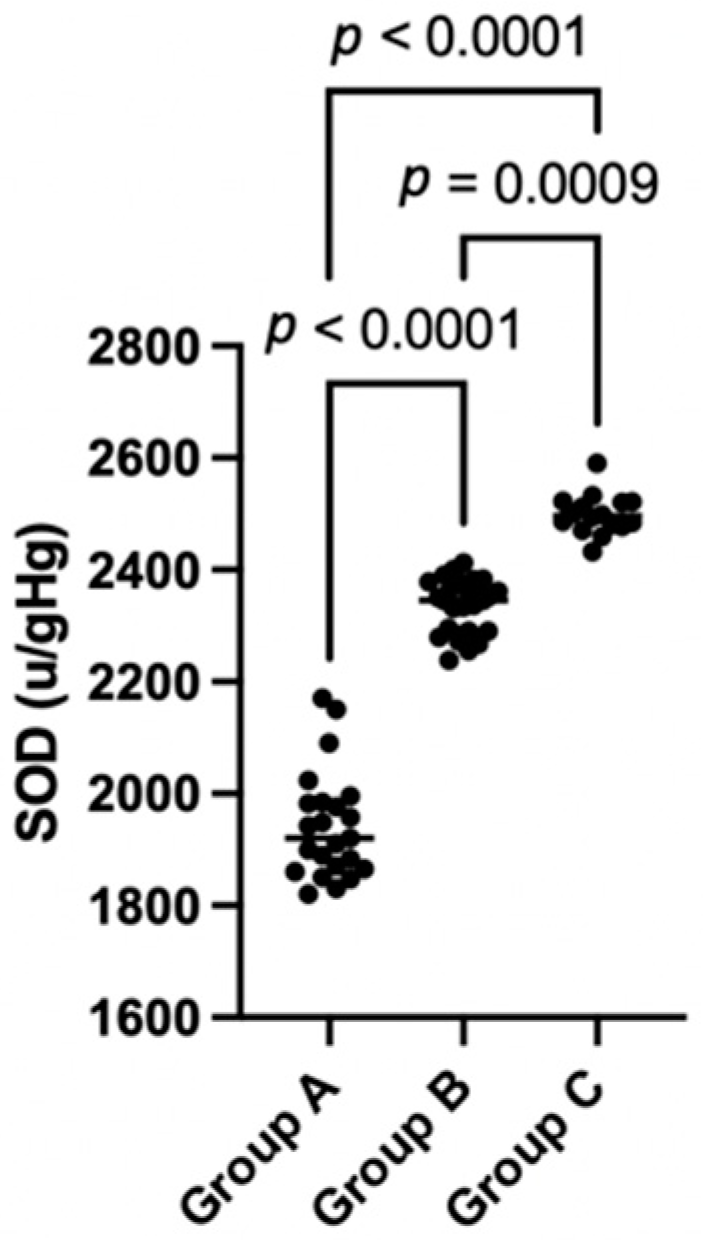
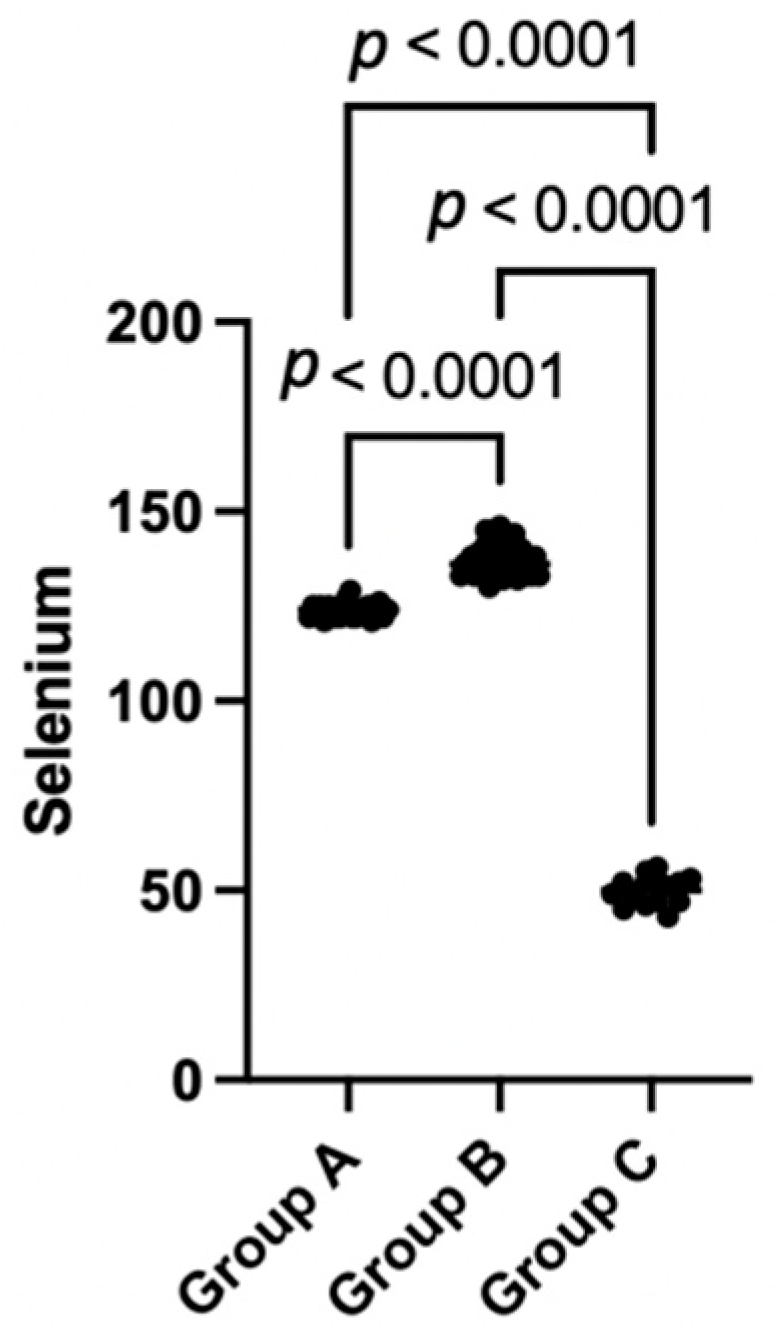
Study design and subjects. This was a cross-sectional, observational study, performed in an outpatient clinic. It was conducted between the 1st of June 2021 and the 31st of December 2021. The study population was recruited from the pool of patients who addressed the outpatient clinic with non-specific signs and symptoms such as headache, muscle pain, insomnia, and peripheral neuropathy. After the exclusion of organic pathology, high mercury blood levels were revealed. Subjects having high blood levels of other heavy metals were excluded from the study. None of the included subjects had any known professional long-term exposure to Hg or other types of high-level exposure to Hg. Additionally, information regarding risk factors was included in a face-to-face survey on admission, providing data about age, lifestyle, smoking, and alcohol consumption. We analyzed age, sex, educational levels, cigarette smoking status, and alcohol consumption status as factors that could affect lifestyle profiles. Age categories were defined as follows: 19–39 years, 40–59 years, 60–69 years, and ≥70 years old. We used three educational levels, namely less than high school graduate, high school diploma, and college graduate. We assessed smoking status into three categories: past smoker, never smoked, and current smoker. Alcohol intake was addressed by yes or no questions.
Toxicology studies. Blood samples were provided from all patients through venous puncture, using royal blue cap containers with an anticoagulant (ethylenediaminetetraacetic acid, BD Vacutainer, ref 368381), filled up to 10 mL. HgBL was analyzed subsequently or after storage at 20 °C. The plasma coupled with the mass spectrometry wavelength used was of 254.65 nm, with a conversion factor of μg/L × 0.005 = μmol/L and μmol/L × 200= μg/L.
Oxidative stress biomarkers. We created a database that included GSH-ly, SOD, GPx, MLD, vitamin D, and Se blood levels. Using flow cytometry, glutathione levels in T lymphocytes were determined with the help of a non-fluorescent compound which, in reaction with intracellular thiol, becomes highly fluorescent (reference values: >355 median fluorescence intensity). Superoxide dismutase was determined through enzymatic photometry (reference levels: 1200–1800 U/ghb) in refrigerated whole blood. GPx’s enzymatic activity in the erythrocytes was assessed from a 1 mL venous blood sample using photometry (reference values: 4171–10,881 U/L). Using high performance liquid chromatography and fluorescence detection, MLD levels in plasma were determined (reference values for the lab <1 µmol/L). Through electrochemiluminescence, we determined whole vitamin D levels in venous blood after centrifugation. Using atomic absorption spectroscopy, we determined selenium levels in venous blood (reference values: 50−120 mcg/L).
Statistics. Statistical analysis was performed using Graph Pad Prism 9.3.0 (Dotmatics, Boston, MA, USA), MedCalc 14 (MedCalc Software Ltd., Ostend, Belgium), and Microsoft Excel. We performed tests such as the D’Agostino-Pearson analysis, Spearman correlations, one-way ANOVA, and Dunn analysis.

3. Results

Subjects and Baseline Characteristics

We have included 67 patients in our study, with a median age of 46 years (SD = 7.55). Sex distribution showed 43.38% (n = 29) females. Most of the patients came from an urban area (88.05% (n = 59)). Median Hg blood concentration was 12 µg/L (SD = 7.71), with a minimum of 1 µg/L and a maximum of 25 µg/L. Regarding the Hg blood concentration distribution, when we take into consideration the presentation of the included patients, there is no further bias. The variable distribution is most likely caused by the small number of patients included. Other population characteristics which were studied are shown in Table 1.
Further, we analyzed the distribution of the variables using the D’Agostino–Pearson test. None of the studied variables had a normal distribution: age (K2 = 6.307, p = 0.04), HgBL (K2 = 24.5, p < 0.0001), SOD (K2 = 21.46, p < 0.001), GPx (K2 = 40.39, p < 0.0001), MLD (K2 = 15.3, p = 0.0005), GSH-Ly (K2 = 13.95, p = 0.0009), Se (K2 = 12.84, p = 0.0016), or Vitamin D (K2 = 7.168, p = 0.02). Further description regarding the distribution of the studied variables is provided in Table 2.
In order to assess the correlations between the HgBL and the oxidative stress biomarkers, we have used Spearman correlations and coefficients that were included in a comprehensive correlation matrix, which is graphically represented by the heat map shown in Figure 1.
As can be seen in the provided picture, there are positive, statistically significant correlations between HgBL and SOD (r = 0.88, p < 0.0001), GPx (r = 0.92, p < 0.0001), and MLD (r = 0.94, p < 0.0001). We have found inverted correlations between HgBL and GSH-Ly (r = −0.86, p < 0.000), as well as Vitamin D (r = −0.91, p < 0.0001). There were no statistically significant correlations between HgBL and Se (r = −0.2, p = 0.1).
For further statistical studies, the study population was split into 3 groups, taking HgBL into consideration, as follows: group A (HgBL between 0 and 10 µg/L), group B (HgBL 11–20 µg/L) and group C (HgBL 21–30 µg/L). Group A included 23 patients, group B 28 patients, and Group C 16 patients.
We performed one-way ANOVA analysis for variables with an abnormal distribution (SOD, MLD, GPx, GSH-Ly, Se, and Vitamin D), and, using Dunn analysis, we compared the three groups. Mean SOD concentration in group A was 1942 μ/gHg (SD = 96.22); in group B it was 2333 μ/gHg (SD = 48.7); and in group C it was 2499 μ/gHg (SD = 35.76), as it can be seen in Figure 2.
Mean Gpx concentration was different between the three groups, as evidenced in Figure 3, was 7424 U/L (SD = 799.1) in group A, 12,934 U/L (SD = 1018) in group B, and 16,478 U/L (SD = 391.8) in group C.
Regarding MLD concentrations, there were statistically significant differences between the three groups, evidentiated in Figure 4: group A—mean concentration 0.5783 μmol/L (SD = 0.1476), group B—mean concentration 1.343 μmol/L (SD = 0.1260), and group C—mean concentration 2.073 μmol/L (SD = 0.1075).
Figure 5 ilustrates the differences between mean GSH-Ly concentration in group A, B, and C, which was 374.9 mfi (SD = 9.758), 311.8 mfi (SD = 17.27), and 208.6 mfi (SD = 4.761), respectively.
Mean concentration of Se in group A was 123.6 μg/L (SD = 2.017), 137.1 μg/L (SD = 4.541) in group B, and 49.88 μg/L (SD = 3.704) in group C with statistically significant differences between the three groups as seen in Figure 6.
Regarding vitamin D concentrations, we have found statistically significant differences as it is shown in Figure 7. In group A, the mean Vitamin D concentration was 33.35 ng/mL (SD = 1.91), while in group B and C it was 27.64 ng/mL (SD = 0.9512) and 21.63 ng/mL (SD = 1.50), respectively.
The mean for all analyzed oxidative stress biomarkers between the three groups was variable depending on the HgBL.

4. Discussion

Median Hg blood concentration in our study was higher than that in other such studies. For example, in an Austrian study which included 152 patients, the median Hg blood concentration was 2.38 µg/L [12]. The difference can be explained by the study population. In our study, we have assessed patients with previous exposures, while in the Austrian study, this was not the case. In a Brazilian study published in 2021, Hg blood concentration in the control group (non-exposed, non-fishermen) varied between 0.29–17.3 µg/L, which is, approximately, in the same range as our study. Evidently, in the exposed group, fishermen from the Mundau lagoon in Maceio had higher Hg blood concentrations (0.73–48.38 µg/L) [13]. In a Canadian study, which included 221 female immigrants of childbearing age, total Hg blood levels were between 0.4 and 26.05 µg/L, which is somewhat similar to our study [14]. These significant differences can be caused by the geographical area of residence, by the different types of diets, and by the Hg content in the water. In a study from the Czech Republic, which included 1069 patients aged over 61 years from 26 social care institutions, a negative correlation between age and blood Hg was found [15].
The impact on the antioxidant system varies among available studies. In the aforementioned study on Brazilian fishermen, SOD activity was decreased in the exposed group in comparison with the control group [16]. This somewhat contradicts our findings; the positive correlation between Hg blood level and SOD, is supported by another study, published in 2005, in which SOD activity was increased in the mercury exposed group [17].
A cross sectional study that included 211 patients from the Brazilian Amazon included a positive correlation between blood Se and Hg [18]. The main role of Se in Hg exposure appears to be related to neutralizing Hg toxicity, especially neurotoxicity. Its binding to Hg leads to a decrease in Se blood concentration [16]. Furthermore, an increase in urinary Se excretion can be attributed to mercury exposure [19]. Although there seems to be an important relationship between HgBL and Se, we did not find any statistically significant relationship between the two of them.
In a study with 889 subjects that aimed to evaluate the association between blood mercury, cadmium, and lead levels, as well as MLD and paraoxonase 1 activity, the conclusion reached regarding MLD stated that mercury levels were inversely correlated with MLD concentration [20], which contradicts the findings in our study. This contradiction can be partially explained by the difference in Hg blood concentrations between the studies, the cited study reaching a much higher mean Hg concentration.
As opposed to our study, glutathione peroxidase activity has been shown to be decreased in the setting of mercury exposure in several studies in humans, but also in animal models [13,21,22]. The conflicting results can be explained by the variability of Hg blood concentration, by the different methods used in assessing the GPx, and by the significant differences in the studied groups. In an experimental study, in which T lymphocytes were exposed to methylmercury, GSH was markedly decreased after said exposure, resulting in decreased activity of glutathione S-transferase [12].
Given the small patient sample and the type of the study, we cannot formulate special recommendations regarding the management of Hg-exposed patients. As was previously stated, available studies revolving around this subject have conflicting results, great limitations, and are not standardized. All of these are sufficient reasons to prevent the creation of strict guidelines. Nonetheless, mercury exposure is a potent inductor of oxidative stress, which, in turn, can be detrimental to the well-being of an individual. Neurological, cardiovascular, hematological, immunological, gastrointestinal, and renal systems depend on the balance between pro- and antioxidants. Inclining this balance in any direction leads to immense negative consequences. In the meantime, studies have shown some interest in modifications of the gut microbiota during low level exposure, generating clinical issues similar to functional abdominal disorders [23]. Thus, the potential role of modulating the intestinal population should be researched secondarily [24,25]. As we have described in the presented paper, mercury exposure can be secondary to fish consumption. Children’s diets are also important due to high fructose corn syrup consumption, given that products containing the mercury cell chlor-alkali are largely used as food ingredients in the industry [26], raising additional metabolic issues in children suffering from intolerances [27]. There are known benefits associated with fish consumption, due to their nutritional value and richness in omega-3 fatty acids and vitamins. Fish intake has a pivotal role in influencing cardiovascular risk factors, and it appears to be associated with a lower risk of sudden cardiovascular-associated death. Neurocognitive development in children is related to the maternal fish intake; docosahexaenoic acid (DHA) from fish is beneficial for early neurodevelopment. Nonetheless, one must not forget that alongside omega-3 fatty acids, DHA, and vitamins, a fish diet means an increase in organic mercury exposure [28].

5. Conclusions

In conclusion, this study demonstrates that low-level Hg exposure may have an influence on the oxidative stress state, brought to light by its impact on a series of oxidative stress biomarkers. Long-term cardiovascular and neurological effects, secondary to a prolonged increased oxidative stress state, may outweigh the benefits of a fish diet.

Author Contributions

Conceptualization, R.C.T. and L.M.; methodology, R.C.T. and C.C.; software, S.I. and A.E.B.; validation, G.D., I.M.G. and L.M.; formal analysis, I.A.F., R.U. and A.-M.C.; investigation, R.C.T. and I.A.F.; resources, R.C.T.; data curation, A.E.B., A.-M.C. and L.M.; writing—original draft preparation, I.A.F. and C.C.; writing—review and editing, R.C.T. and R.U.; visualization, S.I. and C.C.; supervision, G.D. and I.M.G.; project administration, R.C.T. and C.C.; funding acquisition, I.A.F. and L.M. All authors have read and agreed to the published version of the manuscript.

Funding

This research received no external funding.

Institutional Review Board Statement

The study was conducted in accordance with the Declaration of Helsinki and it was approved by the Clinical Emergency Hospital of Bucharest Ethics Committee (protocol code 43428).

Data Availability Statement

The database will be available on demand.

Conflicts of Interest

The authors declare no conflict of interest.

References

  1. Mercury and Health. Available online: https://www.who.int/news-room/fact-sheets/detail/mercury-and-health (accessed on 16 June 2022).
  2. Sakamoto, M.; Nakamura, M.; Murata, K. Mercury as a Global Pollutant and Mercury Exposure Assessment and Health Effects. Nippon. Eiseigaku Zasshi Jpn. J. Hyg. 2018, 73, 258–264. [Google Scholar] [CrossRef] [PubMed] [Green Version]
  3. WHO Regional Office for Europe. Air Quality Guidelines, 2nd ed.; Chapter 6.9; WHO Regional Office for Europe: Copenhagen, Denmark, 2000; Available online: https://www.euro.who.int/__data/assets/pdf_file/0004/123079/AQG2ndEd_6_9Mercury.PDF (accessed on 16 June 2022).
  4. Boerleider, R.Z.; Roeleveld, N.; Scheepers, P.T. Human biological monitoring of mercury for exposure assessment. AIMS Environ. Sci. 2017, 4, 251–276. [Google Scholar] [CrossRef]
  5. Mercury Factsheet|National Biomonitoring Program|CDC. Published 2 September 2021. Available online: https://www.cdc.gov/biomonitoring/Mercury_FactSheet.html (accessed on 16 June 2022).
  6. Choi, H.; Park, S.-K.; Kim, M.-H. Risk Assessment of Mercury through Food Intake for Korean Population. Korean J. Food Sci. Technol. 2012, 44, 106–113. [Google Scholar] [CrossRef] [Green Version]
  7. Ye, B.-J.; Kim, B.-G.; Jeon, M.-J.; Kim, S.-Y.; Kim, H.-C.; Jang, T.-W.; Chae, H.-J.; Choi, W.-J.; Ha, M.-N.; Hong, Y.-S. Evaluation of mercury exposure level, clinical diagnosis and treatment for mercury intoxication. Ann. Occup. Environ. Med. 2016, 28, 5. [Google Scholar] [CrossRef] [Green Version]
  8. Posin, S.L.; Kong, E.L.; Sharma, S. Mercury Toxicity; StatPearls Publishing: Tampa, FL, USA, 2022. Available online: http://www.ncbi.nlm.nih.gov/books/NBK499935/ (accessed on 16 June 2022).
  9. Rice, K.M.; Walker, E.M., Jr.; Wu, M.; Gillette, C.; Blough, E.R. Environmental Mercury and Its Toxic Effects. J. Prev. Med. Public Health 2014, 47, 74–83. [Google Scholar] [CrossRef]
  10. Lund, B.-O.; Miller, D.M.; Woods, J.S. Studies on Hg(II)-induced H2O2 formation and oxidative stress in vivo and in vitro in rat kidney mitochondria. Biochem. Pharmacol. 1993, 45, 2017–2024. [Google Scholar] [CrossRef]
  11. Younus, H. Therapeutic potentials of superoxide dismutase. Int. J. Health Sci. 2018, 12, 88–93. [Google Scholar]
  12. Lubos, E.; Loscalzo, J.; Handy, D.E. Glutathione Peroxidase-1 in Health and Disease: From Molecular Mechanisms to Therapeutic Opportunities. Antioxid. Redox Signal. 2011, 15, 1957–1997. [Google Scholar] [CrossRef] [Green Version]
  13. Linšak, Ž.; Linšak, D.T.; Špirić, Z.; Srebočan, E.; Glad, M.; Milin, Č. Effects of mercury on glutathione and glutathione-dependent enzymes in hares (Lepus europaeus Pallas). J. Environ. Sci. Health Part A Tox. Hazard. Subst. Environ. Eng. 2013, 48, 1325–1332. [Google Scholar] [CrossRef]
  14. Del Rio, D.; Stewart, A.J.; Pellegrini, N. A review of recent studies on malondialdehyde as toxic molecule and biological marker of oxidative stress. Nutr. Metab. Cardiovasc. Dis. 2005, 15, 316–328. [Google Scholar] [CrossRef]
  15. Agarwal, R.; Behari, J.R. Effect of Selenium Pretreatment in Chronic Mercury Intoxication in Rats. Bull. Environ. Contam. Toxicol. 2007, 79, 306–310. [Google Scholar] [CrossRef] [PubMed]
  16. Silva-Filho, R.; Santos, N.; Santos, M.C.; Nunes, Á.; Pinto, R.; Marinho, C.; Lima, T.; Fernandes, M.P.; Santos, J.C.C.; Leite, A.C.R. Impact of environmental mercury exposure on the blood cells oxidative status of fishermen living around Mundaú lagoon in Maceió—Alagoas (AL), Brazil. Ecotoxicol. Environ. Saf. 2021, 219, 112337. [Google Scholar] [CrossRef] [PubMed]
  17. Becker, A.; Soliman, K.F.A. The Role of Intracellular Glutathione in Inorganic Mercury-Induced Toxicity in Neuroblastoma Cells. Neurochem. Res. 2009, 34, 1677–1684. [Google Scholar] [CrossRef] [Green Version]
  18. Schwalfenberg, G.K.; Genuis, S.J. Vitamin D, Essential Minerals, and Toxic Elements: Exploring Interactions between Nutrients and Toxicants in Clinical Medicine. Sci. World J. 2015, 2015, 318595. [Google Scholar] [CrossRef] [PubMed] [Green Version]
  19. Wiseman, C.L.S.; Parnia, A.; Chakravartty, D.; Archbold, J.; Copes, R.; Cole, D. Total, methyl and inorganic mercury concentrations in blood and environmental exposure sources in newcomer women in Toronto, Canada. Environ. Res. 2018, 169, 261–271. [Google Scholar] [CrossRef]
  20. Rambousková, J.; Krsková, A.; Slavíková, M.; Čejchanová, M.; Černá, M. Blood levels of lead, cadmium, and mercury in the elderly living in institutionalized care in the Czech Republic. Exp. Gerontol. 2014, 58, 8–13. [Google Scholar] [CrossRef]
  21. Chen, C.; Qu, L.; Li, B.; Xing, L.; Jia, G.; Wang, T.; Gao, Y.; Zhang, P.; Li, M.; Chen, W.; et al. Increased Oxidative DNA Damage, as Assessed by Urinary 8-Hydroxy-2′-Deoxyguanosine Concentrations, and Serum Redox Status in Persons Exposed to Mercury. Clin. Chem. 2005, 51, 759–767. [Google Scholar] [CrossRef] [Green Version]
  22. Lemire, M.; Fillion, M.; Frenette, B.; Mayer, A.; Philibert, A.; Passos, C.J.S.; Guimaraes, J.R.D.; Barbosa, F.; Mergler, N. Selenium and Mercury in the Brazilian Amazon: Opposing Influences on Age-Related Cataracts. Environ. Health. Perspect. 2010, 118, 1584–1589. [Google Scholar] [CrossRef]
  23. Siblerud, R.; Mutter, J.; Moore, E.; Naumann, J.; Walach, H. A Hypothesis and Evidence That Mercury May be an Etiological Factor in Alzheimer’s Disease. Int. J. Environ. Res. Public Health 2019, 16, 5152. [Google Scholar] [CrossRef] [Green Version]
  24. Alexander, J.; Thomassen, Y.; Aaseth, J. Increased urinary excretion of selenium among workers exposed to elemental mercury vapor. J. Appl. Toxicol. 1983, 3, 143–145. [Google Scholar] [CrossRef]
  25. Lopes, A.C.B.A.; Urbano, M.; de Souza-Nogueira, A.; Oliveira-Paula, G.H.; Michelin, A.P.; Carvalho, M.D.F.H.; Camargo, A.E.I.; Peixe, T.S.; Cabrera, M.A.S.; Paoliello, M.M.B. Association of lead, cadmium and mercury with paraoxonase 1 activity and malondialdehyde in a general population in Southern Brazil. Environ. Res. 2017, 156, 674–682. [Google Scholar] [CrossRef] [PubMed]
  26. Branco, V.; Canário, J.; Lu, J.; Holmgren, A.; Carvalho, C. Mercury and selenium interaction in vivo: Effects on thioredoxin reductase and glutathione peroxidase. Free Radic. Biol. Med. 2011, 52, 781–793. [Google Scholar] [CrossRef] [PubMed]
  27. Al-Azzawie, H.F.; Umran, A.; Hyader, N.H. Oxidative Stress, Antioxidant Status and DNA Damage in a Mercury Exposure Workers. Br. J. Pharmacol. Toxicol. 2013, 4, 80–88. [Google Scholar] [CrossRef]
  28. Shenker, B.J.; Pankoski, L.; Zekavat, A.; Shapiro, I.M. Mercury-Induced Apoptosis in Human Lymphocytes: Caspase Activation Is Linked to Redox Status. Antioxid. Redox Signal. 2002, 4, 379–389. [Google Scholar] [CrossRef] [PubMed]
Figure 1. Heat map of the Spearman correlations between HgBL and oxidative stress biomarkers (vit. D—Vitamin D).
Processes 10 02388 g001
Figure 2. SOD statistical analysis.
Processes 10 02388 g002
Figure 3. GPx statistical analysis.
Processes 10 02388 g003
Figure 4. MLD statistical analysis.
Processes 10 02388 g004
Figure 5. GSH-Ly statistical analysis.
Processes 10 02388 g005
Figure 6. Se statistical analysis.
Processes 10 02388 g006
Figure 7. Vitamin D statistical analysis.
Processes 10 02388 g007
Table 1. Baseline characteristics.
VariablesTotal (n, %)Males (n, %)Females (n, %)p
Total (n, %)6738 (56.71)29 (43.38)NS
Area
 Urban59 (88.05)34 (89.47)25 (82.20)NS
 Rural8 (11.94)4 (10.52)4 (13.79)NS
Age (years)
 19–3911 (16.41)5 (13.15)6 (20.68)NS
 39–5923 (34.32)12 (31.57)11 (37.93)NS
 60–6916 (23.88)9 (23.68)7 (24.13)NS
 ≥70 17 (25.37)12 (17.91)5 (17.24)<0.005
Education
 less than high school19 (28.35)9 (23.68)10 (34.48)NS
 high school diploma21 (31.34)16 (42.13)5 (17.24)NS
 college graduate27 (40.29)13 (34.21)14 (48.27)NS
Smoking
 past smoker22 (32.83)15 (39.47)7 (24.13)NS
 never smoker11 (16.41)2 (5.26)9 (31.03)NS
 current smoker34 (50.74)21 (55.26)13 (44.82)NS
Alcohol
 Yes38 (56.71)32 (84.21)6 (20.68)<0.005
 No29 (43.28)6 (15.78)23 (79.31)<0.005
NS—not significant.
Table 2. Distribution characteristics of the included variables.
Age
(years)
HgBL
(mcg)
SOD
(U/gHg)
GPx
(U/I)
MLD
(Micromol/L)
GSH-ly
(mfi)
Se
(mcg/L)
Vitamin D
(ng/mL)
Median4612233112,6491.332012528
Minimum371182063470.32024319
Maximum6625259016,8992.238914635
95% CI of median lower limit4411226711,2701.230012227
95% CI of median upper limit4813236013,5021.433413229
Coefficient of variation15.7%40.17%10.5%30.55%46.57%20.79%31.83%16.35%
Publisher’s Note: MDPI stays neutral with regard to jurisdictional claims in published maps and institutional affiliations.

