Article

Effect on Starting Modes on Centrifugal Pump Performance

1
Key Laboratory of Air-Driven Equipment Technology of Zhejiang Province, College of Mechanical Engineering, Quzhou University, Quzhou 324000, China
2
School of Mechanical Engineering, Hunan University of Technology, Zhuzhou 412007, China
3
The Zhejiang Provincial Key Lab of Fluid Transmission Technology, Zhejiang Sci-Tech University, Hangzhou 310018, China
*
Author to whom correspondence should be addressed.
Processes 2022, 10(11), 2362; https://doi.org/10.3390/pr10112362
Submission received: 25 July 2022 / Revised: 14 October 2022 / Accepted: 7 November 2022 / Published: 11 November 2022

Abstract

:
In this paper, a small centrifugal pump experiment was conducted under conditions of power frequency startup and frequency conversion startup respectively. The evolutionary trends for hydraulic performance parameters with time were obtained, and the transient properties of the two starting modes were revealed with the help of three dimensionless coefficients. This study revealed the similarities and differences between the two starting modes. In both starting modes, the increase of the valve opening caused a time lag for the flow to reach a steady state. Compared with the power frequency startup mode, the frequency conversion startup mode had weaker shaft power shocks and was safer in practice. The dimensionless flow curves maintained a good evolutionary agreement with the corresponding flow curves. The dimensionless shaft power was extremely high at the beginning of startup and then decreased to a stable value.

1. Introduction

As a general fluid-transferring device, centrifugal pumps are widely used in marine, firefighting, chemical, and other fields. Generally, centrifugal pumps operate under stable working conditions for a long time; i.e., the operating rotational speed, load, and other parameters remain at a relatively stable level, or the change fluctuations are very slow or small. However, during some transient operating occurrences, the centrifugal pumps begin from a stationary state and rapidly reach a stable operating state, or they abruptly shut down from a stable working state, wherein each of the performance parameters drastically changes in a short period of time. For example, severe pressure fluctuation may occur during the fast startup period, which could be very damaging to the equipment and even lead to accidents [1].
Since as early as the 1980s, many scholars have studied the relevant transient characteristics of pumps using theoretical methods, numerical simulations, and experimental methods, and have reached some important conclusions. Tsukamoto et al. [2] conducted rapid startup tests on centrifugal pumps with low specific speeds using a combination of theory and experiment. Significant differences were found between the dynamic and quasi-steady-state characteristics of the centrifugal pump startup process, which were mainly due to pressure pulsation and hysteresis within the impeller. Lefebvre et al. [3] confirmed experimentally that there is a significant difference between the transient performance of centrifugal pumps under high acceleration startup and steady-state performance during startup. Dazin et al. [4] proposed angular momentum and energy formulas to predict the transient torque and head of turbomachinery during startup. Dazin et al. [5] divided the startup process into three consecutive phases, presenting the time nodes corresponding to each phase; the angular acceleration effect, the hydraulic inertia effect, and the viscous effect were the main influencing factors of the three consecutive phases, respectively. Duplaa et al. [6] analyzed the evolution of the vapor phase volume fraction and overall fluid density in the pump using high-frequency X-ray imaging to reveal the cavitation and transient properties during fast startup. Duplaa et al. [7] also conducted a study on the cavitation phenomenon caused by the pump during startup. They found that a smaller final flow rate leads to low cavitation at the end of startup, and as the final flow rate increases, it leads to higher cavitation, which results in decreased in the pump head. Kazem [8] explored rotating parts and fluid inertia, theoretically analyzing their transient characteristics, finding that an increase in coolant inertia increased acceleration head, while an increase in rotating component inertia decreased acceleration head. Elaoud et al. [9] used the method of characteristics to predict transient characteristics during the startup process. They found that the startup time of the pump had a significant effect on hydraulic variables such as head and flow rate. Chalghoum et al. [10] found that factors such as startup time, impeller geometry parameters, and valve opening have a large impact on the hydraulic characteristic curves and pressure variations of centrifugal pumps during startup.
Hu et al. [11] investigated the internal characteristics of centrifugal pumps during startup and shutdown and found that the performance of the pump could be assessed and improved by revealing the flow field. Wang et al. [12] found that with increased starting acceleration, the vibration acceleration amplitude gradually increased as the dominant frequency increased. Li et al. [13] showed that inside the impeller, the flow velocity increased slowly in the radial direction; when the rotational speed rose to a steady value, the transient effect gradually decreased and disappeared. Zhang et al. [14] analyzed the results of centrifugal pump startup tests and showed that quasi-steady-state analysis does not accurately assess the transient flow during startup. Gao et al. [15] established the relationship between variables such as transient flow, rotational speed, head, and torque and system parameters, finding that the transient performance of the reactor coolant pump during startup could be predicted. In their study of the startup process of centrifugal pumps, Li et al. [16] proposed a dynamic slip zone method, combining a dynamic mesh approach with non-conformal mesh boundaries to solve the transient flow caused by the impeller during startup; the final experimental results showed the correctness of the scheme. Han et al. [17] proposed an experimental method based on fluid experiments combined with computational fluid dynamics and applied user-defined functions to numerically simulate the startup process of a pump jet propulsion system. Fu et al. [18] used force coupling and dynamic mesh techniques in their study of the transient characteristics of axial flow pumps during startup to set a more reasonable rotational speed and better simulate the movement of the gate; the results of their numerical simulations were in good agreement with the data obtained from their tests. Long et al. [19] divided the startup process of multistage centrifugal pumps into closed-valve transition and open-valve transition phases. They found that during the closed-valve transition phase, the mechanical energy conversion efficiency of the internal flow field was higher than that of the steady-state operating condition at the same rotational speed. At the beginning of the open-valve transition phase, the rotational stall of the internal flow in the impeller was increased and the flow was more chaotic compared with the steady-state condition at the same flow rate.
To sum up, the above studies on the transient behavior of pumps demonstrate important progress. As we know, pumps can be started by two different modes, namely power frequency, and frequency conversion. At the startup of the power frequency mode, the electric current is determined by the power grid. While at the startup of the frequency conversion mode, the electric current is controlled through the frequency converter. As such, the transient characteristics of the pump can be affected by the starting mode during the startup period. How does the starting mode affect the transient behavior? There are insufficient relevant studies in the existing literature to answer this question and the effect of the starting mode on pump performance has not been revealed in any depth. In this paper, the transient hydraulic performance of a small centrifugal pump was studied by measuring the external performance of the startup process under power frequency and frequency conversion modes. The transient behavior of the two starting modes was further revealed using three dimensionless parameters, and an attempt was made to identify the similarities and differences between the two modes.

2. Test Physical Model

The test pump was a low specific speed centrifugal pump; the centrifugal impeller and the volute are shown in Figure 1. The rated parameters are as follows: flow Q = 6 m3/h, head H = 8 m, rotational speed n = 1450 rot/min. The blades were two-dimensional cylindrical with four long blades. The variation law of volute outline was Archimedes spiral. The other main dimensions are shown in Table 1. Based on the literature [14], the test rig was open, and the medium was conventional water. The accuracy of each instrument and the maximal frequency for each sensor can be found in the literature [1].
In this study, the driving device of the pump was a three-phase asynchronous AC (alternating current) motor with a rated power of 750 W. A JC0-type torque speed sensor with a rated torque of 5.0 N·m was installed between the pump and the motor to measure the transient rotational speed and torque. An OPTIFLUX 2100 C electromagnetic flow meter, with a range of 0–30 m3/h, was used to measure the transient flow. The transient pressure at the inlet and outlet of the pump was measured using a WIKA S-10 pressure transmitter. The ranges of the inlet and outlet pressure sensors were −1 to 1 MPa and 0 to 1.6 MPa, respectively. The output signal of each physical parameter was a 4 to 20 mA current signal, and all signals were collected and processed by a PCI8361BN acquisition card.

3. Experimental Results

3.1. Power Frequency Startup

In power frequency starting mode, the frequency of the AC power was 50 Hz. The test results of seven valve openings are shown in Figure 2, Figure 3, Figure 4 and Figure 5.
Figure 2 shows the rising characteristics of the transient rotational speed during the power frequency startup. For a centrifugal pump, as its outlet valve opening increases, the output torque needs to increase, which theoretically affects the rising characteristics of the motor speed. It can be seen from Figure 2a that the rising trend of the rotational speed was approximately linear at seven valve openings, while the differences among them were very tiny, and seven rotational speed curves rose to the final stable values at about 0.20 s. When the flow ratio Q/Qr was 0.158 (Qr is the rated flow rate), the rotational speed was the highest, about 1480 r/min; and when the flow ratio Q/Qr was 1.312, the rotational speed was the lowest, about 1464 r/min. The intermediate range was approximately linear; i.e., the stable rotational speed at the end of the starting process showed a gradual and slight downward trend with the increase of the valve opening. This can be seen more clearly in Figure 2b, which also illustrates that there was a slight lag in the time node at which the speed reached stability as the valve opening increased. In short, the change in rotational speed was not obvious, despite the valve opening.
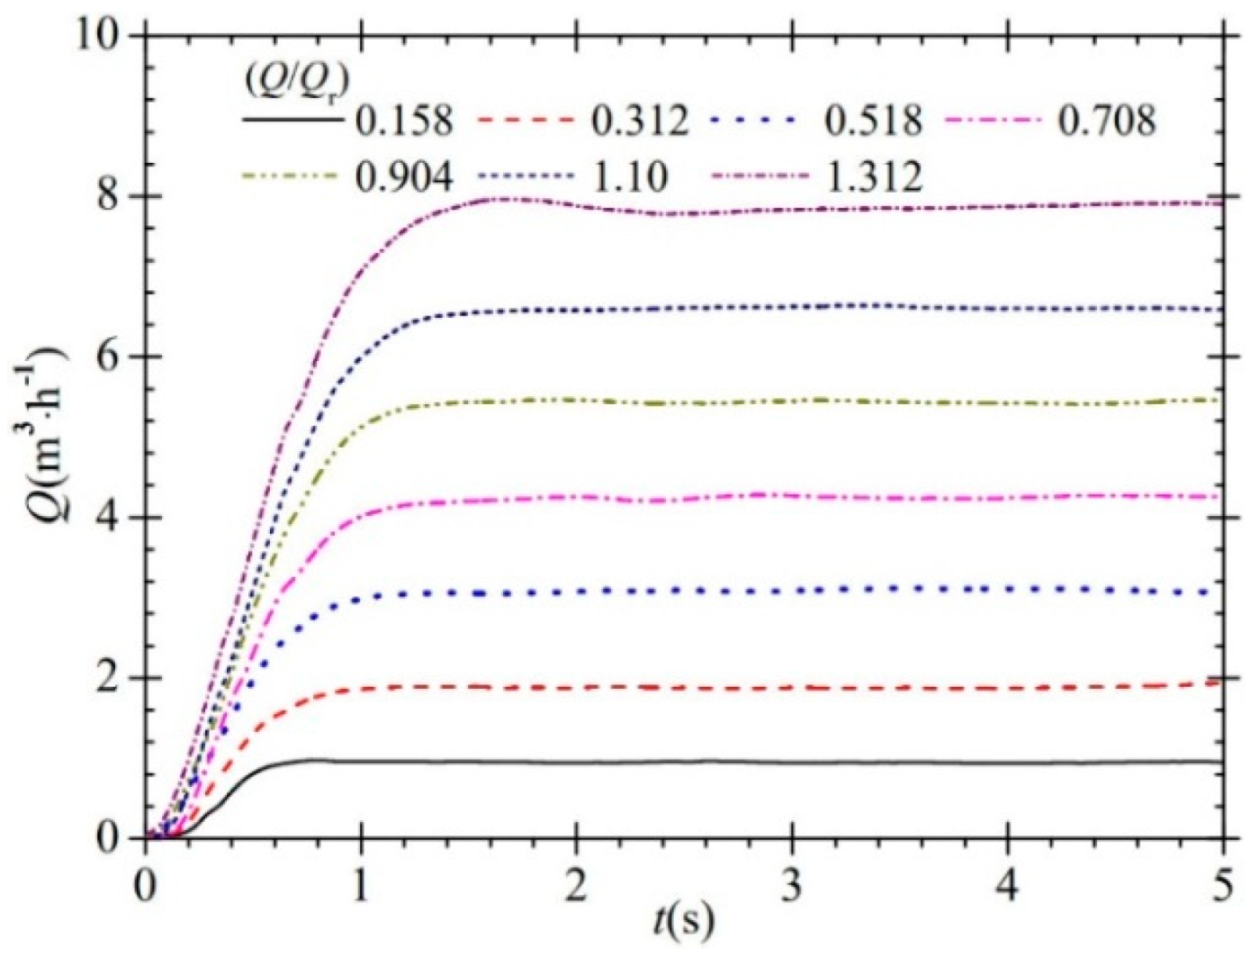
The transient flow characteristics during the power frequency startup are shown in Figure 3. It can be seen that the rising trend of each flow curve was basically the same but smoother compared to the rising trend of the rotational speed curve. Compared with the rising of the rotational speed in Figure 2, it is easy to see that the rising of the flow was behind that of the rotational speed. This could be attributed to the fact that the transferred medium was static before starting; namely, the water body was static in the whole system.
The basic characteristics shown in Figure 3 are that the rise rating was relatively slow at the beginning of the startup period and then rose rapidly. As the flow approached the stable value, the rising rate decreased again and finally reached a stable level. When the flow ratio Q/Qr was 0.158, 0.312, 0.518, 0.708, 0.904, 1.100, and 1.312, the time required for the flow to rise to a stable value was about 0.70 s, 1.0 s, 1.10 s, 1.30 s, 1.40 s, 1.40 s, and 1.60 s, respectively. It can be seen that the time required for the flow to rise to the stable value was significantly greater than the time required for the rotational speed to rise to the stable value. Furthermore, with the increase of the valve opening, the time required for the flow to rise to the stable value also showed a gradually increasing trend. The rising characteristics of the head during the power frequency startup are shown in Figure 4. Under seven different valve openings, the head curves rose to a stable value of approximately 9.76 m, 9.67 m, 9.55 m, 9.27 m, 8.83 m, 8.03 m, and 6.87 m respectively. As can be seen, the stable head decreased gradually with the increase of the valve opening.
It can be seen from Figure 4 that at the end of startup, the steady head decreased gradually with the increase of the flow ratio. At the beginning of startup, the rise in head was relatively smooth, but then the rising rate increased rapidly. After 0.5 s, when the flow ratio Q/Qr was 0.158, 0.312, 1.10, and 1.312, respectively, the four head curves showed a more obvious shock phenomenon. The maximum values in heads corresponding to the four valve openings were about 10.21 m, 10.05 m, 8.23 m, and 8.02 m, respectively, and the time of head impact was about 0.60 s, 0.70 s, 0.50 s, and 0.50 s, respectively. The impact head (defined as the difference between the maximum head and the stable head) corresponding to each valve opening was 0.45 m, 0.38 m, 0.20 m, and 1.15 m, respectively. It can be seen that when the flow ratio was from 0.158 to 0.518, the shock head gradually decreased with the increase of the valve opening; when the flow ratio was from 0.518 to 1.312, the shock head gradually increased with the increase of the valve opening. When the flow ratio was 0.518, 0.708, and 0.904, respectively, there was no obvious pressure shock phenomenon.
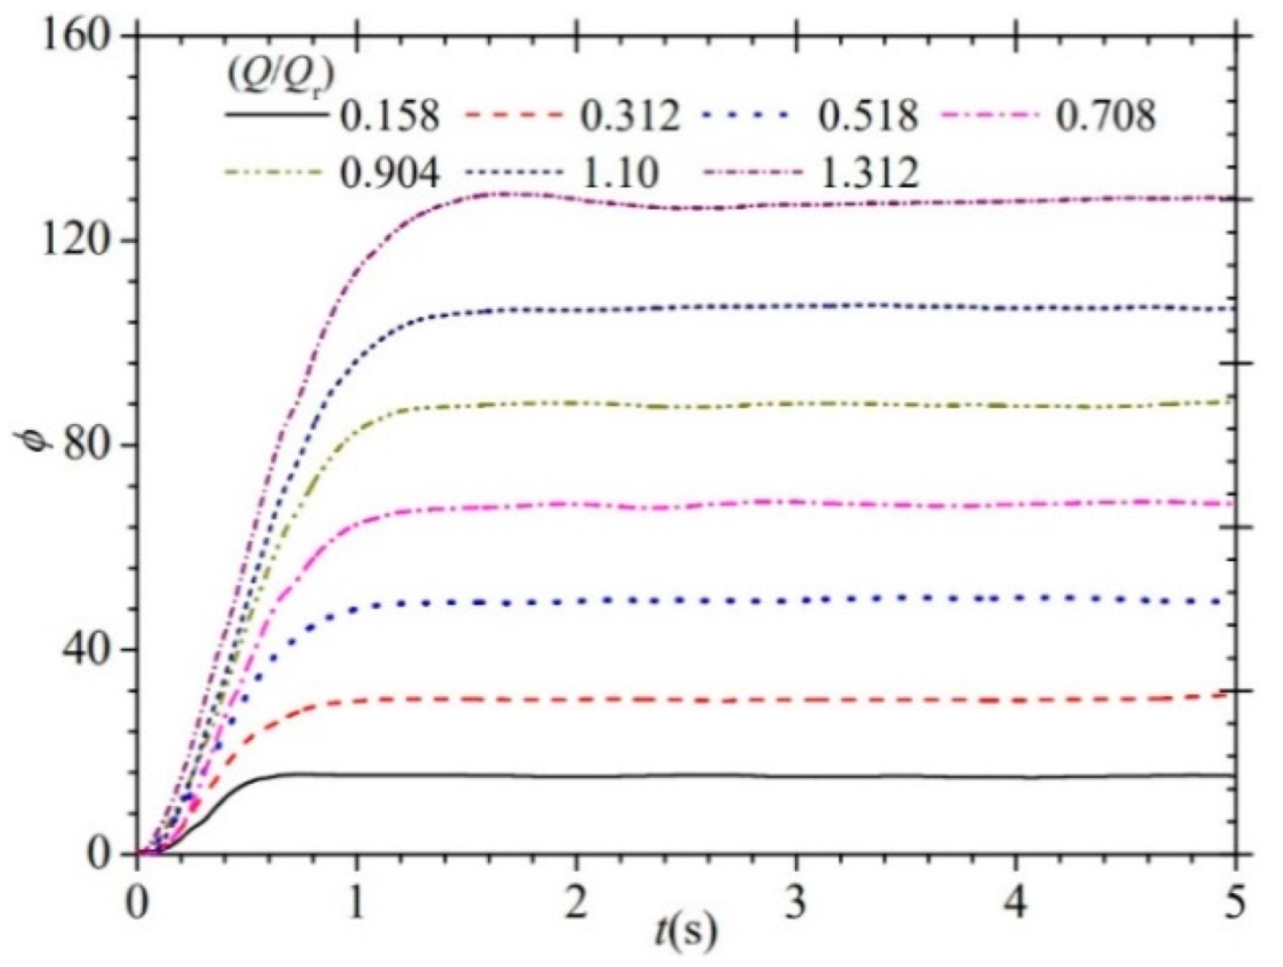
In the present experiment, a JC0-type torque speed sensor with a rated torque of 5 N·m was installed between the model pump and the motor to measure the transient rotational speed and transient torque. The shaft power of the centrifugal pump was calculated using the measured rotational speed and torque, as shown in Figure 5. It was found that, except for the flow ratio of 1.312, the other six shaft power curves showed a relatively obvious power shock phenomenon. When the flow ratio was 0.158, 0.312, 0.518, 0.708, 0.904, and 1.100, respectively, the time of shaft power impact was about 0.30 s, and the corresponding maximum shaft powers were about 0.325 kW, 0.347 kW, 0.314 kW, 0.345 kW, 0.358 kW, and 0.407 kW, respectively. They all dropped to the stable value at about 0.60 s, and the corresponding stable shaft power values were about 0.242 kW, 0.258 kW, 0.278 kW, 0.308 kW, 0.331 kW, and 0.361 kW, respectively. The corresponding shock power (defined as the difference between the maximum shaft power and the stable shaft power) was 0.083 kW, 0.089 kW, 0.036 kW, 0.037 kW, 0.027 kW, and 0.046 kW, respectively. When the flow ratio was 1.312, there was no obvious shaft power impact phenomenon, and the shaft power curve rapidly rose at the beginning of startup; the final stable value was about 0.386 kW.

3.2. Frequency Conversion Startup

Frequency conversion startup means using a frequency converter to change the current frequency. By converting the current frequency, the motor speed can be controlled, so that the motor can start smoothly and reduce the impact on the local power grid.
The experimental results for the frequency conversion startup are shown in Figure 6, Figure 7, Figure 8 and Figure 9. Figure 6 shows the measured transient rotational speed. The rising characteristics of the rotational speed curves at seven valve openings were basically the same. When the flow ratio was 0.155, 0.308, 0.504, 0.701, 0.902, 1.095, and 1.296, respectively, the difference in the rising of the rotational speeds to the respective stable values was very small. At 0.50 s, the corresponding transient rotational speeds were 531 r/min, 543 r/min, 541 r/min, 531 r/min, 515 r/min, 518 r/min, and 533 r/min, respectively. At the initial stage of startup, the rotational speed curves rose relatively rapidly, and after about 0.50 s, the rising rate tended to slow down. Within 0.5 s–2.3 s, seven rotational speed curves rose to the stable value at a slightly slower rate, and the rising trend was basically the same and showed a linear pattern. All rotational speed curves rose to the stable value at about 2.30 s, corresponding to the final stable values of about 1471 r/min, 1469 r/min, 1468 r/min, 1465 r/min, 1460 r/min, 1458 r/min, and 1455 r/min, respectively. The rotational speed at the end of the frequency conversion startup tended to decrease slightly with the increase of the valve opening, and this characteristic was the same as for the power frequency startup.
The transient flow characteristics during frequency conversion startup are shown in Figure 7. The steady flow values corresponding to the seven valve openings were 0.90 m3/h, 1.80 m3/h, 3.0 m3/h, 4.20 m3/h, 5.40 m3/h, 6.60 m3/h, and 7.80 m3/h, respectively. At the beginning of the frequency conversion startup, although the rotational speed rose rapidly, the rising rate of the flow curve was relatively slow. This was the same as for the power frequency startup; the reason for this phenomenon was that the water volume in the whole system before startup was in a static state, with large inertia. With the increase of the valve opening, the time required for the flow to rise to a stable value gradually increased. The flow curves rose to their respective stable values at approximately 0.94 s, 3.43 s, 4.13 s, 4.36 s, 4.53 s, 4.59 s, and 4.62 s for seven different valve openings. During the rising of each flow curve, the flow curves all rose at a more moderate rate at the beginning of startup and then rose rapidly. Of these, when the stable flow ratios were 0.155, 0.308, and 0.504, three flow curves showed a more obvious slowdown of the rising rate, and the time points corresponding to the phenomenon appearance were 0.62 s, 0.67 s, and 0.73 s, respectively. For the other four cases, a tendency towards slowing down was also found, but the transition curve was smoother and there was no more obvious mutation. The rising rates of the flow curves become very slow when rising close to the steady value at the end of startup. In short, the rising characteristics were different for different valve openings. Compared with the flow curves in power frequency startup, the rising rule in frequency conversion startup displayed an obvious distinction.
Figure 8 shows the transient head characteristics during the frequency conversion startup. The head curves also rose gradually with the increased rotational speed. The rising rate of the head curve was relatively slow up to about 1.20 s. At 1.20 s, the transient heads corresponding to seven different valve openings were 2.18 m, 2.13 m, 2.07 m, 2.03 m, 1.99 m, 1.86 m, and 1.72 m, respectively. After about 1.2 s, the rising rate of the head curves increased slightly. After the startup process, seven head curves rose to stable values at about 5.0 s. The corresponding stable values were 9.61 m, 9.56 m, 9.46 m, 9.24 m, 8.71 m, 7.95 m, and 6.85 m respectively. Compared with the flow ratio of 0.155, the drop in head was 0.05 m when the ratio was 0.308, which represented a drop of 0.52% relative to the former. Similarly, the relative values of the head drops were 1.05%, 2.33%, 5.74%, 8.73%, and 13.84% in the other cases. It can be seen from Figure 8, that at the end of the frequency conversion startup, the degree of head drop increased gradually with the increase of the valve opening. It is easy to see that the head impact phenomenon is the maximum difference between the two startup modes.
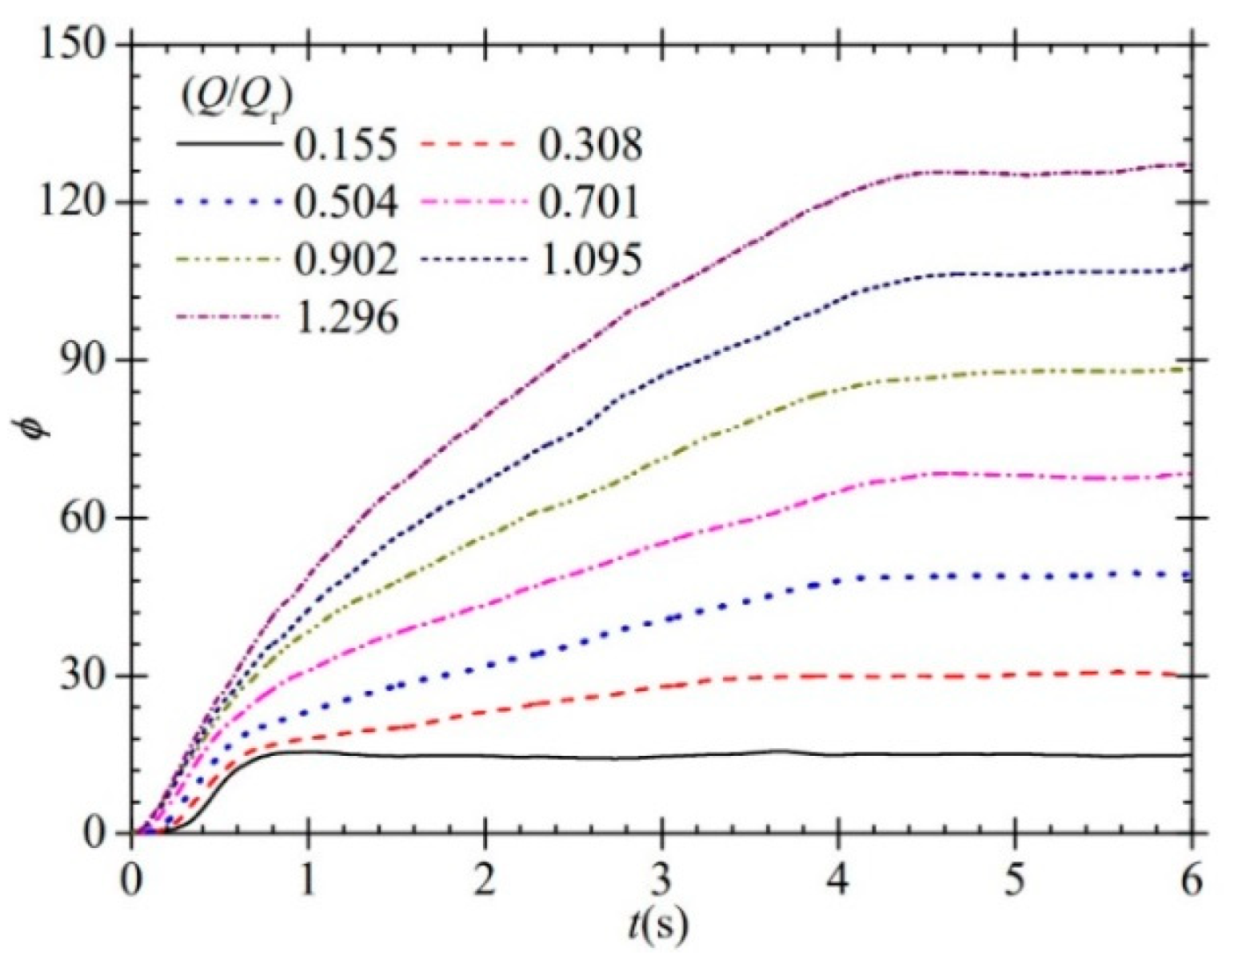
The transient shaft power test results during the frequency conversion startup, are shown in Figure 9. Combined with the rotational speed curves in Figure 6, the variation characteristics of the shaft power curves is synchronized well in time; this was mainly because both of the physical quantities were measured by the same instrument. After frequency conversion startup, the shaft power curves rose rapidly; the rising rate of the shaft power curves slowed down slightly after about 0.50 s. Until about 2.40 s, all the curves had shaft power shock phenomenon to different degrees; i.e., the shaft power rose to the maximum value and then decreased to fluctuate around the steady value. For the seven valve opening cases, the maximum shaft power values were 0.262 kW, 0.279 kW, 0.292 kW, 0.322 kW, 0.348 kW, 0.367 kW, and 0.388 kW, respectively. When the rotational speeds rose to stable values, the shaft powers were characterized by periodic fluctuations as a whole, and the corresponding average values were about 0.233 kW, 0.249 kW, 0.271 kW, 0.302 kW, 0.327 kW, 0.351 kW, and 0.379 kW, respectively. The shock powers (i.e., the difference between the maximum value and the stable value) were 0.029 kW, 0.030 kW, 0.021 kW, 0.020 kW, 0.021 kW, 0.016 kW, and 0.009 kW, respectively. It can be seen from Figure 9, that both the steady average values and the maximum values showed an increasing trend with the increase of the valve opening, although the shock powers showed an opposite trend overall; i.e., they gradually decreased with the increase of the valve opening. Therefore, the shock phenomenon of shaft power was more obvious when the outlet valve opening was relatively small. In conclusion, the impact phenomenon of shaft power was more obvious in the power frequency startup than in the frequency conversion startup. This indicates that the frequency conversion startup mode is safer.

4. Dimensionless Analysis

The startup process can be described in terms of dimensionless volumetric flow, dimensionless head, and dimensionless shaft power with respect to time. The three parameters are defined as follows:
ϕ ( t ) = Q ( t ) / π D 2 b 2 u 2 ( t ) ψ ( t ) = 2 g H ( t ) / u 2 2 ( t ) Φ ( t ) = P ( t ) / ρ D 2 2 u 2 3 ( t )
where u2(t) is the transient circumferential velocity at the impeller outlet, whose expression is u2 = πD2n(t)/60. Figure 10, Figure 11, Figure 12, Figure 13, Figure 14 and Figure 15 give the time evolution history of the three dimensionless coefficients during power frequency startup and frequency conversion startup, respectively.

4.1. Power Frequency Startup

The transient evolution characteristics of dimensionless flow during power frequency startup are shown in Figure 10. The dimensionless volume flow curves showed a continuous increase when starting. With the increase of the valve opening, the time needed for the dimensionless flow to rise to a stable value also gradually increased, which indicates that the delay in the rise of the transient flow curve would lag more with the increase of the valve opening. It is not difficult to conclude that the curves shown in Figure 10 are very similar to the transient flows shown in Figure 3. This is because the time required for the flow to rise to the stable value was significantly delayed by the corresponding rotational speed rise. When the flow gradually rose to the stable value, the rotational speed was already in a stable state.
Figure 11 shows the time evolution of the transient dimensionless head in the process of power frequency startup. During the power frequency startup period, all the transient dimensionless head curves first decreased rapidly, then rose slowly, and finally, they fluctuated near the stable value. At the beginning of startup, there was a maximum value of transient dimensionless head, which then rapidly decreased to a minimum value at about 0.20 s. The occurrence of maximal values at the beginning of the startup process can be explained as follows: the sudden rotation of the impeller after startup produces a pressure shock to the stationary water volume. Compared with Figure 4, it can be seen that the rising characteristics of the head curves and the transient dimensionless head curves were basically similar after about 0.20 s, but there was a significant delay in time. For flow ratios of 0.158 and 0.312, the time for the transient dimensionless head curve to rise to the stable value was approximately 1.10 s. For flow ratios of 0.518, 0.708, and 0.904, this was approximately 1.0 s. When the flow ratios were 1.10 and 1.312, this was about 0.90 s. It can be seen that the time required for the transient dimensionless head curves to change to stable values decreased with the increase of the valve opening. Of these, the transient dimensionless head curves also showed a more obvious shock when the flow ratio was 0.158, 0.312, 1.10, and 1.312, respectively.
The time evolution of the transient dimensionless shaft power during the power frequency startup process is shown in Figure 12. At the beginning of startup, the transient dimensionless shaft powers had maximum values, which then rapidly decreased to stable values. It is not difficult to conclude that the decreasing rate of the transient dimensionless shaft power curves was very large until about 0.16 s. After 0.16 s, the decreasing trend of these curves gradually moderated, and at about 0.40 s, all the curves were basically in a stable state.

4.2. Frequency Conversion Startup

The transient dimensionless flow during frequency conversion startup is shown in Figure 13. All the transient dimensionless flow curves showed a continuous upward trend overall until they rose to stable values. Furthermore, as the valve opening increased, the time required for the transient dimensionless flow to rise to a stable value also increased gradually. Comparing Figure 13 with Figure 6 (the transient flow during frequency conversion startup), it can be seen that the shape of the two curves is essentially the same and the time steps of the curve change remain highly consistent. Similar to the power frequency startup, the time required for the dimensionless flow to rise to a stable value during frequency conversion startup lagged significantly behind the corresponding rise in rotational speed. When the flow had gradually risen to a stable value, the rotational speed was already in a stable state. The test results for dimensionless flow and flow could remain highly consistent over time and in a curved shape during frequency conversion startup.
Comparing Figure 11 and Figure 14, it can be seen that the overall variation characteristics of the transient dimensionless heads during frequency conversion startup and power frequency startup were basically similar.
The evolution characteristics of the transient dimensionless shaft power during frequency conversion startup are shown in Figure 15. The overall trend for transient dimensionless shaft powers decreased at the beginning of startup to the final stable values. At the beginning of startup, the transient dimensionless shaft power had maximum values and then decreased rapidly to about 1.20 s, when the decrease rate gradually slowed down; at about 2.60 s, all the transient dimensionless shaft power curves decreased to stable values. It was also found that the transient dimensionless shaft power increased gradually with the increase of the valve opening.

5. Conclusions

In this paper, the similarities and differences between two starting modes were studied through experiments. The similarities include: the flow rate rose slowly at the beginning of startup, with a significant delay relative to the rotational speed, and the delay of the flow rising became more obvious with the increase of the valve opening. This phenomenon has also been found by other scholars [1]. The head shock phenomenon was gradually weakened with the increase of the valve opening, but the relative value of head drop showed an increasing trend. The dimensionless flow curves maintained good evolutionary consistency with the corresponding flow curves. The dimensionless shaft powers all showed maximum values at the beginning of startup and then dropped to stable values.
The differences include: during the power frequency startup, the rising rate of the flow curve existed from slow to fast and then took a gradually decelerating course; while during the frequency conversion startup, the rising rate of the flow slowed down twice for some valve openings. Compared with the power frequency startup, the impact phenomenon of the shaft power in the frequency conversion startup process was more moderate, which is beneficial for operating load equipment. In the literature [14], other authors have presented similar conclusions.

Author Contributions

L.C. and K.-Y.Z. carried out experiments and wrote the manuscript; Y.-L.Z. analyzed the flow characteristics; X.-Q.J. checked the manuscript and revised it. All authors have read and agreed to the published version of the manuscript.

Funding

The research was financially supported by the “Pioneer” and “Leading Goose” R&D Program of Zhejiang (Grant No. 2022C03170), Science and Technology Project of Quzhou (Grant No. 2022K98), National Natural Science Foundation of China (Grant No. 51876103), and Zhejiang Provincial Natural Science Foundation of China (Grant No. LZY21E060001 and LZY21E060002).

Data Availability Statement

The data that support the findings of this study are available from the corresponding author upon reasonable request.

Conflicts of Interest

The authors declared no potential conflict of interest with respect to the research, authorship, and/or publication of this article.

References

  1. Zhang, Y.L.; Zhu, Z.C.; Li, W.G. Experiments on transient performance of a low specific speed centrifugal pump with open impeller. J. Power Energy 2016, 230, 648–659. [Google Scholar] [CrossRef]
  2. Tsukamoto, H.; Ohashi, H. Transient Characteristics of a Centrifugal Pump During Startup Period. ASME J. Fluids Eng. 1982, 104, 6–13. [Google Scholar] [CrossRef]
  3. Lefebvre, P.J.; Barker, W.P. Centrifugal Pump Performance During Transient Operation. ASME J. Fluids Eng. 1995, 117, 123–128. [Google Scholar] [CrossRef]
  4. Dazin, A.; Caignaert, G.; Bois, G. Transient Behavior of Turbomachineries: Applications to Radial Flow Pump Startups. J. Fluids Eng. 2007, 129, 1436. [Google Scholar] [CrossRef]
  5. Dazin, A.; Caignaer, G.; Dauphin-Tanguy, G. Model Based Analysis of the Time Scales Associated to Pump Startups. Nucl. Eng. Des. 2015, 293, 218–227. [Google Scholar] [CrossRef] [Green Version]
  6. Duplaa, S.; Coutier-Delgosha, O.; Dazin, A.; Bois, G. X-ray Measurements in a Cavitating Centrifugal Pump during Fast Startups. J. Fluids Eng. 2013, 135, 041204. [Google Scholar] [CrossRef] [Green Version]
  7. Duplaa, S.; Coutier-Delgosha, O.; Dazin, A.; Roussette, O.; Bois, G. Experimental Study of a Cavitating Centrifugal Pump during Fast Startups. J. Fluids Eng. 2010, 132, 021301. [Google Scholar] [CrossRef]
  8. Farhadi, K. Transient Behaviour of a Parallel Pump in Nuclear Research Reactors. Prog. Nucl. Energy 2010, 53, 195–199. [Google Scholar] [CrossRef]
  9. Elaoud, S.; Hadj-Taieb, E. Influence of Pump Starting Times on Transient Flows in Pipes. Nucl. Eng. Des. 2011, 241, 3624–3631. [Google Scholar] [CrossRef]
  10. Chalghoum, I.; Elaoud, S.; Akrout, M.; Taieb, E.H. Transient Behavior of a Centrifugal Pump during Starting Period. Appl. Acoust. 2016, 109, 82–89. [Google Scholar] [CrossRef]
  11. Hu, F.F.; Ma, X.D.; Wu, D.Z.; Wang, L.Q. Transient Internal Characteristic Study of a Centrifugal Pump during Startup Process. IOP Conf. Ser. Earth Environ. Sci. 2012, 15, 042016. [Google Scholar] [CrossRef]
  12. Wang, Y.; Xie, L.; Chen, J.; Liu, H.L.; Luo, K.K. Experimental Study on Transient Startup Characteristics of a Super Low Specific Speed Centrifugal Pump. J. Chem. Eng. Jpn. 2019, 52, 743–750. [Google Scholar] [CrossRef]
  13. Li, W.; Zhang, Y.; Shi, W.D.; Ji, L.L.; Yang, Y.F.; Ping, Y.F. Numerical Simulation of Transient Flow Field in a Mixed-flow Pump During Starting Period. Int. J. Numer. Methods Heat Fluid Flow 2018, 28, 927–942. [Google Scholar] [CrossRef]
  14. Zhang, Y.L.; Jin, Z.C.Z.Y.Z.; Cui, B.L.; Li, Y. Experimental Study on a Centrifugal Pump with an Open Impeller during Startup Period. J. Therm. Sci. 2013, 22, 1–6. [Google Scholar] [CrossRef]
  15. Gao, H.; Gao, F.; Zhao, X.C.; Chen, J.; Cao, X.W. Analysis of Reactor Coolant Pump Transient Performance in Primary Coolant System during Startup Period. Ann. Nucl. Energy 2013, 54, 202–208. [Google Scholar] [CrossRef]
  16. Li, Z.F.; Wu, P.; Wu, D.Z.; Wang, L.Q. Experimental and Numerical Study of Transient Flow in a Centrifugal Pump During Startup. J. Mech. Sci. Technol. 2011, 25, 749–757. [Google Scholar] [CrossRef]
  17. Han, W.; Zhang, T.; Su, Y.L.; Chen, R.; Qiang, Y.; Han, Y.; Bruchon, J. Transient Characteristics of Water-Jet Propulsion with a Screw Mixed Pump during the Startup Process. Math. Probl. Eng. 2020, 2020, 5691632. [Google Scholar] [CrossRef]
  18. Fu, S.F.; Zheng, Y.; Kan, K.; Chen, H.X.; Han, X.X.; Liang, X.L.; Liu, H.W.; Tian, X.Q. Numerical Simulation and Experimental Study of Transient Characteristics in an Axial Flow Pump during Startup. Renew. Energy 2020, 146, 1879–1887. [Google Scholar] [CrossRef]
  19. Long, Y.; Lin, B.; Fang, J.; Zhu, R.S.; Fu, Q. Research on the Transient Hydraulic Characteristics of Multistage Centrifugal Pump during Startup Process. Front. Energy Res. 2020, 8, 2020. [Google Scholar] [CrossRef]
Figure 1. Main flow components: (a) Centrifugal impeller, (b) Volute.
Processes 10 02362 g001
Figure 2. Rotational speed characteristics during power frequency startup: (a) All valve openings, (b) Maximum and minimum valve opening.
Processes 10 02362 g002
Figure 3. Flow characteristics during power frequency startup.
Processes 10 02362 g003
Figure 4. Head characteristics during power frequency startup.
Processes 10 02362 g004
Figure 5. Shaft power characteristics during power frequency startup.
Processes 10 02362 g005
Figure 6. Rotational speed characteristics during frequency conversion startup.
Processes 10 02362 g006
Figure 7. Flow characteristics during frequency conversion startup.
Processes 10 02362 g007
Figure 8. Head characteristics during frequency conversion startup.
Processes 10 02362 g008
Figure 9. Shaft power characteristics during frequency conversion startup.
Processes 10 02362 g009
Figure 10. Dimensionless flow characteristics of power frequency startup.
Processes 10 02362 g010
Figure 11. Dimensionless head characteristics of power frequency startup.
Processes 10 02362 g011
Figure 12. Dimensionless shaft power characteristics of power frequency startup.
Processes 10 02362 g012
Figure 13. Dimensionless flow characteristics of frequency conversion startups.
Processes 10 02362 g013
Figure 14. Dimensionless head characteristics of frequency conversion startup.
Processes 10 02362 g014
Figure 15. Dimensionless shaft power characteristics of frequency conversion startup.
Processes 10 02362 g015
Table 1. Main geometric parameters of centrifugal pumps.
Geometrical ParametersNumerical ValueGeometrical ParametersNumerical Value
Blade inlet angle β1/(°)25Impeller outlet width b2/mm10
Blade outlet angle β2/(°)25Pump inlet diameter Di/mm50
Number of blades Z4Pump outlet diameter Do/mm40
Blade thickness δ/mm3Diameter of volute base circle D3/mm165
Impeller inlet diameter D1/mm48Width of volute inlet b3/mm15
Impeller outer diameter D2/mm160Diameter of volute throat Dth/mm15
Impeller inlet width b1/mm20Diffusion angle of diffuser tube β1/(°)8
Publisher’s Note: MDPI stays neutral with regard to jurisdictional claims in published maps and institutional affiliations.

