1. Introduction
According to the Organization of Petroleum Exporting Countries, oil demand will increase by 16.4 MB/day between 2015 and 2040, corresponding to 99.2 MB/day in 2021 and 109.4 MB/day in 2040 [
1]. Light crude oil reserves have been consumed excessively over the past decades. Therefore, unconventional resources, such as heavy oil, have been considered fuel alternatives [
2]. Heavy oil is a dense, viscous, and asphaltic oil that contains asphaltenes and has an American Petroleum Institute (API) density ranging between 10° and 20° API [
3]. Heavy crude oil is a complicated mixture of different hydrocarbons divided into four major components: saturates, aromatic, resin, and asphaltene (SARA) [
4]. Recently, in situ upgrading methods have been developed for oil product use, such as solvent-based and in situ thermochemical conversion (pyrolysis and gasification), among others. These methods aim to process heavy crude oil using three mechanisms: increasing short-chain hydrocarbons, reducing asphaltene, and removing heteroatoms [
5].
Biomass for energy use is generated from different sources, such as wood, agricultural, food, and petroleum refinery residues, which could be converted into bioproducts through thermochemical conversion processes, viz. pyrolysis, carbonization, gasification, among others [
6]. Some petroleum refineries in Brazil occupy large areas with extensive vegetation (trees and lawns) due to the oil production process (refining, transportation, processing, and distribution) and oily residue generation [
7,
8]. Thus, pruning trees and lawns is a daily activity in the refineries, producing biomass that requires proper disposal, and one of the possibilities is its energy use. According to González-Arias et al. [
9], biomasses pruning shows potential for energy recovery, but those are usually scattered in fields or eliminated by burning. Pyrolysis is the thermal degradation of carbonaceous materials in the absence of oxygen, converting biomass to bio-oil, char, and non-condensable gases [
10]. After hydrotreatment and upgrading, the bio-oil obtained from by-products pyrolysis (such as biomass and heavy oil) will have properties comparable to those produced at the same refinery [
11,
12].
On the other hand, gasification is the thermal decomposition process of a carbon-rich raw material under an oxidizing atmosphere that aims to produce fuel gases with energy potential from removing volatiles from the fuel’s carbon matrix. The gasification process requires a gasification agent, which allows the molecular structure of the raw material to be rearranged [
13]. For this purpose, steam, oxygen, air, carbon dioxide, hydrogen, or a mixture are usually used. The gasification agent reacts with char and heavier hydrocarbons during the process, transforming them into low molecular weight gases, such as CO and H
2 [
14]. Subsequently, producer gas is generated and, after being conditioned, can be used directly as fuel in prime movers, such as internal combustion engines, gas microturbines, or Rankine cycles [
15].
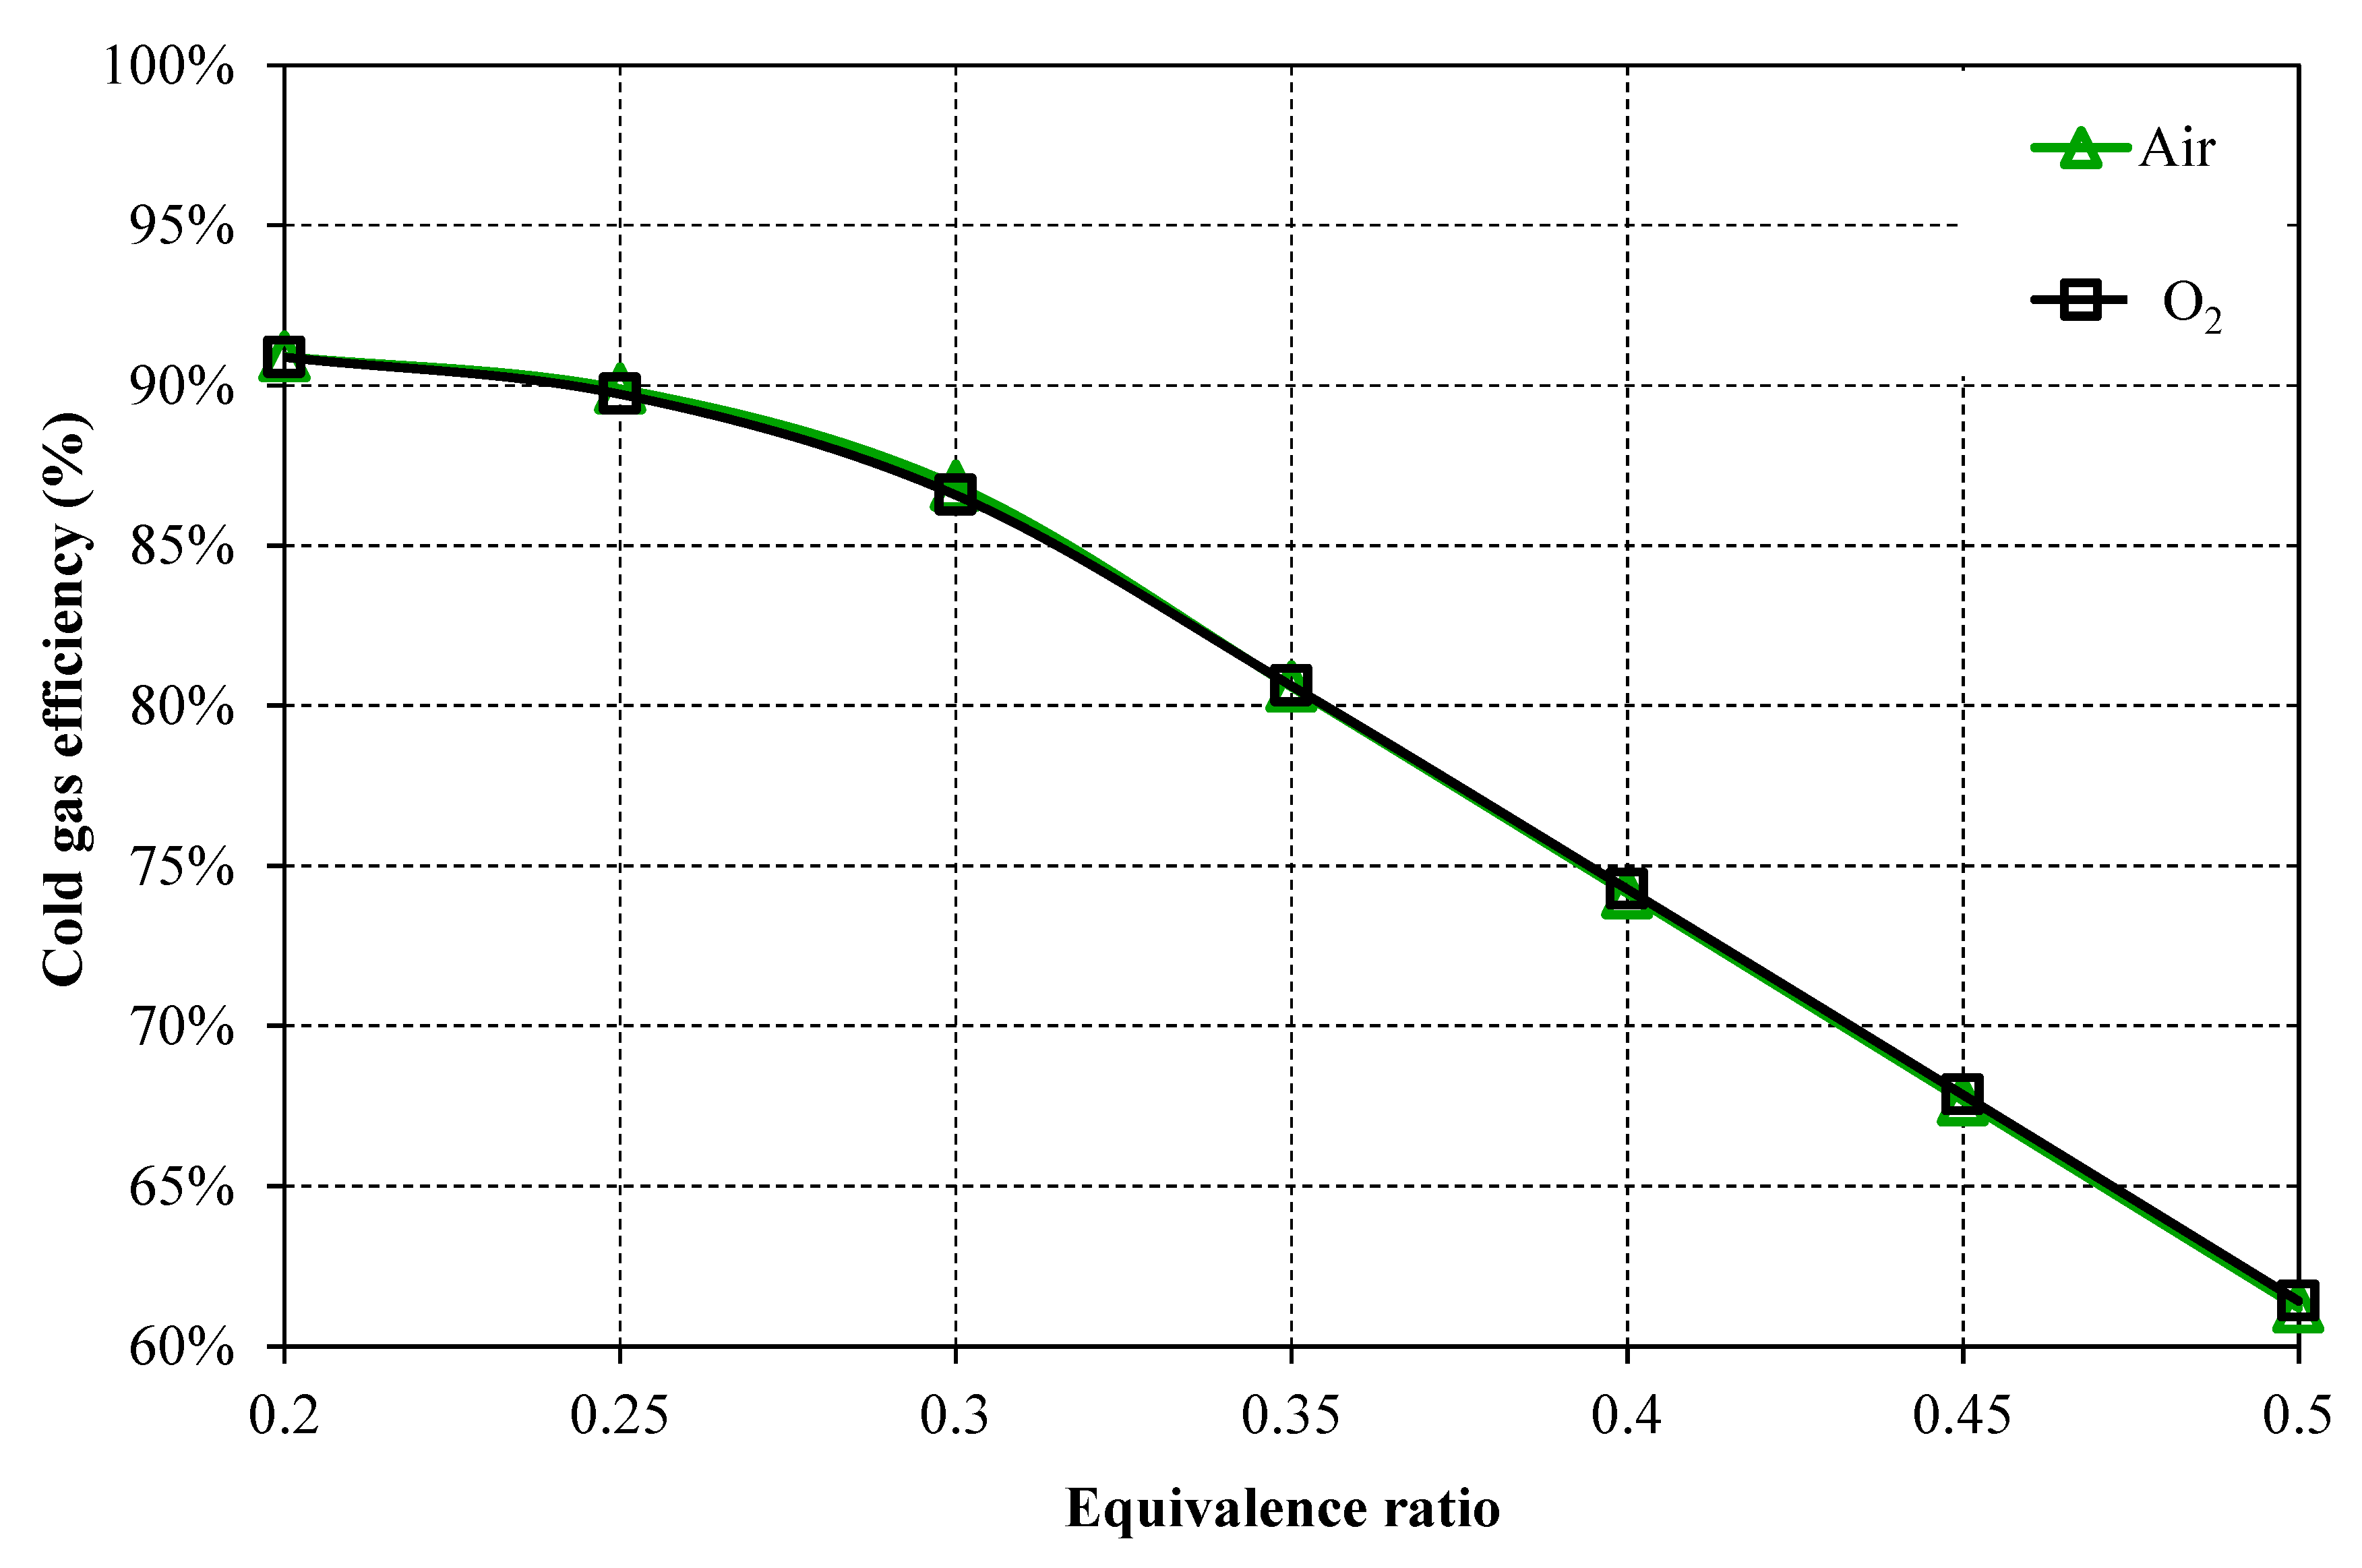
Ghassemi et al. [
16] studied the gasification of extra-heavy oil using a model based on the Gibbs free energy minimization approach. The authors observed that an increase in equivalence ratio (ER) from 0.2 to 0.8 leads to a considerable decrease in the higher heating value (HHV) of producer gas (from 15.2 to 4.7 MJ/Nm
3) and in the cold efficiency (80% to 47%), while the char conversion efficiency increases from 43% to 92%. Yang et al. [
17] modeled the heavy oil gasification process in Aspen Plus™ software, considering mixtures of air and steam as gasification agents. The results showed that temperature plays an essential role in the process, where gasification temperature of 800 °C produced the highest H
2 yield (58 g H
2/kg-fuel). They also found that using a steam/oil ratio of 0.7 could cause a significant increase in H
2 yield.
Bader et al. [
18] numerically evaluated the gasification of heavy oil using O
2 and steam mixtures as a gasification agent. The authors developed a computational fluid dynamics model that comprises the implementation of heterogeneous char reactions in ANSYS Fluent™ v17.2 software, obtaining a producer gas at a temperature of 1599 K and with 50.55% CO, 42.71% H
2, 3.55% CO
2, and 0.54% CH
4; demonstrating that the impact of the producer gas composition on oil conversion is smaller when the humidity decreases. Banisaeed and Rezaee-Manesh [
19] developed a kinetic model of heavy oil gasification to investigate the influence of oxygen as a gasification agent and pressure on producer gas composition and yield. The results indicated that an increase of 0.4 to 1.0 in the oxygen ratio leads to increases in the HHV value and in the cold efficiency of the gasification process, which increase from 8.0 to 10.0 MJ/Nm³ and from 35% to 70%, respectively. On the other hand, the authors observed that increases in the gasification pressure from 10 to 40 atm did not influence the HHV and yield of producer gas, obtaining minimal variations in these two variables.
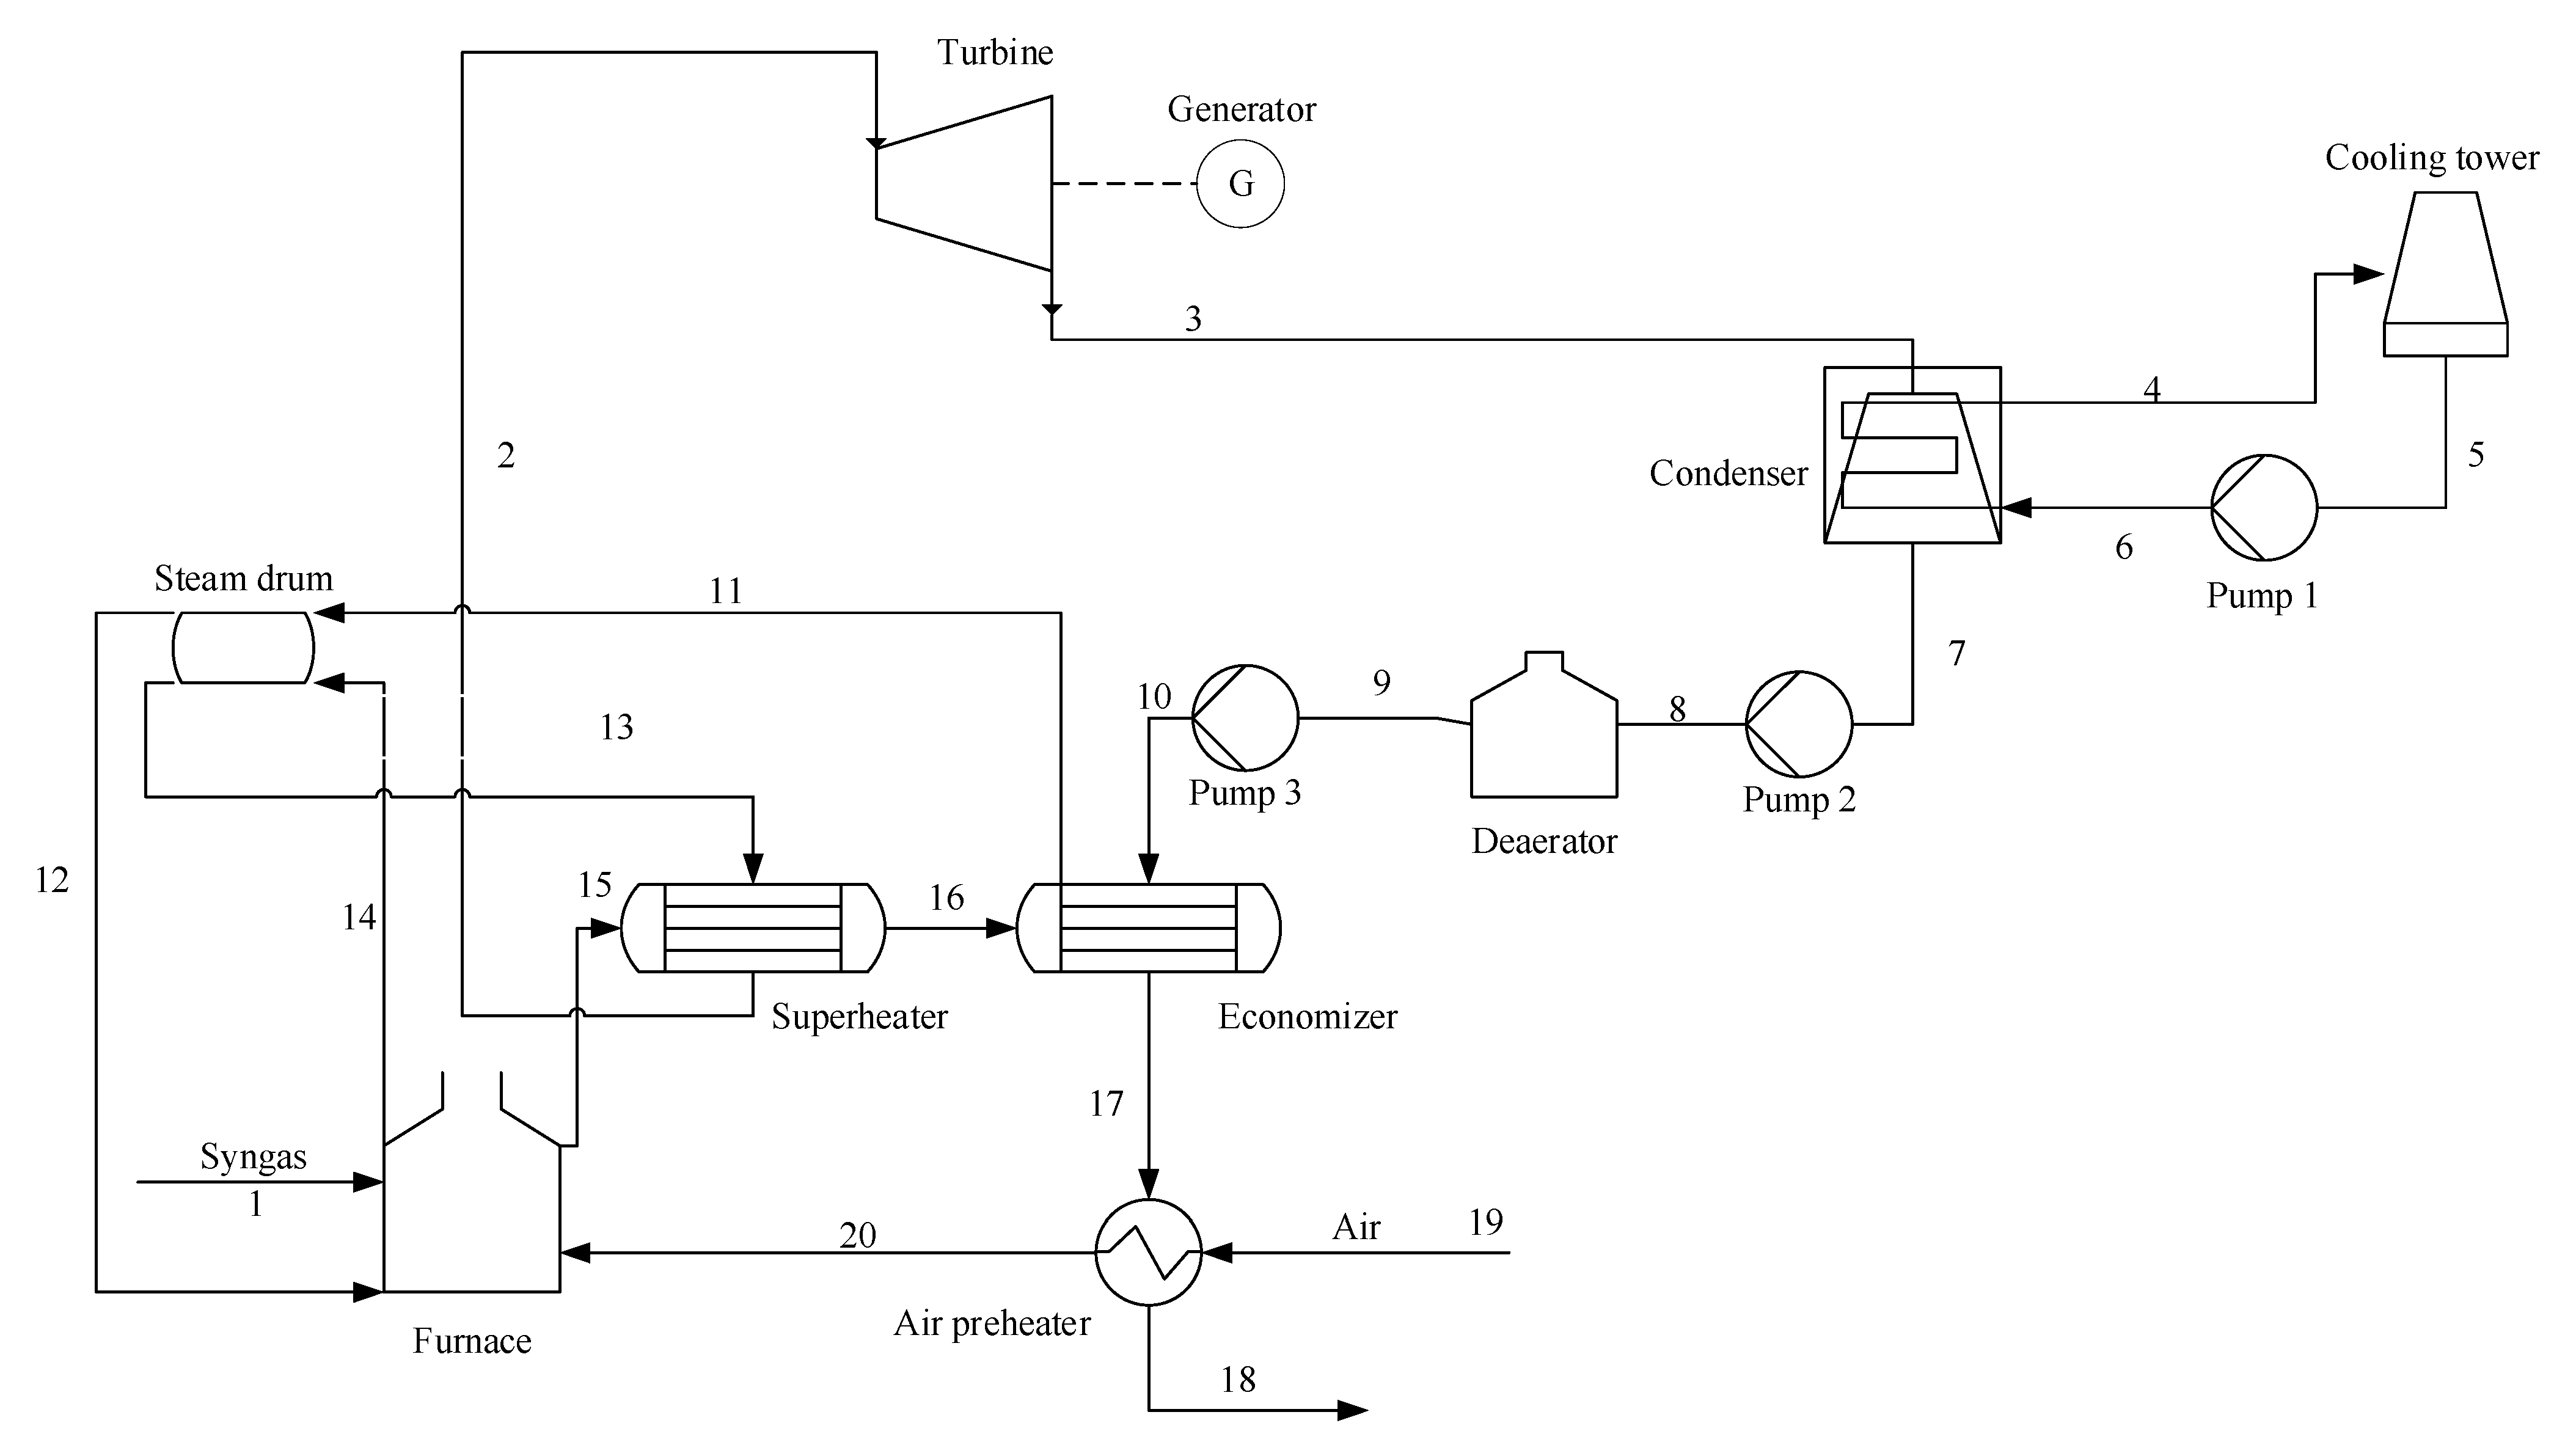
In its simplest version, the Rankine cycle consists of four essential components: a pump, a boiler, a steam turbine, and a steam condenser. Due to its nature and parameters, it has relatively low efficiency, and it is possible to expect small capacity systems operating at pressures close to 20 bar and efficiencies in the range of 7–15%, depending on the components’ efficiencies included in the cycle and the type of turbine used [
20]. An increase in the efficiency of these cycles could be achieved by implementing improvements in the plant’s thermal scheme, such as steam reheating and regenerative heating of condensate [
21]. All these improvements require a technical-economic analysis to compare the additional investment needed with the profit obtained due to increased efficiency [
22]. The conventional Rankine cycle has been used in several industries, such as sugar, rice, palm oil, paper, and wood to produce electricity, but with relatively low efficiency. However, the low fuel price (waste or biomass from processes), the maturity and reliability of this technology, as well as its relatively low investment cost, make this conversion technology an attractive option [
23].
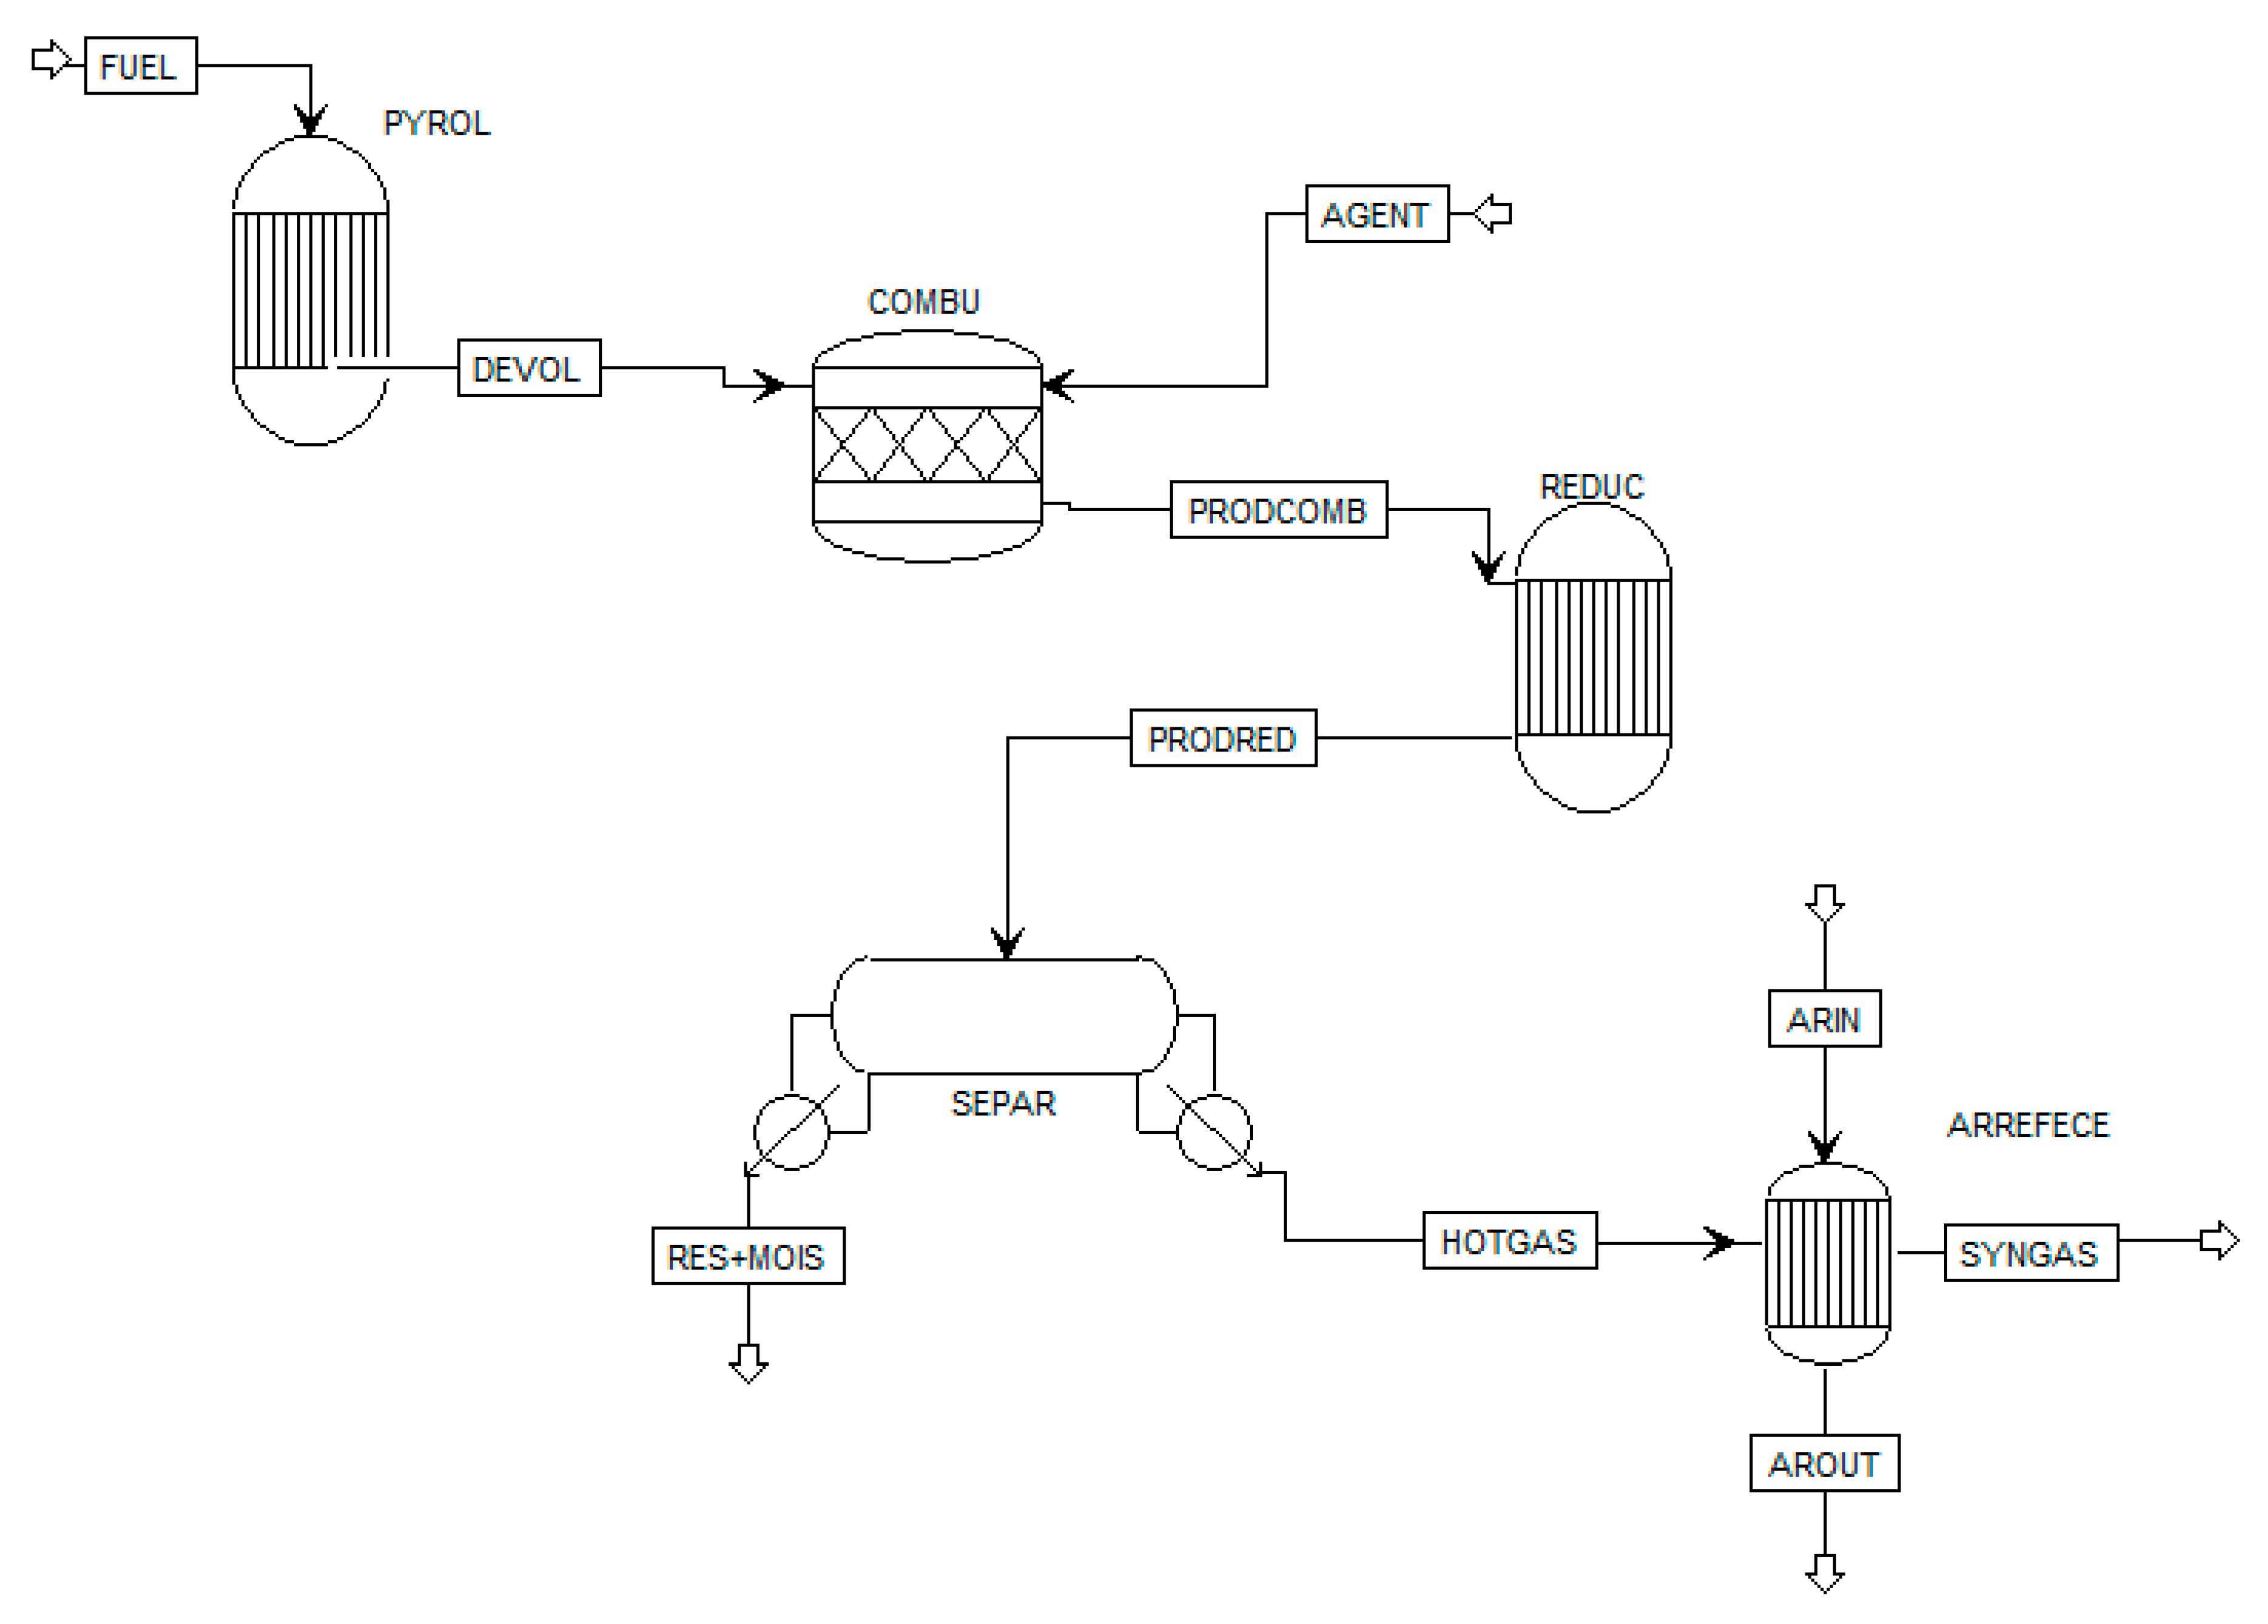
Based on the previous discussion, this paper aims to analyze heavy oil and biomass co-gasification as an alternative for treating these low-values fuels and obtaining co-products such as electricity. For this purpose, a gasification model was developed in Aspen Plus™ software, considering the use of two gasification agents (air and oxygen). Gasification parameters, such as yield, lower heating value (LHV), and composition of producer gas, as well as cold gas efficiency, were evaluated. An analysis of producer gas use in a Rankine cycle was performed using GateCycle™ software, which includes the electricity generation index and boiler performance (boiler efficiency and specific steam production). Furthermore, economic indicators (such as net present value, internal return rate, among others) from the integrated gasification-Rankine cycle system were calculated, aimed at determining the feasibility of the power generation system in the Brazilian context. The economic assessment was developed by using Monte Carlo simulation through Crystal ball™. Thus, this work provides an energy performance and an economic evaluation of the heavy oil and biomass co-gasification process and the potential use of syngas for power generation. It is worth noting that the reviewed literature presents no studies related to energy recovery and its economic assessment from the co-treatment of heavy oil and biomass, which emphasizes the novelty of the current contribution.
4. Conclusions
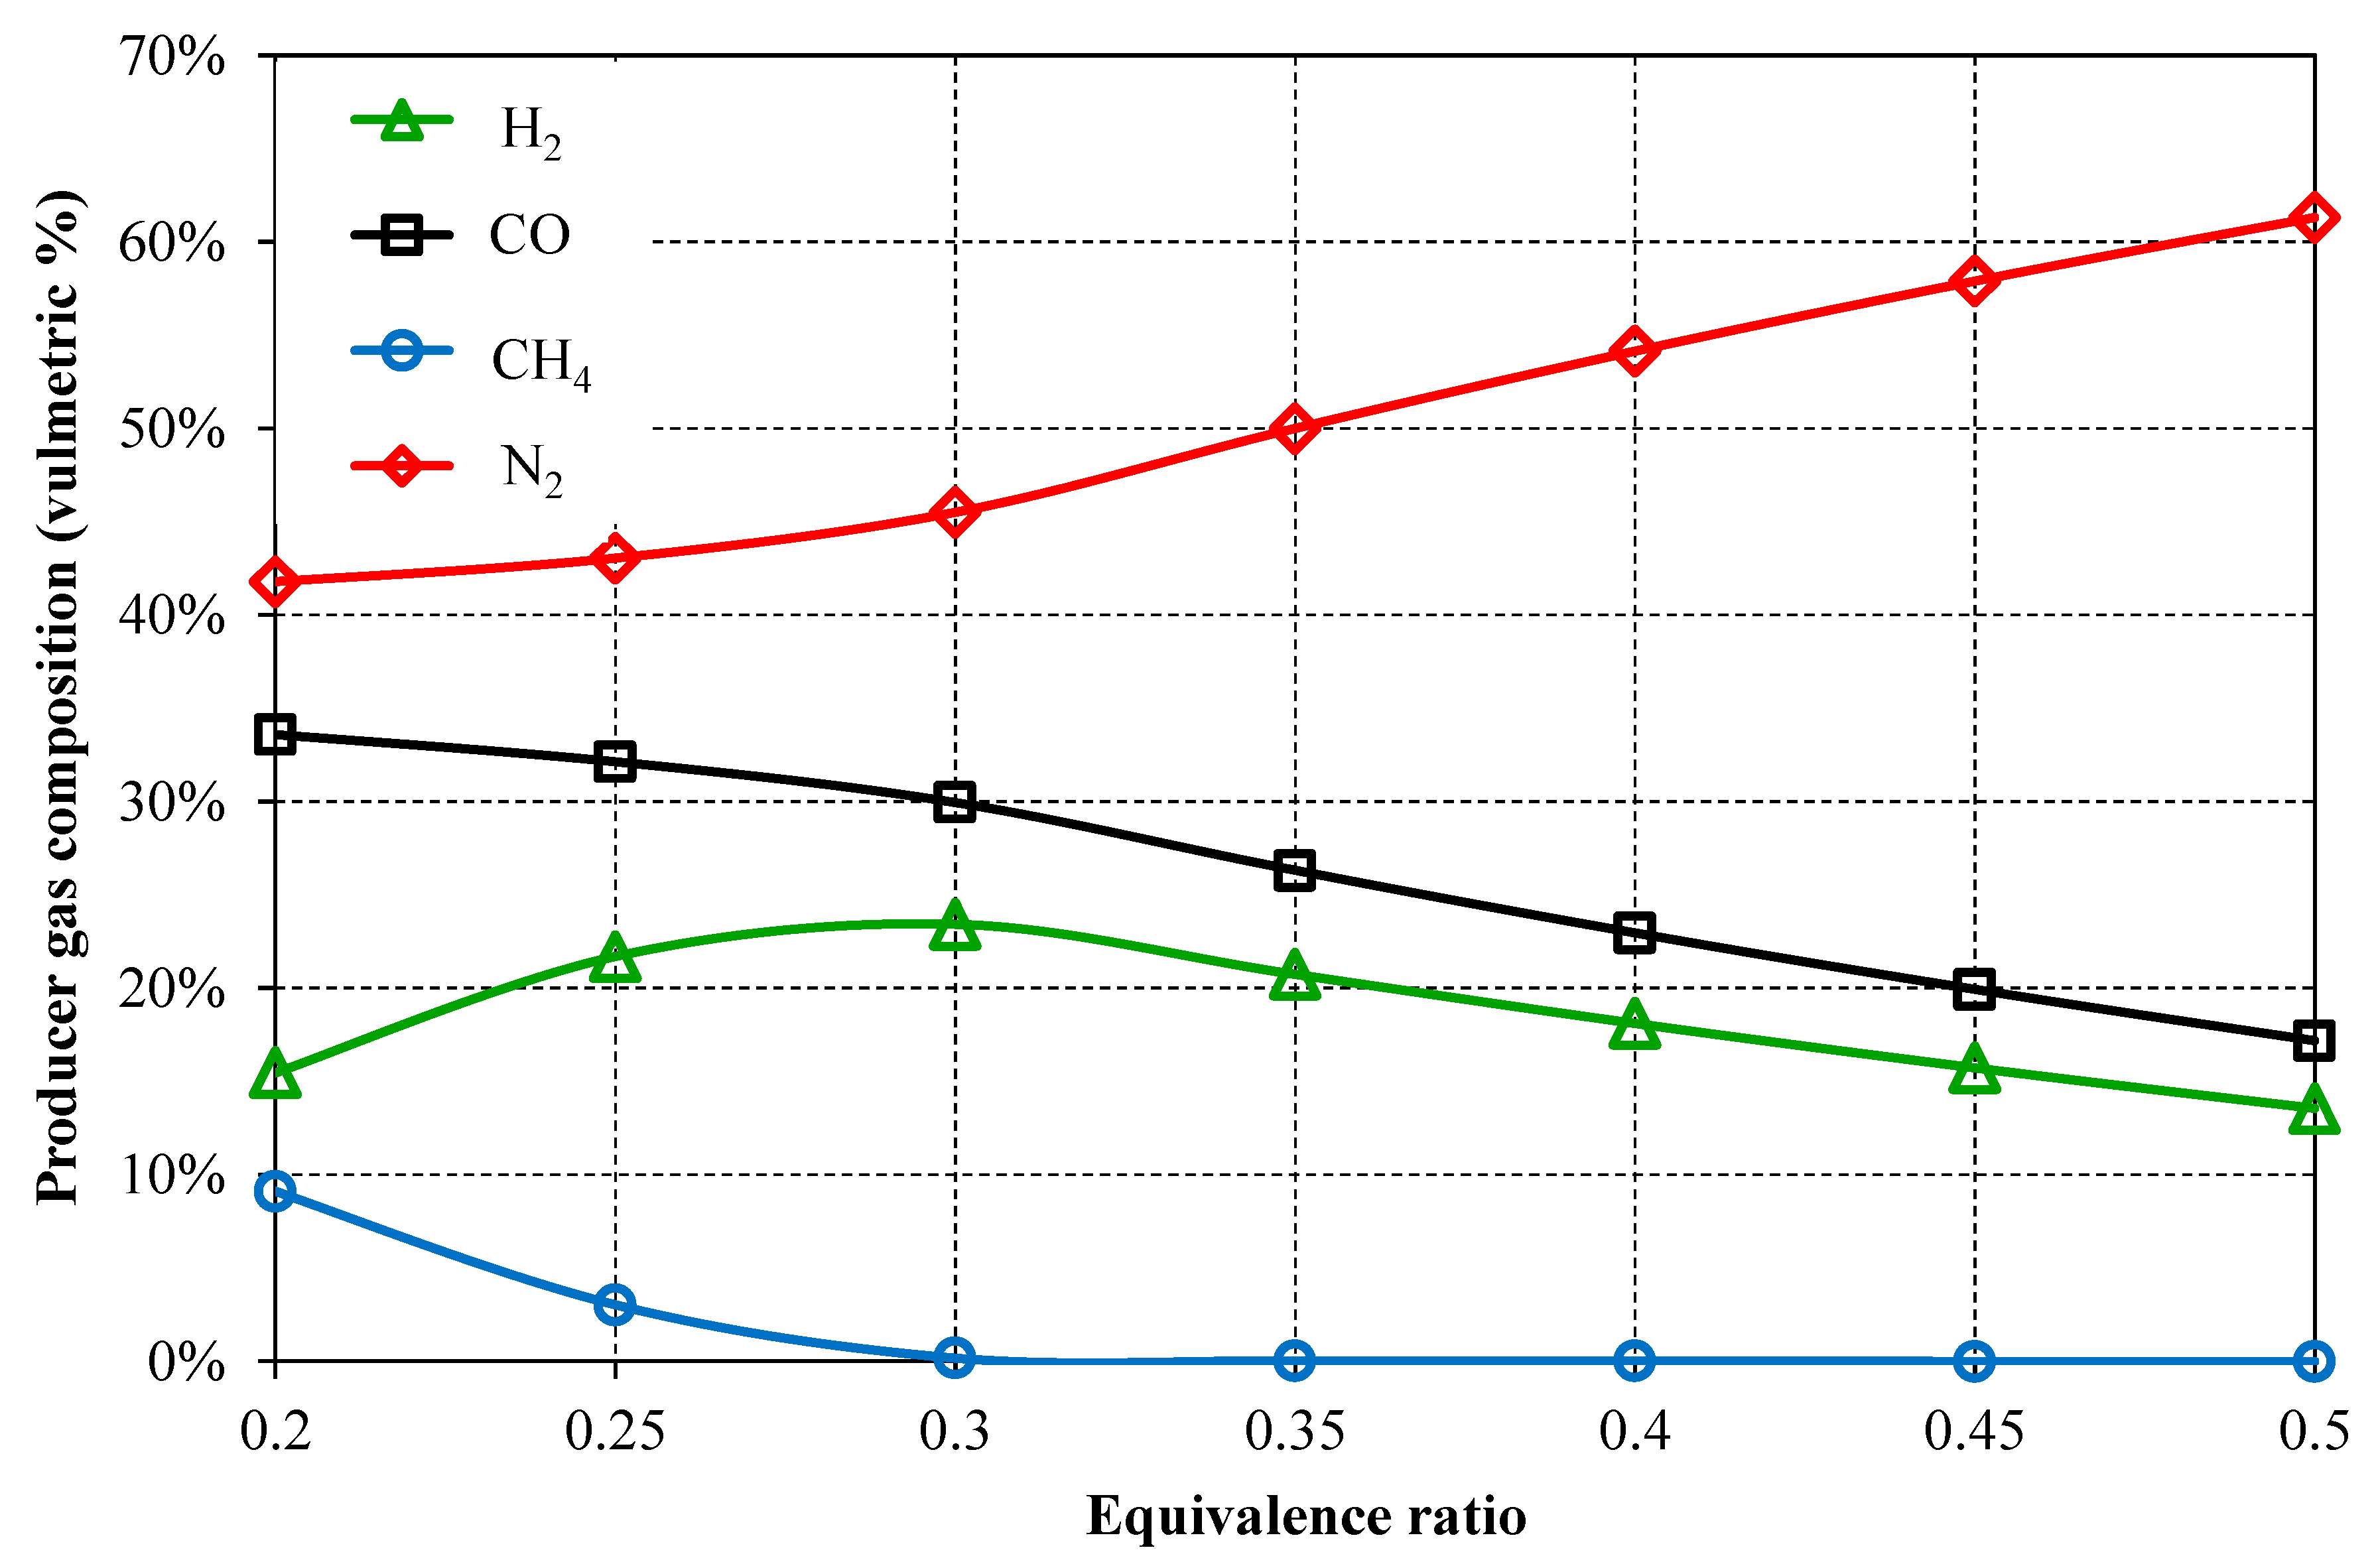
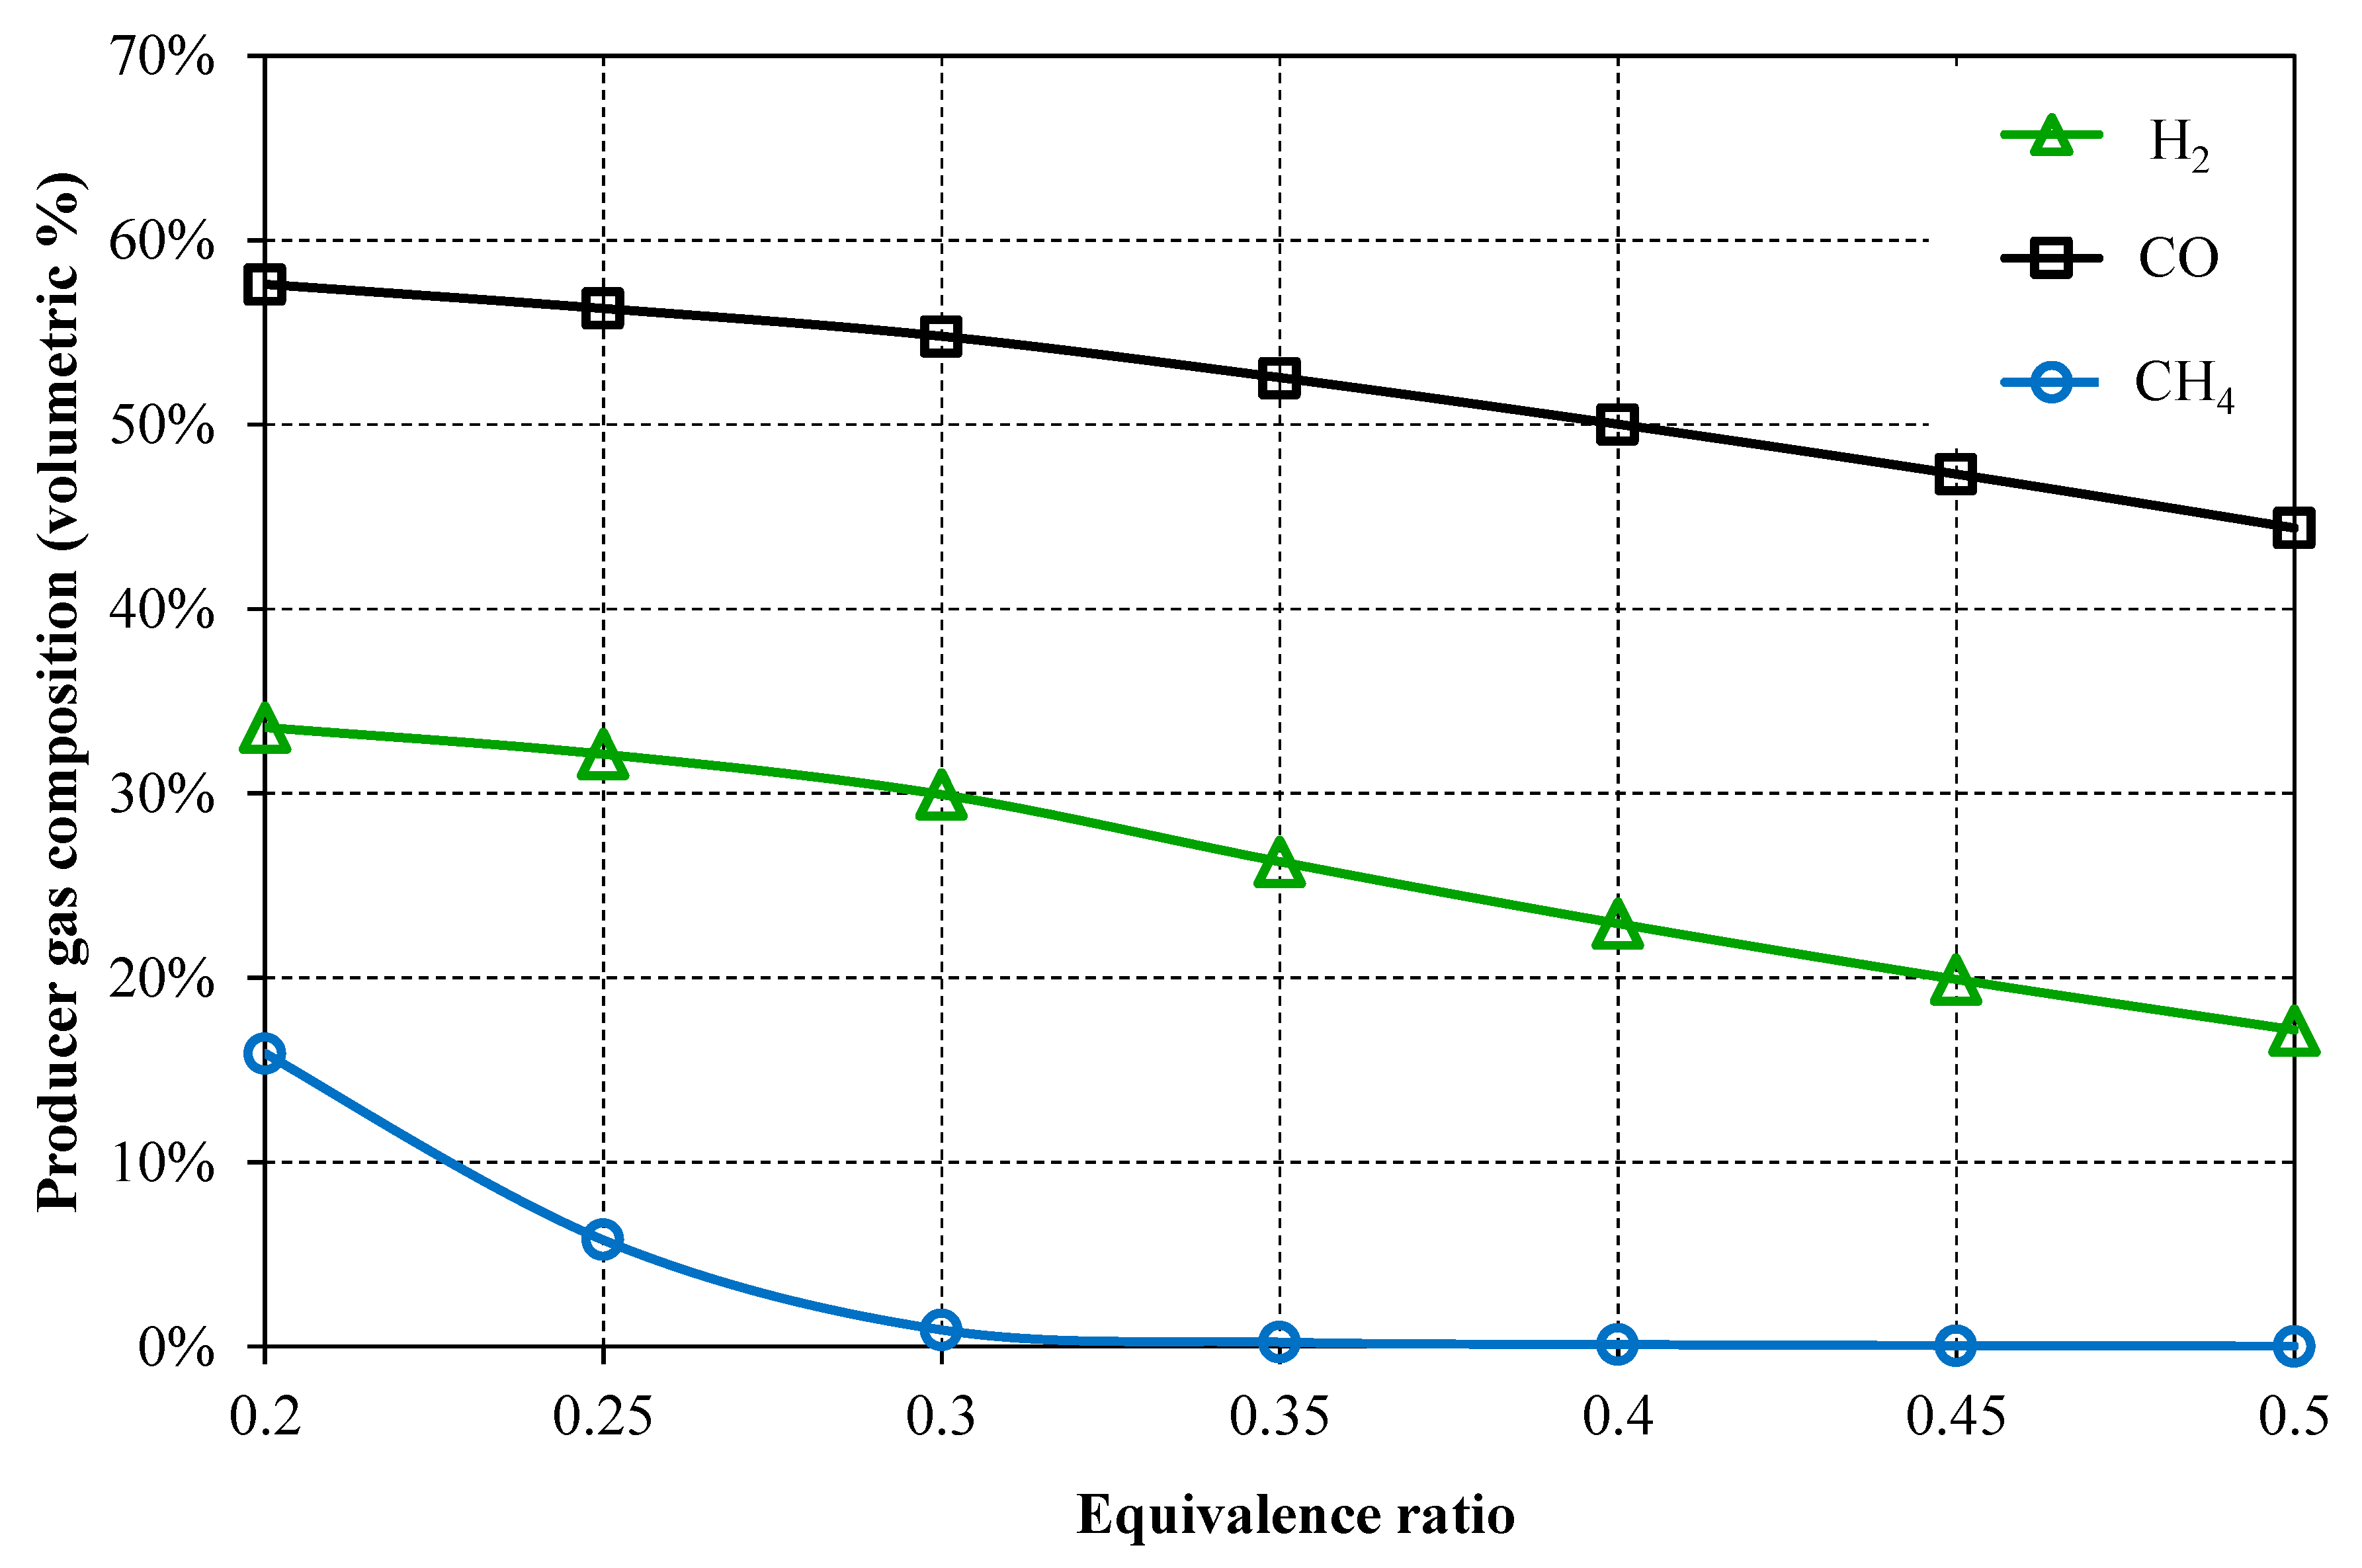
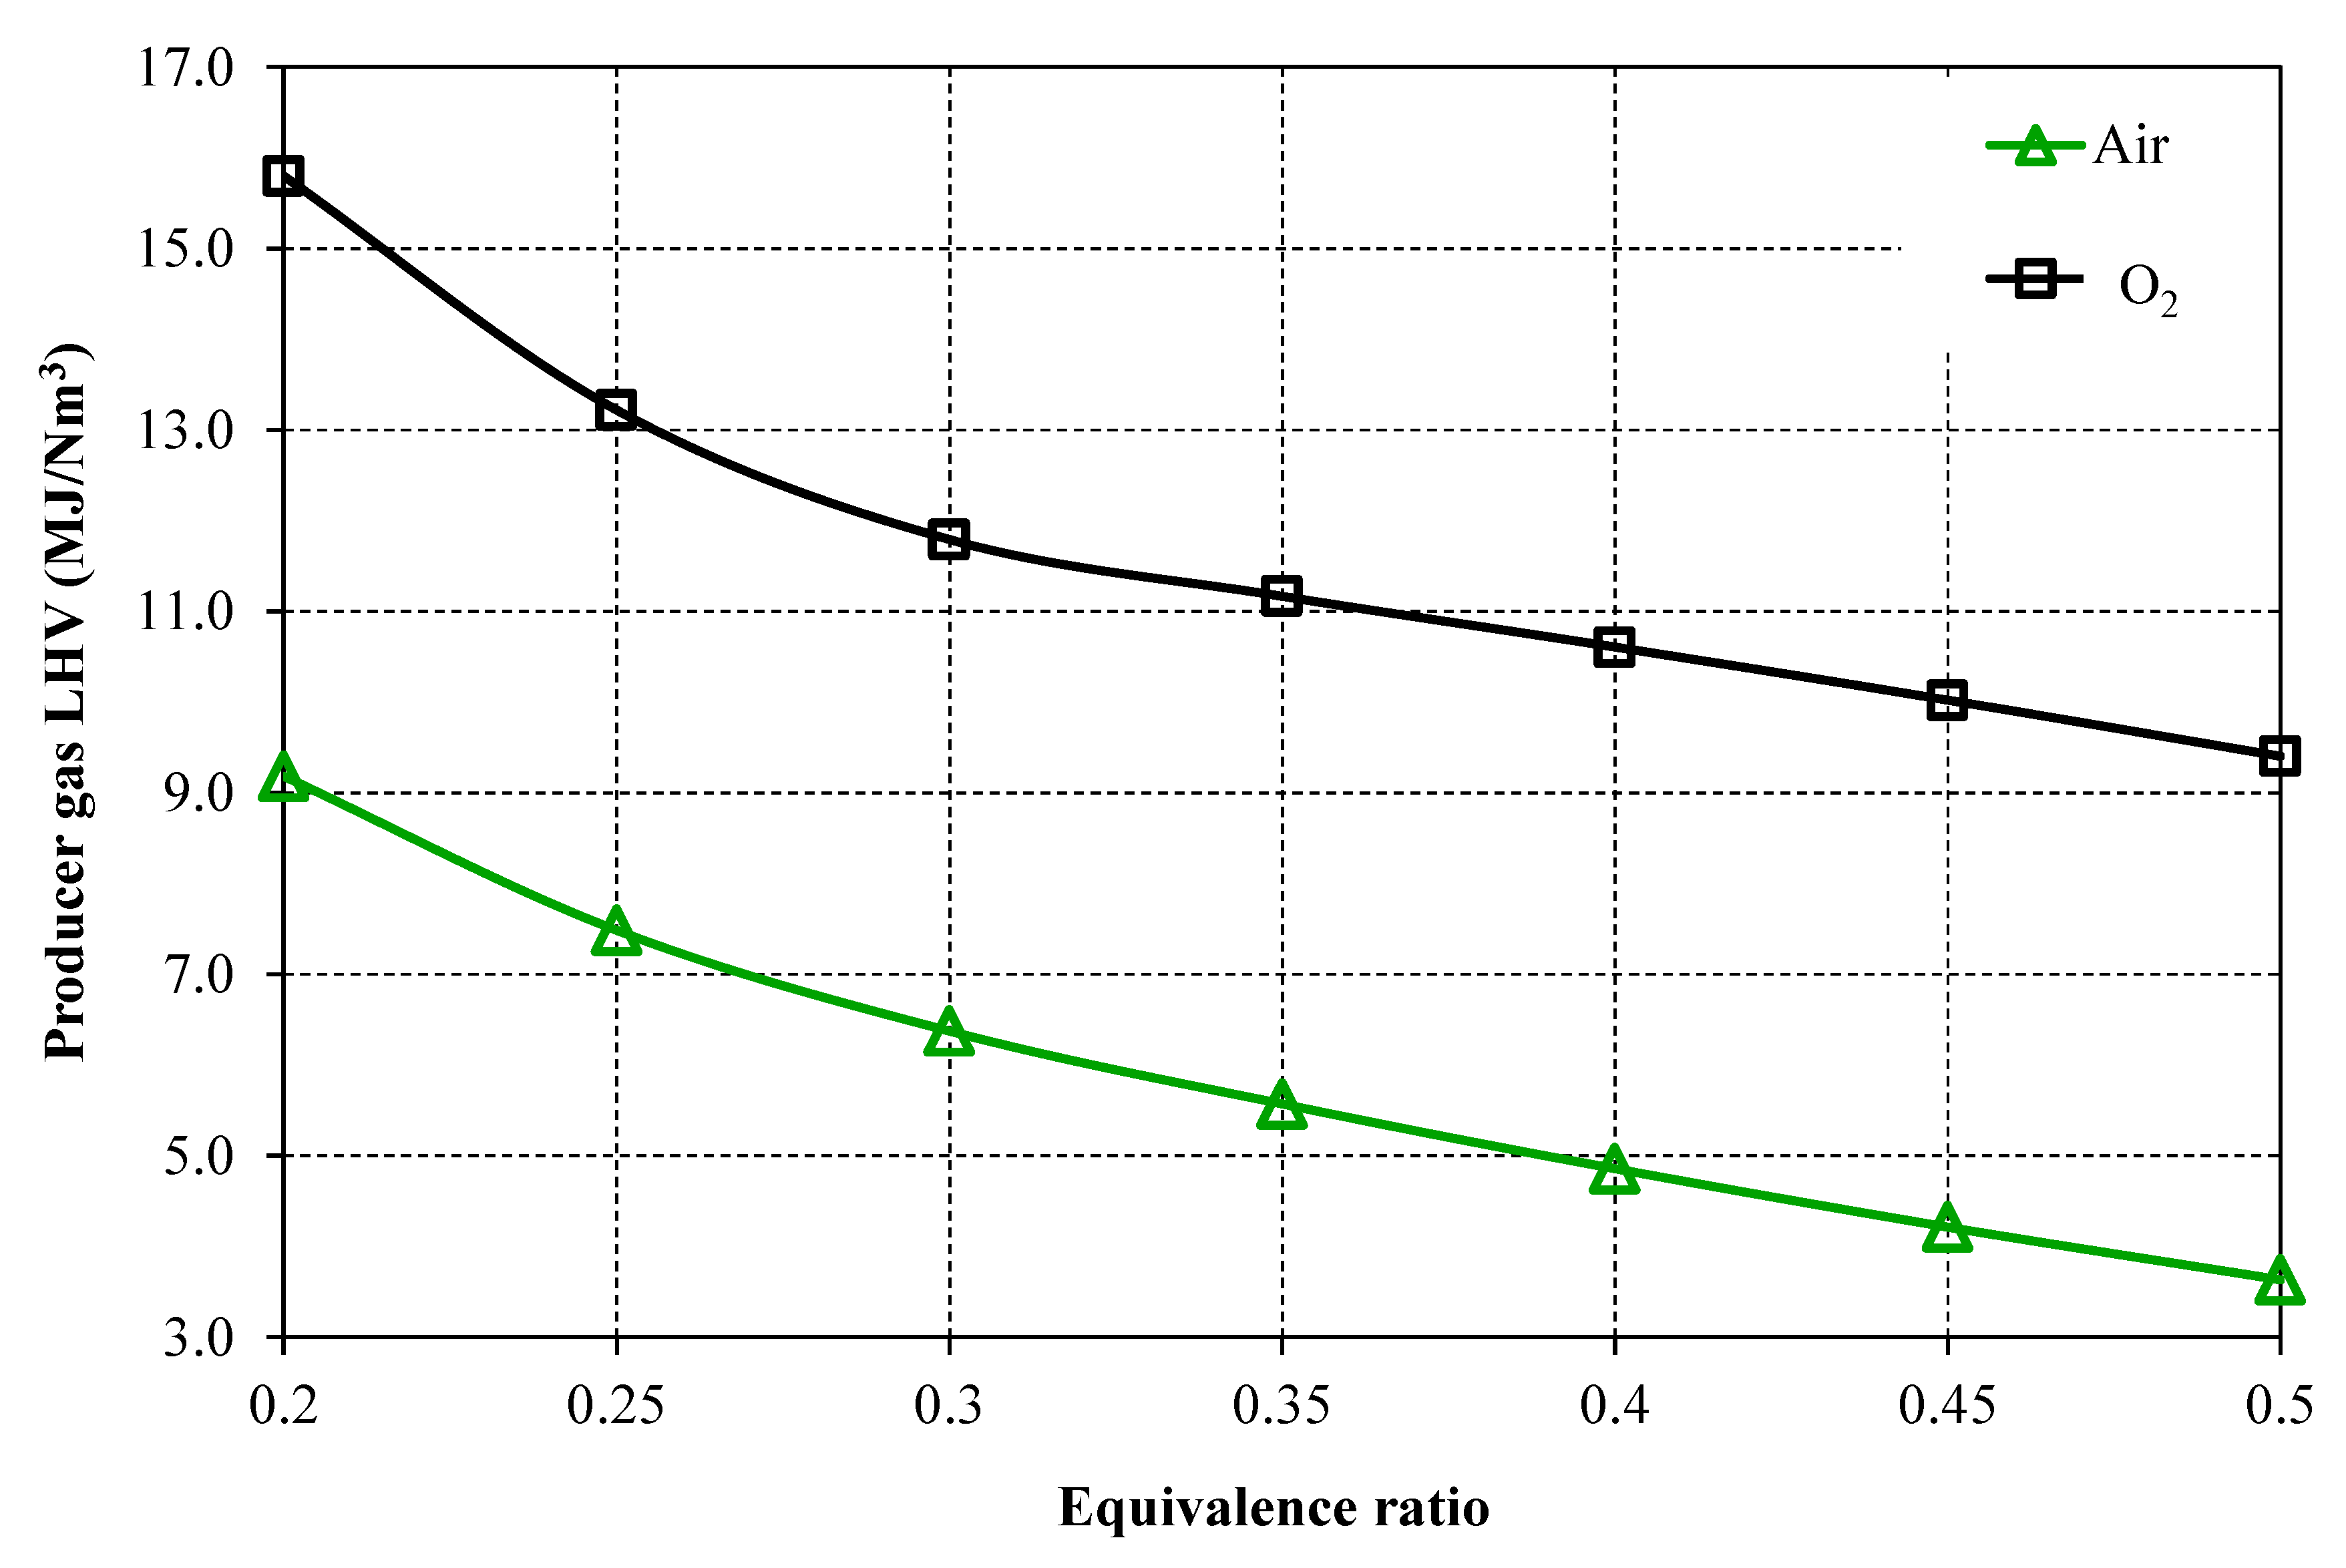
An energetic and economic assessment of electricity generation through a gasification system coupled to a Rankine cycle was carried out, considering that the gasifier was fed with heavy oil and biomass in a proportion of 50%/50%, using air and oxygen as gasifying agents. The results indicated that the use of air as a gasifying agent leads to a decrease in the syngas LHV (from 6.37 and 3.63 MJ/Nm3) as the ER increases from 0.3 to 0.5 and a volumetric concentration of H2 (23.7%) for ER = 0.3, while a reduction in methane concentration (from 9.1% to 3.0%) was observed. In the oxygen co-gasification scenario, increasing trends were obtained for CO and H2 fractions as the ER rose from 0.2 to 0.5, while the syngas LHV decreased from 11.79 to 9.40 MJ/Nm3 as the ER increased from 0.3 to 0.5.
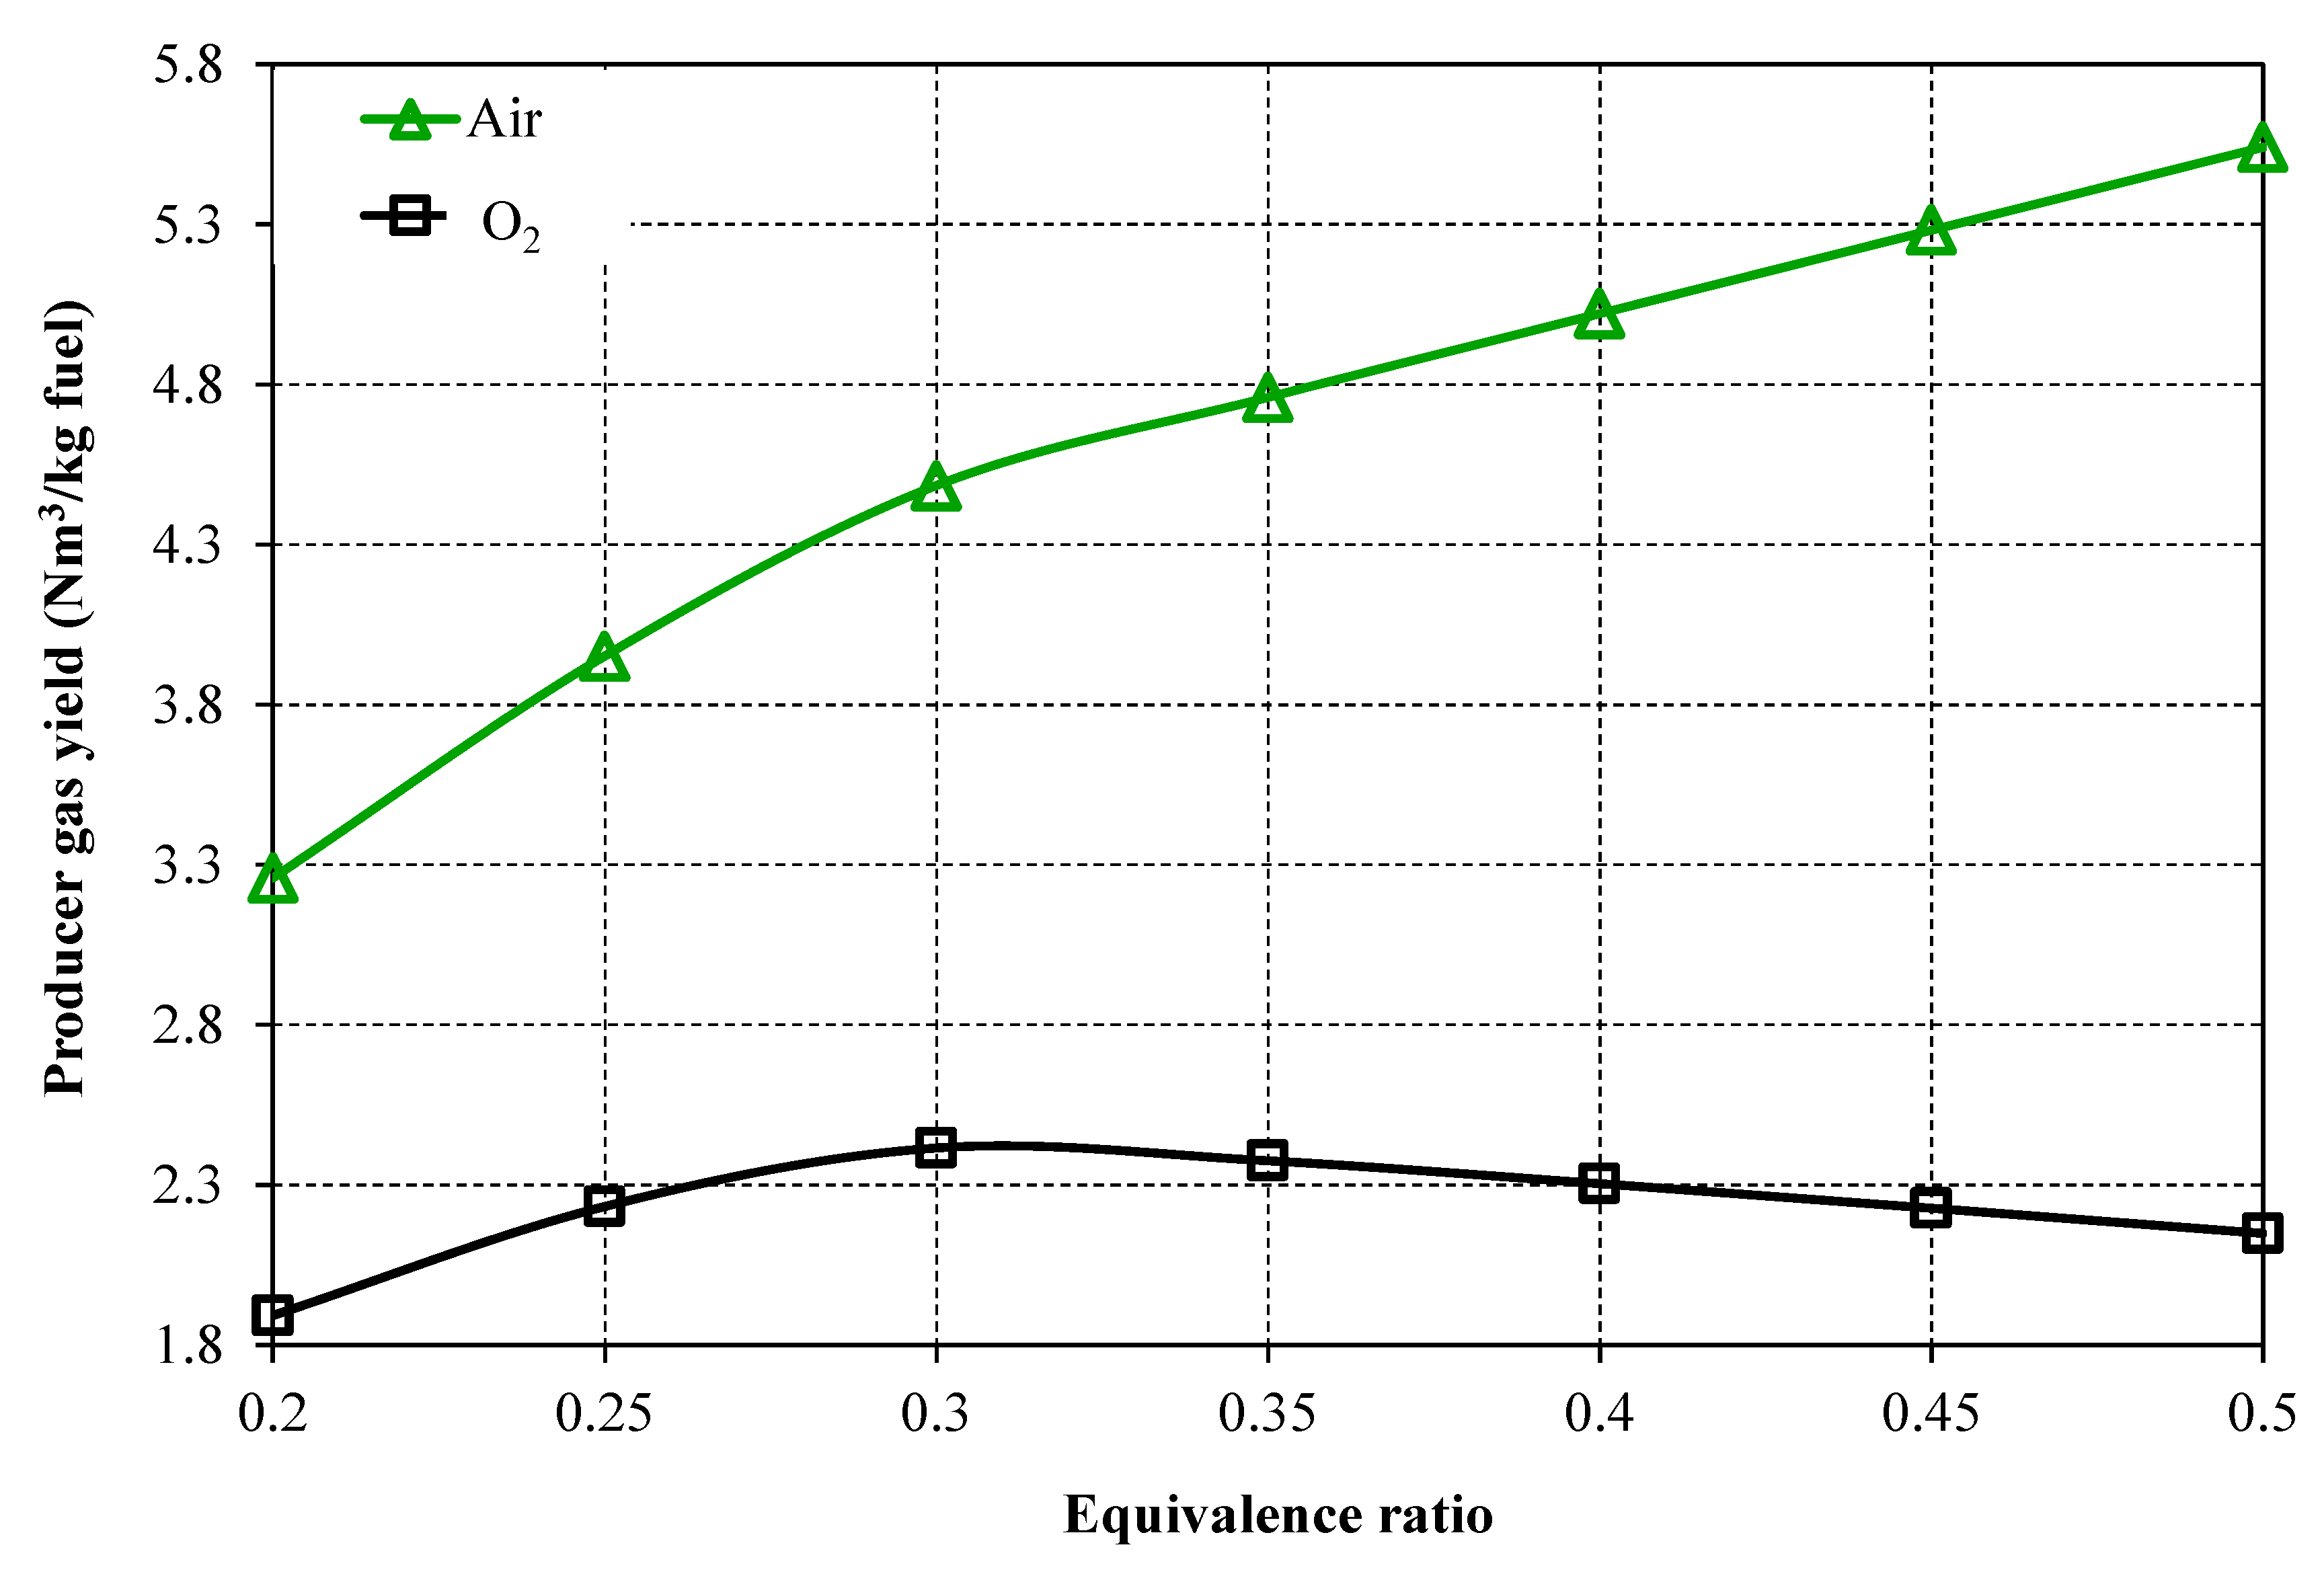
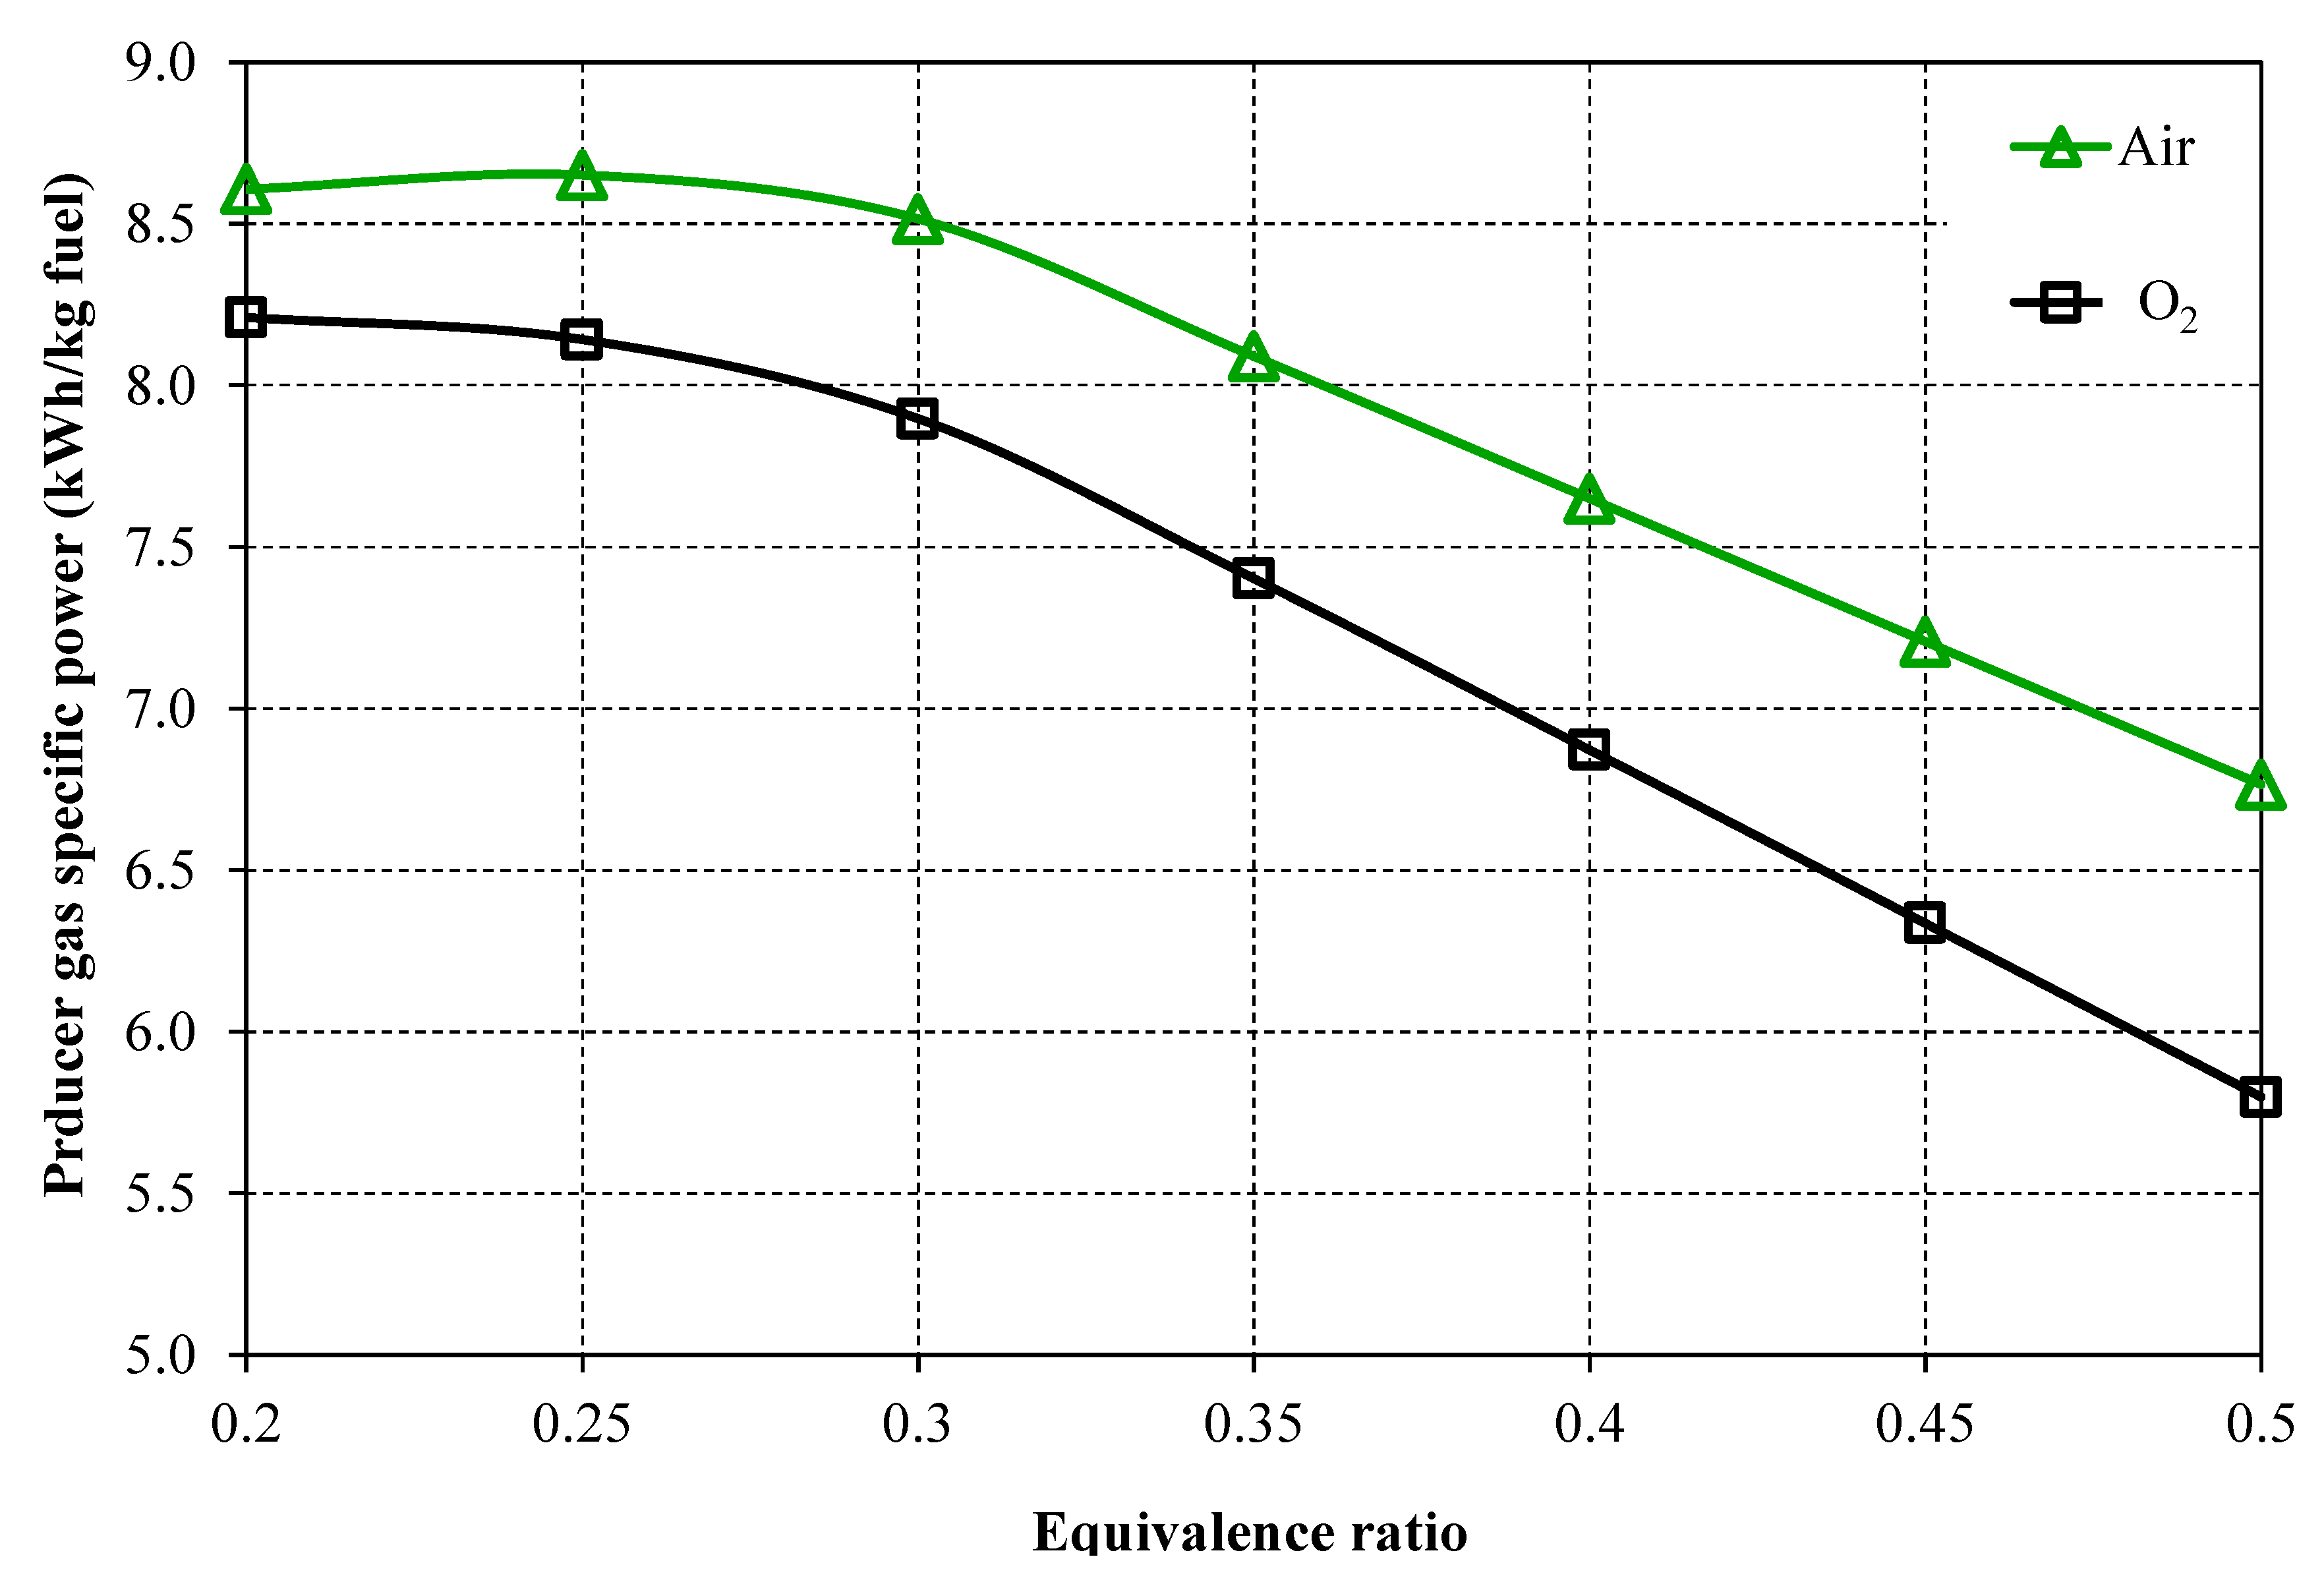
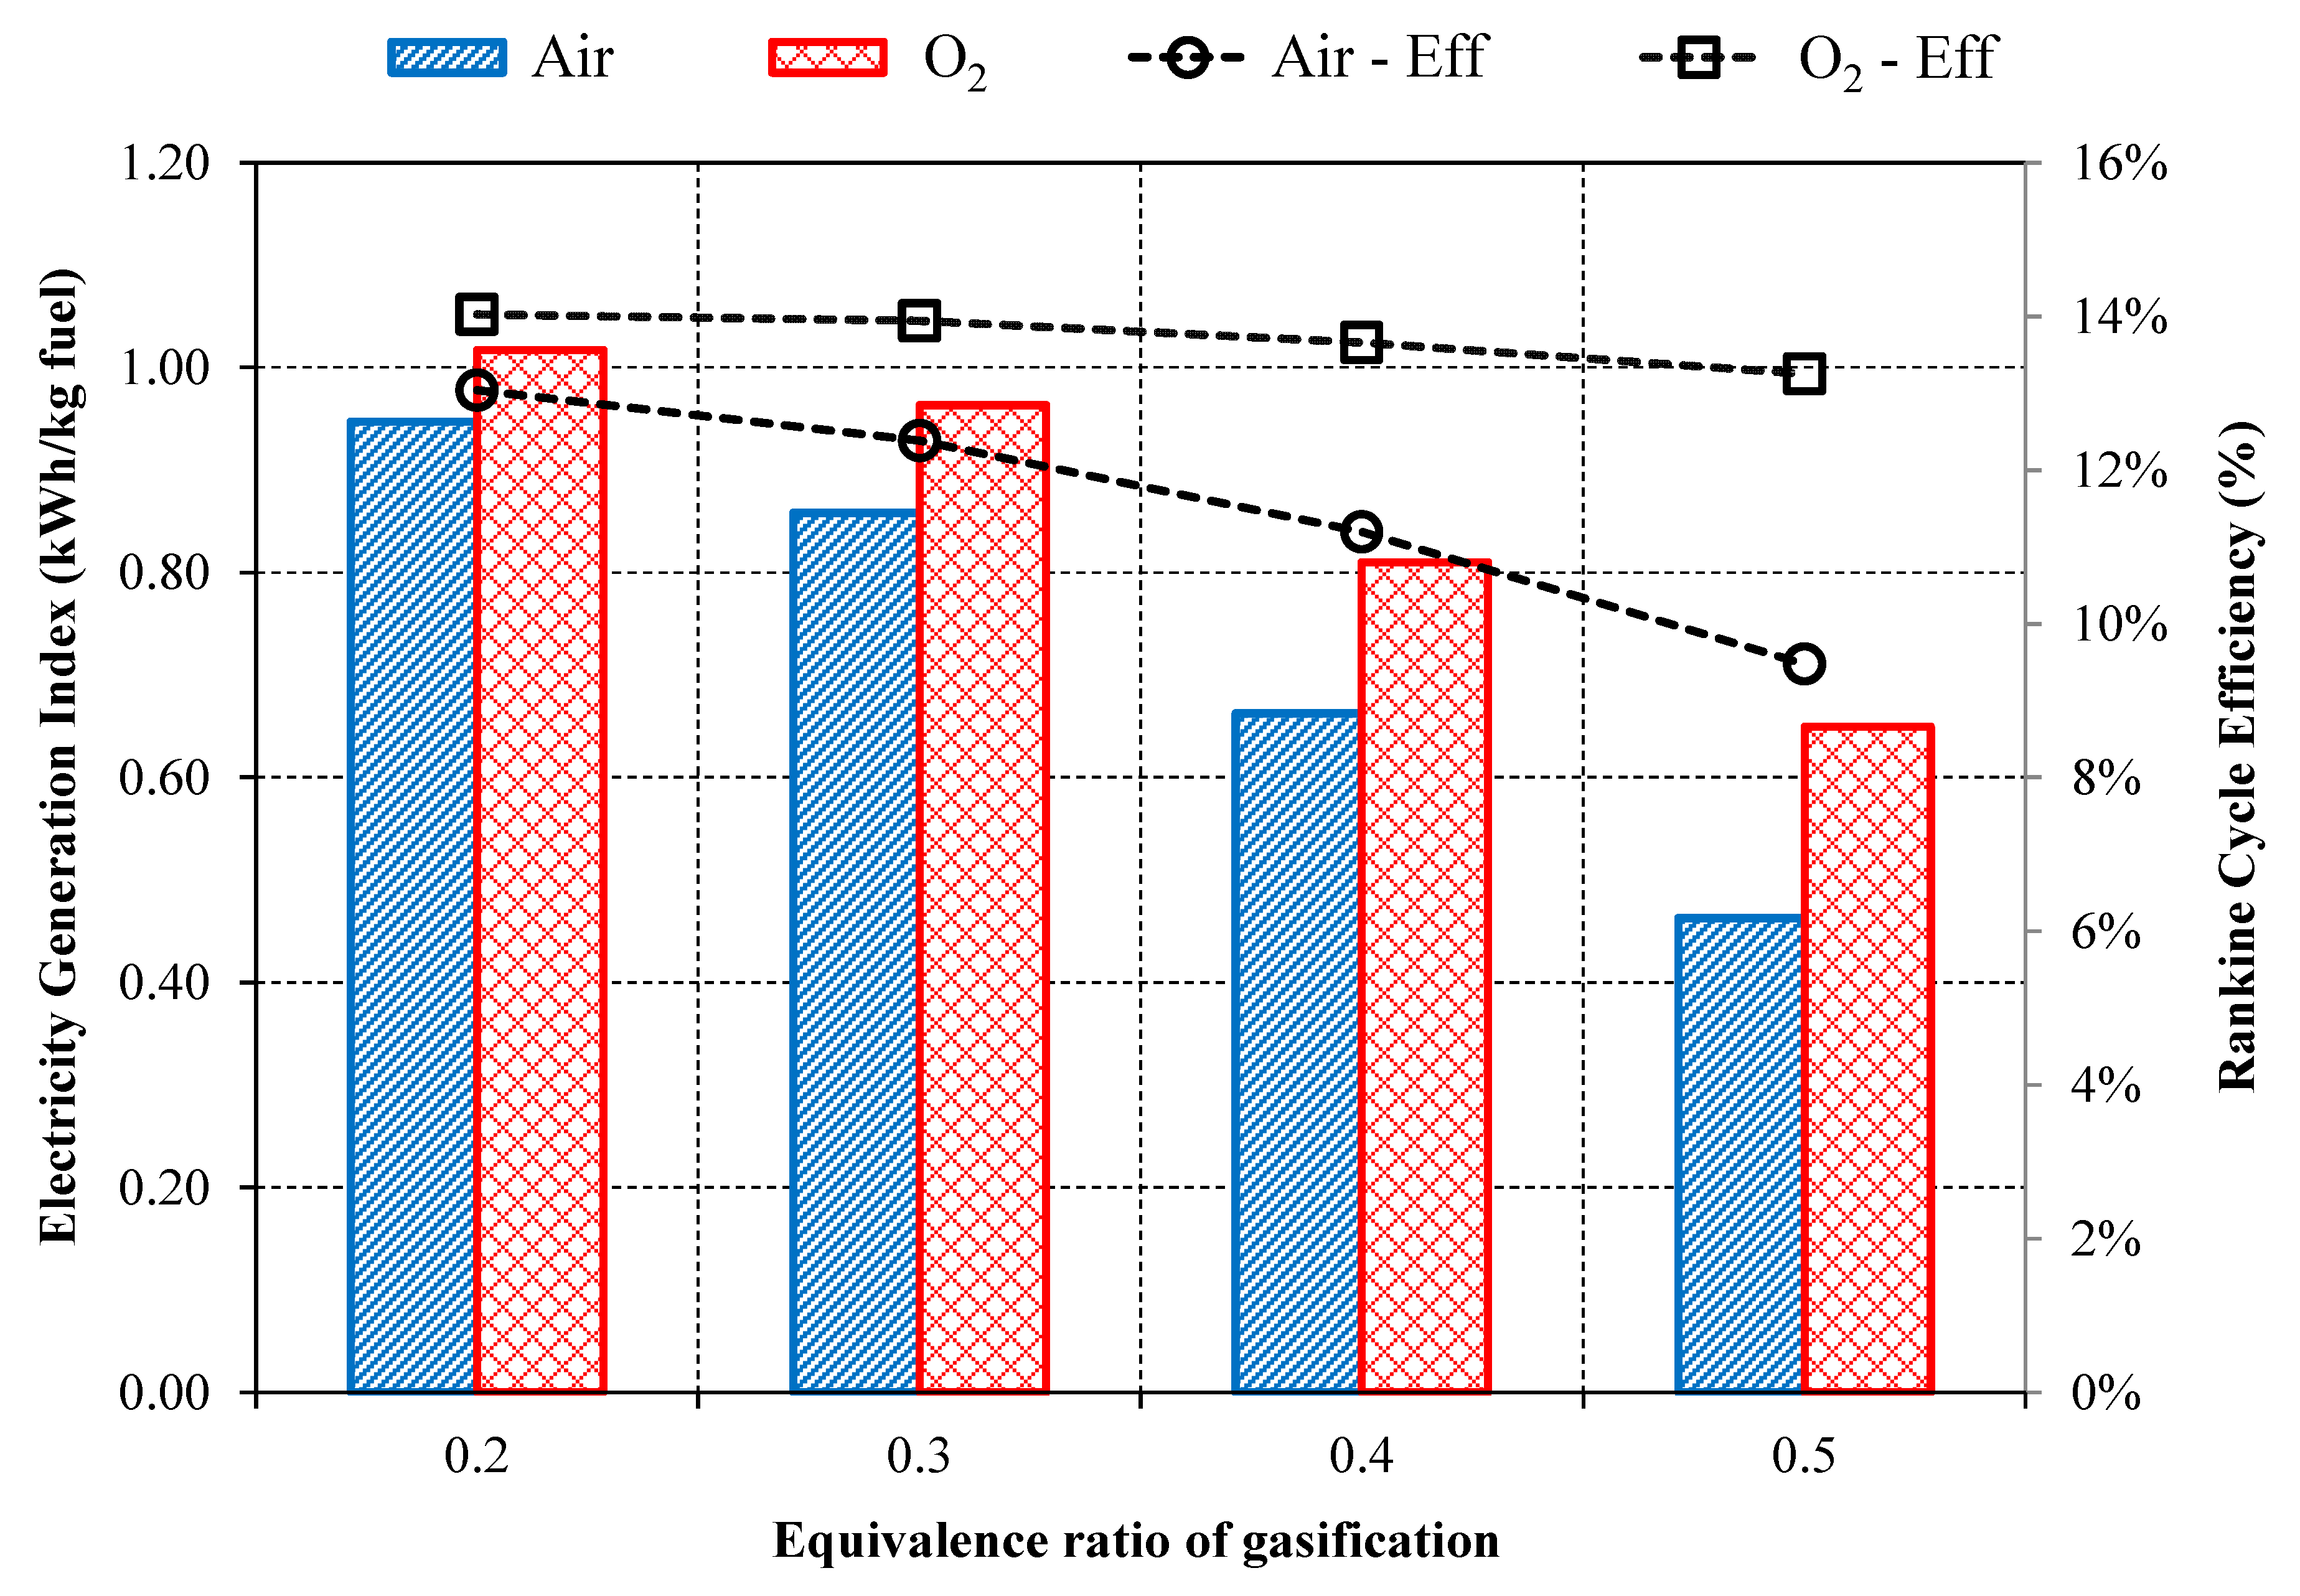
The syngas yield corresponded to 4.48 Nm3/kg-fuel when the air was used (ER = 0.3); thus, it could be appropriate to mention that the syngas yield increased due to the cracking of heavy chemical compounds present in the fuel mixture composition. For co-gasification with oxygen, an inversely proportional relationship was observed between the LHV and the yield of the syngas, in this case, as the LHV increases (0.3 to 0.5 MJ/Nm3), the amount of gas produced decreases (2.4 to 2.2 Nm3/kg). On the other hand, co-gasification with oxygen presented a higher electricity production rate (1.02–0.65 kWh/kg fuel) compared to co-gasification with air (0.95–0.46 kWh/kg fuel) because the syngas produced with oxygen has higher chemical energy associated with LHV.
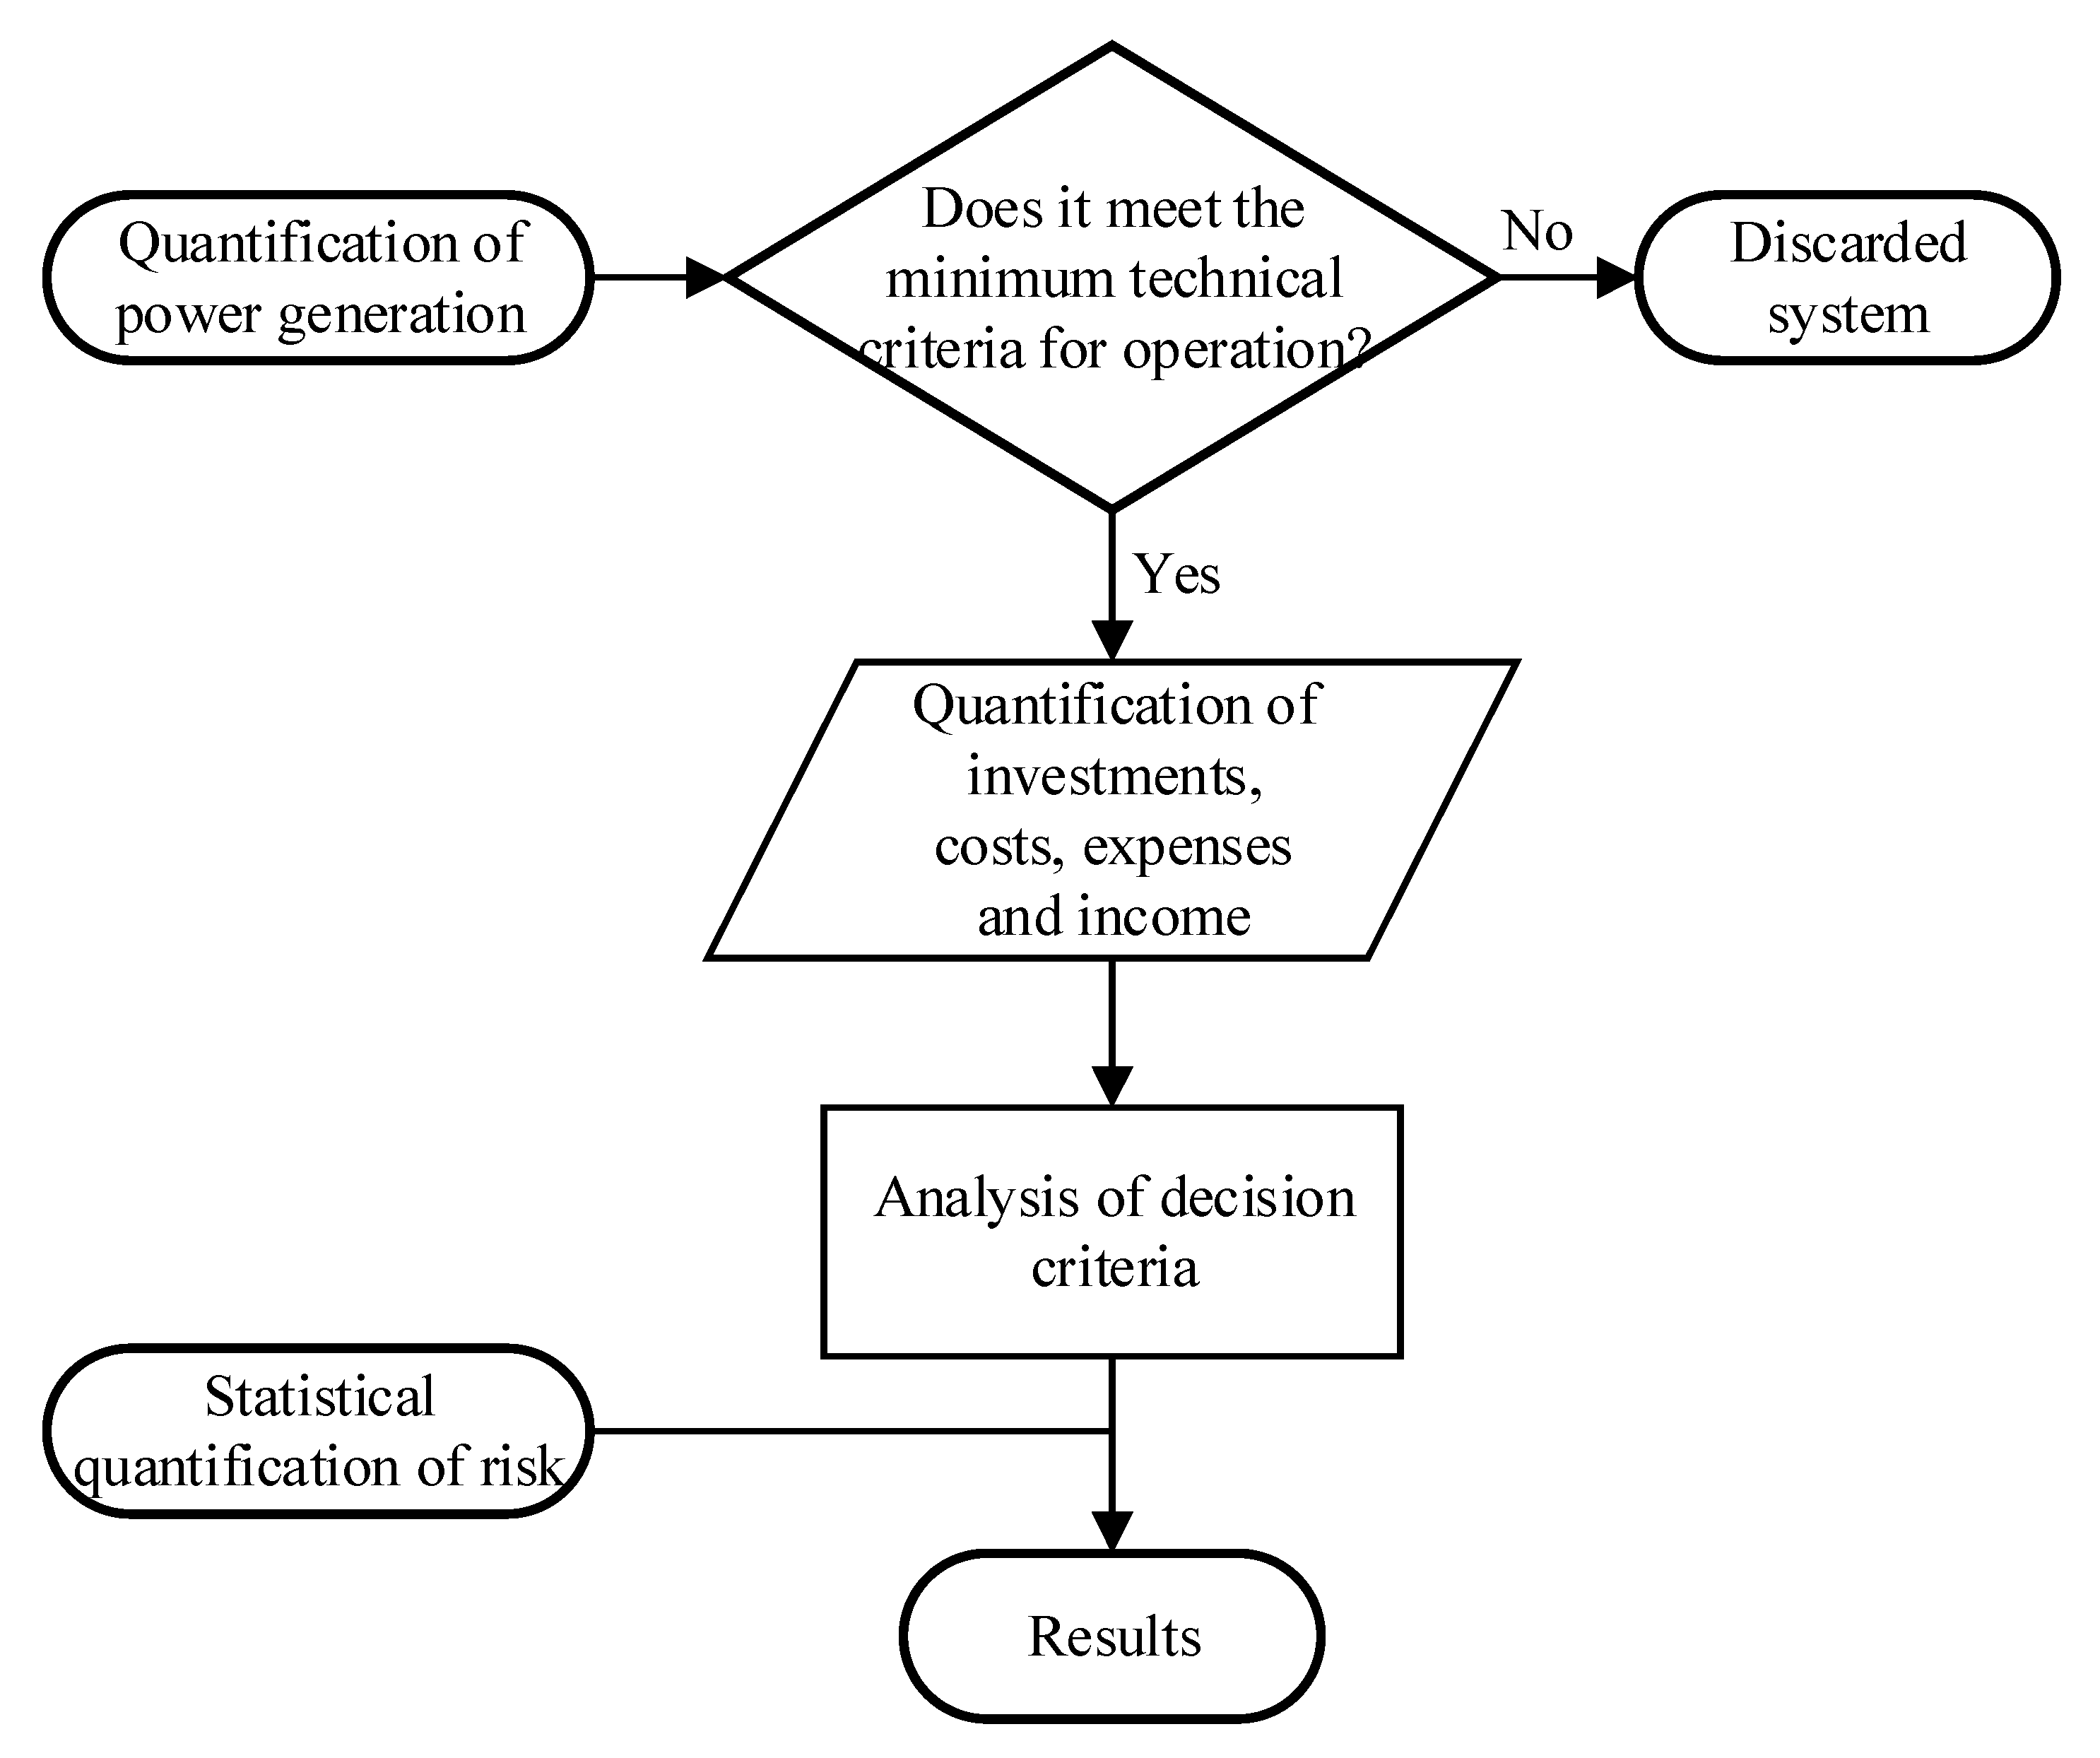
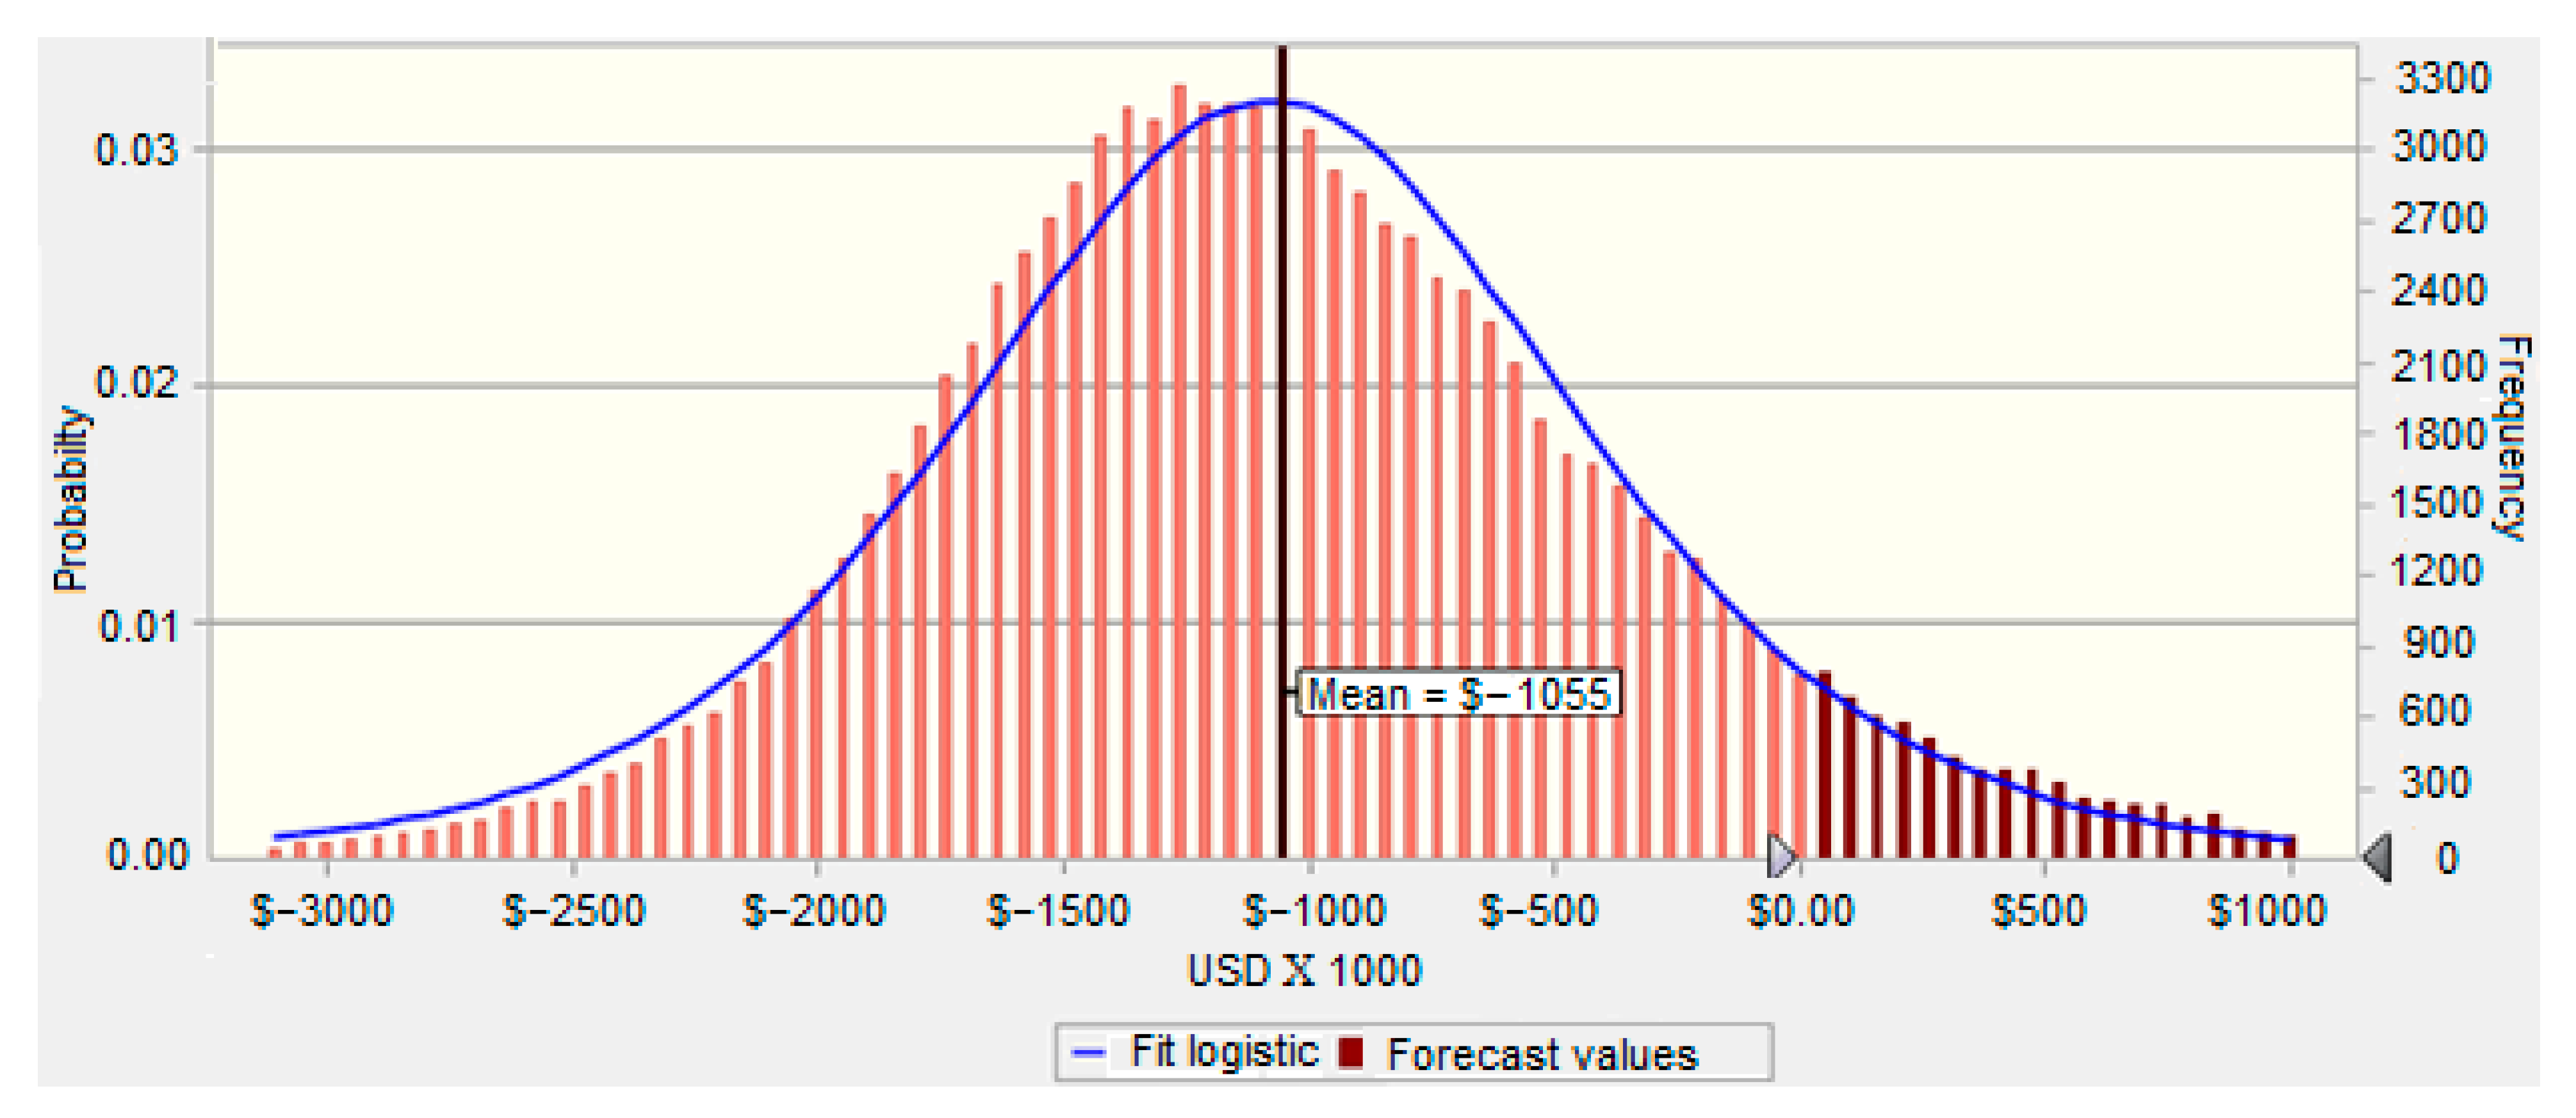
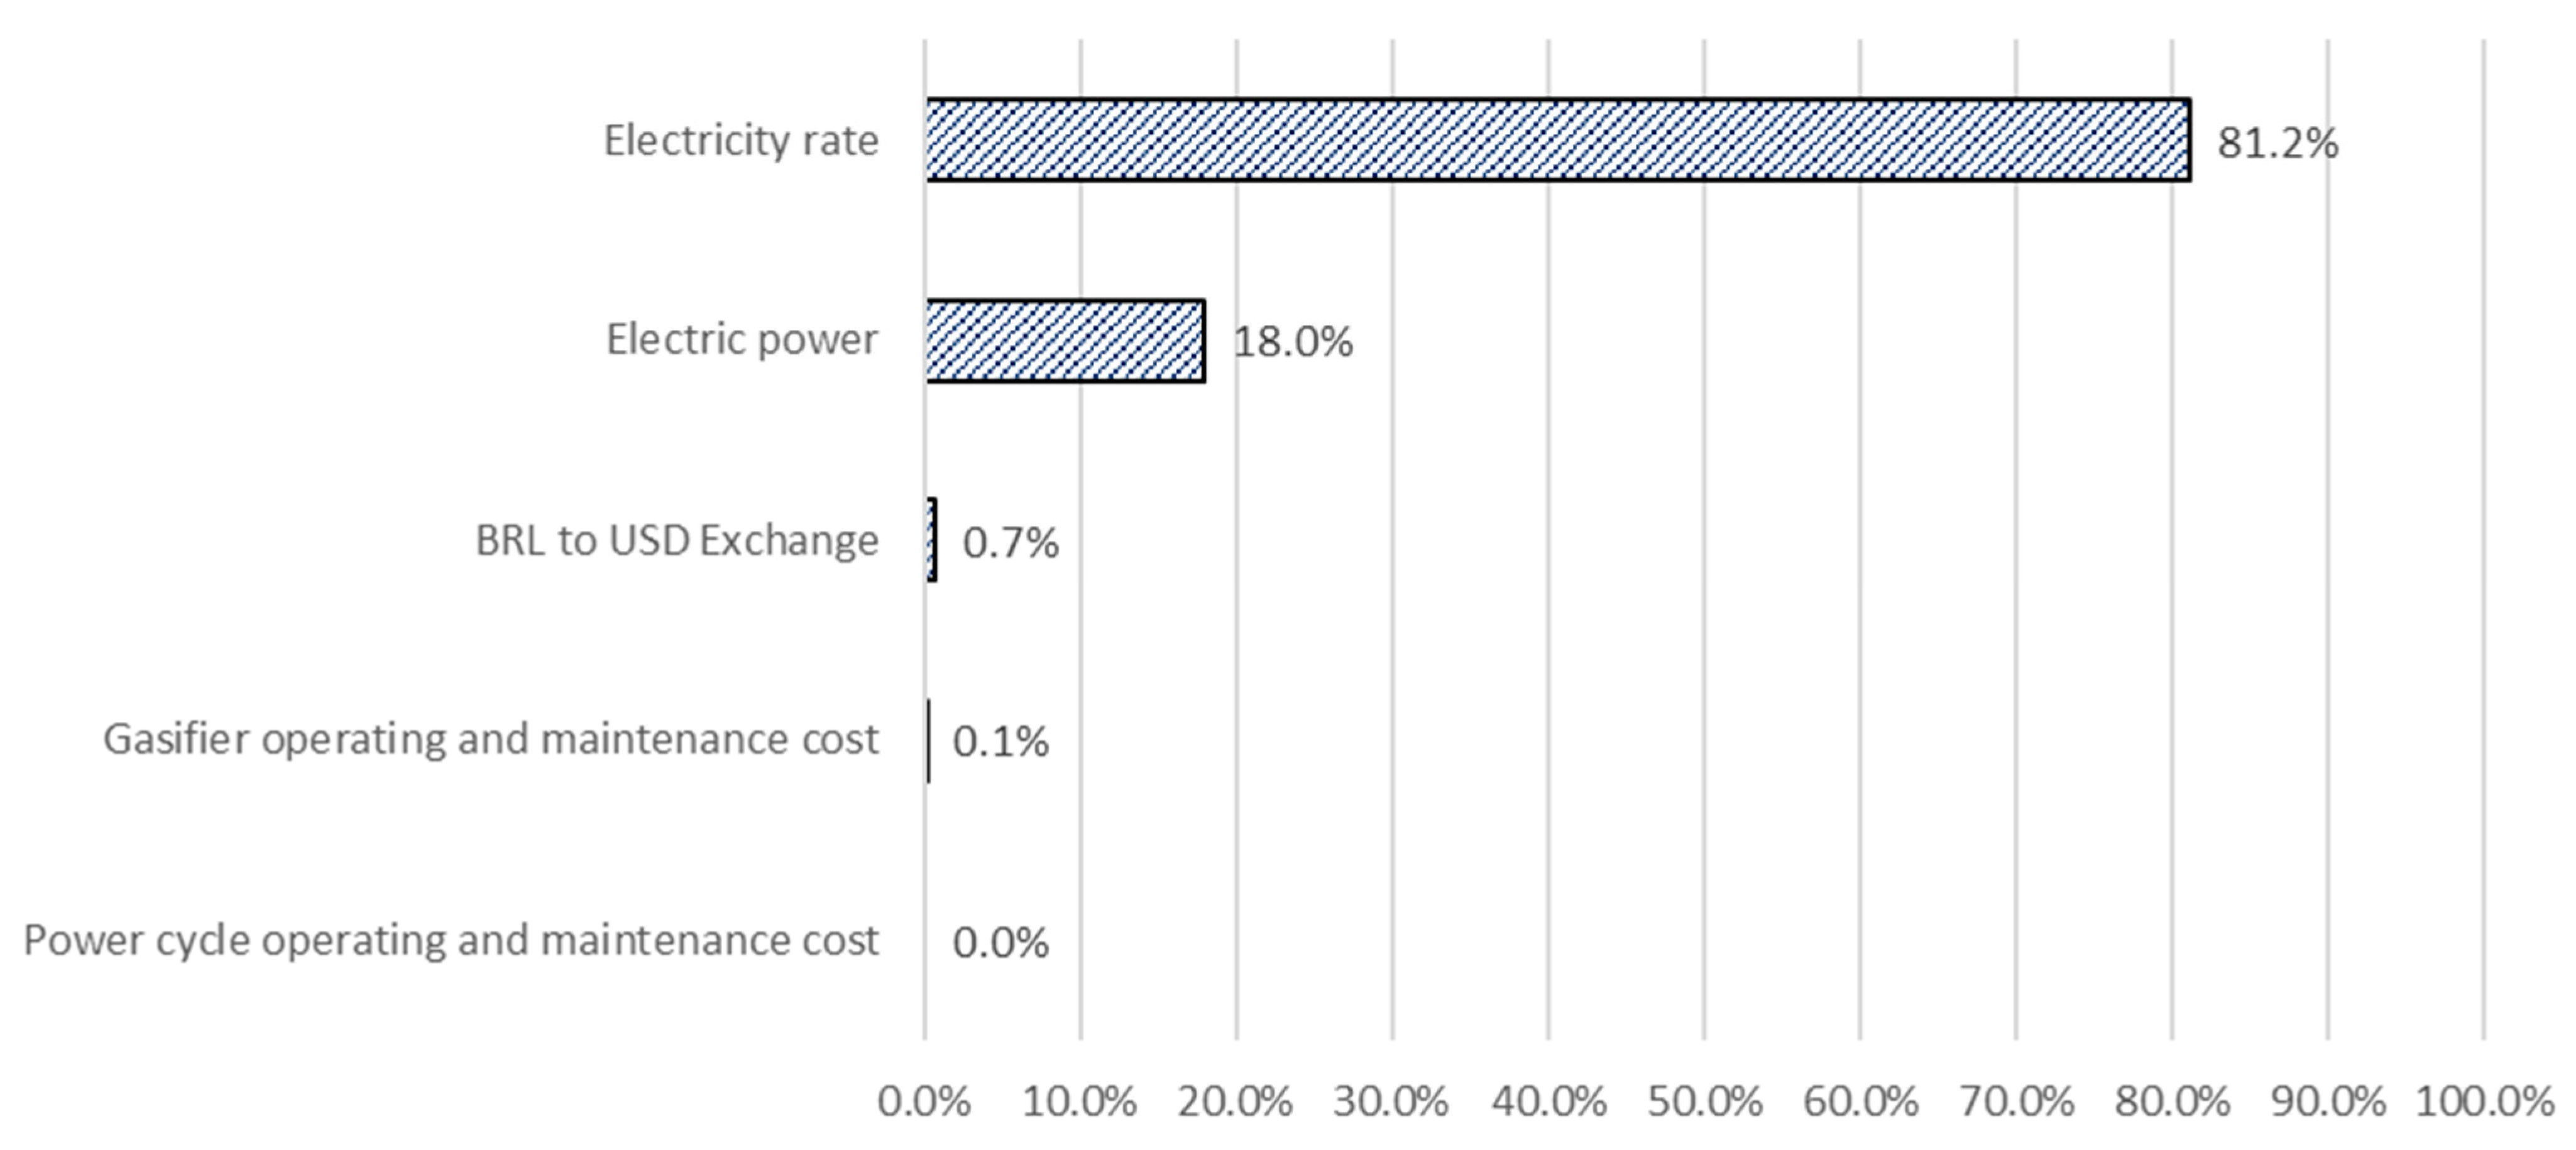
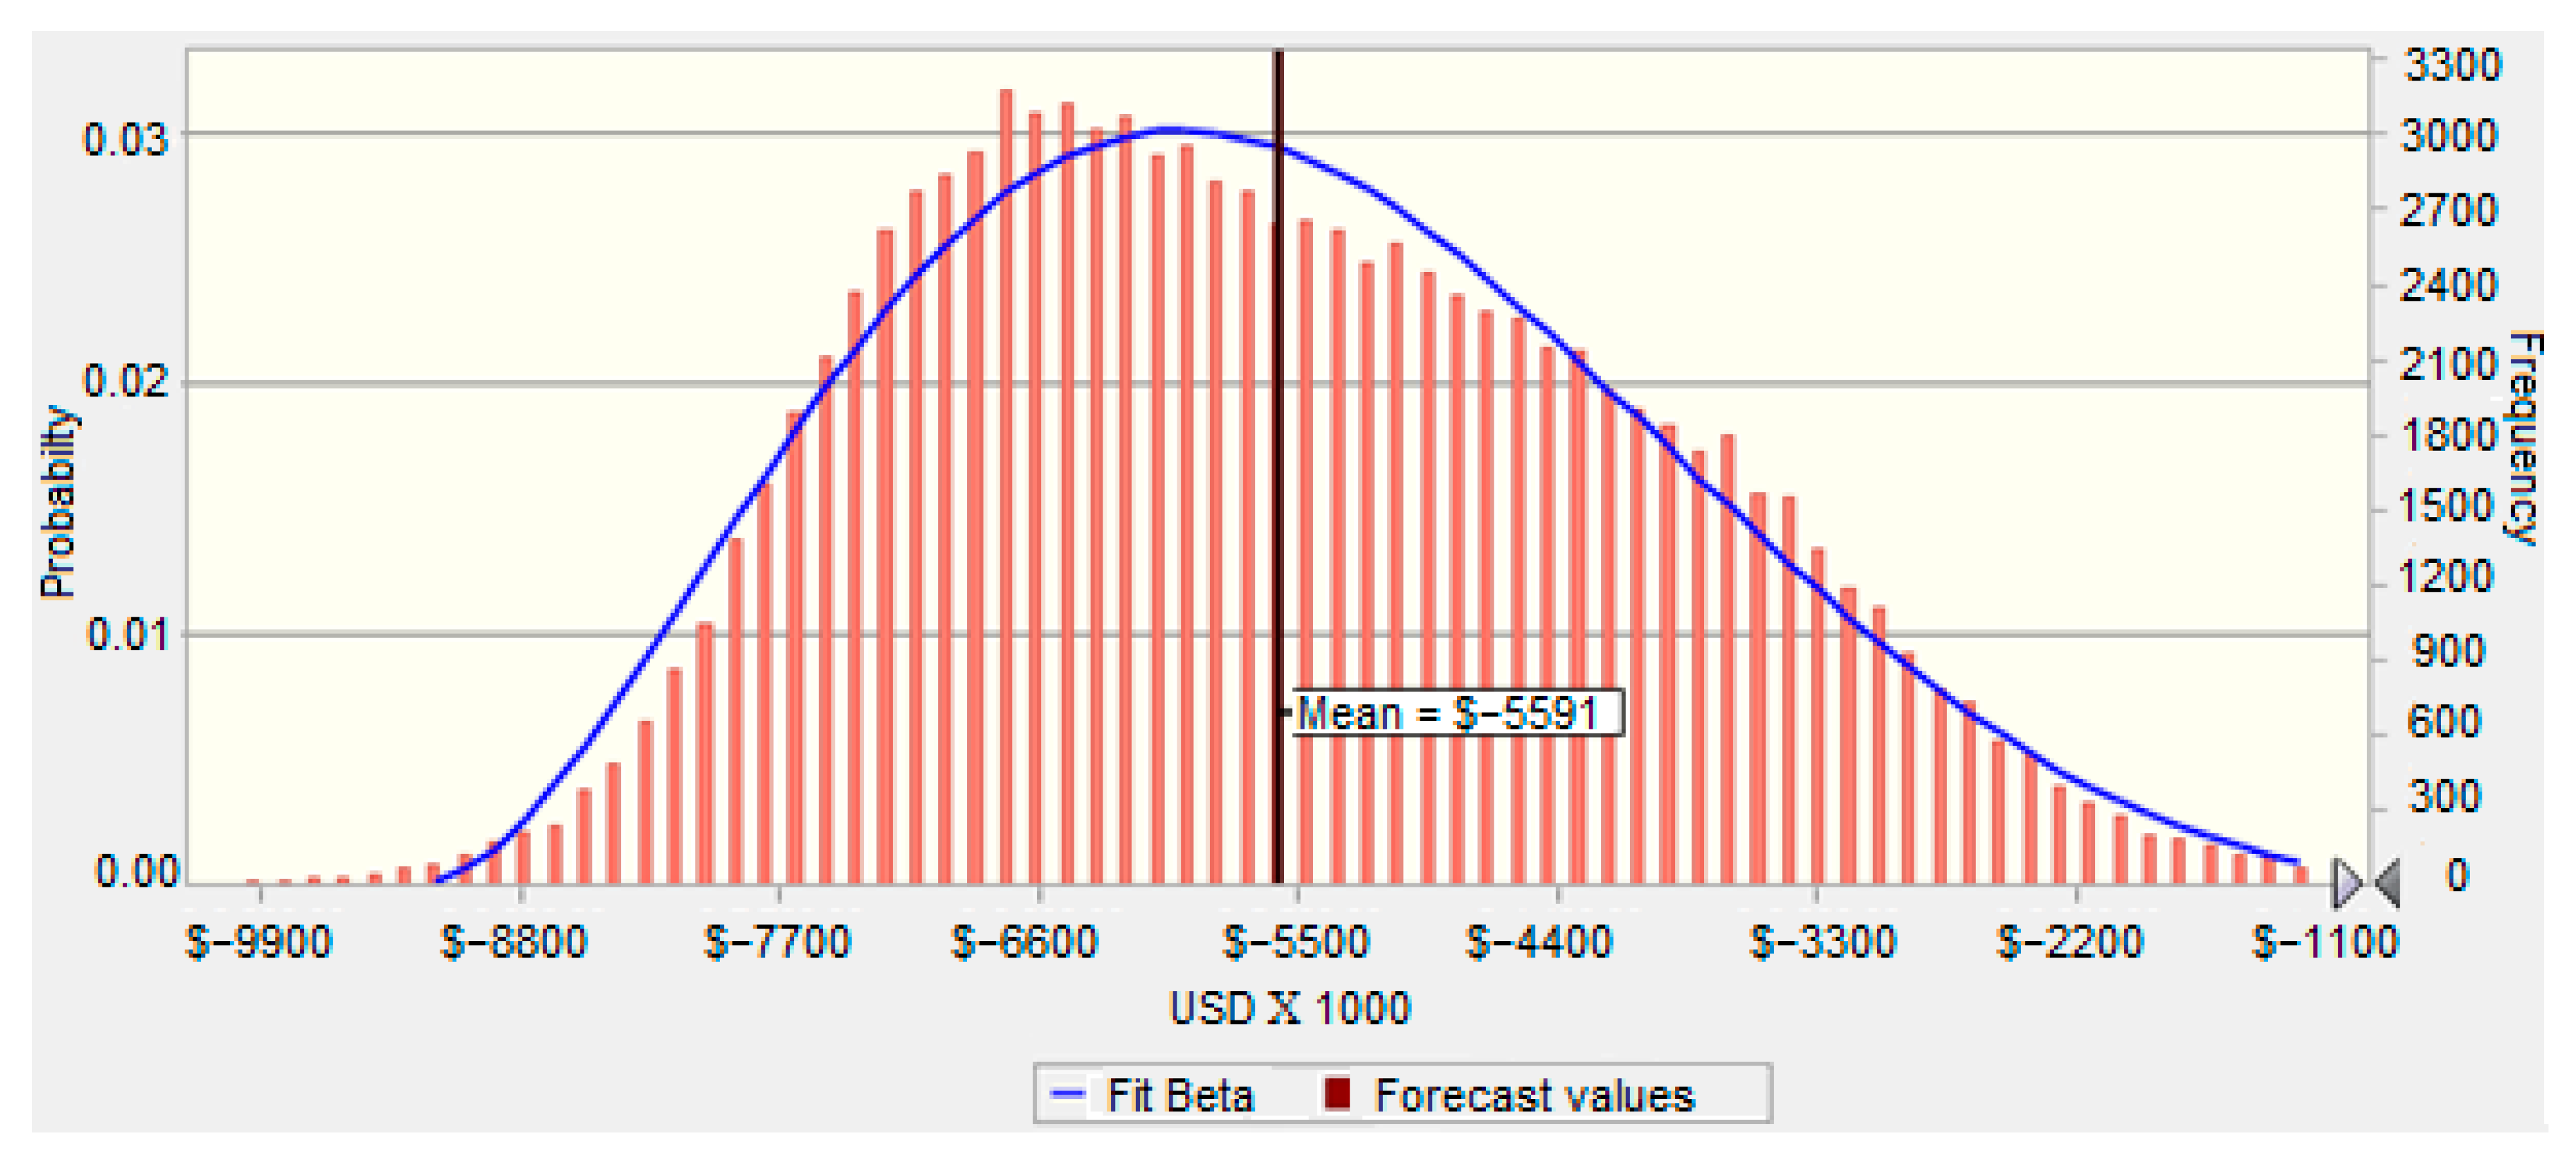
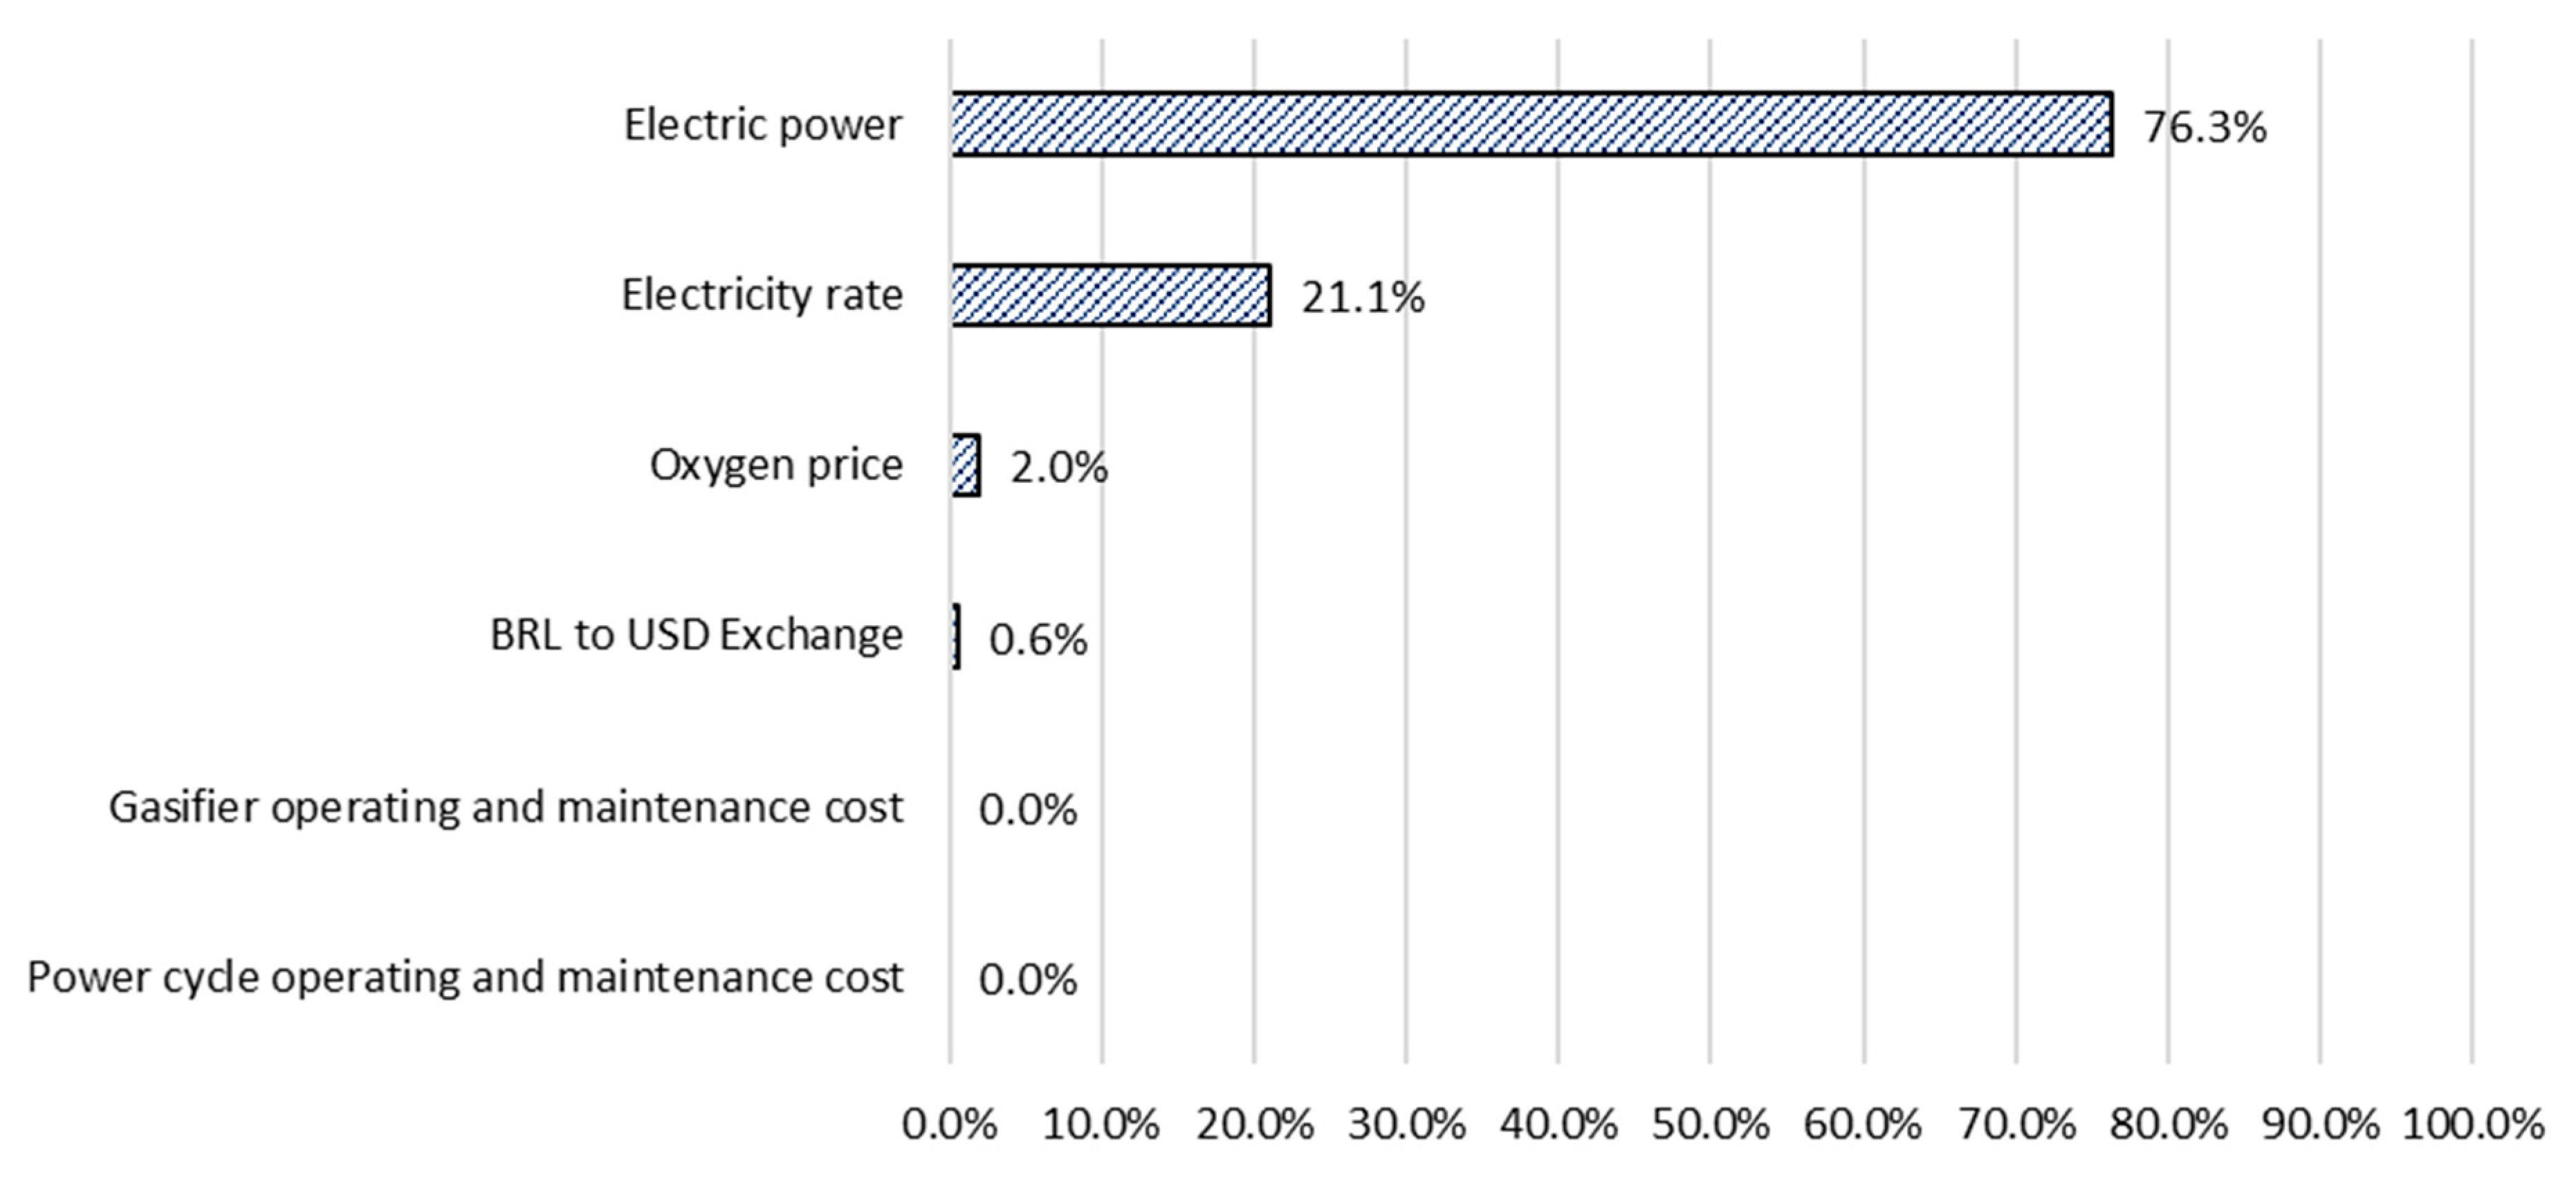
An economic evaluation was performed for the analyzed systems, considering the nominal electrical power and the local electricity tariff, where operation and maintenance costs have a secondary role in the evaluation. Besides, the results showed that the amount of energy the air-based and oxygen-based power systems generates is insufficient to guarantee a return on investment. The critical factors within the economic study of both system variants are the rated electrical power and the local electricity rate. The currency exchange rate and the operation and maintenance (O&M) costs play a secondary role in economic assessment.
With reliability of 95%, it is possible to state that the power system based on oxygen as a gasification agent has a probability of up to 99.7% generating economic losses, whereas for air-based power system corresponds to 92.09%. Therefore, it is essential to analyze the technologies and gasifying agents before implementing gasification/power systems.

 ,
, 


