Article

A Systematic Investigation on the Damage Characteristics of Fish in Axial Flow Pumps

1
National Research Center of Pumps, Jiangsu University, Zhenjiang 212013, China
2
Hubei International Science and Technology Cooperation Base of Fish Passage, China Three Gorges University, Yichang 443002, China
*
Author to whom correspondence should be addressed.
Processes 2022, 10(11), 2228; https://doi.org/10.3390/pr10112228
Submission received: 29 September 2022 / Revised: 21 October 2022 / Accepted: 22 October 2022 / Published: 30 October 2022
(This article belongs to the Special Issue Design and Optimization Method of Pumps)

Abstract

:
An axial flow pump is a kind of high-specific revolution vane pump that has the characteristics of large flow, low head, and high efficiency. Due to its unique properties, it is widely used in large water diversion projects, such as the South-to-North Water Diversion Project. However, during the operation of the pump, some fish enter the axial flow pump together with the water flow through the screen before the entrance of the pump station. Consequently, some fish are inevitably damaged or even die in the process of traversing through the pump. Meanwhile, the decay of dead fish directly affects the quality of water, hence, posing serious ecological pollution and destabilizing the ecological balance. Therefore, understanding the dynamics of axial flow pumps in relation to fish species in water bodies for biodiversity and ecosystem services remain vital for nature conservation. In this paper, the impact of damage of the model pump on fish is exhaustively investigated according to the theory of blade impact model, impact probability, impact mortality, and mortality distribution under different working conditions. Through the simulation of the flow state inside the impeller, the areas that are lower than the pressure threshold, higher than the shear strain rate threshold, and higher than the pressure gradient threshold in the impeller at different flow rates are analyzed. Based on the unsteady results, the volume fluctuation characteristics of the three damage mechanisms in the impeller are analyzed. Furthermore, Powell vortex acoustic equation is used to locate the high noise source region of the axial flow pump. After extensive comparison of the dipole sound source intensity, it is revealed that the dipole noise source in the impeller and guide vane is dominant. In conclusion, this study provides a holistic perspective for evaluating fish damage caused by the flow in the impeller of the axial flow pump. Furthermore, it will proffer significant references to the construction of ecological water conservancy projects.

1. Introduction

With the growing recognition of aquatic conservation in the age of sustainable development goals, the effect of pumping activities on fish livelihood cannot be overemphasized. Because of the large flow rate, axial flow pumps are predominantly preferred in many engineering perspectives purposely for lifting water from downstream to upstream [1]. However, a large chunk of migrating fish suffer from injury and mortality when traversing through the pumping station. Several physical phenomena are revealed to be associated to the sources of fish injury as they pass through pump stations [2]. Through years of research and analysis, several scholars have basically reached a consensus that low pressure, high-pressure gradient, and high fluid shear force are all causative harming agents to fish [3,4].
Pan Qiang et al. [5] used a mathematical model of blade impact to predict the probability of fish and blade impact. This model comprehensively considered multiple factors, such as liquid flow velocity, blade and guide blade angle, rotational speed, and fish body length. Numerous scholars have extended and modified mathematical model of blade impact to be applicable in different perspectives. Yang Dandan et al. [6] used the immersion boundary method to obtain the complex motion trajectory of the fish body in the axial flow pump and captured the motion mutation when the fish body collided with the blade. Deng et al. [7], based on the idea of solid-liquid two-phase flow, assumed fish as particles, studied the movement track of fish in the flow passage, and found that the orientation of fish body was the most important factor affecting the blade impact model.
When fish pass through hydraulic machinery, they are not only hurt as a result of blade impact, they could also be closely associated with the geometric variations and complex chaotic nature in the flow passage [8]. The damages meted to fish by high-pressure gradient keenly refers to the damage caused to the fishes’ bodies by the abrupt change of pressure when water flows through the impeller channel for energy conversion. The extent of damage to the fishes’ bodies is however related to the size of pressure difference, gradient, fish type, and other inherent factors. At present, few studies on the damage to fish caused by the flow inside the pump exist. The ejection fish pump uses high-pressure water flow to absorb the mixed fluid of fish and water to realize the transport of fish. Long Xinping et al. [9] studied the movement and damage of grass carp in the jet pump and pointed out that stress caused by changes in pressure and speed would lead to damage to gills and scales. Axial flow pumps and jet fish pumps have similar flow characteristics. Shear force damage is caused by the shear velocity of liquid flow or the force of turbulence. Studies have therefore revealed that large fluid shear force in hydraulic machinery tends to occur at solid boundaries, and large shear force caused by strong turbulence could cause rotation or deformation of fish [10]. Neitzel et al. [11,12] experimentally studied the influence of high-velocity gradient on fish and revealed that when fish enter the jet area, they rotate and deform as a consequence of the velocity gradient effect. However, they concluded that the shear rate limit that fish could bear was 500 cm/s, which was related to the species and orientation of fish. Cada [13] took an axial-flow turbine as the research object and studied the shear force damage of juvenile salmon by combining numerical analysis and experiment. The findings showed that fish body damage and mortality were extreme in the rotor and tailpipe area at the junction of stator and stator guide blades. Zhu Guojun et al. [14] numerically studied the volume distribution law of the flow in the mixed flow runner under different water head conditions with excess pressure and shear damage threshold. He obtained the pressure gradient of the flow in the mixed flow runner under different working conditions and the probability of fish damage caused by shear stress. Several scholars have done extensive works on the inner flow of turbines with regards to the damage mechanism of fish. However, research on axial flow pumps on fish damage, especially the impact of noise produced, is scarcely researched.
Studies have shown that noise on fish could have a certain degree of damage. Further, long exposure to fish above their auditory threshold noise reduces fish immunity levels and growth which could lead to cardiovascular diseases in fish [15,16,17]. In extreme cases, exposure of fish to high levels of noise could lead to powerful sensory pollutant, which is hazardous to fish communities, and could lead to hearing impairment or even death. For example, stimulating crucian carp with air gun noise could cause permanent damage to crucian carp’s hearing [18]. Higher intensity of noise could even directly damage the internal organs of fish. For example, noise generated by piling could cause liver congestion, swim bladder rupture, and internal bleeding of surrounding fish to different degrees [19]. Thus, noise pollution will not only be a nuisance to fish organisms. Nevertheless, they could also influence the structure, health, and consequently, the service functions of the ecosystem. Hence, studying the flow mechanisms of axial flow pump to fish livelihood in water bodies is crucial to curtailing this menace. In this paper, the vortex-acoustic equation was used to identify the high dipole source region of axial flow pumps, which could provide some guidelines to reducing the internal noise of axial flow pumps.

2. Numerical Calculation

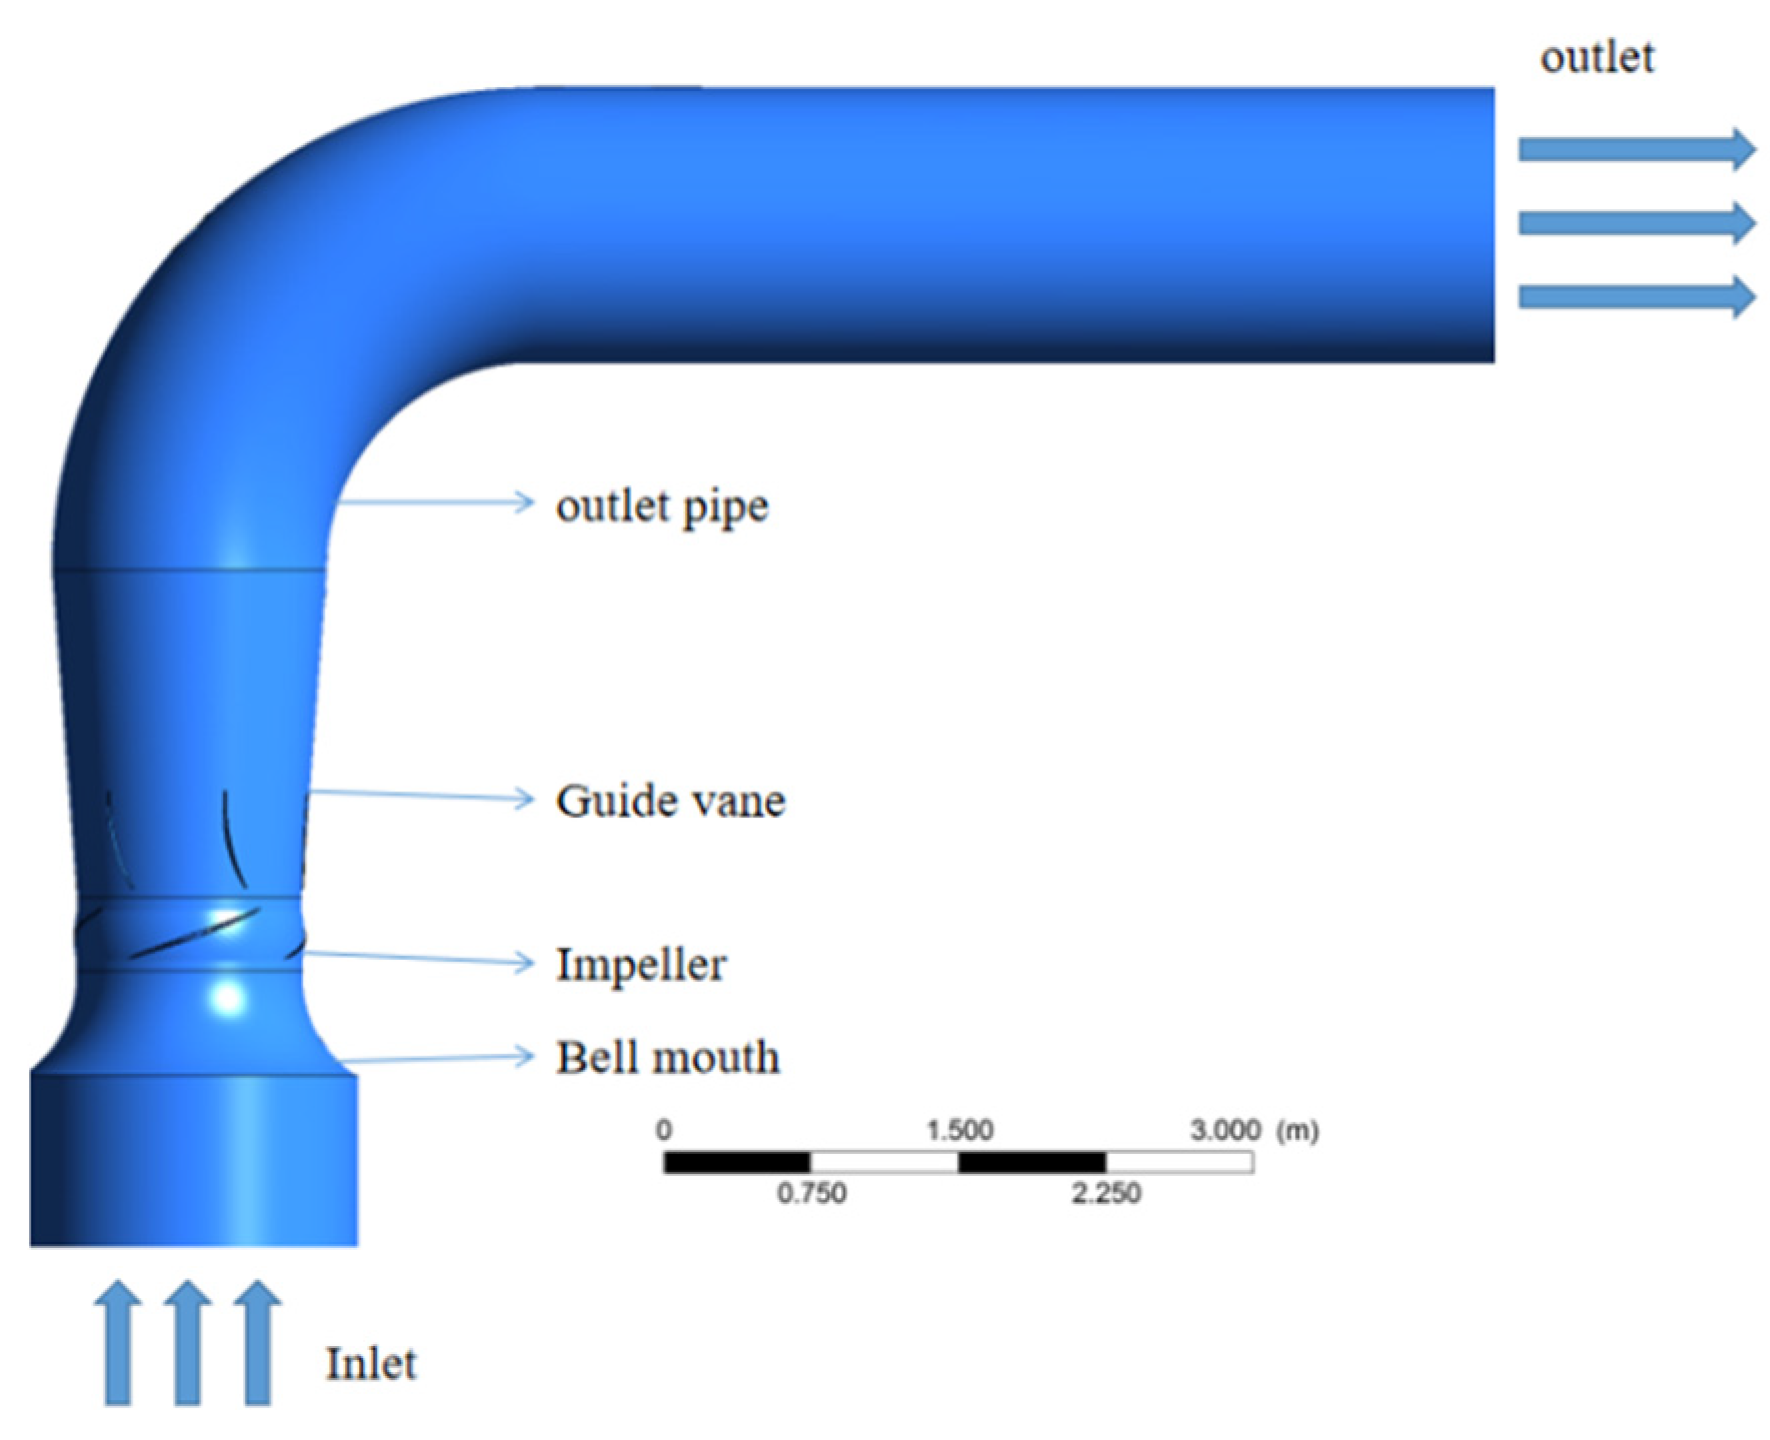
2.1. Geometric Model

The basic parameters of the axial flow pump model studied in this paper are: flow rated Qd = 18,360 m3/h, head Hd = 5.1 m, rotational speed n = 370 r/min, blade number Z = 4, guide vane blade number Zg = 6, impeller outer diameter 1140 mm, hub diameter 520 mm, leading edge blade average thickness 2.49 mm. trailing edge blade average thickness 3.1 mm, 3D modeling of the model pump (full flow channel model of axial flow pump), as is displayed in Figure 1.
The mesh profile of the fluid domains of the axial flow pump model was generated. Due to the flow characteristics of the pump, hexahedral structure grids which have a good relationship between adjacent nodes, good orthogonal property, and high quality was used for the mesh generation for each fluid domain of the pump as shown in Figure 2.

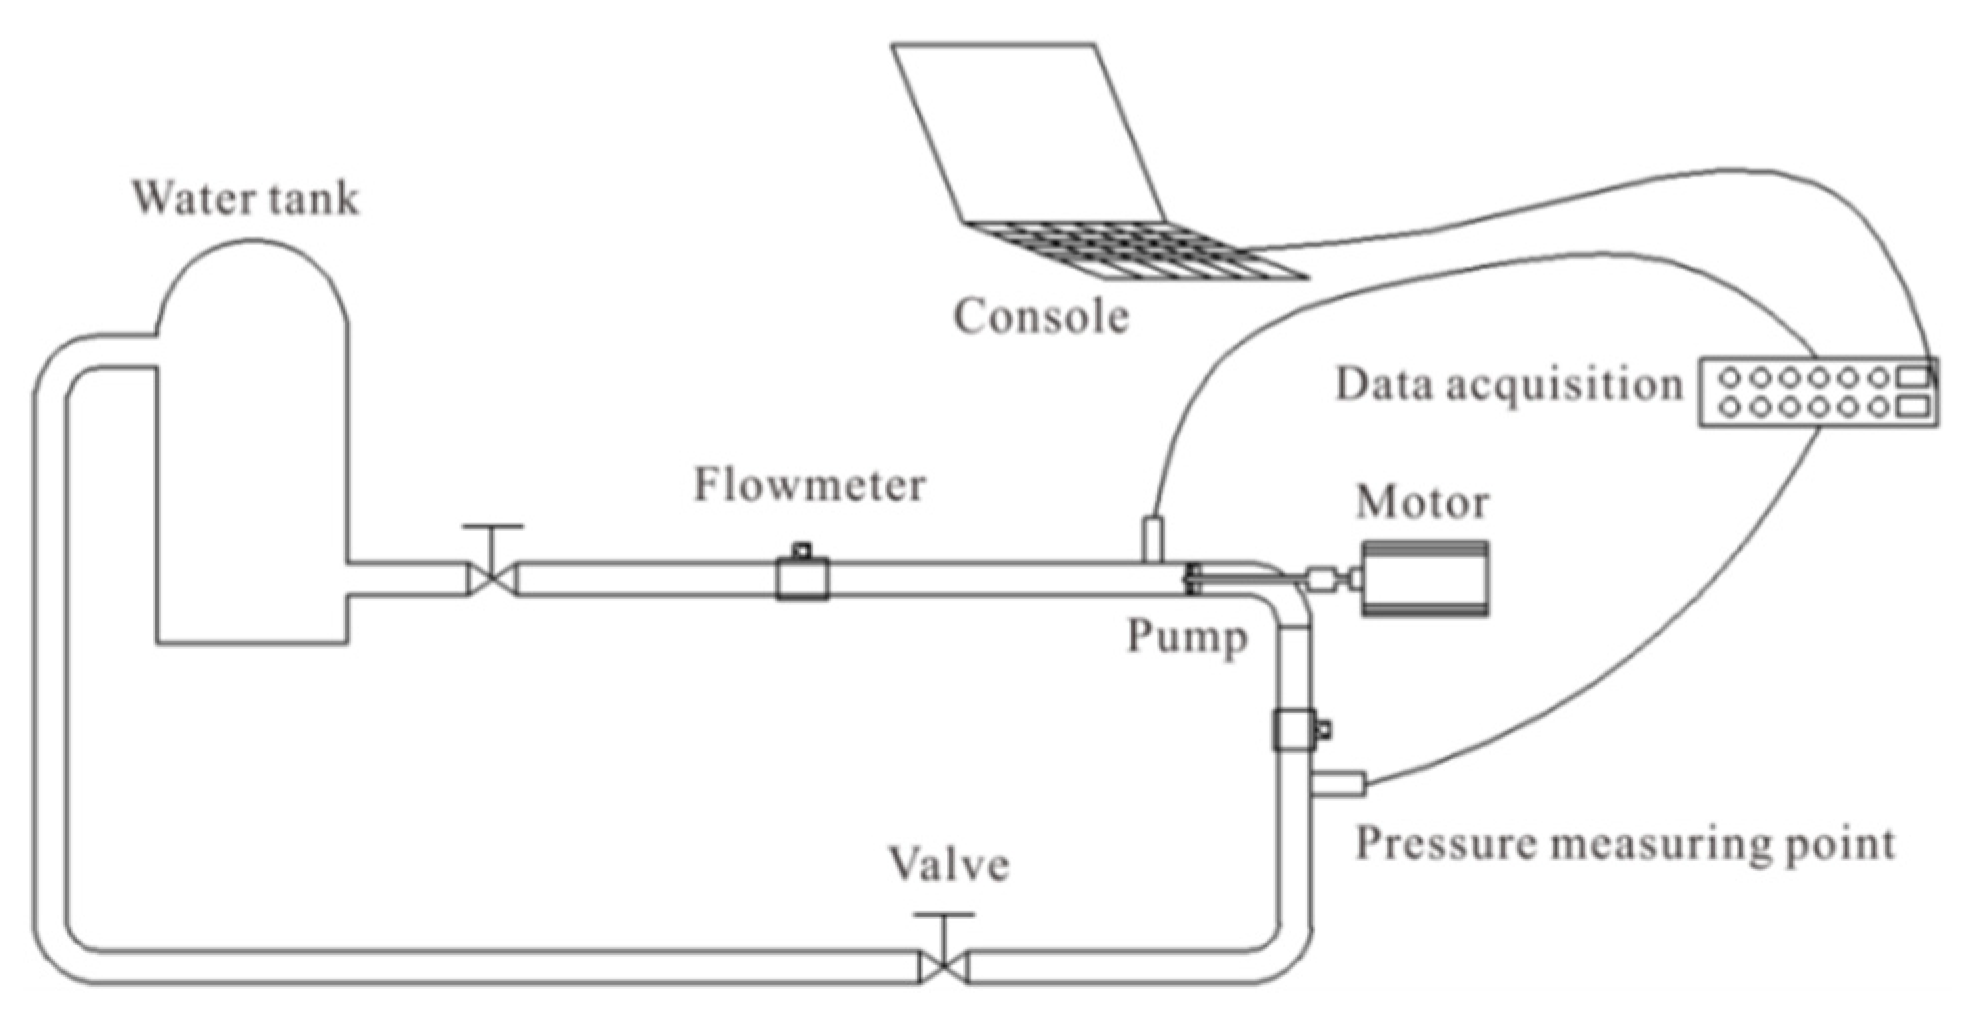
2.2. Boundary Conditions and Reliability Analysis of Numerical Calculation

In the process of solving the N-S (Navier-Stokes) equations, the convection term in the control equation was discreted by the second-order difference scheme, and SST (Shear Stress Transport) turbulence model was used for numerical simulation. The temperature was at 25 °C. The inlet boundary condition was 1 atm total pressure, and the outlet boundary condition was mass flowrate. The flow near the wall was adopted as the standard wall function. The turbulence intensity was set to 5%. The numerical method was FVM. The wall surface was set as a no-slip wall. The water coordinate system of the impeller is the rotating coordinate system, and the other water is the static coordinate system. The interface between the rotating domain and the stationary domain is the Frozen Rotor coupling grid connection mode is GGI (General Grid Interface). Convergence residuals are set to 10−4. Grid independence analysis is shown in Table 1. Considering the performance of the computer, the total number of grids is finally determined to be 9.84 Million.
The SST model is improved on the basis of k-ω model and has been widely used because of its enhanced prediction of adverse pressure gradient flows. The definition of SST equation is given as [20]:
k-ω equations:
( ρ k ) t + x j ( ρ U j k ) = x j [ ( μ + μ t σ k 1 ) k x j ] + P k β ρ k ω
( ρ ω ) t + x j ( ρ U j ω ) = x j [ ( μ + μ t σ ω 1 ) ω x j ] + α 1 ω k P k β 1 ρ ω 2
Transformed k-ε model:
( ρ k ) t + x j ( ρ U j k ) = x j [ ( μ + μ t σ k 2 ) k x j ] + P k β ρ k ω
( ρ ω ) t + x j ( ρ U j ω ) = x j [ ( μ + μ t σ ω 2 ) ω x j ] + 2 ( 1 F 1 ) ρ 1 σ ω 2 ω k x j ω x j + α 2 ω k P k β 2 ρ ω 2
The blending functions F1 and F2 are:
F 1 = tanh ( Γ 1 4 )
F 2 = tanh ( Γ 2 2 )
The turbulent viscosity, µt is calculated using:
μ t = α 1 k ρ max ( α 1 ω , S F 2 )
The k-ω equation for the inner boundary layer prediction was applied using the following coefficients: σk1 = 1.176, σω1 = 2.0, β1 = 0.075, α1 = 5/9, β′ = 0.09. Meanwhile, the k-ε equation for the free-stream flows was solved using the following coefficients: σk2 = 1.0, σω2 = 1/0.856, β2 = 0.828.
The span is the ratio of the radial distance from the root to the streamline of the blade and the radial distance from the root to the top of the blade. The definition of Span is given as:
S p a n = ( r r h ) ( r s r h )
where, rh represents hub radius, (mm); rs represents the rim radius, (mm); r is the calculated cross-section radius, (mm).
The calculation Equation of the head is:
H = ( Z 2 Z 1 ) + P 2 P 1 ρ g + v 2 2 v 1 2 2 g
where, (Z2Z1) position height difference between inlet and outlet, P 2 P 1 ρ g is the pressure difference between inlet and outlet and v 2 2 v 1 2 2 g is the kinetic energy difference between inlet and outlet. Where Z2 and Z1 are the outlet and inlet height of the flow pump respectively, (m); P2 and P1 are the outlet and inlet pressures of the pump, (Pa); ρ is gravity acceleration, (kg/m3); v2 is the outlet speed of the axial flow pump, (m/s); v1 is the inlet speed of the axial flow pump, (m/s).
The calculation Equation of the efficiency is given as:
η = ρ g Q H P × 100 %
where Q is the flow rate, (m3/s); P is the shaft power, (W).
Meanwhile, the experimental diagram is shown in Figure 3. The numerical efficiency and head were compared with the experimental efficiency and head. It is glaring from Table 2 that the efficiency and head obtained by numerical simulation have the same overall trend with the test results under different flow rates. At 0.6Qd, the error between the simulated efficiency and test is 0.81. At 1.0Qd, the error between the simulated efficiency and test is 0.36, at 0.8Qd and 1.2Qd, the error is 1.55 and 2.29, respectively. The simulated results are slightly higher than that of the experiments because the experimental results include the friction loss between the liquid flow and the wall surface. In conclusion, the performance curves calculated by numerical method coincide with that of experimental measurements, which indicates that the numerical results are reliable.
From Table 2, ΔH is equal to the difference between experiment head and calculation head. Δη is equal to the difference between experiment efficiency and calculation efficiency.

3. Methods

3.1. Blade Strike Model

Mechanical damage especially due to the impact between the rotating blade and fish body is comprehended to be the main factor of fish body damage in axial flow pump of water diversion projects. Assuming that the fish is a linear model with the same direction as the liquid flow and no speed slip occurs between them, then following the ratio of tf to tb, theoretical blade impact probability Pth can be obtained, and its value range is limited to less than 100%, as presented in Equation (11) [21].
P th = t f t b = min ( 100 % , L f A 1 n N 60 Q )
From Equation (11), tf is the time of fish passing through the leading edge of the impeller, s; tb is the passing time of the blade, s; Lf is the length of the fish, m; A1 is the cross-section area of blade inlet flow, m2; n is the number of impeller blades; N is rotational speed, r/min; while Q is the flow rate, m3/s.
When fishes are impacted by blades, a certain proportion of fish dies, which is related to several factors such as fish species, size, impact speed of blades, shape of the leading edge of blades and several among others. Meanwhile, the death rate of fish after being impacted by the leading edge of blades is shown in Equation (13): [21]
f m = [ a ln ( L f d ) + b ] ( v s 4.8 )
P m = P th f m
In Equations (12) and (13), fm is the impact mortality rate; Pm is death rate; d is blade leading edge thickness, m; vs is the impact velocity, which is obtained by velocity triangle decomposition, and the unit is m/s; a = 0.0327, b = −0.1146 [21].

3.2. Pressure Damage

Studies have revealed that high pressure contributes little harm to fish [22,23], nonetheless, low pressure could lead to damage to the swim bladder of the fish, gas embolism in blood, and sometimes death [24]. At present, a large number of fish have not been studied, and the damage of low pressure to fish is scarce. Therefore, it is against this backdrop that this paper utilizes 50.66 KPa as the pressure threshold [25] to analyze the area below the pressure threshold inside the impeller.

3.3. Shear Force Damage

Studies have revealed that under the influence of shear flow, fish will roll, resulting in loss of balance and even damage to their eyes and gills. In particular, fish are more vulnerable to the influence of shear flow due to the fragility of their body tissues [26]. The shear deformation degree of fluid is generally characterized by shear strain rate, as shown in Equation (14). Neitzel experimentally verified that high shear force could cause damage to fish when the shear strain rate of 500 s−1 was used as the measurement index [11,12]. In this work, 500 s−1 was chosen as the shear strain rate threshold to investigate the area inside the impeller that was higher than the shear strain rate threshold.
V s h e a r = [ { ( u x ) 2 + ( v y ) 2 + ( w z ) 2 } + 1 2 { ( u y + v x ) 2 + ( u z + w x ) 2 + ( v z + w y ) 2 } ]

3.4. Pressure Gradient Damage

The energy exchange between the fluid flow inside the impeller and the blade inevitably generates pressure gradient, which is deemed as one of the most imperative damage sources to fish. A high-pressure gradient causes the scales of fish to fall off [27] and increases the chance of infection with bacteria, hence causing damage or even death to fish. Pressure gradient is the change rate of pressure with time. Presently, a chunk majority of fishes have not been studied, and the damage of pressure gradient to fish is scarce. Therefore, 3.5 MPa/s is selected as the pressure gradient threshold, and the area exceeding the threshold could cause damage to the fish [25]. The calculation method of pressure gradient is show in Equation (15).
V g r a d i e n t = d p d t = V · p
In Equation (15), p is the gradient of pressure with space position, Pa/m, and V is the velocity vector, m/s.

3.5. Study on Unsteady Characteristics of the Sound Source in Impeller

When fluid passes through the axial flow pump, the blade interacts with the high-speed fluid, which makes the blade continuously subjected to the unsteady load, and then causes noise. The noise can not only cause damage to the hearing system of the pumped fish but also have a negative impact on the ecological environment around the pumping station. In this section, the position of the high sound source in the axial flow pump is identified by the vortex sound equation, and the distribution of the high sound source area in the axial flow is explored, to provide certain guidance for the fast and accurate location of the high noise area and the optimal design of the low noise axial flow pump.

Vortex Acoustic Equation

The expression of the Powell vortex sound equation [28] is shown below:
1 c 2 2 P s t 2 2 P s = ( ρ 0 ( w × u ) + ( ρ 0 u 2 2 ) u ρ 0 t u 2 2 P s )
where Ps represents sound pressure disturbance quantity, Ps is the parameter describing sound amplitude, ρ 0 is the fluid density, and the equation is time term, space term, and sound source term, respectively, from left to right. In the case of a low Mach number, ignoring high-order small quantity, the equation can be simplified as:
1 c 2 2 P s t 2 2 P s = ρ 0 ( w × u )
S d = | ρ 0 ( w × u ) |
In Equation (18), Sd is the absolute value of the dipole sound source term.

4. Results and Discussions

4.1. Blade Strike Damage of Axial Flow Pump

Based on the blade impact model, through the above theoretical analysis and calculations, the axial flow pumping capacity is predicted. In this paper, 50 mm fish were selected for analysis. Figure 4 presents the distribution of Pth, fm and Pm of fish impinging through impeller blades under different working conditions. As displayed in Figure 4, under the same head, with the decrease of flow, the greater the impact probability of blade inlet edge on fish, the smaller the cutting probability of blade inlet edge on fish. Additionally, the mortality of blade inlet edge on fish firstly increased and then decreased subsequently.

4.2. Pressure Damage of Axial Flow Pump

The regional distribution below the pressure threshold in the impeller under design conditions is shown in Figure 5. It is noticeable that the area below the pressure threshold in the impeller is mainly distributed at the back of the blade near the inlet edge.
To further ascertain the distribution law of the regions below the pressure threshold in the impeller, the regions below the pressure threshold on different blade height sections in the impeller are studied. It is evident from Figure 6 that under the same blade height, the area beneath the pressure threshold is located at the back of the blade close to the inlet in all working conditions. This could be a result of different degrees of flow separation that are generated at the back of the blade close to the inlet when the liquid flows through the blade, at relatively low pressure. Meanwhile, at the same blade height, the area below the pressure threshold moves from the inlet edge of the back of the blade to the middle of the back of the blade with the increase of the flow, indicating that the flow separation moves along the back of the blade to the middle of the impeller with the increase of the flow. In addition, with the increase in flow rate, the area below the pressure threshold of the same blade section decreases first and then increases. The area which is the smallest in the design working condition and the largest in the 1.2Qd working condition, which signifies that under the design flow of impeller flow state, the best fish are the fish with the least of damage and fish by low pressure under heavy traffic injury.
Under conditions from 0.6Qd to 1.0Qd, there are areas below the pressure threshold in the middle and near the impeller edge, which are mainly concentrated at the back inlet of the blade. Therefore, fish entering from the middle of the impeller inlet edge and near the rim are susceptible to low pressure damage, while fish entering from the impeller inlet edge and near the hub are less vulnerable to low pressure damage. Under the condition of 1.2Qd, there are areas below the pressure threshold near the impeller hub, the middle, and the rim, which are mainly concentrated at the middle of the back of the blade. Therefore, it can be concluded that fish passing near the impeller hub, the middle of the impeller and the rim are susceptible to low pressure damage.

4.3. Shear Force Damage of Axial Flow Pump

It can be verified from Figure 7 that areas higher than the shear strain rate threshold in the impeller are mainly distributed on the blade surface, hub surface, and rim surface. It is worth noting that the high shear strain rate near the wall could be due to the presence of a boundary layer near the wall with a large velocity gradient inside.
The area of high shear strain rate in the impeller is mainly distributed near the impeller wall, and a small part is distributed in the impeller flow passage. However, high shear strain rate in impeller passage area cannot be overlooked, because the leaf flow channel of the high shear strain rate region role in fish body surface could cause its scales to fall off, and perhaps might increase the chances of infection, as used in the fish’s head. It could also cause the eyes of the fish to even swell or fall off, while the gill cover could rupture and tear. To further ascertain the regional distribution law in the impeller that exceeds the shear force threshold, regions with different blade height sections in the impeller that are higher than the shear strain rate threshold are selected for the study. As displayed in Figure 8, areas higher than the shear strain rate threshold at the same blade height are evenly distributed at multiple positions inside the impeller under various working conditions. This could be a consequence of the continuous rotating deformation of the blade when acting on the fluid, resulting in high shear strain rate. In addition, the areas with high shear strain rates at the exit of the blade are mainly generated by the jet wake after the liquid falls off the blade.

4.4. Pressure Gradient Damage of Axial Flow Pump

From Figure 9, areas exceeding the threshold of pressure gradient are mainly distributed near the inlet edge of the blade, the middle of the blade flow passage, and the outlet edge of the blade. The high-pressure gradient near the inlet edge of the blade is mainly due to the fact that the pressure of the liquid flow is influenced by the blade for the first time, and as such a high-pressure gradient area emanates at this position. Meanwhile, the high-pressure gradient in the middle of the impeller passage is mainly due to the flow separation when the liquid passes through, and similarly, a high-pressure gradient area is also generated. Finally, the formation of the high-pressure gradient area near the outlet edge of the blade could also be due to the mixing of the liquid flow through the working surface and the liquid flow through the back at the outlet of the blade.
To further delineate, the regional distribution rule of exceeding the threshold of pressure gradient in the impeller, the regions with different blade height sections surpassing the threshold of pressure gradient in the impeller are selected. Apparently from Figure 10, under the same blade height section, the area exceeding the pressure gradient threshold in the impeller decreases first and then increases. When Span = 0.1, the area exceeding the threshold of pressure gradient registered the largest in 1.2Qd conditions compared with other conditions. This suggests that the fish passing near the hub under large flow conditions could suffer greater damage to the pressure gradient compared with other conditions. Meanwhile, when span = 0.5, the area exceeding the threshold of pressure gradient becomes the largest in the 0.6Qd condition, which indicates that the fish passing through the middle section of the impeller under low flow conditions could be more susceptible to damage by pressure gradient compared to other conditions. On the other hand, when Span = 0.9, compared with other conditions, the area exceeding the pressure gradient threshold also attains the largest in the 0.8Qd condition, indicating that the fish passing near the impeller flange section under this 0.8Qd condition is likely to be damaged by the pressure gradient as juxtaposed to other conditions.
In 0.6Qd flow conditions, the proportion of the area exceeding the threshold of pressure gradient in the middle section of the impeller showed the largest, which indicates that the fish passing near the middle section of the impeller are more likely to be damaged by the pressure gradient than the fish passing near the rim hub under the condition of small flow. At 0.8Qd and 1.0Qd, the proportion of the area exceeding the threshold of pressure gradient in the blade section area of the impeller is the largest, which indicates that the fish passing near the blade section of the impeller are more likely to be damaged by the pressure gradient than those passing near the hub and the middle section under the conditions of 0.8Qd and 1.0Qd. Under the condition of 1.2Qd, the proportion of the area exceeding the threshold of pressure gradient in the section area of the impeller hub becomes the largest, which suggests that under the condition of large flow, the fish passing near the section of the impeller hub are more deteriorated by the pressure gradient than the fish passing near the middle section of the impeller and the rim.

4.5. Study on Unsteady Characteristics of Impeller Internal Damage Source

Figure 11 depicts the time-domain waveform of the volume that is lower than the pressure threshold, higher than the shear strain rate threshold and higher than the pressure gradient threshold at the same flow condition inside the impeller of an axial flow pump in one rotational cycle. The horizontal and vertical axis denote the angle, and volume respectively. Glaringly, the volume pulsation curve in the impeller of the axial flow pump that exceeds the shear strain rate threshold exhibited obvious periodicity under various flow conditions, displaying strong fluctuation law. This suggests that the volume pulsation characteristics of shear force in the impeller are apparently affected by the periodic rotation of the impeller. With the increase of flow rate, the fluctuation of volume below pressure threshold, volume exceeding shear strain rate threshold and volume exceeding pressure gradient threshold decreases. It is observed that from 0.6Qd to 1.0Qd, the volume exceeding the pressure gradient threshold in the impeller accounts for the largest proportion among the three damage mechanisms. This observation suggests that fishes are most vulnerable to pressure gradient damage under this condition. However, under the condition of a large flow rate, the volume in the impeller below the pressure threshold reaches the largest, indicating that under the condition of a large flow rate, the damage of low pressure to fish is dominant.
At the 0.6Qd condition, the volume pulsation curve in the impeller that exceeds the pressure gradient threshold and below the pressure threshold is disordered, which could be a result of the secondary flow in the impeller under small flow condition. Among them, the volume exceeding the shear strain rate threshold is the smallest, which implies that the shear flow is the least likely to cause damage to the fish body under the condition of small flow. Meanwhile, when the impeller rotates close to 240° higher than the threshold pressure gradient within the impeller of the maximum volume, the fish would be more susceptible to damage. When the impeller rotates close to 350°, the volume of the area exceeding the threshold of the pressure gradient in the impeller is the smallestthe impeller with more than the smallest account for the threshold pressure gradient, the fish would be less susceptible to damage. Under 0.8Qd and 1.0Qd conditions, the volume fluctuation characteristics of the three damage mechanisms are weakened, indicating that with the increase of flow rate, the secondary flow in the impeller would decrease whilst augmenting the flow state in the impeller. Among them, the volume in the impeller lower than the pressure threshold is the smallest, which indicates that the possibility of damage to the fish body caused by low pressure is minimal at 1.0Qd. Under the condition of 1.2Qd, the volume pulsation characteristics of the three damage mechanisms are reduced, which suggests that the secondary flow inside the impeller is more weakened under the condition of large flow. Among them, the volumes exceeding the shear force threshold and the pressure gradient threshold are comparable, whilst the volumes occupied by both are the weakest. This phenomenon justifies a minimum possibility of shear flow and pressure gradient damage.

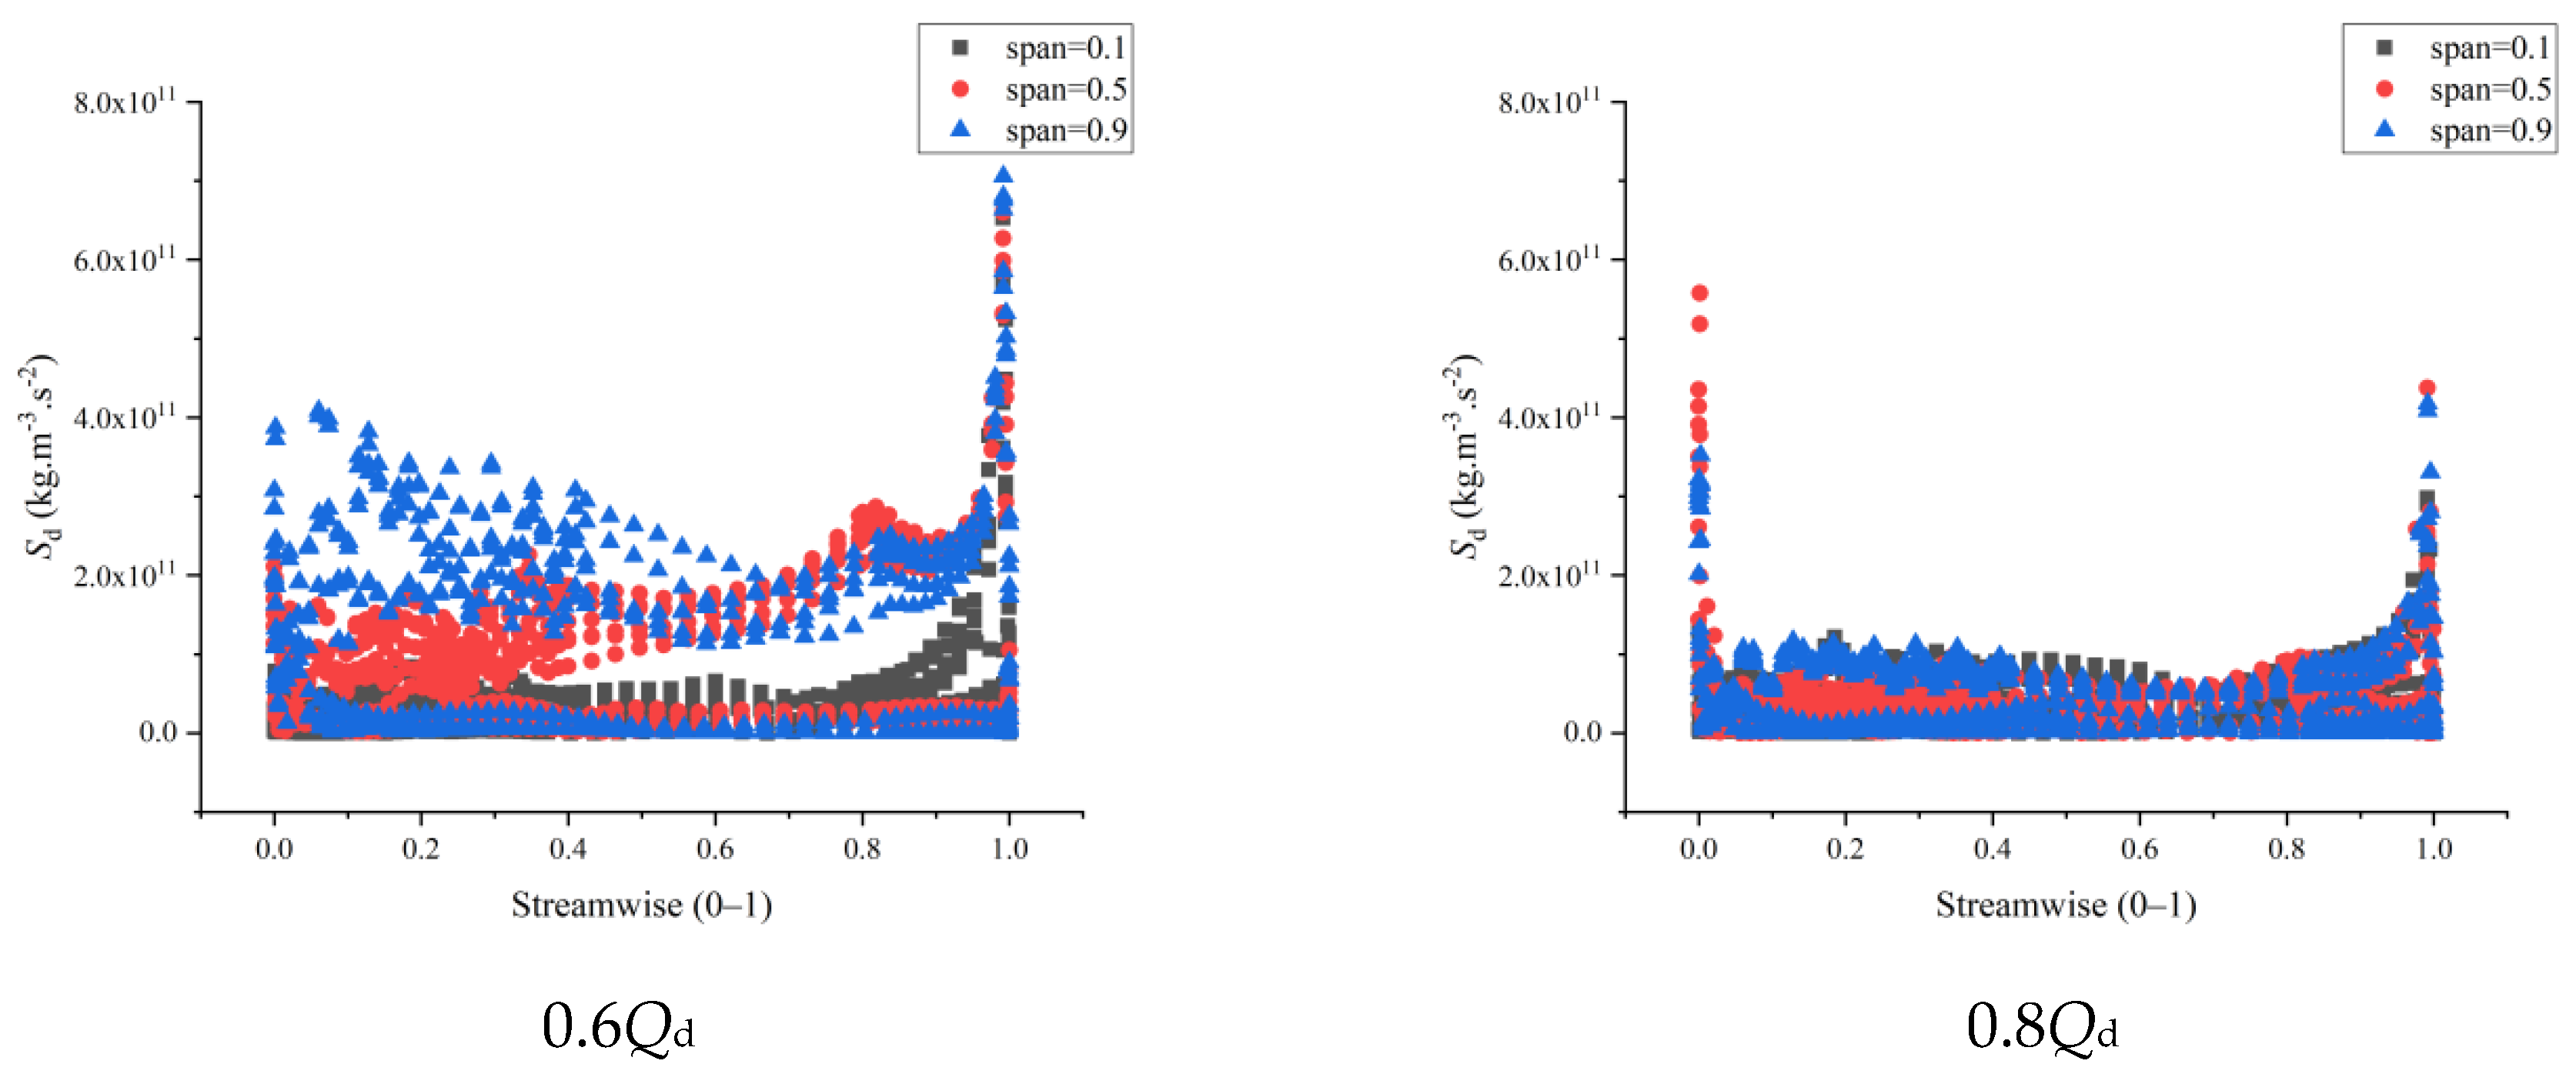
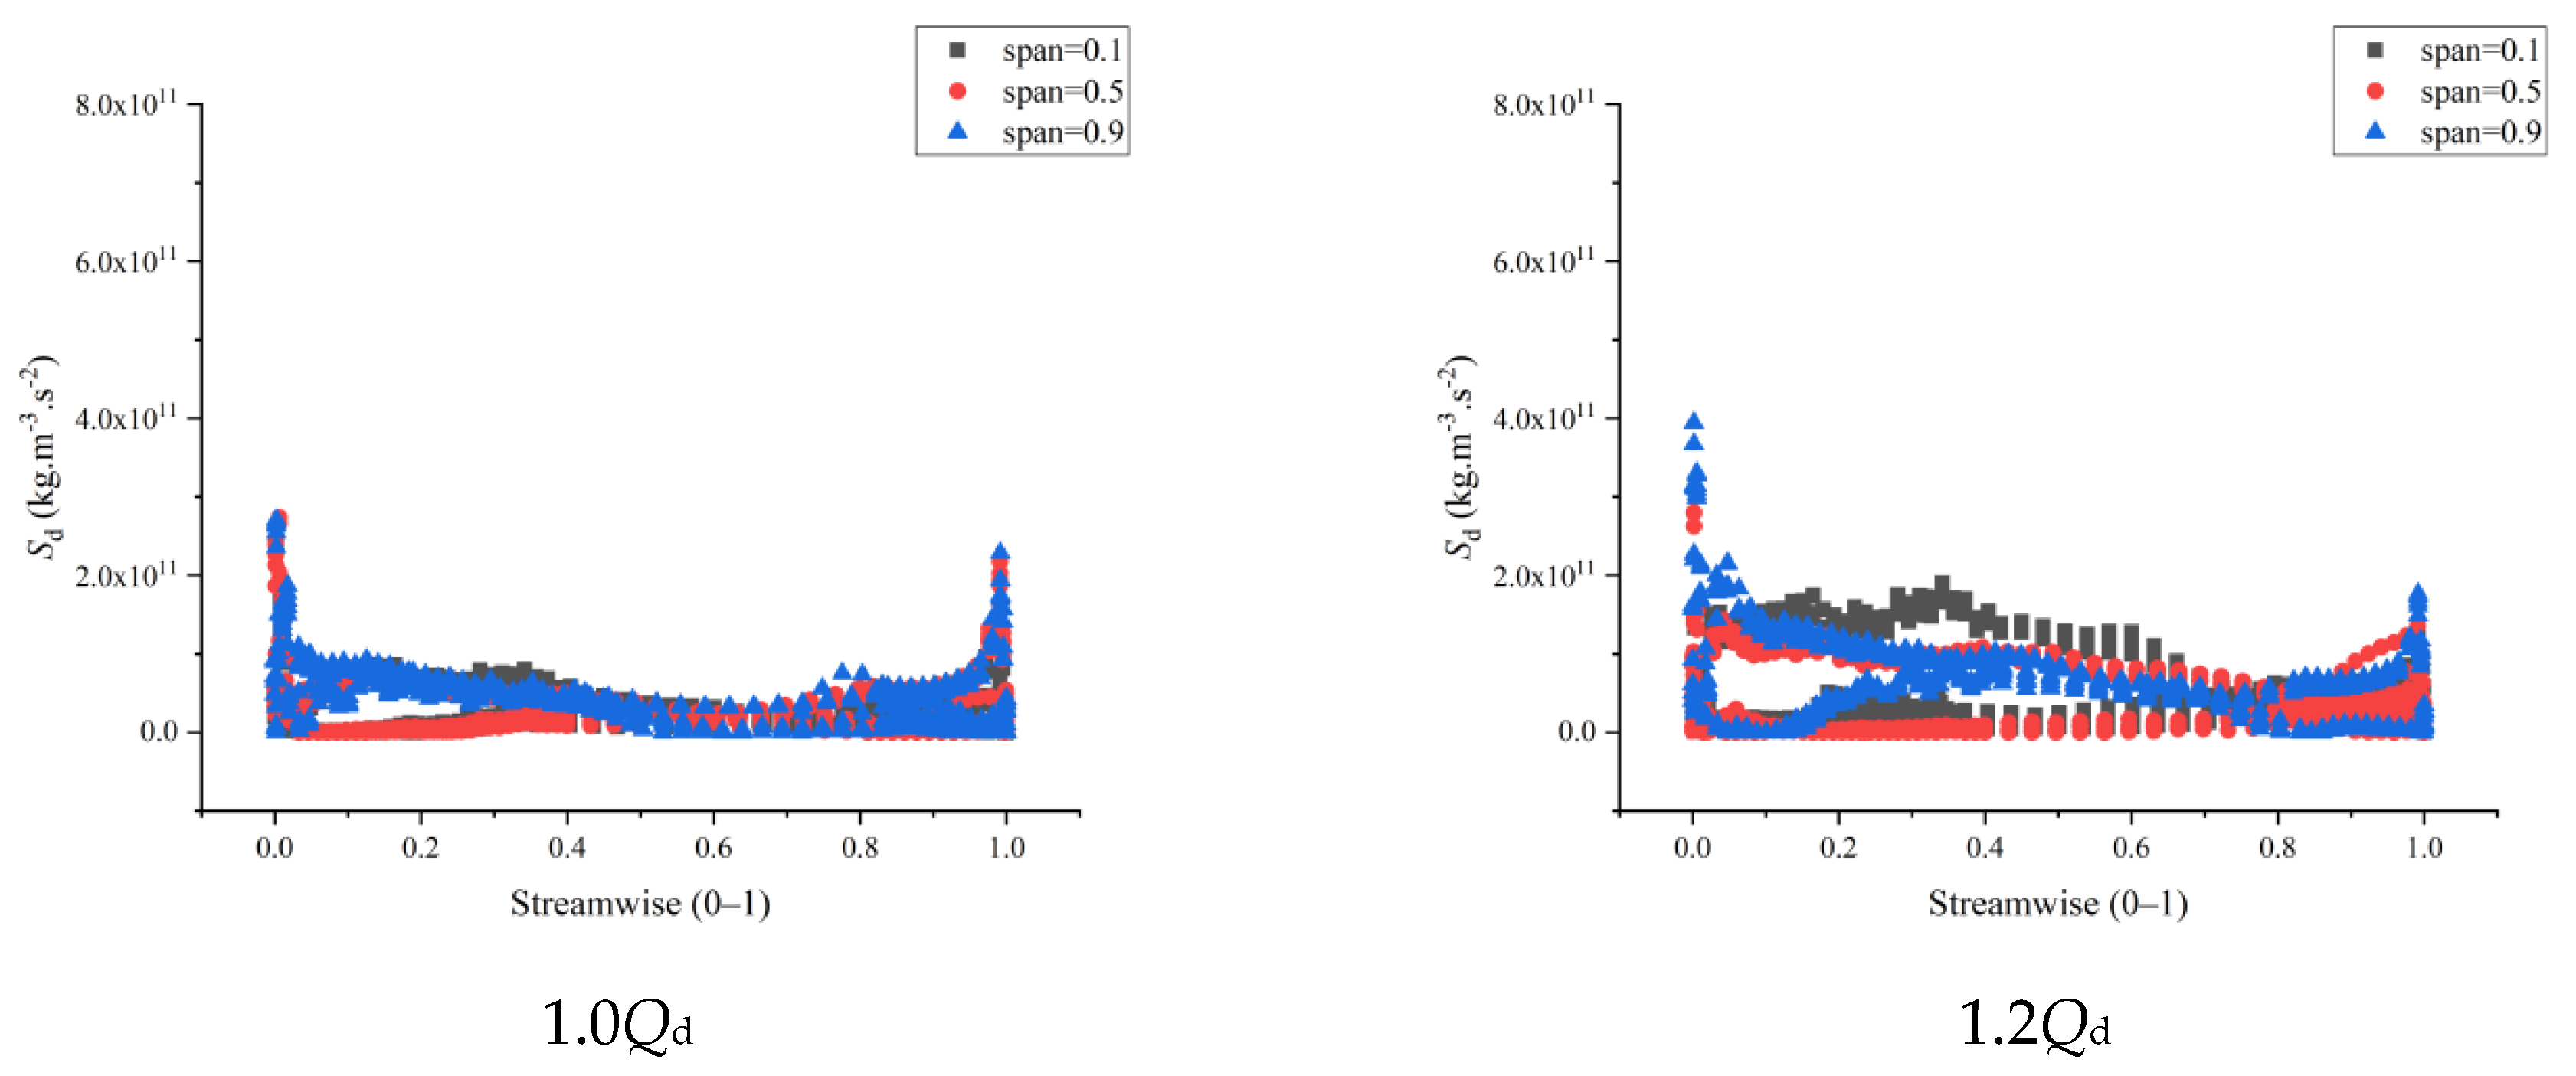
4.6. Distribution Law of Dipole Sound Source in Impeller and Guide Vane of Axial Flow Pump

Figure 12 presents the distribution of the dipole sound source in the impeller and guide vane. It is apparent that the dipole sound source area in the impeller is largely scattered at the impeller inlet, near the blade surface and the blade outlet. The dipole sound source in the inlet area of the impeller is also generated because the inlet liquid flow is affected by the inlet edge of the blade which dramatically alters the initial shape of the vortex. According to the vortex sound theory [28], the rapid change of the vortex will produce high intensity noise when the sound source region appears at the inlet edge of the blade. Similarly, the high-pitched source region near the blade surface emanates owing to the vortices around the blade which change correspondingly with the continuous rotation of the blade. The sound source area at the exit of the impeller could be due to the original vortex falling off correspondingly when the liquid flows out of the impeller. Moreover, the shape of the vortex changes when falling off, revealing a high noise source area at the exit of the blade.
It is worth recognizing that the dipole source area in the guide vane is mainly distributed at the inlet of the guide vane, near the blade surface, and at the outlet of the guide vane. The sound source area at the inlet of the guide blade is mainly caused by the periodic change of vortex caused by the rotor-stator interaction between the impeller and the guide blade. The dipole source near the surface of the guide blade is generated because the guide blade changes the vortex shape of the original liquid flow which causes noise in the process of eliminating the circumferential component of the liquid flow velocity at the outlet of the impeller. It should be noted that the dipole sound source region at the outlet of the guide blade is also caused by the change of liquid flow form when it falls off from the guide blade, thus causing the noise.
At the same section, with the increase in flow rate, the area occupied by the dipole source inside the impeller decreases first and then increases, reaching the minimum under the design condition. This justifies that the flow state inside the impeller is the best under the design condition, as a result of the minimum dipole sound source. At the same flow rate, the dipole source distribution in the impeller changes with the increase of blade height. At the 0.6Qd condition, it was noticeable that with the increase of blade height, the area of the sound source decreased firstly and then increased afterward. In the span = 0.9 section, a high-intensity dipole noise source emerges on the back of the blade inlet. This is because, under the condition of low flow, the liquid flow enters the impeller near the hub and forms a vortex at the rim to block the liquid flow. With the rotation of the impeller, the vortexes in this area are constantly changing, thus generating noise. Meanwhile, under the condition of 0.8Qd, the increase of blade height influences the area of the sound source to decrease and then increase. Additionally, the dipole source at the outlet of the blade with Span = 0.9 section increases significantly, which could be attributable to the obvious flow in this area. At the 1.0Qd condition, the internal dipole noise is significantly reduced compared with other conditions which signifies that the flow state under this condition is the ultimate. Under 1.2Qd condition, there is no obvious change in the dipole source area with the increase of blade height. Under the same section, the dipole source area inside the guide vane firstly shows a decreasing trend and then increases with a higher flow rate. Finally, it reaches the lowest at the design condition. Under the condition of small flow, the flow inside the guide vane is turbulent, and the vortex also increases accordingly and changes continuously, which generates a dipole noise source. At the same flow rate, as the height of the guide vane increases, the dipole sound source at the guide vane outlet decreases. This could be due to when the guide vane collects the outflow from the impeller, a vortex is continuously formed on the side near the hub and falls off the vane outlet. In addition, the noise at the inlet of the guide vane tends to increase with the increase of the blade height. This is because the higher the blade height, the greater the circumferential velocity of liquid flow acting on it, and the more intense the internal vortex changes. It should be noted that when the circumferential velocity is eliminated, more high-dipole noise sources are also generated.

Quantitative Analysis of Vane Dipole Sound Source of Impeller and Guide Vane

Figure 13 presents the impeller blade surface under the different cross-sections of dipole source strength distribution. It is revealed that high intensity on the surface of the impeller blade under each traffic dipole source mainly emanates from the inlet. With the increase in flow rate, the maximum dipole source increases after the first decrease, which happens at the design condition of minimum and maximum under small flow conditions. This shows that the variation of vortices near the impeller blade is minimal under design conditions. The occurrence of high-intensity dipole sound source under 0.8Qd condition could be attributable to the variation frequency of vortices near the blade to the natural frequency of the blade. This occurrence, therefore, enhances the increase of the dipole sound source. At 0.6Qd, with the increase of blade height, the maximum value of the dipole sound source increases and then decreases. The maximum value is reached at span = 0.5 section, demonstrating that under this working condition, the dipole sound source generated by the most dramatic variation of the vortex at the cross-section position at the impeller blade inlet is the strongest. At 0.8Qd, with the increase of blade height, the maximum value of the dipole sound source decreases first and then increases and finally reaches the maximum at span = 0.5 section. This observation signifies that under this working condition, the variation of the vortex at the section near the rim position of the impeller blade inlet is the most dramatic with the dipole sound source being the strongest. The maximum value of the dipole sound source gradually increases and reaches the maximum at span = 0.9 with the increase of blade height which occurred at 1.0Qd and 1.2Qd flow conditions. This shows that under this condition, the dipole sound source generated by the vortex near the impeller blade entrance is the strongest.
Figure 14 depicts the guide surface under different cross-sections of dipole source strength distribution. Evidently, high intensity on the surface of the impeller blade under each traffic dipole source was mainly concentrated in the guide under plate, near the export and import. On the other hand, the dipole source of maximum and minimum design condition under small flow rate conditions reveals the largest guide vane indicating that operating at design condition, the change of the vortex intensity is minimal. At 0.6Qd, the maximum value of the dipole sound source appears at the outlet edge of the guide blade and increases gradually with the increase of blade height. It is also observed that the maximum value is reached at the span = 0.9 section, indicating that the dipole sound source recorded the strongest at the outlet of the guide blade near the wheel edge. At 0.8Qd and 1.0Qd flow conditions along with the increase of blade height, it was also revealed that the maximum value of the dipole sound source first increases and then decreases, and afterward, reaches the maximum at span = 0.5 which indicates that the vortex at the cross-section position at the inlet of guide blade becomes the most dramatic whilst the dipole sound source attains the strongest. At 1.2Qd with the increase of blade height, the maximum value of the dipole sound source gradually increases and reaches the maximum at span = 0.9 section, depicting the same pattern at 0.6Qd, 0.8Qd, and 1.2 Qd, subsequently.

5. Conclusions

This study thoroughly examines the sound source inside the axial flow pump and the area where the source of the high noise inside the pump emanates from multiple aspects. Meanwhile, the main work is summarized as follows:
(1)
According to the theory of the blade impact model, the impact damage of the model pump on the fish body was analyzed, and the impact probability, impact mortality, and mortality distribution of fish passing through the impeller blade under different working conditions were obtained.
(2)
The distribution rule of the areas below the pressure threshold, beyond the shear strain rate threshold and beyond the pressure gradient threshold in the impeller and under different working conditions were obtained. The findings however revealed that the areas below the pressure threshold in the impeller were commonly distributed at the back of the blade near the inlet. It is worth observing that the regions exceeding the shear strain rate threshold in the impeller are mainly distributed on the blade surface, hub surface, and rim surface. Meanwhile, the regions exceeding the pressure gradient threshold were mainly distributed near the blade inlet edge, the middle of the flow passage, and the blade outlet edge.
(3)
The unsteady characteristics of the volume in the region that is below the pressure threshold, above the shear strain rate threshold, and above the pressure gradient threshold in the impeller are extensively studied. The findings show that the volume exceeding the shear strain rate threshold in the impeller is periodic and related to the number of blades under various flow conditions. Firstly, with the increase of flow rate, the volume in the region below the pressure threshold decreases and then increases. Secondly the volume in the region above the shear strain rate threshold increases with the increase of flow rate. Thirdly, the volume in the region above the pressure gradient threshold increases first, and then decreases with the increase of flow rate.
(4)
Finally, the distribution area of the dipole sound source inside the impeller and guide vane changes with the increase of the blade height. Further, the dipole sound source inside the impeller and guide vane decreases first and then increases with the increase of the flow, attaining the lowest at the design condition. Meanwhile, when the impeller blade is closer to the guide blade, the dipole sound source at the exit of the impeller increases. Nonetheless, when the impeller blade is far away from the guide blade, the dipole sound source at this position gradually deteriorates.

Author Contributions

Conceptualization, F.Z.; Methodology, X.S.; Formal Analysis, K.A.A.-P.; Resources, J.Z.; Writing—Original Draft Preparation, L.Z.; Supervision, S.Y. All authors have read and agreed to the published version of the manuscript.

Funding

This research was supported by the National Natural Science Foundation of China (Grant No. 51922065), the International Science and Technology Cooperation Base of Fish Passage (Grant No. HIBF2020005).

Conflicts of Interest

Lufeng Zhu, Fan Zhang, Xiaotao Shi, Kofi Asamoah Adu-Poku, Jinfeng Zhang, and Shouqi Yuan declare that they have no conflict of interest or financial conflict to disclose.

References

  1. Song, X.J.; Liu, C. Experimental investigation of floor-attached vortex effects on the pressure pulsation at the bottom of the axial flow pump sump. Renew. Energy 2020, 145, 2327–2336. [Google Scholar] [CrossRef]
  2. Pan, Q.; Shi, W.D.; Zhang, D.S.; Esch, B.V.; Zhao, R.J. Fish-friendly design of an axial flow pump impeller based on a blade strike model. Proc. Inst. Mech. Eng. Part A J. Power Energy 2020, 234, 173–186. [Google Scholar] [CrossRef]
  3. Čada, G.F.; Loar, J.; Garrison, L.; Fisher, R.; Neitzel, D. Efforts to reduce mortality to hydroelectric turbine-passed fish: Locating and quantifying damaging shear stresses. Environ. Manag. 2006, 37, 898–906. [Google Scholar] [CrossRef] [PubMed]
  4. Frenkel, V.; Kimmel, E.Y.; Iger, Y. Ultrasound-induced cavitation damage to external epithelia of fish skin. Ultrasound Med. Biol. 1999, 25, 1295–1303. [Google Scholar] [CrossRef]
  5. Pan, Q.; Shi, W.D.; Zhang, D.S.; Zhao, R.J. Design and fish survival rate prediction of fish-friendly axial-flow pump for pumping stations. J. Drain. Irrig. Mach. Eng. 2017, 35, 42–49. [Google Scholar]
  6. Yang, D.D.; Zhao, M.X.; Ye, W.X.; Shen, L.; Luo, X.W. Numerical simulations of fish movement in axial pump using immersed boundary method. J. Hydroelectr. Eng. 2021, 40, 95–104. [Google Scholar]
  7. Deng, Z.Q.; Carlson, T.J.; Ploskey, G.R.; Richmond, M.C.; Dauble, D.D. Evaluation of blade-strike models for estimating the biological performance of Kaplan turbines. Ecol. Model. 2007, 208, 165–176. [Google Scholar] [CrossRef]
  8. Yang, C.X.; Zheng, Y.; Zhang, Y.Q.; Luo, H.Y. A Review of Research on the design of Fish-Friendly Hydraulic Turbines. Eng. Sci. 2018, 20, 96–101. [Google Scholar] [CrossRef]
  9. Long, X.P.; Xu, M.S.; Lyu, Q.; Zou, J.L. Impact of the internal flow in a jet fish pump on the fish. Ocean Eng. 2016, 126, 313–320. [Google Scholar] [CrossRef]
  10. Morgan, R.P.; Ulanowicz, R.E.; Rasin, V.J., Jr.; Noe, L.A.; Gray, G.B. Effects of shear on eggs and larvae of striped bass, Morone saxatilis, and White Perch, M. americana. Trans. Am. Fish. Soc. 1976, 105, 149–154. [Google Scholar] [CrossRef]
  11. Neitzel, D.A.; Richmond, M.C.; Dauble, D.D.; Mueller, R.P.; Moursund, R.A.; Abernethy, C.S. Laboratory Studies on the Erects of Shear on Fishers; Pacific Northwest National Laboratory (PNNL): Richland, WA, USA, 2000. [Google Scholar]
  12. Neitzel, D.A.; Dauble, D.D.; Čada, G.F.; Richmond, M.C.; Guensch, G.R.; Mueller, R.P.; Abernethy, C.S.; Amidan, B. Survival estimates for juvenile fish subjected to a laboratory-generated shear environment. Trans. Am. Fish. Soc. 2004, 133, 447–454. [Google Scholar] [CrossRef]
  13. Čada, G.F. A review of studies relating to the effects of propeller-type turbine passage on fish early life stages. N. Am. J. Fish Manag. 1990, 10, 418–426. [Google Scholar] [CrossRef]
  14. Zhu, G.J.; Ji, L.J.; Feng, J.J.; Luo, X.Q. Probability evaluation of pressure and shear damage for fish passing through francis turbine runner. Trans. Chin. Soc. Agric. Eng. 2019, 35, 55–66. [Google Scholar]
  15. Graham, A.L.; Cooke, S.J. The effects of noise disturbance from various recreational boating activities common to inland waters on the cardiac physiology of a freshwater fish, the largemouth bass (Micropterus salmoides). Aquat. Conserv. Mar. Freshw. Ecosyst. 2008, 18, 1315–1324. [Google Scholar] [CrossRef]
  16. Simpson, S.D.; Purser, J.; Radford, A.N. Anthropogenic noise compromises antipredator behaviour in European eels. Glob. Chang. Biol. 2015, 21, 586–593. [Google Scholar] [CrossRef] [Green Version]
  17. Sverdrup, A. Effects of experimental seismic shock on vasoactivity of arteries, integrity of the vascular endothelium and on primary stress hormones of the Atlantic salmon. J. Fish Biol. 2010, 45, 973–995. [Google Scholar] [CrossRef]
  18. Wardle, C.S.; Carter, T.J.; Urquhart, G.G.; Johnstone, A.D.; Ziolkowski, A.M.; Hampson, G.; Mackie, D. Effects of seismic air guns on marine fish. Cont. Shelf Res. 2001, 21, 1005–1027. [Google Scholar] [CrossRef]
  19. Popper, A.N.; Hastings, M.C. The effects of anthropogenic sources of sound on fishes. J. Fish Biol. 2009, 75, 455–489. [Google Scholar] [CrossRef]
  20. Wilcox, D.C. Comparison of two-equation turbulence models for boundary layers with pressure gradient. AIAA J. 1993, 31, 1414–1421. [Google Scholar] [CrossRef]
  21. Van Esch, B.P.M. Fish injury and mortality during passage through pumping stations. J. Fluids Eng.-Trans. ASME 2012, 134, 071302. [Google Scholar] [CrossRef]
  22. Shao, Q.; Li, H.F.; Wu, Y.L.; Chen, J.F. Simulating experiment on fish damage caused by the pressure gradient in hydraulic machinery. Chin. J. Mech. Eng. 2002, 38, 7–11. [Google Scholar] [CrossRef]
  23. Stewart, J. Capture depth related mortality of discarded snapper (Pagrus auratus) and implications for management. Fish Res. 2008, 89, 289–295. [Google Scholar] [CrossRef]
  24. Bouck, G. Etiology of gas bubble disease. Trans. Am. Fish. Soc. 1980, 109, 703–707. [Google Scholar] [CrossRef]
  25. Brown, R.S.; Carlson, T.J.; Gingerich, A.J.; Stephenson, J.R.; Pflugrath, B.D.; Welch, A.E.; Langeslay, M.J.; Ahmann, M.L.; Johnson, R.L.; Skalski, J.R.; et al. Quantifying mortal injury of juvenile chinook salmon exposed to simulated hydro-turbine passage. Trans. Am. Fish. Soc. 2012, 141, 147–157. [Google Scholar] [CrossRef]
  26. Deng, Z.; Guensch, G.R.; McKinstry, C.A.; Mueller, R.P.; Dauble, D.D.; Richmond, M.C. Evaluation of fish-injury mechanisms during exposure to turbulent shear flow. Can. J. Fish. Aquat. Sci. 2005, 62, 1513–1522. [Google Scholar] [CrossRef]
  27. Xu, M.; Long, X.; Mou, J.; Wu, D.; Zhou, P.; Gu, Y. Impact of pressure gradients on fish scales in a jet fish pump. Biosyst. Eng. 2020, 191, 27–34. [Google Scholar] [CrossRef]
  28. Wang, Y.G.; Huang, X.S.; Wei, W.; Yang, Z.G. Aerodynamic Noise Optimization of Vehicle’s A-pillar Based on Vortex Sound Theory. Noise Vib. Control 2017, 37, 107–112. [Google Scholar]
Figure 1. 3D model of the axial flow pump.
Processes 10 02228 g001
Figure 2. Mesh of the axial flow pump.
Processes 10 02228 g002
Figure 3. The experimental diagram.
Processes 10 02228 g003
Figure 4. Pth, fmr, and Pm data analysis diagram corresponding to fish length of 50 mm. (a) Impellers impact probability under different working conditions. (b) Cutting probability of impeller under different working conditions. (c) Fish mortality under different working conditions.
Processes 10 02228 g004
Figure 5. The area below the pressure threshold in the impeller.
Processes 10 02228 g005
Figure 6. Pressure distribution of different blade heights below the threshold at different flow rates. (The blue area is below the pressure threshold and The red area is above the pressure threshold).
Processes 10 02228 g006
Figure 7. The area of sheer strain rate exceeding the threshold in the impeller.
Processes 10 02228 g007
Figure 8. The distribution of sheer strain rate exceeding the threshold in impeller at different flow rates. (The red area is above the sheer strain rate threshold and The blue area is below the sheer strain rate threshold).
Processes 10 02228 g008
Figure 9. Area of sheer stress exceeding the threshold in the impeller.
Processes 10 02228 g009
Figure 10. The distribution of pressure gradient exceeding threshold in impeller at different flow rates. (The red area is above the pressure gradient threshold and The blue area is below the pressure gradient threshold.).
Processes 10 02228 g010
Figure 11. Variation diagram of damage source area in impeller with time at different flow rates.
Processes 10 02228 g011
Figure 12. Dipole source distribution in the impeller and guide vane.
Processes 10 02228 g012aProcesses 10 02228 g012b
Figure 13. Dipole source distribution on the impeller blade surface.
Processes 10 02228 g013
Figure 14. Dipole source distribution on guide vane surface.
Processes 10 02228 g014aProcesses 10 02228 g014b
Table 1. Grid independence analysis.
Grid Number (×106)Efficiency (%)
6.8378.6
8.280.6
9.8480.0
11.880.1
Table 2. Comparison of numerical simulation and experimental results.
Flow Rate0.6Qd0.8Qd1.0Qd1.2Qd
Experiment head (m)8.2467.0814.9470.970
Simulation head (m)9.1007.2005.0301.190
ΔH (m)0.8540.1190.0830.220
Experiment efficiency (%)62.75074.44078.7040.40
Simulation efficiency (%)63.56075.99079.06042.690
Δη (%)0.8101.5500.3602.290
Publisher’s Note: MDPI stays neutral with regard to jurisdictional claims in published maps and institutional affiliations.

