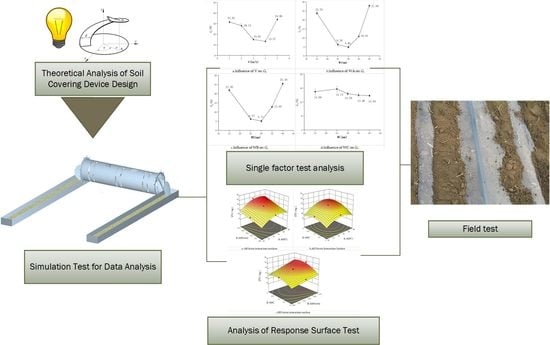
1. Introduction
As the main planting technology of crops in the arid areas of northern China, plastic film mulching cultivation technology is widely used for cotton, wheat, corn, peanut and other crops [
1,
2]. Plastic film mulching plays an important role in increasing temperature, preserving soil moisture and improving soil water and heat conditions [
3]. It is considered to be the key reason for the significant increase in crops in arid areas [
4]. As the main crop in Xinjiang, cotton has been planted since the introduction of plastic film cultivation technology by the Xinjiang Construction Corps in the 1980s, and the yield has increased significantly [
4,
5]. As a key link in the sowing stage of plastic film cultivation, soil mulching operation directly affects the sowing depth, plant spacing and distribution of seeds, as well as affecting the seed emergence rate and crop yield [
6,
7].
At present, under the planting mode of film mulching and soil mulching on film, the ordinary soil disc cannot meet the planting requirements [
3]. The common soil mulching device on film generally adopts the combination of a soil disc and cylindrical sealer for soil mulching. The lateral length of the mainstream soil mulching device on the market is 125 cm, which can cover 4 rows of seeds at one time. In this mode, the soil transport distance is short and will not accumulate in large quantities inside the device [
8]. In order to increase the working efficiency of the seeder and improve the heat preservation and moisture retention performance of film mulching, an ultra-wide film seeding machine was developed. The film width reached more than 200 cm, and the soil mulching device matched with the machine could cover 6 rows of seeds at one time [
9]. The lateral length reached 205 cm, but the soil transport capacity and soil coverage uniformity of the soil mulching device were reduced after the length was increased. Studies have shown that the soil covered on the seeds should be between 1 and 1.5 cm [
10]. If the soil coverage is too thin, then it is easy to expose the seeds. If the coverage is too thick, then it is easy to form a soil crust in the event of rain [
11]. At the same time, uneven soil coverage of each row of seeds will cause inconsistent growth of a crop’s plants [
12,
13]. The above conditions are not conducive to the emergence of cotton seeds. We developed a reasonable design according to the practical problems of ultra-wide film soil mulching device. The main research contents include adjusting the parameters of the soil mulching device and analyzing the soil transport process in the device operation. Finally, the soil mulching device which meets the working requirements and solves the practical problems is obtained.
The discrete element method (DEM) simulation aims to decompose the granular material into relatively independent units [
14,
15,
16,
17] and simulate the interaction and motion process of each unit by setting relevant parameters. The DEM has been widely used in the field of agricultural mechanization [
18,
19,
20]. Xu et al. [
21] used the DEM and multi-body dynamics to simulate the soil coverage and compaction process. The analysis model of soybean sowing was established. Sun et al. [
22] used the DEM to simulate the interaction process between a bionic subsoiling tool and ordinary soil. They designed simulation experiments to reduce the resistance of subsoiling tools. Tong et al. [
23] established a simulation model of the interaction between a subsoiler and subsoil using the DEM. They studied the forces of deep loosening shovels at microscopic angles. Bangura et al. [
24] studied the uniformity and removal rate of fertilizer accumulation. They used the DEM to set up a simulation model to simulate the fertilizer dispenser. This approach allowed them to better compare the differences between different fertilizer dispensers. Through the research of other scholars on the DEM, we found that the DEM can simulate particulate matter well. Compared with complex field experiments, the DEM can reduce the cost of experimental research. Therefore, we use theoretical analysis and the DEM to complete the design and parameter optimization of a soil mulching device.
In the first section of this paper, we analyze the characteristics of the ultra-wide film planting mode, and the structure of the soil mulching device is described. In the second section, we establish the mechanical model of the soil mulching device through the analysis of a mechanical model to determine whether the parameters have an impact on the working effect of the device. However, the idealized mathematical model cannot accurately predict the actual performance of the device, and an experimental study is necessary. In the third section, we use the DEM to conduct the experiment. In this paper, the DEM is used to simulate the working process of a covering device in the field and analyze the specific transport process of soil. We design single-factor and multi-factor experiments on the device and complete the parameter optimization of the device in the numerical simulation environment. We design single-factor and multi-factor experiments in a simulation environment and analyze the experiments’ data to complete the parameter optimization of the device. In the fourth section, we use field experiments to verify the simulation results. The fifth section draws the conclusions.
2. Structure and Principle of Operation
2.1. Principle of Design
Based on the ultra-wide film cotton planting pattern adopted in northern Xinjiang in China, shown in
Figure 1, and the related agronomic requirements of the coated soil, a soil mulching device under the ultra-wide film planting pattern was designed. It was required that the soil lifting, horizontal soil delivery and intensive soil coating of the planting line could be completed at one time so as to further improve the accuracy of mechanized operation in the cotton planting soil stage and reduce the amount of manual labor.
2.2. Structure Composition and Working Principle
As shown in
Figure 2, the soil mulching device was mainly composed of a soil disc, cylindrical sealer and device rack. A soil mulching device of this structure can realize one-time soil lifting, lateral soil delivery and soil covering. The cylindrical sealer was composed of a spiral soil guide plate, regulating ring and driving tooth, which was installed on the connecting ear seat of the back-end frame of the seeder and powered by the traction mechanism in front of the seeder. A soil disc with a certain inclination angle is used to cut the soil, and the soil on both sides of the film is thrown into the cylindrical sealer. Under the action of the traction force and friction force, the cylindrical sealer rolls and rotates with the advance of the seeder. The film is pressed into the soil by the driving tooth, and the soil is transported to the leakage mouth. The soil is finely broken and uniformly covered on the surface of various rows to complete the soil covering operation.
3. Design and Experimental Study of the Main Parameters
3.1. Design of the Soil Disc
The main function of the soil disc is to provide soil to cover the edge of the film and transport the soil source for the cylindrical sealer. Because its working process is realized by traction, soil resistance and friction, it was necessary to design and select its working depth and angle parameters.
In order to ensure that the soil film could be pressed by enough soil and provide enough soil for the cylindrical sealer to carry out the soil covering operation, the operation depth and angle of the soil disc should be adjusted. If the operation depth is too small, then it cannot provide enough soil for operation. If the operation depth is too large, then the operation resistance will be doubled, which will cause additional power consumption. According to the previous design experience and repeated test verification, the soil disc diameter was 340 mm, the working angle was 35°, and the working depth was 6 cm. The soil disc was 35 mm away from the cylindrical sealer to prevent the soil disc from breaking through the film.
3.2. Design of the Cylindrical Sealer
The cylindrical sealer is mainly composed of several thin steel plates, and the structure is shown in
Figure 3. The main body is a hollow cylindrical drum with a symmetrical structure. The internal welding of the cylindrical sealer is a spiral soil guide plate with symmetrical and reverse sides. The axial length and angle of the soil guide plate are fixed. Six soil feed outlets were set on the surface of the drum according to the planting pattern of cotton with wide and narrow rows. The active adjustment circle was set on each side of the soil feed outlet to adjust its width. In order to increase the grip and pressing ability of the cylindrical sealer, driving teeth were distributed at both ends. Due to the large anisotropy of the soil properties in the actual operation, the soil impurities are prevented from blocking inside the cylindrical sealer. In the middle part of the cylindrical sealer, it is also necessary to set the outlet to ensure the continuous and stable operation of the cylindrical sealer. At the same time, considering the stability of the seeding unit in the covering soil operation process, the cylindrical sealer diameter was set to 450 mm in this design.
The cylindrical sealer is the key mechanism for transporting soil. Its seed soil cover operation needs to meet the requirements of a moderate soil thickness and uniform soil quality. During the operation, the cylindrical sealer is made by the traction device to roll forward. Depending on the inner wall of the soil guide plate, under the restriction of the soil feed outlet width, the cylindrical sealer transports an appropriate amount of soil to the soil feed outlet and covers the seed surface to complete the operation. Therefore, the soil transport capacity of the cylindrical sealer directly determines whether the soil thickness of the seed surface covers meets the requirements. The limiting effect of each soil feed outlet of the cylindrical sealer determines whether the soil quality of the seed surface cover is uniform or not.
Therefore, in the design of the cylindrical sealer, in order to achieve the ideal soil cover effect, it was necessary not only to analyze and optimize the structural parameters such as the angle of the soil guide vane, the number of installations and the axial length but also to optimize the operating parameters.
3.3. Basic Conditions for Soil Transport
The cylindrical sealer’s soil transport capacity is inseparable from its soil guide plate. In order to obtain the basic conditions of the cylindrical sealer’s soil transport, it is necessary to carry out mechanical analysis of the soil guide plate. The specific process is as follows: when the soil guide plate, shown in
Figure 4, rotates clockwise in the cylindrical sealer on the ozy plane, the soil is squeezed from the right soil disc to the inside of the drum and starts from o with the movement of the soil guide plate, resulting in an axial movement from right to left. In order to realize the above movement mode of the soil, assuming that the soil is in the state of street sliding, it is mainly affected by the following three forces: the static friction force
F along the tangent direction of the soil guide plate, the support force
N perpendicular to the interface between the soil and the soil guide plate and the resultant force
G of the surrounding soil on its extrusion force and gravity, where the angle between the resultant force
G and the tangent direction of the soil guide plate is
β. Thus, a mechanical formula is established:
In the above equation,
φ is the friction angle between the soil and spiral conducting soil. In order to complete the set motion, the partial force of
G1 along the tangent direction of the spiral guide soil slice must be greater than its friction:
The angle of the soil guide plate reaches the maximum value at its inner diameter, so the design should meet Equation (3). According to the above analysis results, it is known that when the velocity of the soil on the guide plate reaches the maximum, it shows that the acceleration reaches the maximum, and the amount of soil transported by the guide plate reaches the maximum. Therefore, the differential equation of soil motion is established and solved:
According to the above analysis, when the cylindrical sealer’s soil guide plate satisfies Equation (7) in theory, the maximum soil transport can be achieved, and the optimum angle of the guide plate calculated by the soil friction angle is about 35°.
4. The Simulation Test of the Cylindrical Sealer Parameters
Due to the complex stress condition of the cylindrical sealer in actual operation, the design results could not be obtained by theoretical analysis alone. Based on the above theoretical analysis results, and combined with the usual design experience, the angle of the soil guide plate, the number of guide plate columns, the number of each column of the guide plate and the axial length of the adjacent guide plate were selected as the structural design parameters, and the forward speed of the cylindrical sealer and the width of each soil feed outlet were selected as the operating parameters. Taking the soil transport volume and soil cover uniformity of the cylindrical sealer as response values, the structural parameters of the cylindrical sealer were optimized by a single-factor test combined with a response surface experiment, and the optimal operating parameters were determined.
4.1. Construction of the Simulation Test Model
In the modeling of soil particles, the actual soil particle size is very small, and no specific shape is representative. The number of soil particles used in the simulation experiment was huge, which brought a heavy burden to the computer. In order to increase the computational efficiency of the simulation, we simplified the soil particles into a sphere. Many studies have shown that collecting actual soil in the field and measuring its physical parameters are also necessary. This helps to improve the accuracy of the simulation model [
25,
26,
27]. Through measurement of the soil’s physical parameters, we determined that the soil type in the experimental field was mainly sandy loam. The Hertz–Mindlin JKR contact model is suitable for the simulation of this type of soil [
28,
29]. There are many contact parameters between the particles and geometric models. It has been found that the rolling friction resistance and surface energy have a significant effect on the mechanical behavior of spherical particles [
30,
31]. Therefore, we conducted some preliminary experiments to calibrate the contact parameters between the soil particles and the geometric model. The parameters used in the simulation test are shown in
Table 1.
The three-dimensional model of the cylindrical sealer was established by Solidworks software and imported into EDEM software. As shown in
Figure 5a, in order to ensure the reliability of the numerical simulation, the z-axis acceleration was set to 9.81 m/s
2, and the particle factory was set on both sides of the cylindrical sealer. The particle velocity generated by the factory was set to 2 kg/s, the simulation time was 10 s, and the simulation time step was determined to be 20%. At the post-treatment interface, a quality sensor was set up on each soil feed outlet to detect and count the soil quality change of the cylindrical sealer. We set the particle model as shown in
Figure 5a, and the diameter was 5 mm.
4.2. Single-Factor Experiment Research and Analysis
4.2.1. Single-Factor Test Study and Analysis of the Structural Parameters
In order to study the relationship between the structural parameters and the soil transport capacity of the cylindrical sealer, a single-factor experiment was designed with the angle of the soil guide plate (ASP), the number of guide plate columns (NPC), the number of each column of the guide plate (NECP) and the axial length of the same column of the guide plate (AXP) as the structural design parameters and the soil transport capacity as the index. The range of values is shown in
Table 2. According to the single-factor test design table, the single factor test was carried out with the soil transport volume (STV) as the response value. The test results are shown in
Figure 6.
It can be seen from
Figure 6a that when the guide plate angle was less than 35°, the soil transport increased with the increase in the guide plate angle, peaking at 35°. When the angle of the guide plate exceeded 35°, the soil transport volume began to decrease, which is consistent with the theoretical analysis results of the mechanical model of the spiral guide plate. Too small or too large of an angle for the guide plate was not conducive to increasing soil transport. In order to further study the interaction between the angle of the guide plate and other factors, 30°, 35° and 40° angles for the guide plate were selected as the three levels of response surface optimization.
Figure 6a shows that when the NPC was less than four, the soil transport capacity increased rapidly with the increase in the NPC. The main reason for this was that when the NPC increased, the guiding plate area of soil transport increased, and the capacity of soil transport increased. When the NPC exceeded four, the soil transport tended to be stable and decreased slightly. This may be because when the guiding plate area increased to a certain value, the soil transport capacity tended to be saturated. At the same time, due to the accumulation of soil, a part of the soil was accumulated on the guiding plate, which reduced the soil transport. Therefore, columns 3, 4 and 5 were selected as the three test levels for the NPC factor.
From
Figure 6c, it can be seen that with the increase of AXP, soil transport also increased, which was due to the increase in the AXP and the expansion of the guiding plate area of soil transport. When the axial length was 175 mm, the increase in soil transport was significantly different from that when the axial length was 145 mm, reaching 25.8%, and when the axial length was 200 mm, the increase in soil transport was only 4% compared with that when the axial length was 175 mm. According to the previous design experience, the appropriate reduction in the AXP was beneficial to the discharge of impurities such as residual film and residual branches in the soil, saving on production costs. Combined with the test results and the other two factors, we selected 145, 160 and 175 mm as the factor levels of the axial length.
Figure 6d shows that before the NECP reached five, the NECP and soil transport had a positive effect, and when the NECP reached five, soil transport reached its peak. By comparison, when the NECP was four, the difference in soil transport is obvious, and after increasing to more than five, the soil transport decreased. The possible influencing factors of this phenomenon were the increase in the NECP and the axial soil transport capacity being enhanced. After the NECP reached a value greater than five, the distance between the adjacent guide plates was reduced, the soil accumulation increased, the amount of soil discharged from the miscellaneous outlet increased, and the soil transport was reduced. To sum up, we select 5, 6 and 7 as the factor levels for each column number.
4.2.2. Single-Factor Test Study on the Operation Parameters and Analysis
Since the cylindrical sealer is a left-right symmetric structure, as shown in
Figure 3, the forward velocity of the cylindrical sealer (V) and (WA), B(WB) and C(WC) were selected as the operating parameters. The design of the single-factor tests is shown in
Table 3, and the coefficient of variation of the soil coating cover uniformity
G1 of each row is used as the index. The calculation method is as follows:
where
G1 is the coefficient of variation of the soil cover uniformity,
N is the number of seeding rows,
m1i is the soil coating mass of each row (in g) and
mi is the average soil coating mass of each row (in g).
It can be seen from
Figure 7a that the forward velocity had a significant indigenous effect on the coefficient of variation of the soil coating uniformity
G1. When the cylindrical sealer’s forward velocity was 3 km/h, compared with 2 km/h,
G1 decreased by 13 percentage points, and at a forward speed of 5 km/h,
G1 increased by about 21 percentage points compared with that at 4 km/h. The main reason for this phenomenon was that when the forward speed was low, the soil volume transported to soil feed outlets A and B was too large, and the guide plate could not transport enough soil to the middle soil feed outlet C, resulting in more soil cover on the sides and less soil cover in the middle. However, too high a forward speed would increase the rotation speed of the guide plate. In units of time, most of the soil was transported to the middle soil feed outlet C before it fell out of soil feed outlets A and B, and a large number of it accumulated in the middle part of the cylindrical sealer, resulting in the phenomenon that the soil coating cover quality was better in the middle and worse on the sides, resulting in a high
G1 value, which also reflects the influence of the forward speed on the total soil covering quality of the soil feed outlets on the sides.
It can be seen from
Figure 7b–d that soil feed outlets A and B had a significant indigenous effect on the uniformity of the soil coating cover. Since the interval between soil feed outlets A and B was 10 cm and were affected by the cylindrical sealer’s soil transport capacity and operation speed, the total soil quality of soil feed outlets A and B was certain in units of time. When the width of one soil feed outlet increased, the volume of the falling soil increased, and the soil cover quality of the other soil feed outlet would be reduced. At the same time, the falling soil quality of the soil cover C had little relationship with its width. Increasing the width of the soil feed outlet C was mainly to let the soil block of large particles fall and prevent accumulation inside.
In summary, for the operating speed, soil feed outlets A and B were selected as the operating parameters affecting the coefficient of variation of the soil cover uniformity G1 of the cylindrical sealer. The horizontal ranges of the parameters were 3–4 km/h, 25–35 mm and 25–35 mm, respectively.
4.3. Response Surface Test Analysis and Parameter Optimization
4.3.1. Response Surface Test of the Structural Parameters
The factors and factor levels of the response surface method could be determined by the single-factor test. ASP(A), AXP(B), NECP(C) and NPC(D) were selected as the optimization factors. The optimal value of each single-factor test was set as the central level, and the upper and lower regions were taken as the high and low levels, as shown in
Table 4. At the same time, the soil transport volume was used as the response value, and the Design-Expert software center combination test module was used. As shown in
Table 5, a response surface test with four factors and two levels was designed. After the test was completed, response surface analysis of the test results was carried out.
In summary, the experimental model had high prediction accuracy, good reliability and strong fitting, which met the requirements of the subsequent analysis. Data based on
Table 6, the
p value of the variance source was further analyzed. Among them,
p < 0.0001, and the following factors had significant influence on the test results: A (ASP), B (AXP), D (NPC), AD (interaction between ASP and NPC), BD (interaction between AXP and NPC), A
2 (quadratic term of NPC), C
2 (quadratic term of NECP) and D
2 (quadratic term of NPC). When
p < 0.05, the following factor had significant influence on the test results: AB (the interaction between ASP and AXP).
4.3.2. Response Zone Analysis and Factor Optimization
The response surface graph drawn by the above quadratic regression equation is a three-dimensional space surface obtained by the interaction of various parameter factors which reflects the interaction of various test factors with the response value and can predict the change in response value under the influence of the variables. The following graph mainly analyzes the influence and change trend of the two factors and their interaction with the response value of the soil transport volume when the two factors were fixed in the four-factor test model.
It can be seen from
Figure 8, combined with the regression analysis results of the quadratic model, that the interaction surface of the AD factor changed significantly. With the increase in the guide plate angle and the number of guide plate columns, the soil transportation increased first and then decreased, and its interaction had the greatest impact on soil transportation. The interaction effect of the BD factor took second place, but the surface change was not obvious. The main reason for this was that with the increase in the number of guide plates, the soil accumulated between the adjacent guide plates, and the soil transportation was reduced. Although the soil transportation was increased with the increase in the axial length of the guide plate, the comprehensive effect of the two factors made the change characteristics of the soil transportation quality not so obvious. The AB factor’s interaction was the weakest.
In summary, the soil transport of the cylindrical sealer was not only related to the angle of the guide plate, but the axial length of the guide plate and the number of columns of the guide plate also had an important impact on the cylindrical sealer. In the actual operation process of the cylindrical sealer, the accumulation effect of residual film and residual branches in the field should also be considered such that the fewer the number of guide plates, the better it is. Using the parameter factor optimization module in Design-Expert software, with the maximum soil transport volume as the optimization goal, the number of guide plate columns was set to 4 and 5 as the target values, and the value of the factor was solved in the horizontal range. Thirteen groups of solutions (guide plate angle = 37.40°, axial length = 175 mm and number of guide plate columns = 5) and 29 groups of solutions (guide plate angle = 38.52°, axial length = 174.4 mm and number of guide plate columns = 5) were obtained, and the predicted soil transport volume was 18.290 and 18.921, respectively. Two groups of solutions with the highest satisfaction were selected for experimental verification. The experimental verification results are shown in
Table 7, and the error between the experimental value and the predicted value was less than 5%, which indicates that the experimental model is reliable. The soil quality increased by 2.34% when the number of soil guide vanes was 5 compared with that when the number of soil guide vanes was 4. In order to reduce the influence of soil residual film and branches in actual production, the number of columns was 4, the angle of the soil guide vanes was 37.40°, the axial length was 175 mm, and the number of each column’s soil guide vanes was 5.
4.4. Response Surface Test of the Operating Parameters
The above single-factor tests could determine the factors and factor levels of the response surface test method. V (E), WA (F) and WB (H) were selected as the optimization factors. Combined with the test principle, the optimal value of each single-factor test was set as the central level, and the high- and low-level values were taken in the upper and lower regions, as shown in
Table 8. At the same time, the coefficient of variation of the soil coating uniformity
G1 was used as the response value, and the test steps were consistent with the response surface test of the structural parameters.
We analyze and optimize the results of
G1 model quadratic regression equation. Design-Expert software was used to analyze the test scheme and results, and the quadratic regression equation of the coefficient of variation for the
G1 model was constructed:
The test design and data for the
G1 model are shown in
Table 9.
Table 10 shows the variance analysis of the coefficient of variation in the
G1 model. Combined with the experimental analysis results of this subject, the F-value test of the model was 45.24, the
p value was <0.0001 for the experimental model, meaning it was extremely significant, and the mismatch term was 0.0891, indicating that the fitting degree of the experimental model was high. The coefficient of determination of the experimental model was 0.9725, the corrected coefficient of determination was 0.9478, and the predicted coefficient of determination was 0.8210. The coefficient of determination and the corrected coefficient of determination were close to one, indicating that the experimental model was reliable. At the same time, the difference between the corrected coefficient of determination and the predicted coefficient of determination was less than 0.2. It can be seen that the overall test model met the prediction requirements, and the signal-to-noise ratio was 18.9911, which was far greater than the signal-to-noise ratio threshold of 4, reflecting the high accuracy of the test model and a good prediction effect.
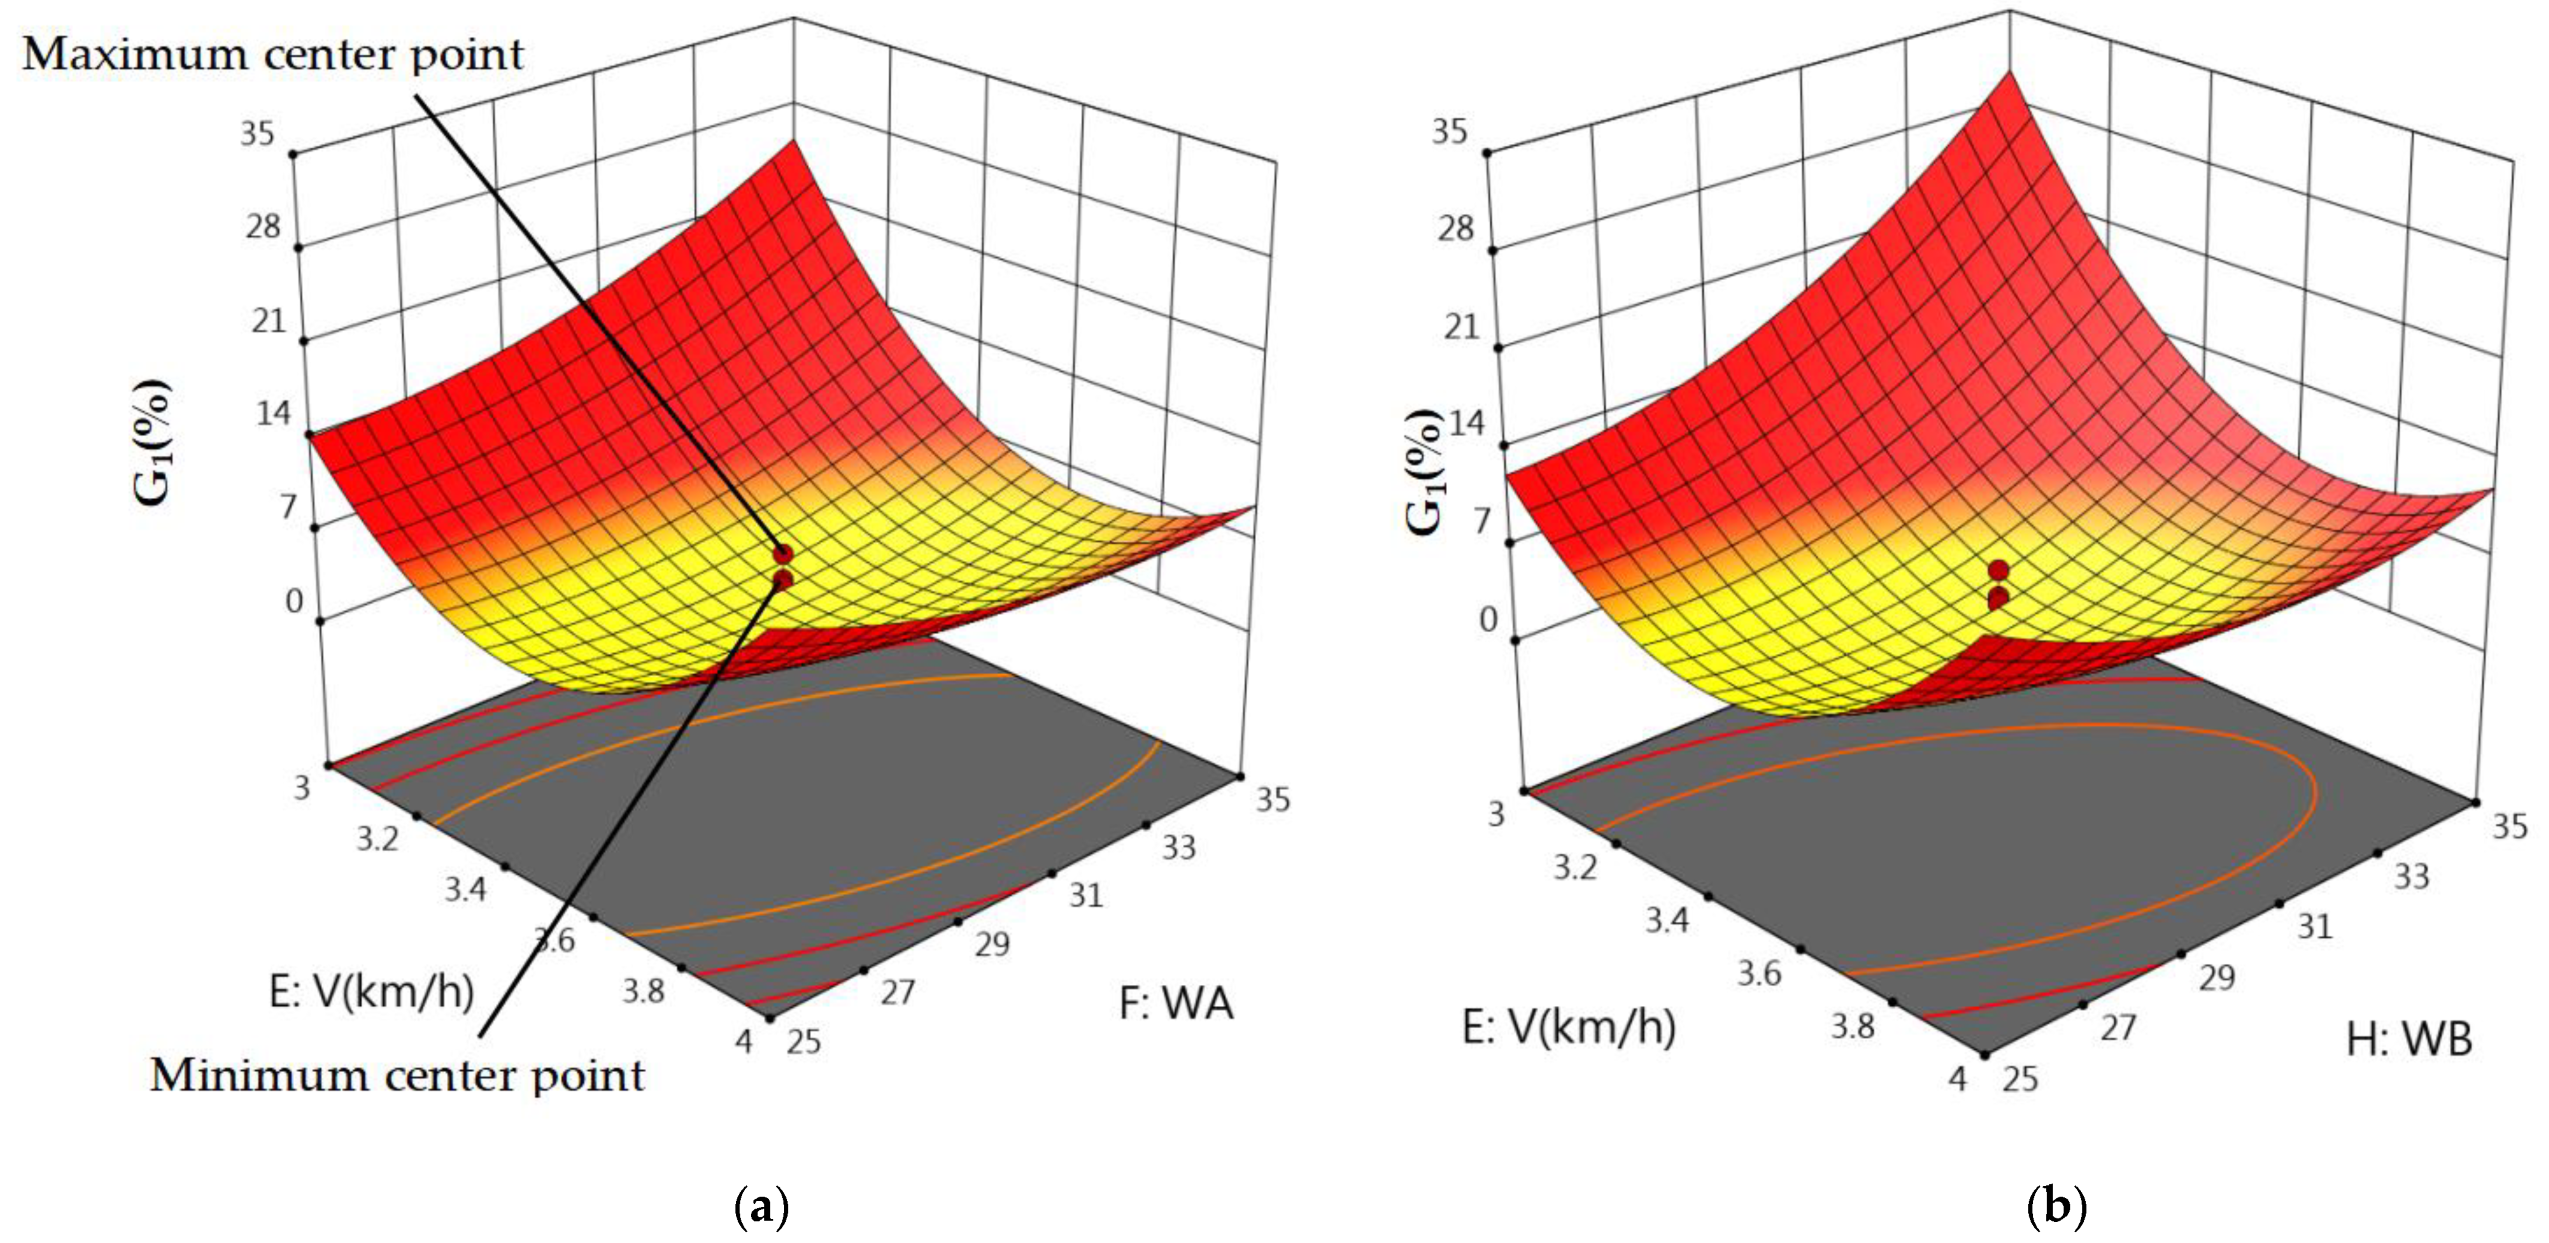
The p value of the variance source was further analyzed from the data results, in which the p value was less than 0.0001. The following factors had extremely significant influence on the test results: E (V), F (WA), H (WB), EF (the interaction between V and WA), EH (the interaction between V and WB), E2 (the quadratic term of V), F2 (the quadratic term of WA) and H2 (the quadratic term of WB).
When the coefficient of variation
G1 was >15, the thickness of the soil in each row was highly uneven, and the smaller the coefficient of variation, the more consistent the thickness of the soil in each row. From the analysis of
Figure 9, combined with the quadratic model, it can be concluded that the interaction between the EF and EH factors was extremely significant, reflecting that the operation speed and the width of the soil feed outlet were too small or too large, which would have an adverse effect on the uniformity of the soil. When the operation speed was small, the soil could not be transported in time, and the width of soil feed outlet A would increase the amount of the soil. The soil leakage volume of the remaining soil feed outlet was reduced. When the operating speed was high, the lateral transport speed of the soil increased. Increasing the width of the soil feed outlet B would significantly increase the amount of soil discharged from the outlet. The comprehensive superposition of the operating speed and the width of the soil feed outlet made their interaction surface characteristics obvious. In order to reduce the soil thickness gap between the rows, the minimum value of the coefficient of variation
G1 was taken as the solution target, and the operating parameters were optimized. A set of solutions with the highest reliability (operating speed = 3.503 km/h, soil feed outlet A width = 28.90 mm and soil feed outlet B width = 27.90 mm) and with a predicted value of 2.771% was selected for three experiments. The average coefficient of variation
G1 was 2.69%. The error between the actual measured coefficient of variation and the predicted value was less than 5%, and the test model was reliable.
5. Field Test
Based on the simulation results, the parameters of the soil disc were as follows: a working depth of 6 cm and a working angle of 35°. The structural parameters of the device were selected as follows: the number of columns was 4, the angle of the soil guide vanes was 37.40°, the axial length was 175 mm, and the number of soil guide vanes for each column was 5. The operating parameters were selected as follows: an operating speed of 3.503 km/h, soil feed outlet A’s width was 28.90 mm, and soil feed outlet B’s width was 27.90 mm. The device was pulled to the test field, and the operation speed was adjusted to 3.5 km/h. As shown in
Figure 10, three sections of the operation section with a length of 2 m were selected for each interval of 3.5 m. The soil of each row was collected and weighed. The test was repeated three times, and the average value was taken. The average thickness of the soil cover was based on Equation (9). The test design and data table are shown in
Figure 10 and
Table 11, respectively.
In this formula, h is the average thickness, m is the soil quality, w is the width of each row, and l is the length of the working section.
According to the field test results, it can be concluded that the soil coverage thickness of the designed soil coverage device was between 1.42 and 1.50 cm, and the uneven coefficient of variation was 2.59%, which was only 1 percentage point different from the simulation test results. The simulation test was close to the field test results, and the soil coverage thickness and coefficient of variation met the design requirements.
6. Conclusions
In this paper, the working process of a soil mulching device was analyzed theoretically. Combined with discrete element simulation, the transportation process of soil particles in the operation of a soil mulching device was simulated, and the parameters of the soil covering roller were analyzed by single-factor testing. The structural parameters of the guide plate angle, the number of guide plate columns, the number of guide plate columns and the axial length of the cylindrical sealer were determined. We selected the operating speed, soil feed out A and soil feed out B as the cylindrical sealer operating parameters.
Through the response surface test, the parameters of the soil mulching device were analyzed with the soil transport capacity and soil covering uniformity as the response values, and five groups of interaction parameters were obtained. Then, we used the parameter optimization module in the Design-Expert software to optimize the parameters. Finally, the diameter of the soil disc in the soil mulching device was determined to be 340 mm, the working depth was 6 cm, and the installation angle was 35°. The column number of the cylindrical sealer was 4, the angle of the guide plate was 37.40°, the axial length was 175 mm, the number of guide plates per column was 5, the working speed was 3.503 km/h, the width of soil feed outlet A was 28.90 mm, and the width of soil feed outlet B was 27.90 mm.
In order to verify the reliability of the whole design process, we carried out simulation test verification and field test verification. The final result was that the soil coverage thickness was between 1.42 cm and 1.50 cm, and the soil unevenness coefficient of variation G1 was 2.59%. The test verification results show that the soil coverage device designed based on theoretical analysis and discrete element simulation testing met the design requirements.
Author Contributions
Conceptualization, Y.W. and M.W.; software, Y.W. and C.H.; validation, W.D., Y.W. and Z.J.; resources, Y.W.; data curation, W.L. and J.H.; writing—original draft preparation, Y.W.; writing—review and editing, Y.W. and M.W.; project administration, M.W.; funding acquisition, W.L. All authors have read and agreed to the published version of the manuscript.
Funding
This research was funded by Science and Technology Project of Xinjiang Construction Corps, grant number 2020AB002.
Institutional Review Board Statement
Not applicable.
Informed Consent Statement
Not applicable.
Data Availability Statement
All relevant data presented in the article are stored according to institutional requirements and, as such, are not available online. However, all data used in this manuscript can be made available upon request to the authors.
Conflicts of Interest
The authors declare no conflict of interest.
References
- Du, S.; Bai, G. Soil Environmental Effects of Corn Mulching. Agric. Res. Dry Areas 2007, 5, 56–59. [Google Scholar]
- Yang, Y.; Liu, X.; Sun, H.; Li, W. Ecological Effects of Mulching Cultivation of Upland Rice in Summer. Agric. Res. Dry Areas 2000, 3, 50–54. [Google Scholar]
- Ning, S.; Zuo, Q.; Shi, J.; Wang, S.; Liu, Z. Water use efficiency and benefit for typical planting modes of drip-irrigated cotton under film in Xinjiang. Nongye Gongcheng Xuebao 2013, 29, 90–99. [Google Scholar]
- Wu, J.; Chen, X. The problems and countermeasures of cotton production mechanization development in Xinjiang Corps. Nongye Gongcheng Xuebao 2015, 31, 5–10. [Google Scholar]
- Wu, C. Analysis of Cotton Industry Status and Mechanization Development in China. Chin. J. Agric. Mach. Chem. 2021, 42, 215–221. [Google Scholar]
- Zhang, Z.; Sun, X.; Jin, Z.; Bing, Z.; Sun, J.; Tong, J. Design and Test of Crushing Bionic soil mulching device of Soybean Seeder. Nongye Jixie Xuebao 2018, 49, 34–40+73. [Google Scholar]
- Feng, L.; Dai, J.; Tian, L.; Zhang, H.; Li, W.; Dong, H. Review of the technology for high-yielding and efficient cotton cultivation in the northwest inland cotton-growin8g region of China. Field Crops Res. 2017, 208, 18–26. [Google Scholar] [CrossRef]
- Dong, W.; Zhang, L.; Li, W.; Yu, S.; Wang, Y. Xinjiang Cotton Planting Machinery Application Status and Development Trend. Xinjiang Agric. Mech. 2021, 2, 11–15. [Google Scholar]
- Lu, Z.; Li, X.; Zhang, W.; Zheng, J.; Liang, F.; Yang, D.; Tian, J.; Gao, G.; Wang, J. Growing Cotton in China//Pest Management in Cotton: A Global Perspective; CABI: Wallingford, UK, 2022; pp. 80–100. [Google Scholar]
- Lin, J.; Tai, H.; Lian, W.; Lu, J.; Hu, S.; Chen, G.; Wan, S. Effects of different sowing depths on cotton seedling size, yield and quality. Xinjiang Agric. Sci. 2016, 53, 2225–2231. [Google Scholar]
- Bilbro, J.; Wanjura, D. Soil crusts and cotton emergence relationships. Trans. ASAE 1982, 25, 1484–1487. [Google Scholar] [CrossRef]
- Chen, L.; Hu, J.; Hu, D.; Lei, Y.; Lai, X.; He, Q. Effects of soil covering thickness on the yield and quality of bamboo shoots. Bamboo J. 2021, 40, 75–80. [Google Scholar]
- Guo, L.; Ji, P.; Sun, H.; Shi, S.; Xie, J. Analysis of the effect of soil thickness on the growth of urban garden plants. Chin. Gard. 2022, 38, 112–117. [Google Scholar]
- Sadeghi-Chahardeh, A.; Mollaabbasi, R.; Picard, D.; Taghavi, S.M.; Alamdari, H. Discrete element method modeling for the failure analysis of dry mono-size coke aggregates. Materials 2021, 14, 2174. [Google Scholar] [CrossRef]
- Syed, Z.; Tekeste, M.; White, D. A coupled sliding and rolling friction model for DEM calibration. J. Terramechanics 2017, 72, 9–20. [Google Scholar] [CrossRef]
- Nadimi, S.; Fonseca, J. A micro finite-element model for soil behaviour. Géotechnique 2018, 68, 290–302. [Google Scholar] [CrossRef] [Green Version]
- Liu, X.; Zhou, A.; Shen, S.; Li, J.; Sheng, D. A micro-mechanical model for unsaturated soils based on DEM. CM Appl. Mech. Eng. 2020, 368, 113183. [Google Scholar] [CrossRef]
- Zhao, H.; Huang, Y.; Liu, Z.; Liu, W.; Zheng, Z. Applications of Discrete Element Method in the Research of Agricultural Machinery: A Review. Agriculture 2021, 11, 425. [Google Scholar] [CrossRef]
- Shi, R.; Zhao, W.; Shun, W. Discrete Element Based Soil Particle Contact Model and Parameter Calibration for Croplands in Arid Northwest China. Nongye Gongcheng Xuebao 2017, 33, 181–187. [Google Scholar]
- Liu, K.Y.; Su, H.J.; Li, F.Y.; Jiao, W. Parameter calibration of soil discrete element model based on response surface method. J. Chin. Agric. Mach. 2021, 42, 143–149. [Google Scholar]
- Xu, T.; Zhang, R.; Wang, Y.; Jiang, X.; Feng, W.; Wang, J. Simulation and Analysis of the Working Process of Soil Covering and Compacting of Precision Seeding Units Based on the Coupling Model of DEM with MBD. Processes 2022, 10, 1103. [Google Scholar] [CrossRef]
- Sun, J.; Wang, Y.; Ma, Y.; Tong, J.; Zhang, Z. DEM simulation of bionic subsoilers (tillage depth> 40 cm) with drag reduction and lower soil disturbance characteristics. Adv. Eng. Softw. 2018, 119, 30–37. [Google Scholar] [CrossRef]
- Tong, J.; Jiang, X.; Wang, Y.; Ma, Y.; Li, J.; Sun, J. Tillage force and disturbance characteristics of different geometric-shaped subsoilers via DEM. Adv. Manuf. 2022, 8, 392–404. [Google Scholar] [CrossRef]
- Bangura, K.; Gong, H.; Deng, R.; Tao, M.; Liu, C.; Cai, Y.; Qi, L. Simulation analysis of fertilizer discharge process using the Discrete Element Method (DEM). PLoS ONE 2020, 15, e0235872. [Google Scholar] [CrossRef] [PubMed]
- Wang, X.; Hu, H.; Wang, Q.; Li, H.; He, J.; Chen, W. Calibration method of soil contact characteristic parameters based on DEM theory. Nongye Jixie Xuebao 2017, 48, 78–85. [Google Scholar]
- Mak, J.; Chen, Y.; Sadek, M. Determining parameters of a discrete element model for soil–tool interaction. Soil Tillage Res. 2012, 118, 117–122. [Google Scholar] [CrossRef]
- Liu, T.; Zhou, J.; Liang, L.; Bai, Z.; Zhao, Y. A systematic calibration and validating method for lunar soil DEM model. Adv. Space Res. 2021, 68, 3925–3942. [Google Scholar] [CrossRef]
- Xing, J.; Zhang, R.; Wu, P.; Zhang, X.; Dong, X.; Chen, Y.; Ru, S. Parameter calibration of particle discrete element simulation model of latosol in tropical Hainan. Nongye Gongcheng Xuebao 2020, 36, 158–166. [Google Scholar]
- Qiu, Y.; Guo, Z.; Jin, X.; Zhang, P.; Si, S.; Guo, F. Calibration and Verification Test of Cinnamon Soil Simulation Parameters Based on Discrete Element Method. Agriculture 2022, 12, 1082. [Google Scholar] [CrossRef]
- Zhou, J.; Zhang, L.; Hu, C.; Li, Z.; Tang, J.; Mao, K.; Wang, X. Calibration of wet sand and gravel particles based on JKR contact model. Powder Technol. 2020, 397, 117005. [Google Scholar] [CrossRef]
- Sadeghi-Chahardeh, A.; Mollaabbasi, R.; Picard, D.; Taghavi, S.M.; Alamdari, H. Effect of particle size distributions and shapes on the failure behavior of dry coke aggregates. Materials 2021, 14, 5558. [Google Scholar] [CrossRef]
Figure 1.
Ultra-wide film planting pattern of cotton.
Figure 1.
Ultra-wide film planting pattern of cotton.
Figure 2.
Device structure of soil mulching device.
Figure 2.
Device structure of soil mulching device.
Figure 3.
Structural diagram of earth covering roller.
Figure 3.
Structural diagram of earth covering roller.
Figure 4.
The stress model of the soil guide plate.
Figure 4.
The stress model of the soil guide plate.
Figure 5.
(a) Simulation model. (b) Particle model.
Figure 5.
(a) Simulation model. (b) Particle model.
Figure 6.
(a) Influence of ASP on STV. (b) Influence of NPC on STV. (c) Influence of AXP on STV. (d) Influence of NECP on STV.
Figure 6.
(a) Influence of ASP on STV. (b) Influence of NPC on STV. (c) Influence of AXP on STV. (d) Influence of NECP on STV.
Figure 7.
(a) Influence of V on G1. (b) Influence of WA on G1. (c) Influence of WB on G1.(d) Influence of WC on G1.
Figure 7.
(a) Influence of V on G1. (b) Influence of WA on G1. (c) Influence of WB on G1.(d) Influence of WC on G1.
Figure 8.
(a) AB factor interaction surfaces. (b) AD factor interaction surface. (c) BD factor interaction surface.
Figure 8.
(a) AB factor interaction surfaces. (b) AD factor interaction surface. (c) BD factor interaction surface.
Figure 9.
(a) EF factor interaction surface. (b) EH factor interaction surface.
Figure 9.
(a) EF factor interaction surface. (b) EH factor interaction surface.
Figure 10.
Field test diagram.
Figure 10.
Field test diagram.
Table 1.
Contact parameters of simulation model.
Table 1.
Contact parameters of simulation model.
| Item | Parameter | Numerical Value |
|---|
| Soil particle | Density | 2.369 g/cm3 |
| Shear modulus | 1.2 × 10⁶ |
| Poisson ‘s ratio | 0.39 |
| Restitution coefficient | 0.5 |
| Static friction coefficient | 0.5 |
| Rolling friction coefficient | 0.093 |
| Surface energy | 2.73 J/m−2 |
| Geometry model | Density | 7.86 g/cm3 |
| Shear modulus | 7 × 10¹⁰ |
| Poisson ‘s ratio | 0.3 |
| Restitution coefficient | 0.5 |
| Static friction coefficient | 0.5 |
| Rolling friction coefficient | 0.155 |
Table 2.
Single-factor experimental design of structural parameters.
Table 2.
Single-factor experimental design of structural parameters.
| | Structural Parameters |
|---|
| | ASP (°) | NPC | NECP | AXP (mm) |
|---|
| Value levels | 20/30/35/40/50 | 1/2/3/4/5 | 3/4/5/6/7 | 100/125/150/175/200 |
| Test times | 5 | 5 | 5 | 5 |
Table 3.
Single-factor experiment design of operation parameters.
Table 3.
Single-factor experiment design of operation parameters.
| | Operating Parameter |
|---|
| | V (m/s) | WA (mm) | WB (mm) | WC (mm) |
|---|
| Value levels | 1/2/3/4/5 | 15/25/30/35/40 | 15/25/30/35/40 | 15/25/30/35/40 |
| Test times | 5 | 5 | 5 | 5 |
Table 4.
Test scheme factors and levels of structural parameters.
Table 4.
Test scheme factors and levels of structural parameters.
| Level | Factor |
|---|
| A (°) | B (mm) | C | D |
|---|
| −1 | 30 | 145 | 5 | 2 |
| 0 | 35 | 160 | 6 | 3 |
| 1 | 40 | 175 | 7 | 4 |
Table 5.
Response surface design scheme and response value test data.
Table 5.
Response surface design scheme and response value test data.
| Number | A (°) | B (mm) | C | D | STV (kg) |
|---|
| 1 | 35 | 160 | 6 | 3 | 11.85 |
| 2 | 35 | 175 | 6 | 4 | 15.50 |
| 3 | 30 | 175 | 7 | 3 | 12.24 |
| 4 | 40 | 175 | 5 | 3 | 13.72 |
| 5 | 35 | 160 | 7 | 4 | 15.93 |
| 6 | 40 | 175 | 7 | 3 | 13.93 |
| 7 | 40 | 145 | 5 | 5 | 14.13 |
| 8 | 40 | 145 | 7 | 3 | 11.72 |
| 9 | 35 | 160 | 5 | 4 | 17.49 |
| 10 | 40 | 145 | 7 | 5 | 13.97 |
| 11 | 35 | 160 | 6 | 4 | 13.05 |
| 12 | 35 | 145 | 6 | 4 | 12.37 |
| 13 | 30 | 175 | 7 | 5 | 13.19 |
| 14 | 35 | 160 | 6 | 4 | 13.61 |
| 15 | 30 | 145 | 5 | 5 | 10.69 |
| 16 | 40 | 160 | 6 | 4 | 13.24 |
| 17 | 40 | 175 | 5 | 5 | 18.91 |
| 18 | 30 | 145 | 7 | 3 | 10.67 |
| 19 | 30 | 160 | 6 | 4 | 11.08 |
| 20 | 30 | 175 | 5 | 3 | 11.51 |
| 21 | 35 | 160 | 6 | 4 | 13.98 |
| 22 | 30 | 145 | 5 | 3 | 10.51 |
| 23 | 35 | 160 | 6 | 4 | 13.05 |
| 24 | 40 | 145 | 5 | 3 | 11.36 |
| 25 | 35 | 160 | 6 | 4 | 13.42 |
| 26 | 35 | 160 | 6 | 4 | 13.60 |
| 27 | 35 | 160 | 6 | 5 | 13.28 |
| 28 | 40 | 175 | 7 | 5 | 18.35 |
| 29 | 30 | 175 | 5 | 5 | 13.66 |
| 30 | 30 | 145 | 7 | 5 | 10.36 |
Table 6.
Analysis results of quadratic regression model of soil transport model.
Table 6.
Analysis results of quadratic regression model of soil transport model.
| Source | Mean Square | DOF | Square Sum | F Value | p Value |
|---|
| Model | 133.88 | 14 | 9.56 | 39.57 | <0.0001 ** |
| A | 35.90 | 1 | 35.90 | 148.55 | <0.0001 ** |
| B | 35.36 | 1 | 35.36 | 146.33 | <0.0001 ** |
| C | 0.1458 | 1 | 0.1458 | 0.6033 | 0.4494 |
| D | 20.12 | 1 | 20.12 | 83.25 | <0.0001 ** |
| AB | 1.80 | 1 | 1.80 | 7.43 | 0.0156 * |
| AC | 0.0036 | 1 | 0.0036 | 0.0149 | 0.9045 |
| AD | 8.50 | 1 | 8.50 | 35.16 | <0.0001 ** |
| BC | 0.0009 | 1 | 0.0009 | 0.0037 | 0.9521 |
| BD | 3.82 | 1 | 3.82 | 15.82 | 0.0012 ** |
| CD | 0.5550 | 1 | 0.5550 | 2.30 | 0.1504 |
| A2 | 8.78 | 1 | 8.78 | 36.34 | <0.0001 ** |
| B2 | 0.0113 | 1 | 0.0113 | 0.0469 | 0.8315 |
| C2 | 19.01 | 1 | 19.01 | 78.67 | <0.0001 ** |
| D2 | 5.34 | 1 | 5.34 | 22.11 | 0.0003 ** |
| Residual | 3.63 | 15 | 0.2417 | | |
| Lack of Fit | 2.98 | 10 | 0.2975 | 2.29 | 0.1867 |
| Pure Error | 0.6499 | 5 | 0.1300 | | |
| Cor Total | 137.51 | 29 | | | |
| R2 | 0.9736 | | Adjusted R2 | 0.9490 | |
| Predicted R2 | 0.9049 | | Adeq Precision | 24.7842 | |
Table 7.
Test verification scheme and results.
Table 7.
Test verification scheme and results.
| Number | Number of Guide Plates |
|---|
| 4 | 5 |
|---|
| 1 | 18.49 | 18.86 |
| 2 | 18.32 | 18.85 |
| 3 | 18.36 | 18.74 |
| Average | 18.38 | 18.82 |
Table 8.
Test scheme factors and levels of operation parameters.
Table 8.
Test scheme factors and levels of operation parameters.
| Level | Factor |
|---|
| E (km/h) | F (mm) | H (mm) |
|---|
| −1.6818 | 2.6591 | 21.591 | 21.591 |
| −1 | 3 | 25 | 25 |
| 0 | 3.5 | 30 | 30 |
| 1 | 4 | 35 | 35 |
| 1.6818 | 4.3409 | 38.409 | 38.409 |
Table 9.
Test design form and test data for operating parameters.
Table 9.
Test design form and test data for operating parameters.
| Number | E (km/h) | F (mm) | H (mm) | G1 (%) |
|---|
| 1 | 3 | 25 | 35 | 28.36 |
| 2 | 3.5 | 30 | 30 | 6.98 |
| 3 | 3.5 | 30 | 30 | 4.85 |
| 4 | 4 | 25 | 25 | 24.98 |
| 5 | 3.5 | 30 | 30 | 2.17 |
| 6 | 2.6591 | 30 | 30 | 40.4 |
| 7 | 4 | 35 | 35 | 15.63 |
| 8 | 3.5 | 21.591 | 30 | 9.68 |
| 9 | 3.5 | 38.409 | 30 | 10.21 |
| 10 | 4 | 35 | 25 | 15.56 |
| 11 | 3.5 | 30 | 21.591 | 9.36 |
| 12 | 3 | 25 | 25 | 6.41 |
| 13 | 3.5 | 30 | 30 | 3.68 |
| 14 | 4 | 25 | 35 | 15.93 |
| 15 | 3.5 | 30 | 30 | 2.17 |
| 16 | 4.3409 | 30 | 30 | 26.11 |
| 17 | 3 | 35 | 35 | 37.61 |
| 18 | 3.5 | 30 | 38.409 | 19.48 |
| 19 | 3 | 35 | 25 | 22.32 |
| 20 | 3.5 | 30 | 30 | 1.78 |
Table 10.
G1 model of quadratic regression model analysis results.
Table 10.
G1 model of quadratic regression model analysis results.
| Source | Mean Square | DOF | Square Sum | F Value | p Value |
|---|
| Model | 2517.66 | 9 | 279.74 | 39.34 | <0.0001 ** |
| E | 159.23 | 1 | 159.23 | 22.39 | 0.0008 ** |
| F | 19.53 | 1 | 19.53 | 2.75 | 0.1285 |
| H | 150.13 | 1 | 150.13 | 21.11 | 0.0010 ** |
| EF | 152.08 | 1 | 152.08 | 21.39 | 0.0009 ** |
| EH | 267.04 | 1 | 267.04 | 37.55 | 0.0001 ** |
| FH | 0.7564 | 1 | 0.7564 | 0.1064 | 0.7510 |
| E2 | 1628.41 | 1 | 1628.41 | 229.01 | <0.0001 ** |
| F2 | 82.22 | 1 | 82.22 | 11.56 | 0.0068 ** |
| H2 | 227.22 | 1 | 227.22 | 31.96 | 0.0002 ** |
| Residual | 71.11 | 10 | 7.11 | | |
| Lack of Fit | 50.71 | 5 | 10.14 | 2.49 | 0.1701 |
| Pure Error | 20.40 | 5 | 4.08 | | |
| Cor Total | 2588.76 | 19 | | | |
| R2 | 0.9725 | | Adjusted R2 | 0.9478 | |
| Predicted R2 | 0.8210 | | Adeq Precision | 18.9911 | |
Table 11.
Field experiment design and data.
Table 11.
Field experiment design and data.
| NO | Soil Feed Outlet A (kg) | Soil Feed Outlet B (kg) | Soil Feed Outlet C (kg) | G1 |
|---|
| 1 | 4.69 | 4.89 | 4.95 | 4.04% |
| 2 | 4.78 | 4.88 | 5.01 | 2.38% |
| 3 | 4.63 | 4.78 | 4.98 | 3.27% |
| Average quality | 4.70 | 4.85 | 4.98 | 2.59% |
| Average thickness (cm) | 1.42 | 1.46 | 1.50 | _ |
| Publisher’s Note: MDPI stays neutral with regard to jurisdictional claims in published maps and institutional affiliations. |
© 2022 by the authors. Licensee MDPI, Basel, Switzerland. This article is an open access article distributed under the terms and conditions of the Creative Commons Attribution (CC BY) license (https://creativecommons.org/licenses/by/4.0/).


 ,
, 


