To control the EXV on the experimental platform, the experimental system debugging solution has been established. Subsequently, experiments to determine the effective opening range, self-tuning and self-tuning optimization of PI control parameters, and implementation of PI control were conducted to verify the effectiveness and generalizability of the solution.
4.1. Determination of the Effective Opening Range of EXV1
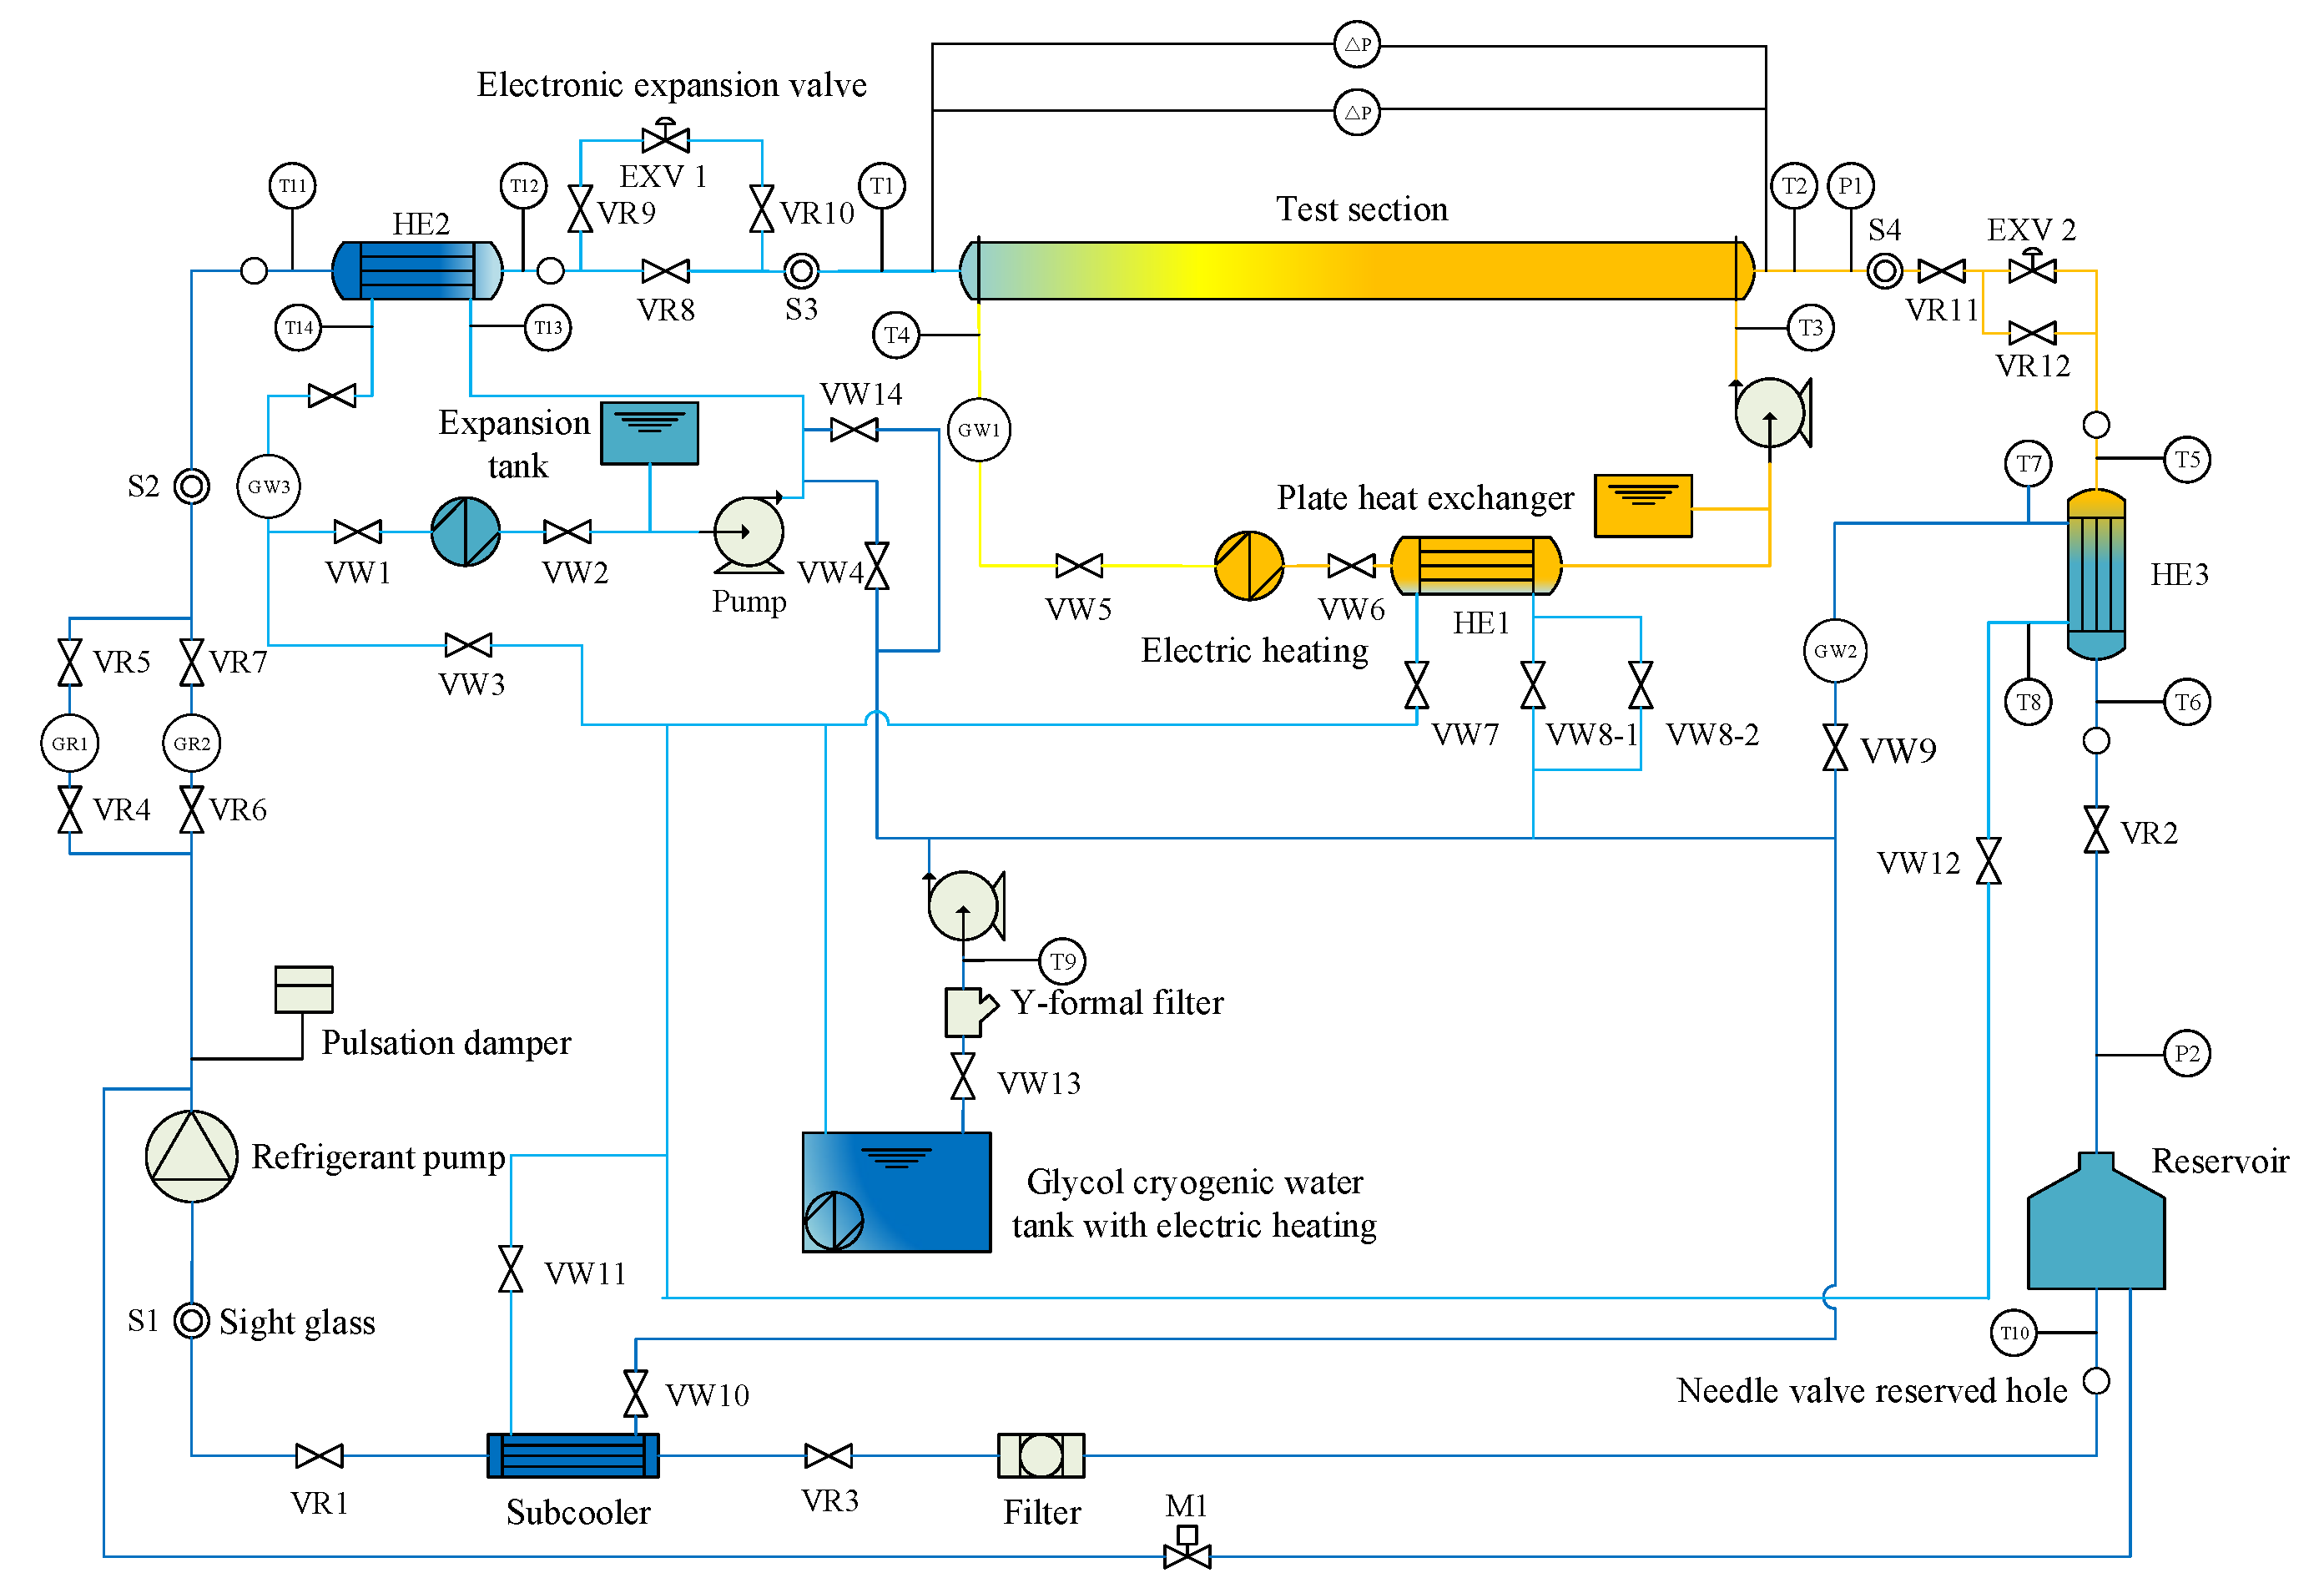
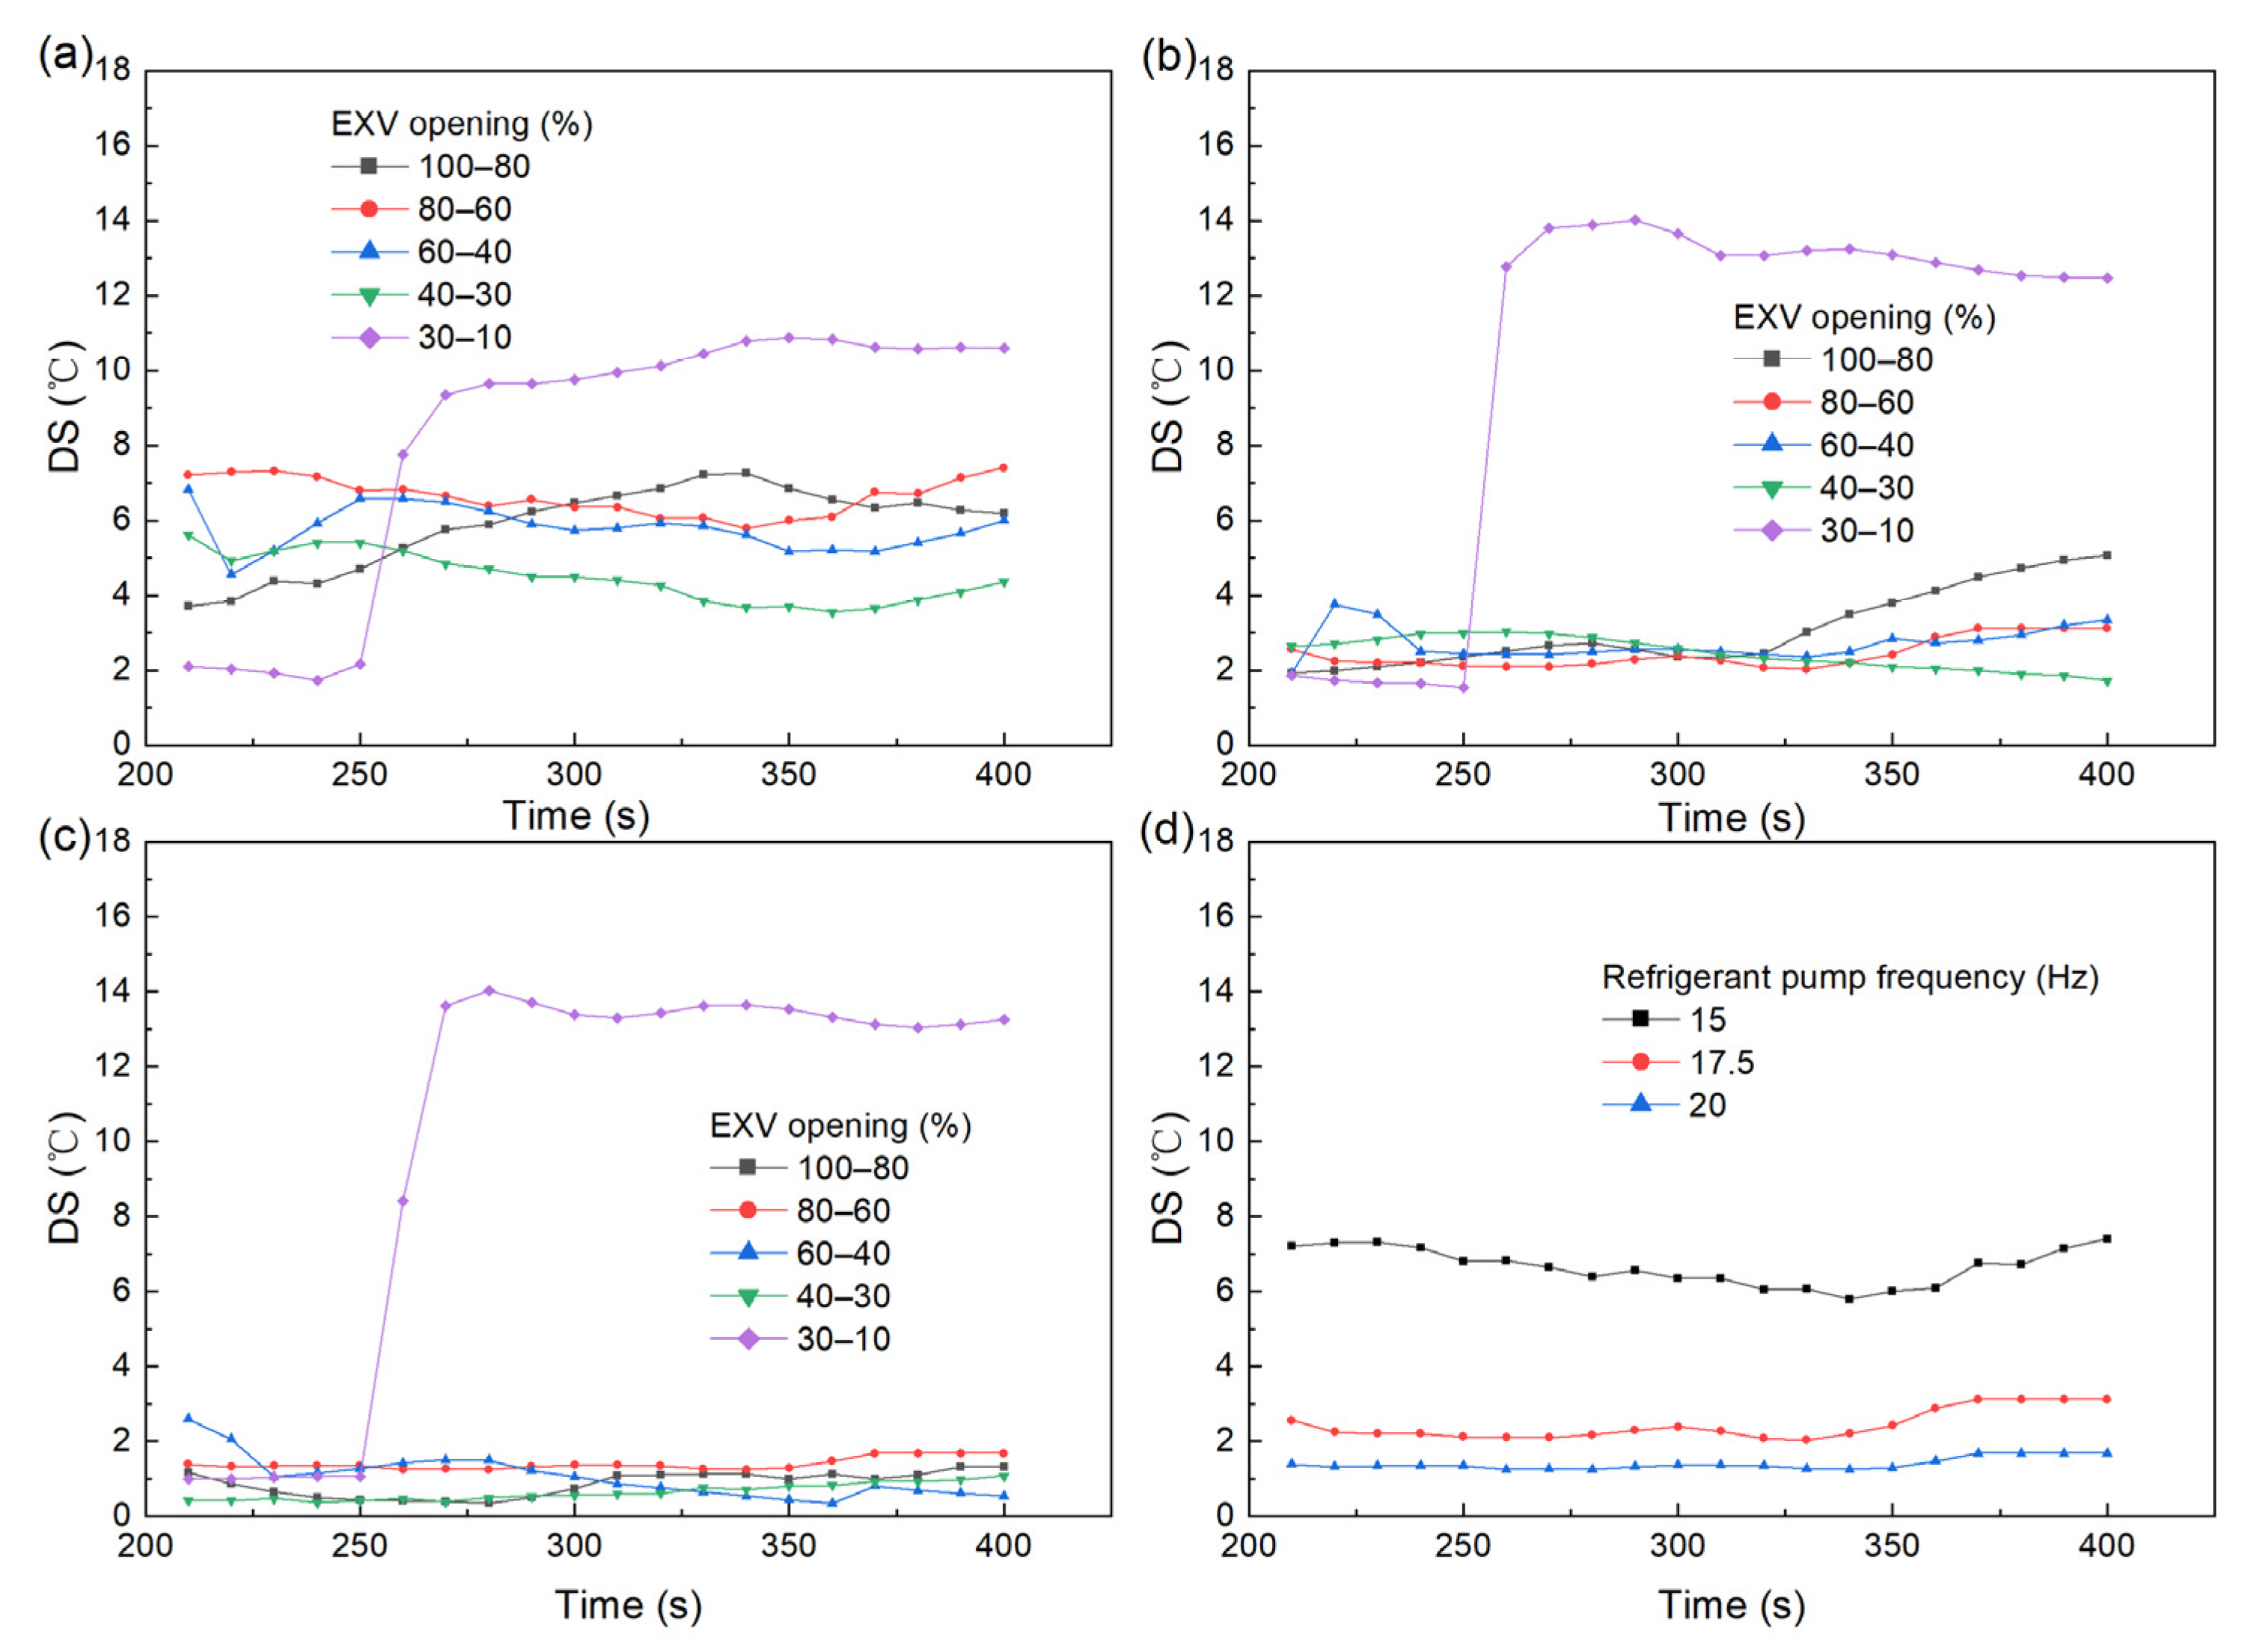
Factors such as the frequency and opening of the refrigerant pump, the inlet refrigerant temperature in the test section, the inlet water temperature in the test section, and the inlet water temperature of the plate heat exchanger HE3 will all have a certain impact on the opening and self-tuning test data of the EXV1. Therefore, multiple sets of repetitive experiments should be carried out under different setting conditions to find a reasonable EXV1 opening range. To ensure single-phase entry and exit of the test section, the experimental conditions are shown in
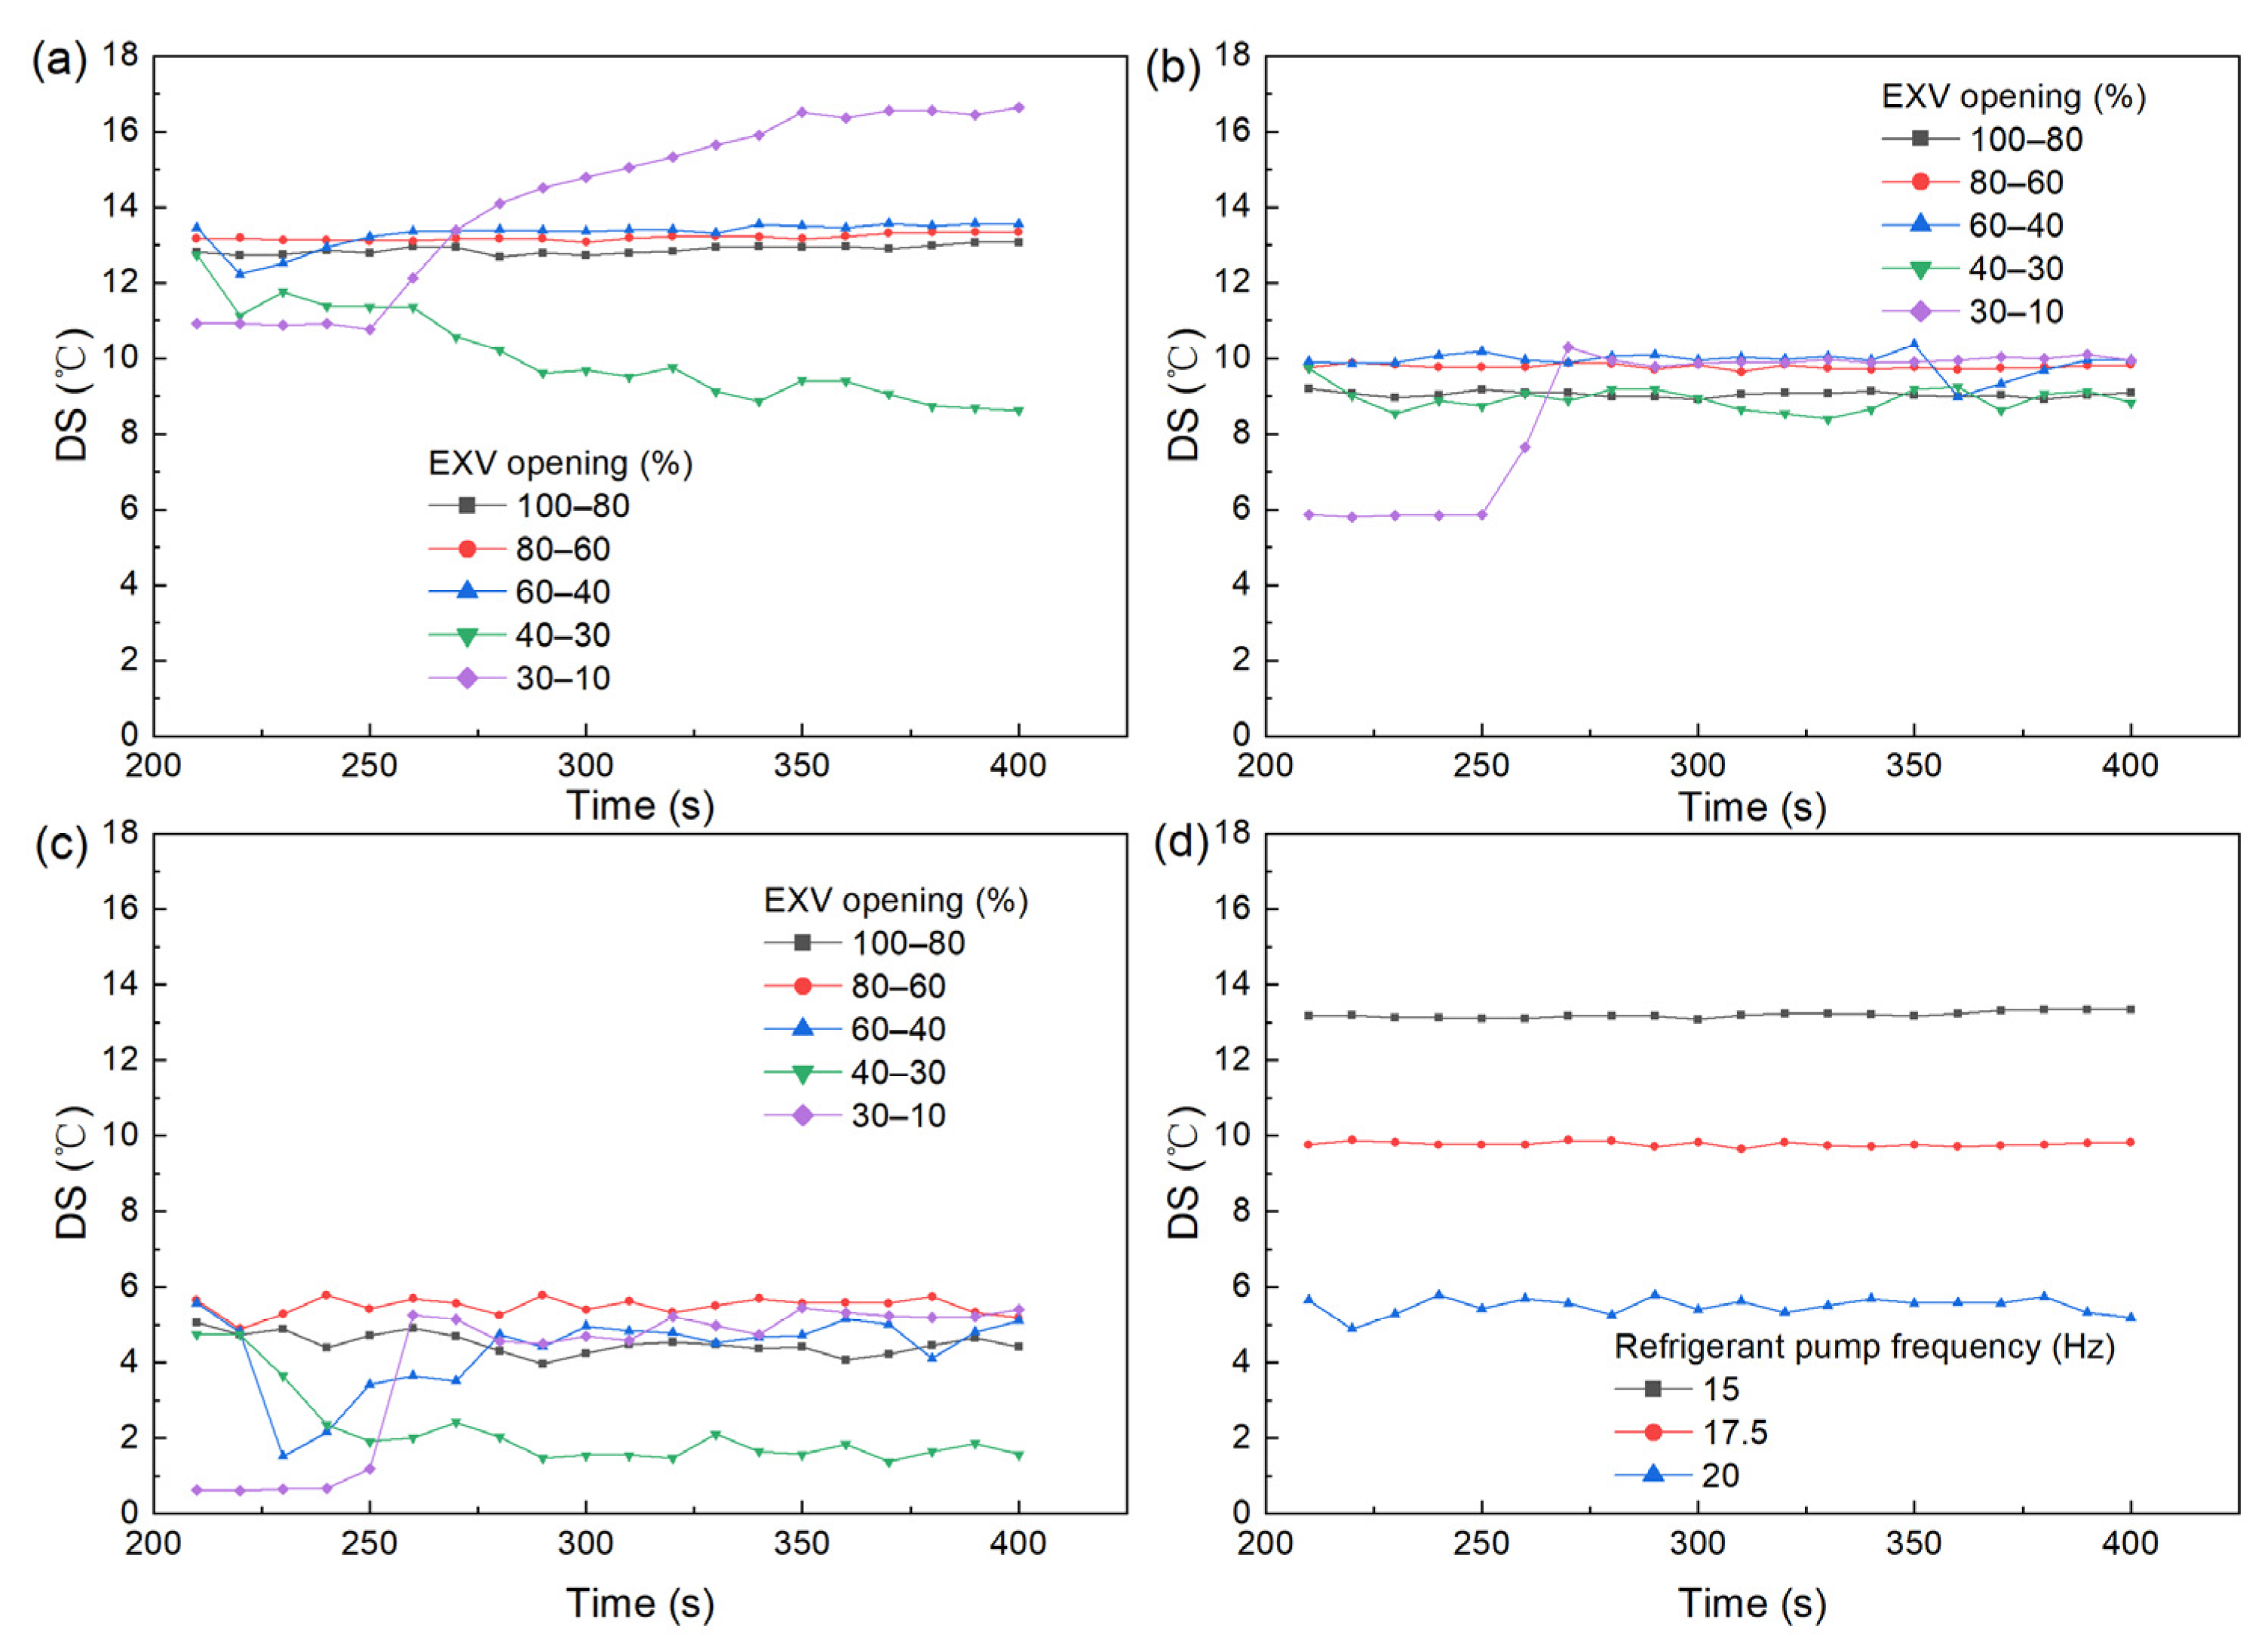
Table 4. Subsequently, the fluctuations in DS were observed by manually changing the EXV1 opening at refrigerant pump frequencies of 15 Hz, 17.5 Hz, and 20 Hz, respectively. It can be seen that the controlled variables in the experiment are the refrigerant pump opening and frequency, the inlet refrigerant temperature in the test section, the inlet water temperature in the test section, the inlet water temperature of the plate heat exchanger HE3, and the EXV1 opening, and the manipulated variable is the DS at the outlet of the test section.
As shown in
Figure 3, the change in DS at the outlet of the test section while changing the EXV1 opening from 100% to 40% under the condition of working condition 1 is not obvious, which indicates that the control effect of EXV1 on refrigerant is weak in the opening range. When the valve opening changes from 40% to 30%, the DS first decreases with time and then stabilizes, and the change is more obvious when the pump frequency is 15 Hz and 20 Hz. It may be because when the valve opening changes from 40% to 30%, the valve needle and the refrigerant inside the valve body go from a non-contact to contact process. During the period, certain air pressure will be generated, resulting in an increase in refrigerant flow and thereby a decrease in DS. When the EXV1 opening changes from 30% to 10%, the DS shows an obvious step response, and its value increases with time and then stabilizes. It proves that the EXV1 controls the refrigerant well in the opening range.
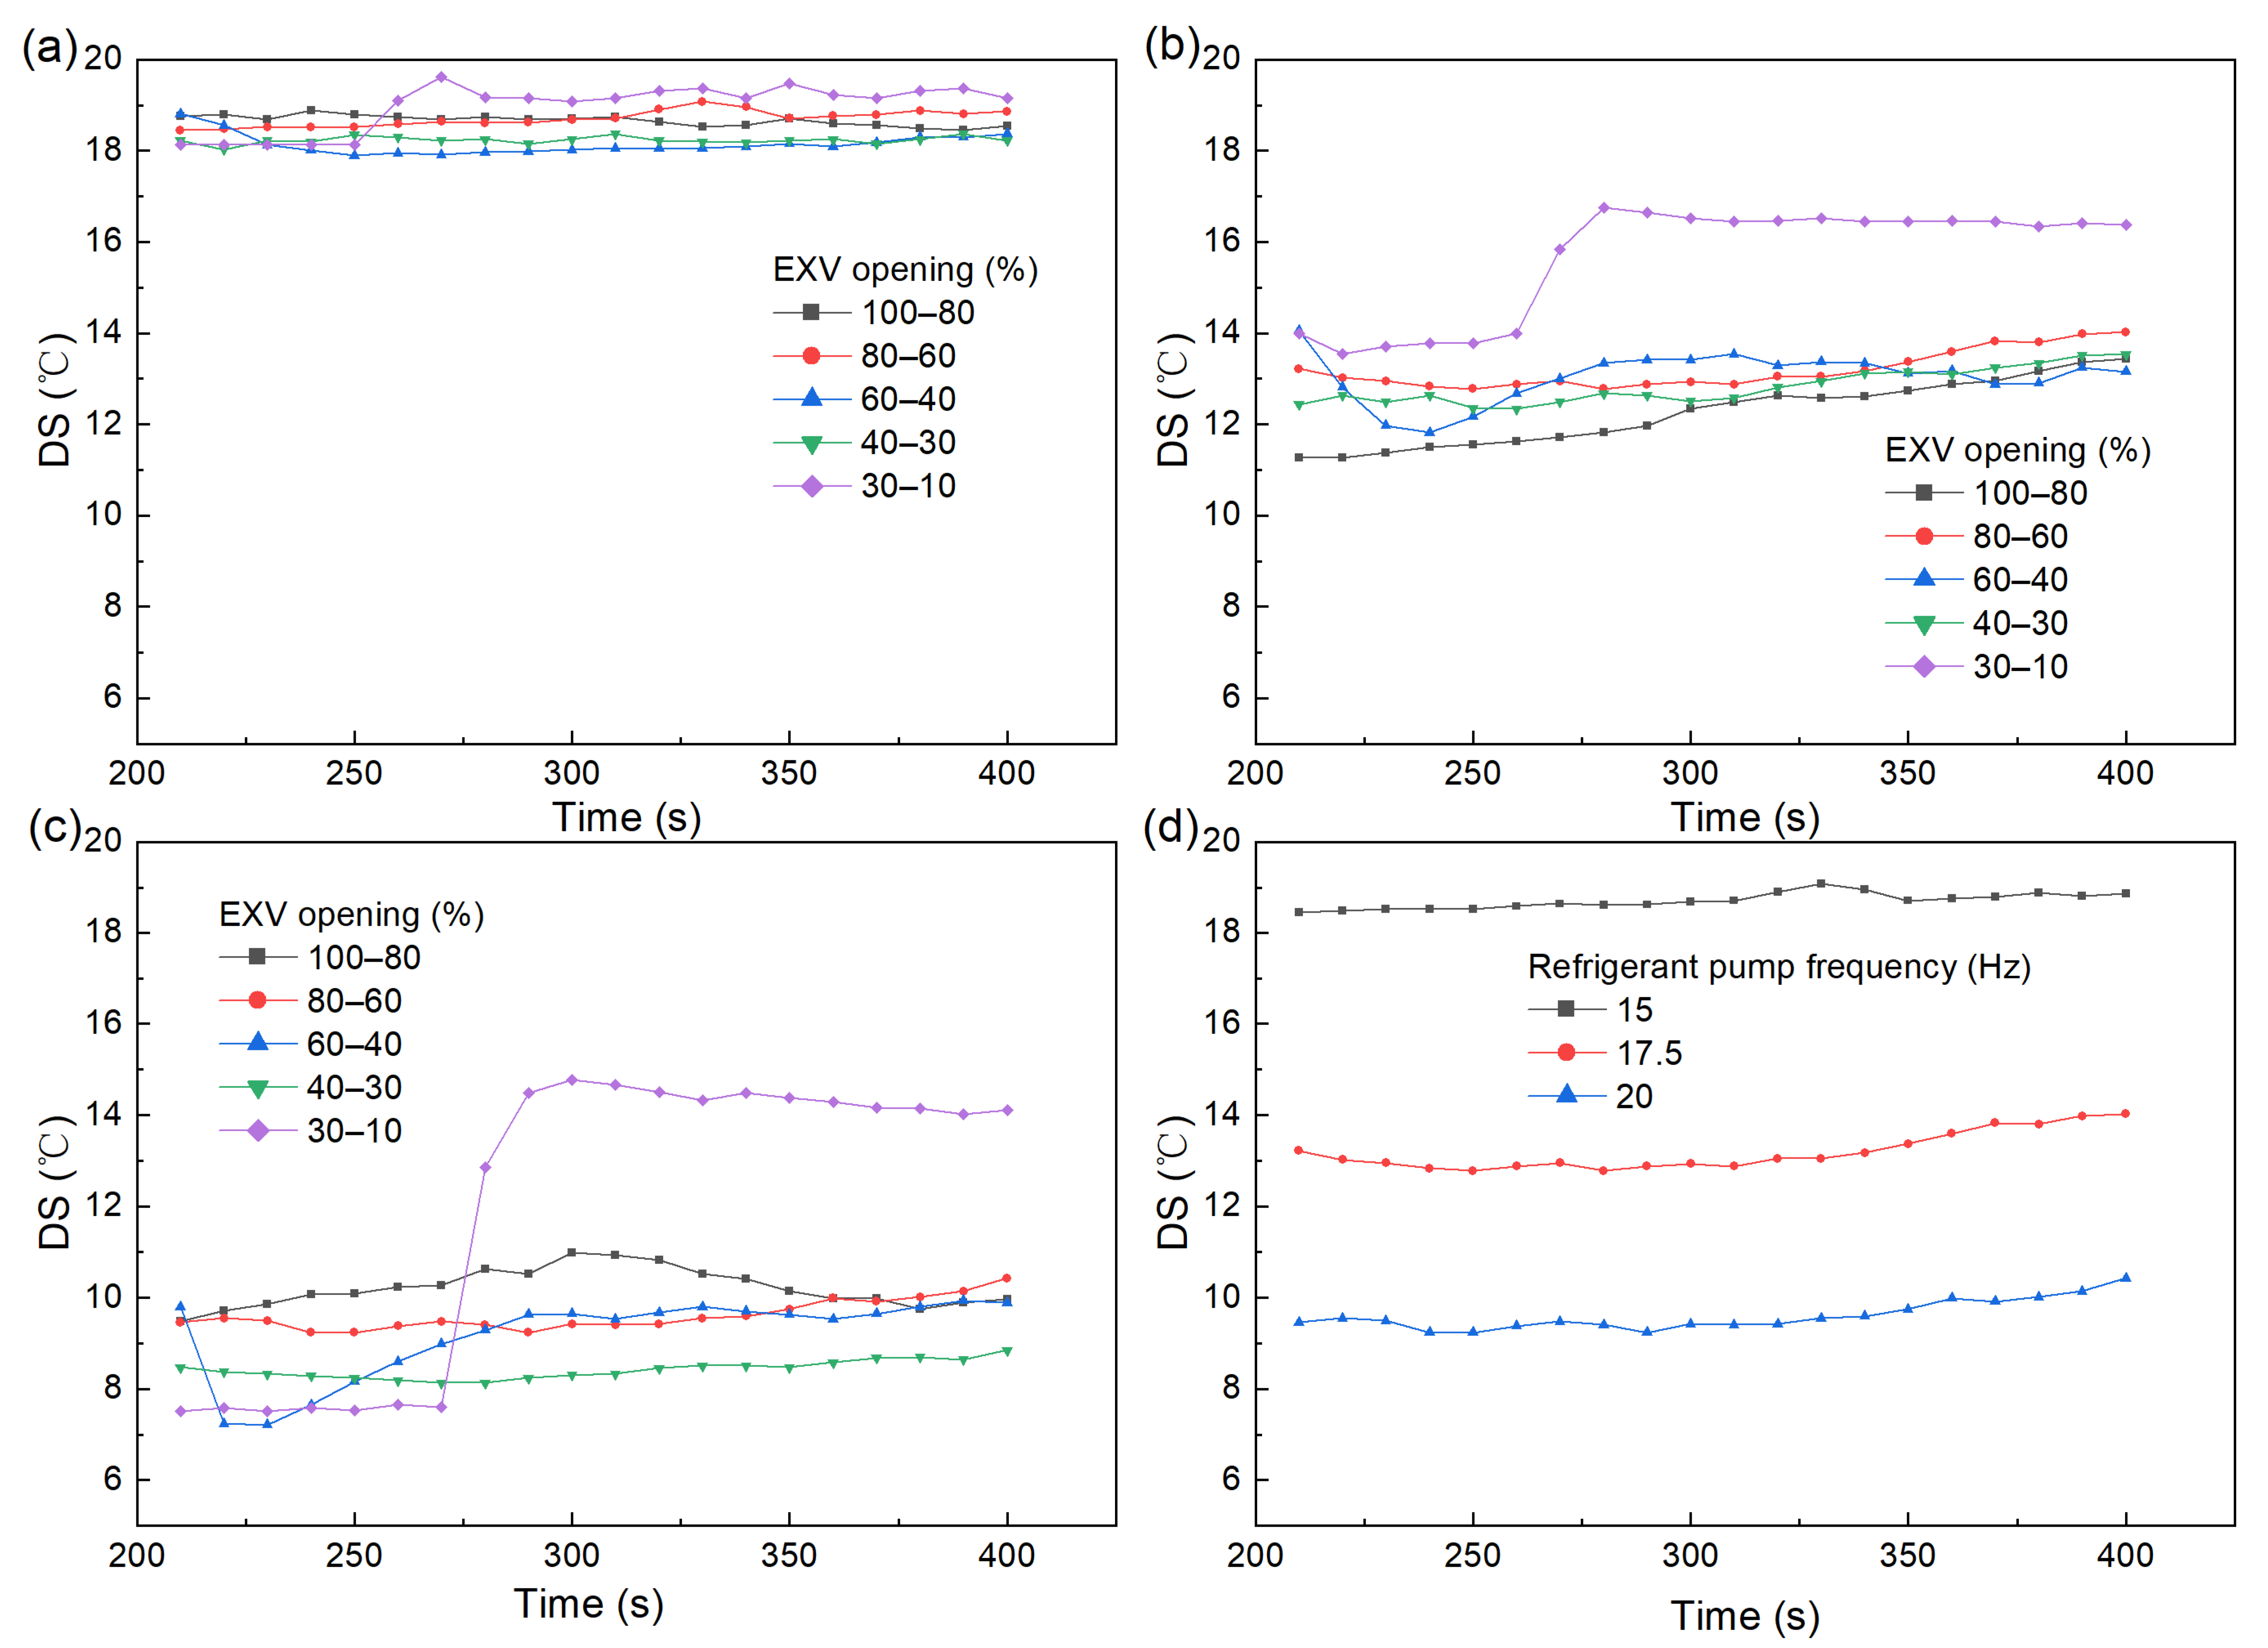
As can be seen from
Figure 4, there is a small increase in DS but no significant step jump during changing the EXV1 opening from 100% to 30% in the condition of working condition 2. It shows that the EXV1 is not effective in controlling the refrigerant in the opening range. The change in DS when the EXV1 opening changes from 30% to 10% is similar to the situation when the refrigerant pump opening is 40%.
As can be seen from
Figure 5, there is no significant step jump in the DS during changing the EXV1 opening from 100% to 30% under the condition of working condition 3 but its value fluctuates widely. It shows that the control effect of EXV on the refrigerant is not obvious in the opening range, but the opening of the refrigerant pump becomes larger, and the large flow rate causes the fluctuation of the value. The change in DS when the EXV1 opening changes from 30% to 10% is similar to the situation when the refrigerant pump opening is 40% and 60%.
Moreover, from
Figure 3d,
Figure 4d and
Figure 5d, it can be seen that the DS decreases with the increase in the refrigerant pump frequency. This is because the mass flow rate of the refrigerant increases as the pump frequency increases, and it also shows the accuracy and rationality of the data collected by the experimental platform. In summary, it can be concluded that the best opening range for the EXV1 of the experimental platform is 10%–30%.
4.2. Self-Tuning
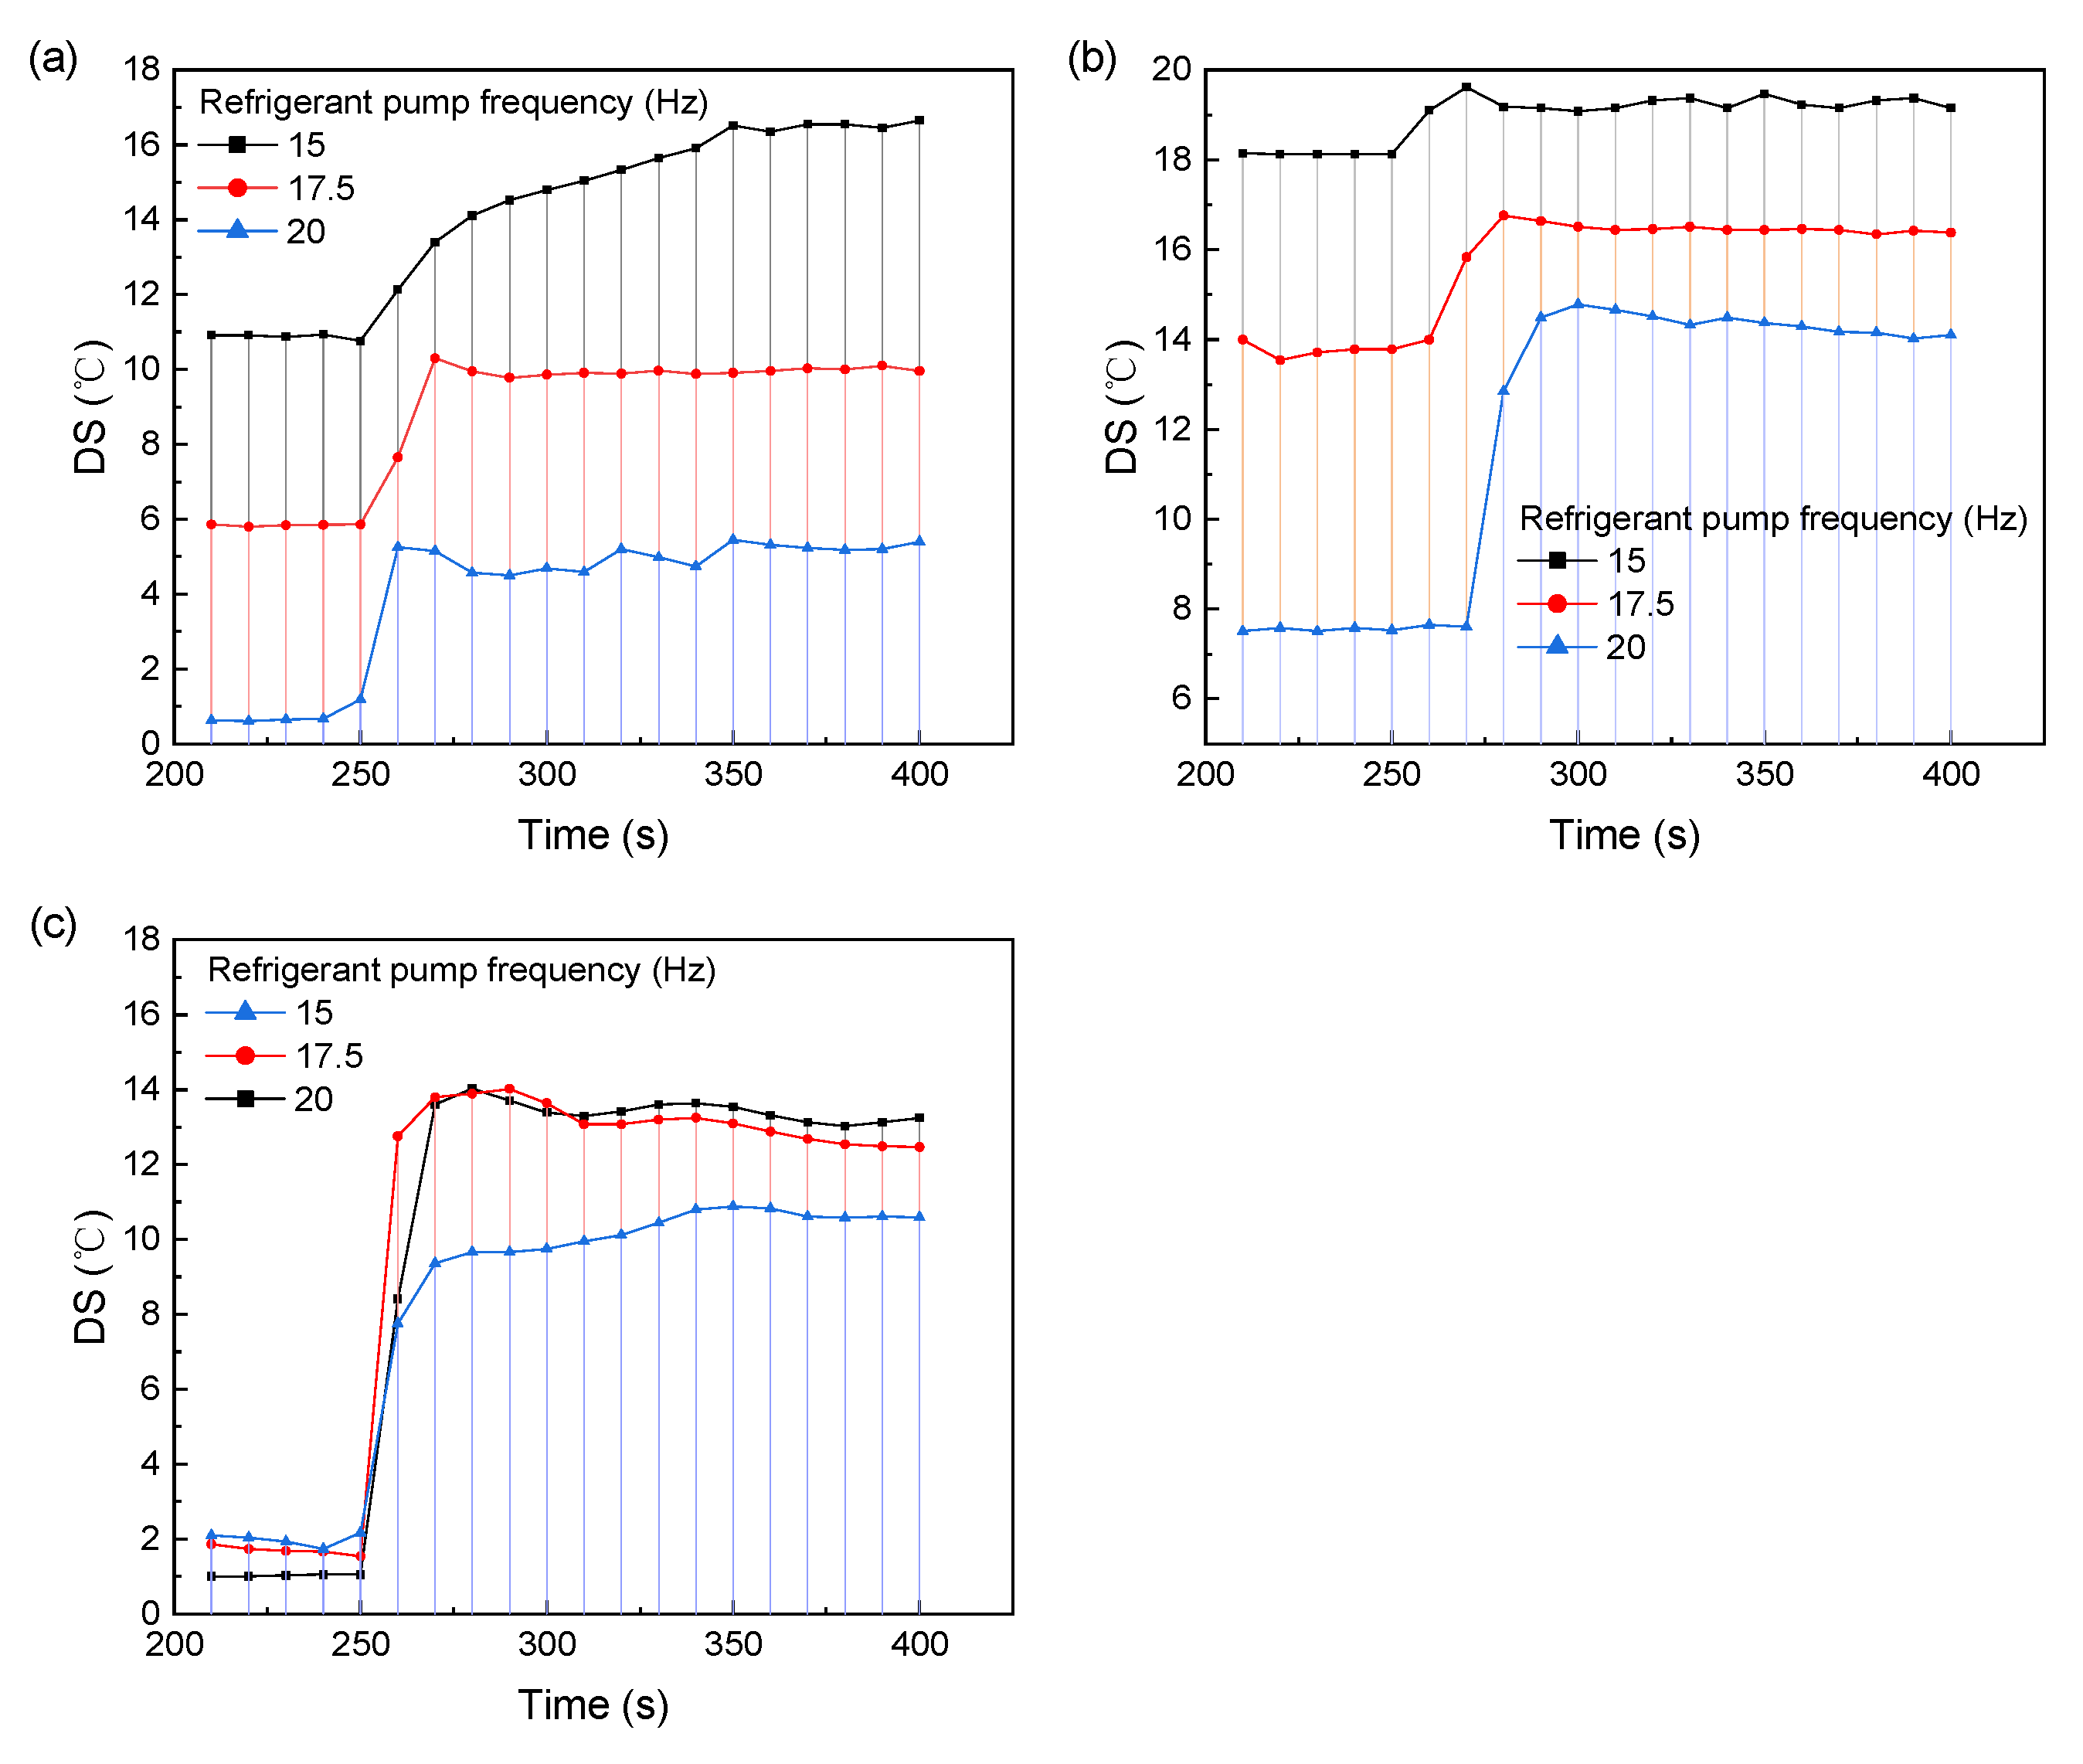
After the range of the EXV1 opening was determined, the change curves of DS with time during the process of the EXV1 opening from 30% to 10% when the refrigerant pump opening was 40%, 60%, and 80% were compared, as shown in
Figure 6.
As can be seen from
Figure 6, when the refrigerant pump opening is 40%, 60%, and 80%, the refrigerant pump frequencies corresponding to the fast response of the DS and its early stabilization time are 20 Hz, 17.5 Hz, and 15 Hz, respectively. Therefore, these three sets of data are selected for the self-tuning, as shown in
Figure 7.
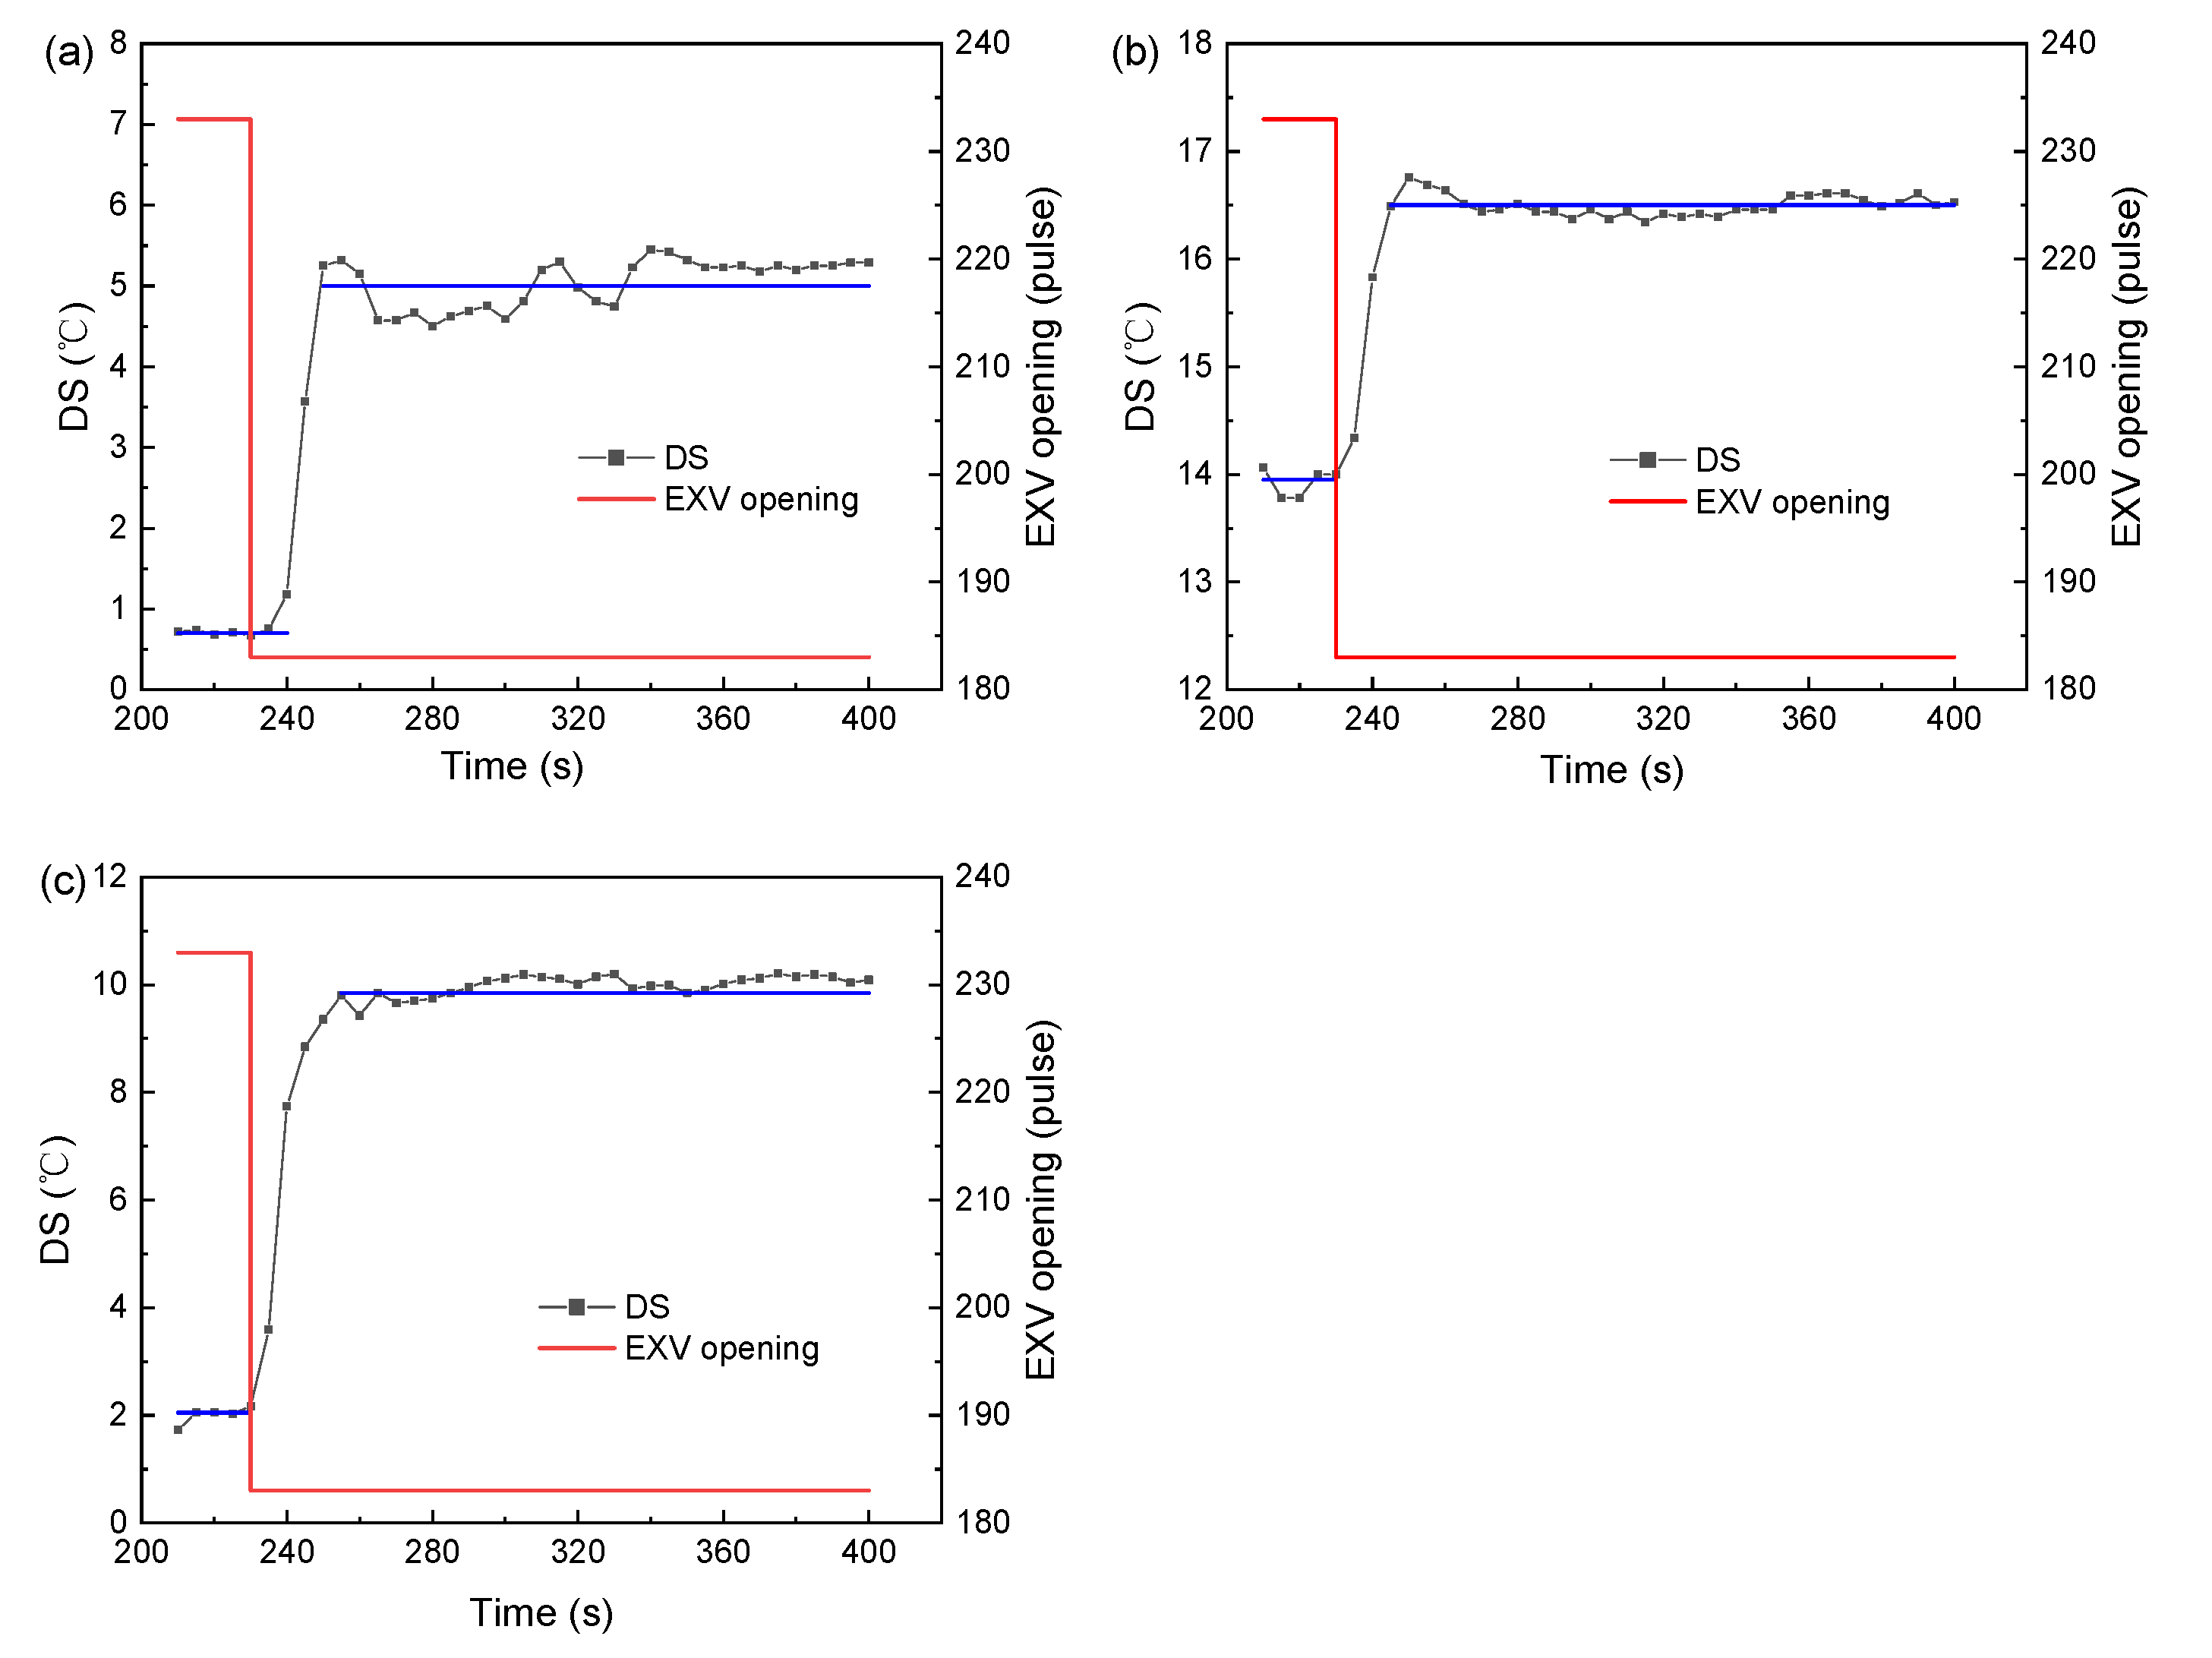
According to
Figure 7 and the empirical formula of Ziegler-Nichols [
36], the characteristic parameters of the DS, as well as the corresponding proportional adjustment coefficients K
p and integration time constants T
i of the PI control algorithm, can be derived under different conditions, as shown in
Table 5.
4.3. PI Control
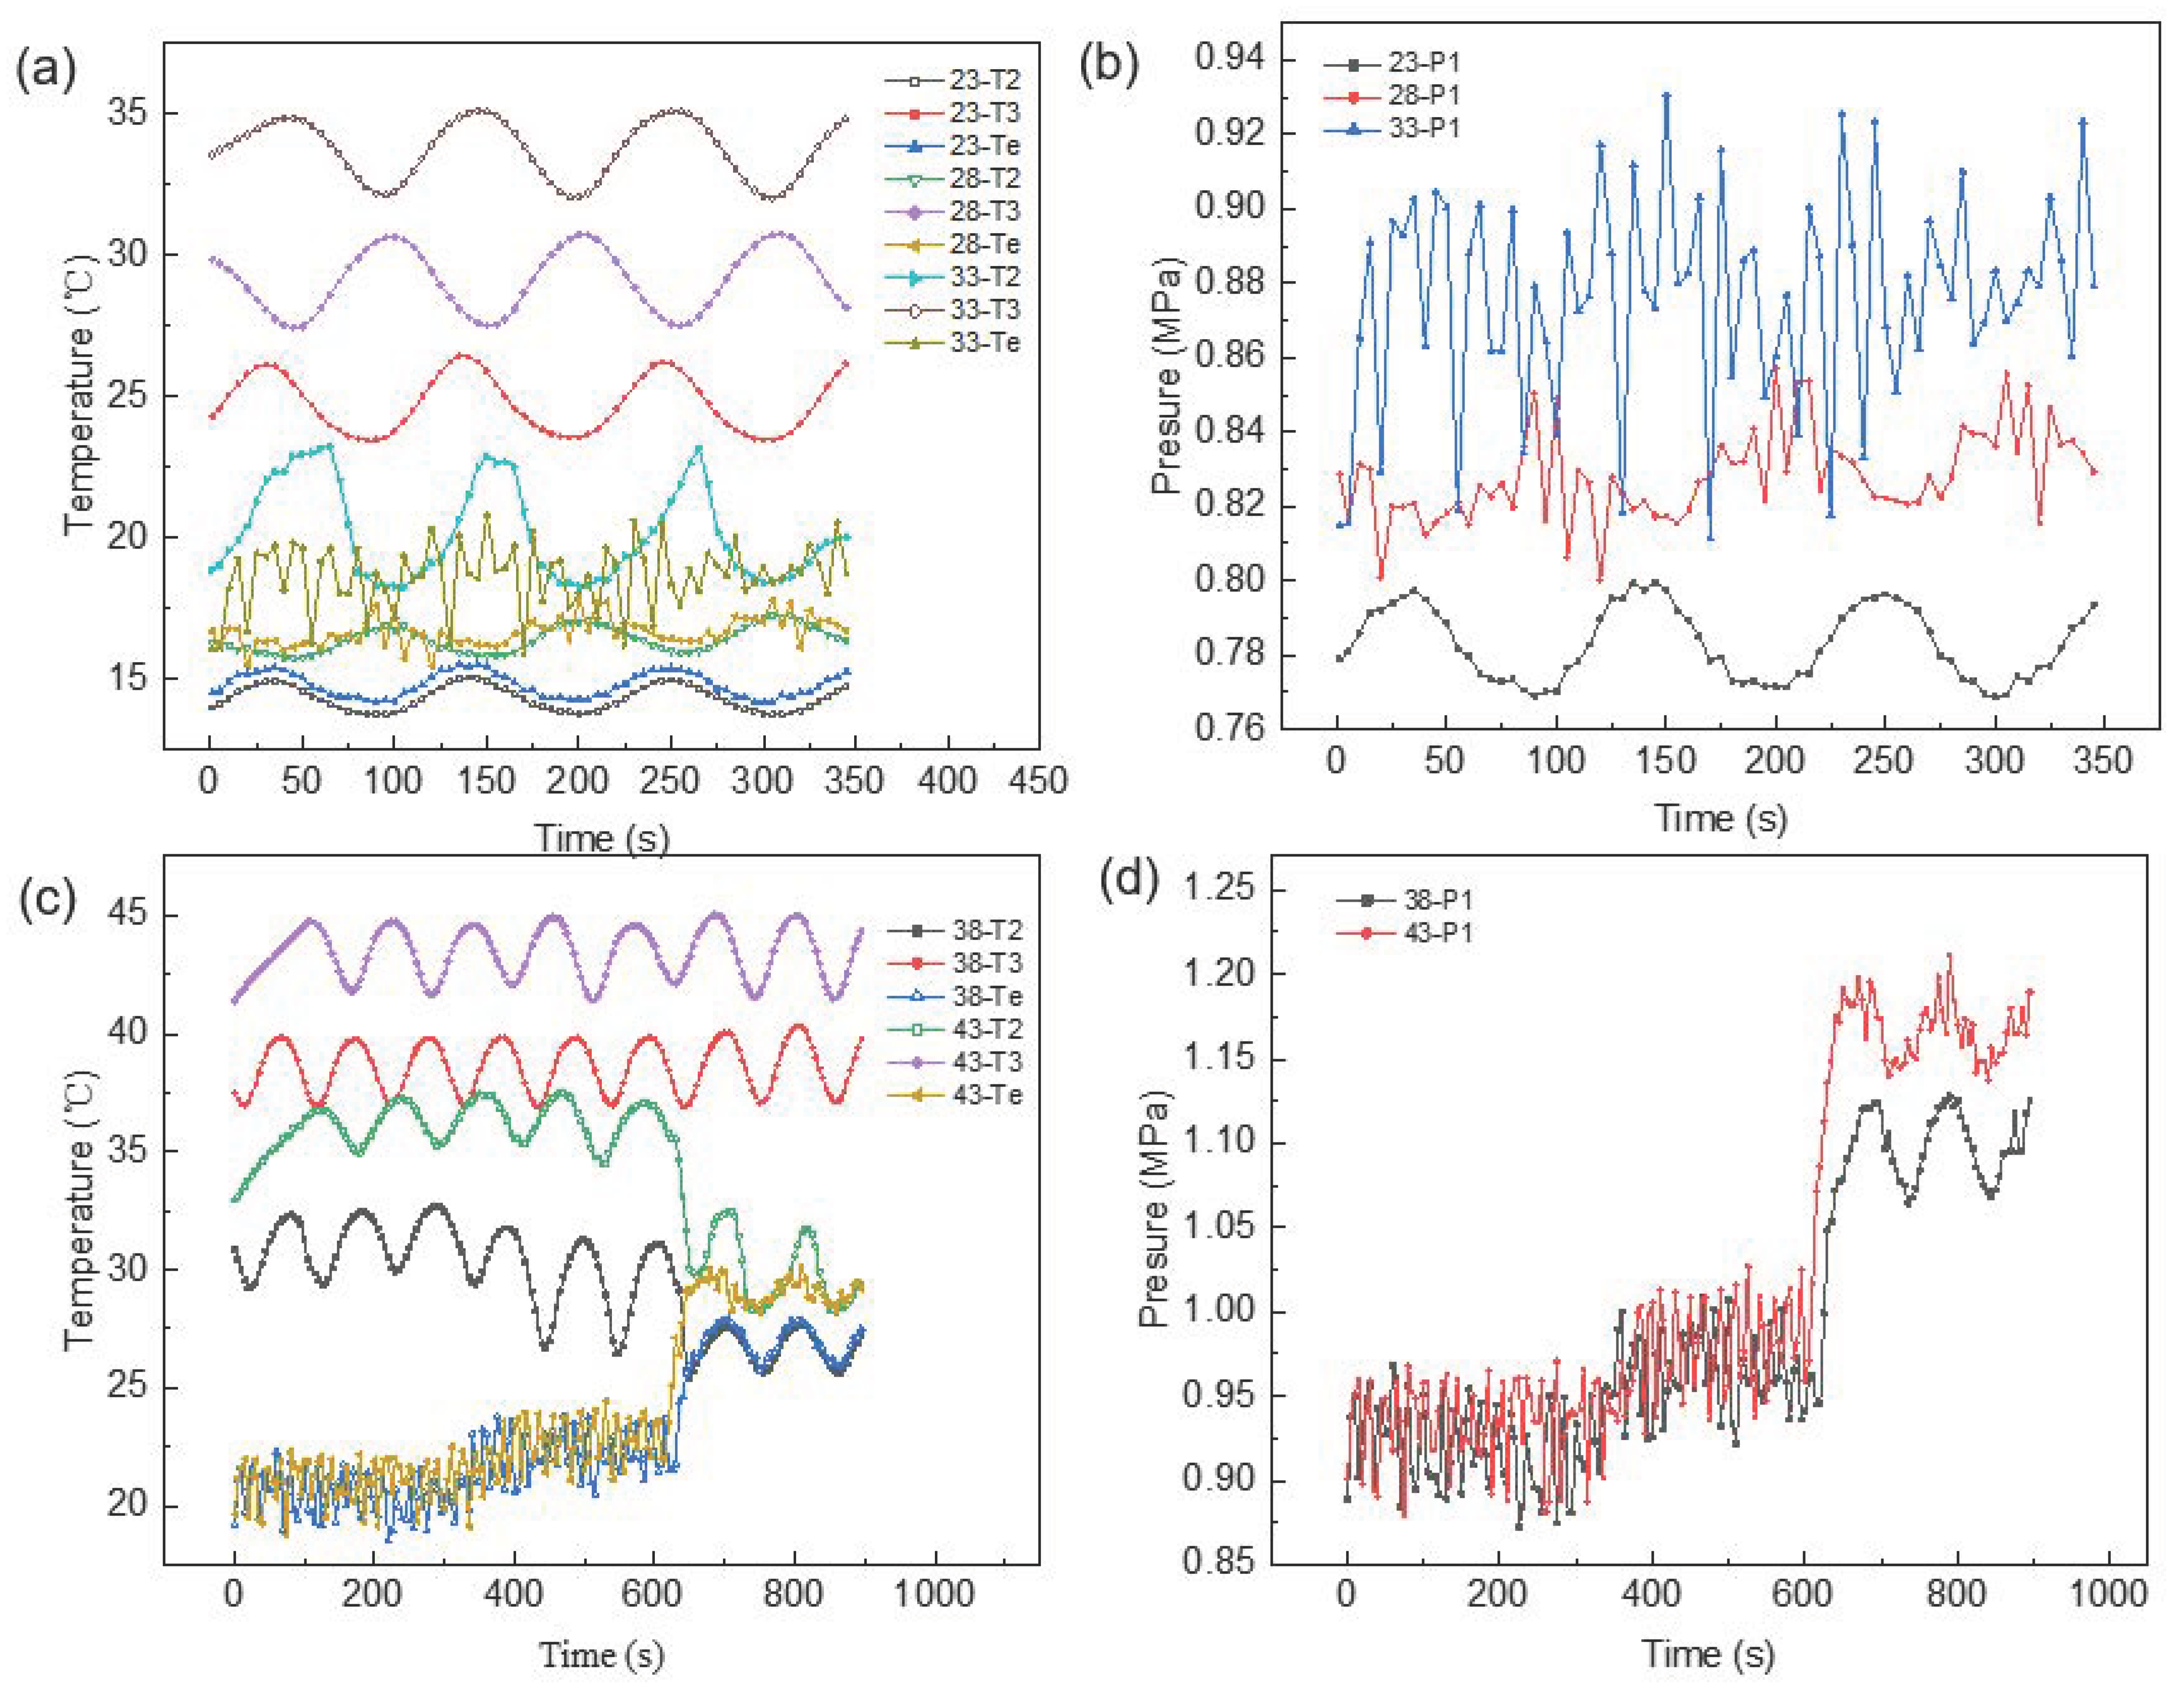
The opening of EXV1 and EXV2 is first controlled by manual control to make the DS at the outlet of the test section reach the target value. The experimental conditions of EXV1 are that the opening and frequency of the refrigerant pump are 40% and 20 Hz, respectively, T3 is 23 °C, and T7 is −5 °C. The experimental conditions of EXV2 are that the opening and frequency of the refrigerant pump are 40% and 20 Hz, respectively, T3 is 23, 28, 33, 38 and 43 °C, and T7 is −5 °C. The manual control uses the dichotomous method to control the EXV opening to achieve the target value setting, and the curves of T3, T2, P1 and T
e are shown in
Figure 8a,b when the DS is controlled by EXV2 and T3 is 23, 28 and 33 °C, respectively. The response curves of T3, T2, P1 and T
e at T3 is 38 and 43 °C, respectively, are shown in
Figure 8c,d.
From
Figure 8a,b, it can be seen that P1 increases with T3, and T
e increases with P1 and is higher than T2, indicating that the refrigerant in the test section is liquid. From
Figure 8c,d, it can be seen that when T3 is set to 38 °C, during the process of the EXV2 opening is changed from 100% to 96%, P1 gradually increases, T
e rises with P1, and the refrigerant in the test section changes from the gaseous state to the gas-liquid two-phase state. Therefore, at lower temperatures, EXV2 is not suitable to be used for control of the test section outlet DS. In addition, it can be seen from
Figure 8c,d that when the temperature of T3 is set to 43 °C, T
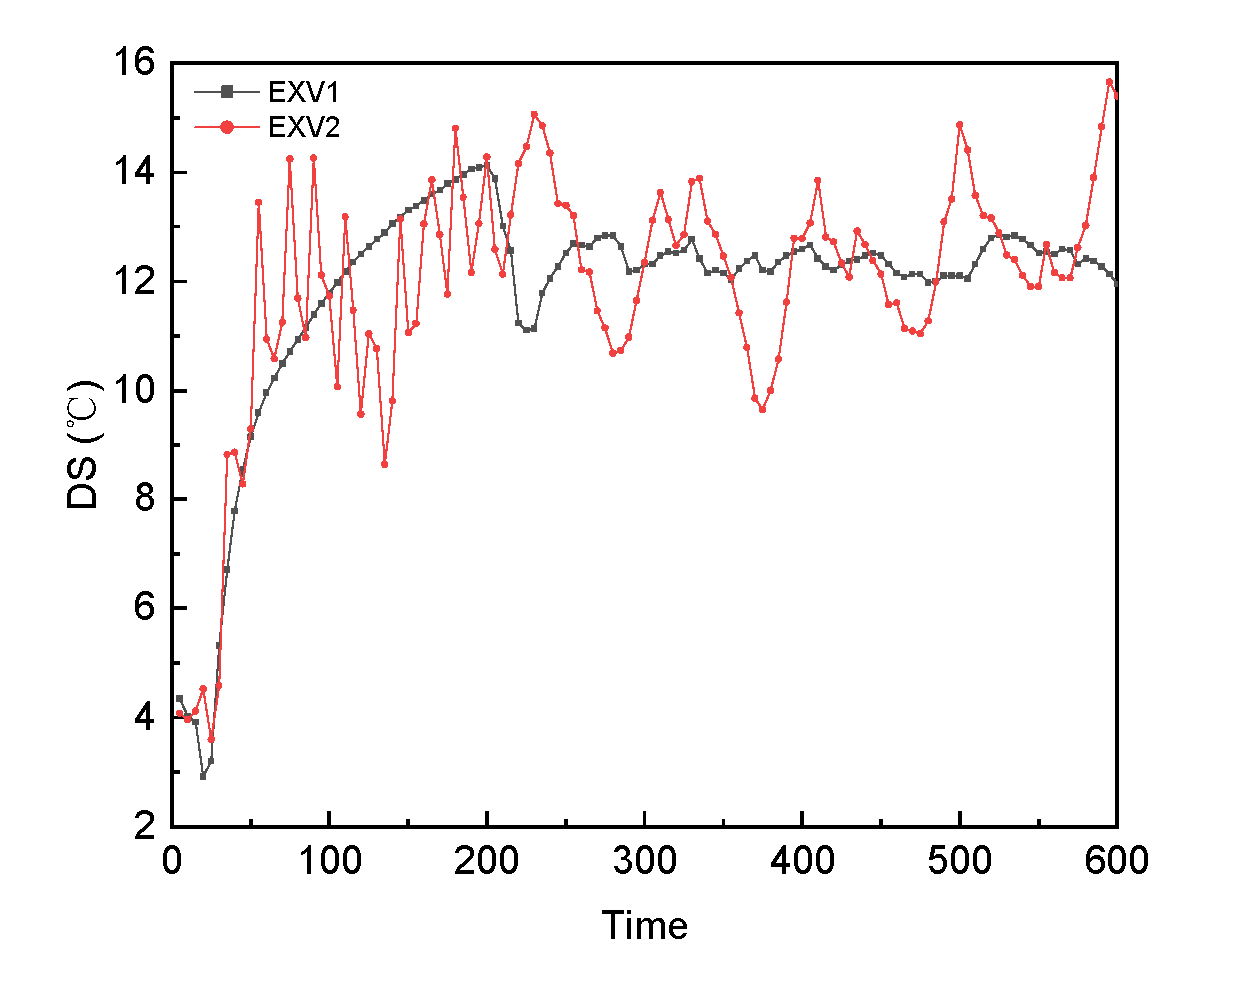
e gradually rises with the increase in P1 but is still lower than T2, and the refrigerant in the test section is gaseous, indicating that the control of the test section outlet DS by EXV2 can be achieved when T3 is 43 °C. Furthermore, the manual control effect of EXV2 is compared with EXV1, as shown in
Figure 9.
From
Figure 9, it can be seen that the overshoot of EXV1 is smaller and takes less time to stabilize compared to EXV2. Additionally, it needs electric heating to provide higher temperature and consume more energy when using EXV2 to control DS. Moreover, it can be seen from
Figure 8d that with the change in EXV2 opening, the value of P1 is too large and even exceeds the safety pressure value set by the protection program. Therefore, EXV1 is selected for the control of the DS.
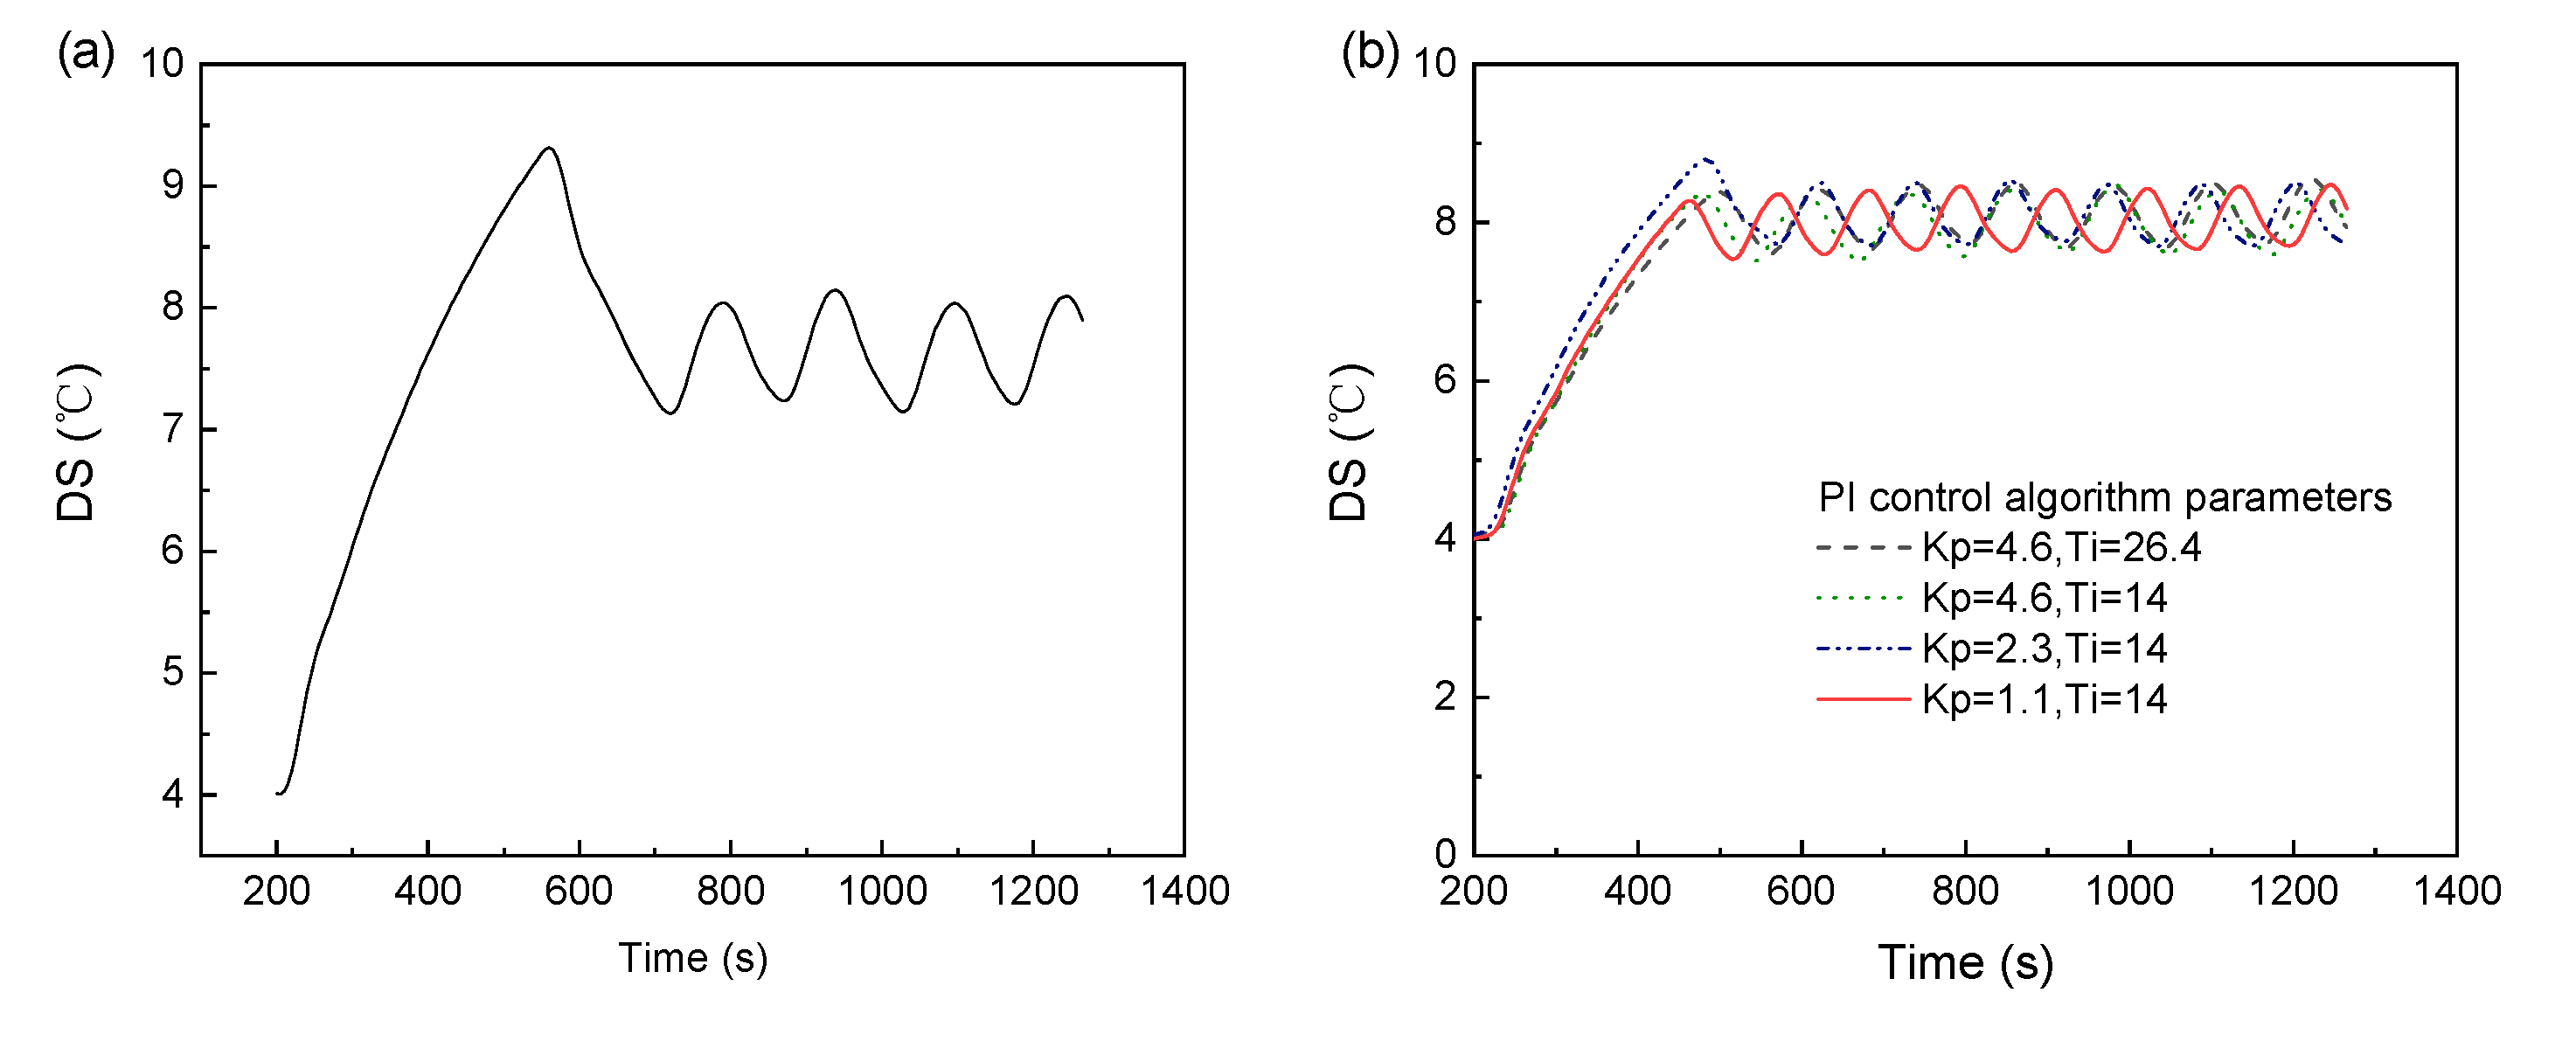
To realize the control of PI control algorithm, the designed algorithm is programmed into programmable logic controllers control program and uploaded to the control cabinet. Subsequently, under the same experimental conditions, the PI control algorithm was used to control the opening of EXV1, as shown in
Figure 10a. It can be seen that the overshoot and fluctuations are larger. Therefore, the dichotomous and bilinear interpolation methods are used for optimization, as shown in
Figure 10b.
It can be seen from
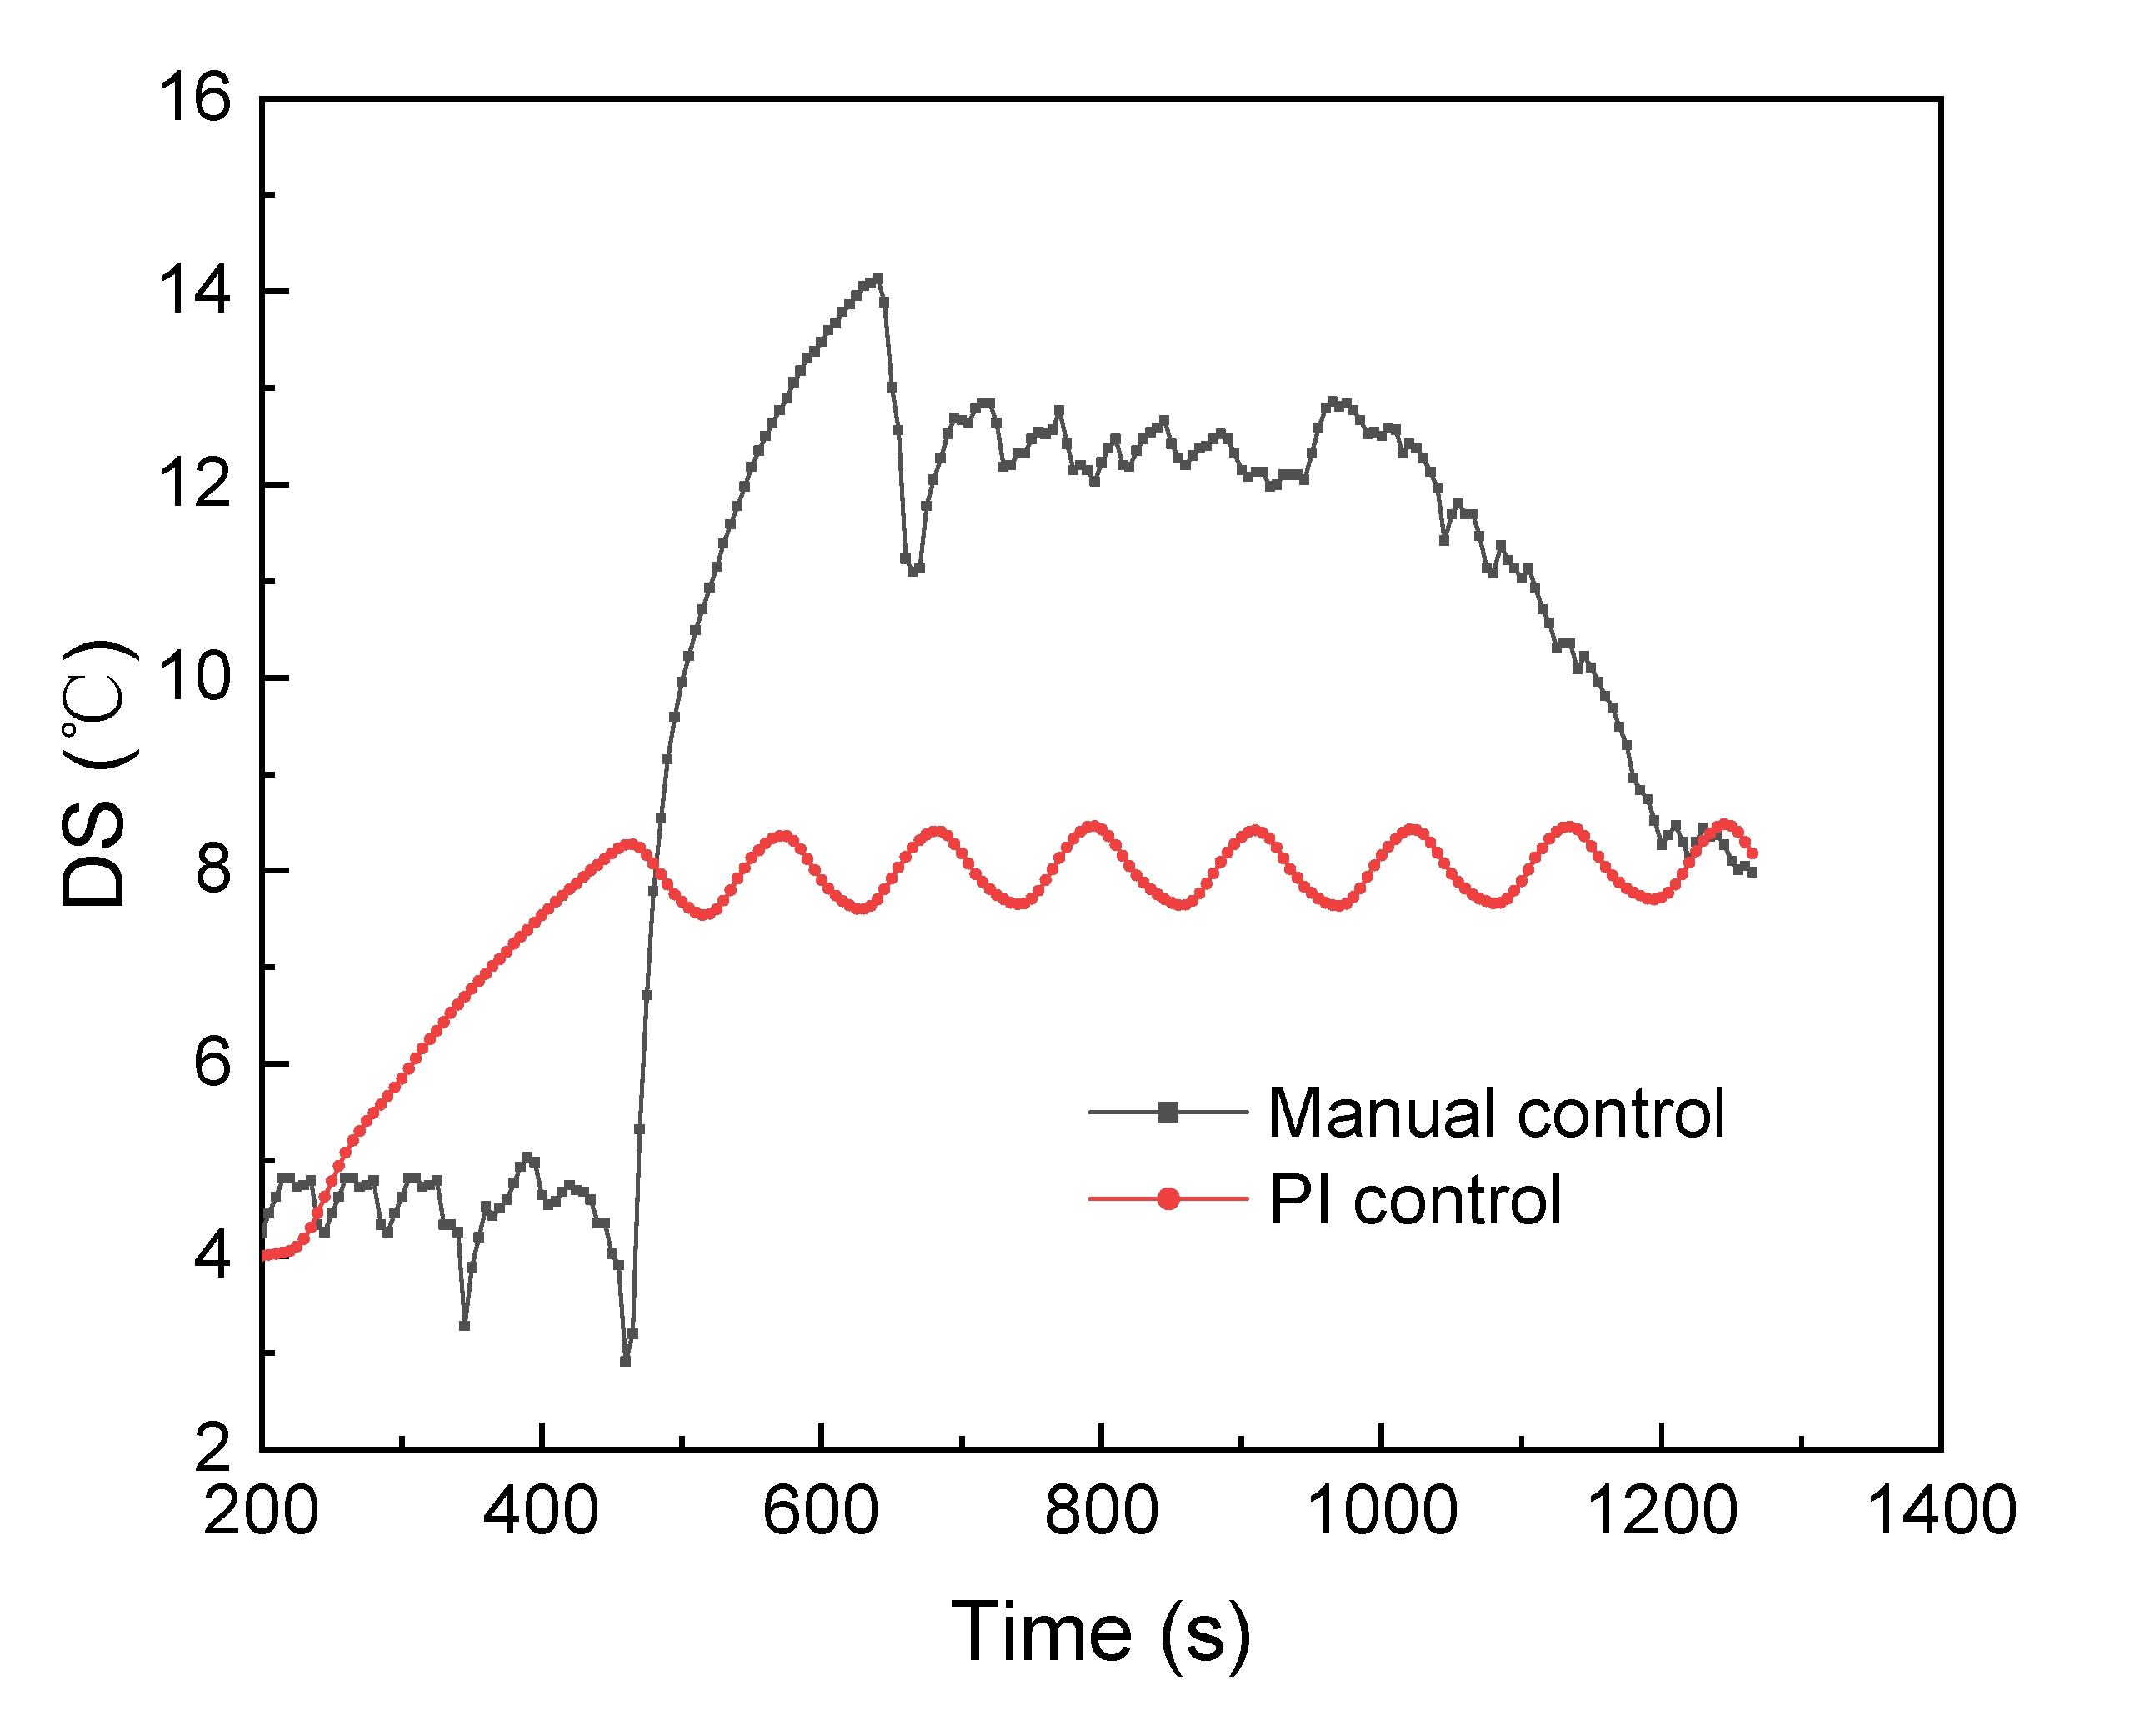
Figure 10b that the optimized PI control algorithm parameters can achieve good control of EXV1, and the parameters are Kp = 1.1 and Ti = 14. Therefore, the same experimental debugging can be performed when the refrigerant pump opening is 60% and 80%. As shown in
Figure 11, it is the response curve of the EXV1 manual and PI control DS. It can be seen that in the actual manual control process, the response is slow, the debugging process is long and fluctuates due to the presence of human factors. The PI control can respond more quickly and with less overshoot, i.e., with a maximum overshoot of 5.8% compared to manual control.
In summary, a complete experimental system debugging solution can be obtained. The solution identifies the functional parameter settings and the PI control that is more efficient and convenient compared to manual control before achieving the control capability of EXV. By using the solution, the setting and debugging of similar experimental systems can be completed more efficiently, thereby improving the efficiency of the experimental process.


