Article

Meteorological Data Warehousing and Analysis for Supporting Air Navigation

by
Georgia Garani
1,*,
Dionysios Papadatos
2,
Sotiris Kotsiantis
3 and
Vassilios S. Verykios
2
1
Department of Digital Systems, University of Thessaly, 41500 Larisa, Greece
2
School of Science and Technology, Hellenic Open University, 26335 Patras, Greece
3
Department of Mathematics, University of Patras, 26504 Patras, Greece
*
Author to whom correspondence should be addressed.
Informatics 2022, 9(4), 78; https://doi.org/10.3390/informatics9040078
Submission received: 17 August 2022 / Revised: 26 September 2022 / Accepted: 28 September 2022 / Published: 4 October 2022
(This article belongs to the Section Big Data Mining and Analytics)

Abstract

:
Data analysis of weather phenomena to either predict or control human imprint on the environment requires the collection of various forms of observational data ranging from historical and longitudinal to forecast. The objective of this research paper is the development of a data warehouse (DW) based on a new hybrid logical schema, concerning the assimilation and maintenance of historical meteorological data from all operating airports in Greece, along with data in the Greek Flight Information Region related to flight delays and cancellations. SQL is used for querying these data and makes them easily accessible and manageable. The data from the DW are collected and used as training data for the induction of predictive models. In this study, the prediction problem is cast as a classification task, and different decision tree induction techniques are applied to build accurate models that allow flexible scheduling and planning for the minimization of waiting time and inconvenience of passengers.

1. Introduction

Weather conditions affect several every day activities, such as social meetings, sports, leisure, and holidays. For instance, rain may postpone or even cancel festive celebrations, and snow or fog can delay or change traveling plans. Meteorological data concern mainly the temperature, pressure, humidity, wind speed and wind direction, visibility, dew point, cloud cover, and precipitation amount. Accurate weather forecast in this framework is deemed essential for preventing or reducing the impact of extreme unpredictable and undesirable situations.
Meteorological conditions greatly affect air traffic, as a severe weather phenomenon may lead to flight cancellation, although in a less optimistic scenario, it is possible to cause damage to the aircraft during the flight. As another example, a rainy day of increasing precipitation may flood the runway, while the airport is in full functioning mode. As a result of these phenomena, many flights will be delayed, while others will be canceled. Prediction of such situations could be extremely useful in informing staff and passengers and avoiding complaints and compensations, not to mention serious accidents that diminish the trustworthiness of this mode of transportation.
Data warehousing assists knowledge workers by providing tools, methods, and techniques for performing data analysis for business intelligence (BI), business analytics, and decision-making strategies in various application fields [1]. A data warehouse (DW) is a type of database (DB) suitable for collecting a huge amount of heterogeneous historical data from multiple data sources, integrates and stores them and processes queries on them. The main characteristics of a DW are subject-oriented, integrated, consistent, time-variant, and non-volatile [2]. Data are usually consolidated from several different external sources. A DW is designed primarily for query and analysis of historical data rather than for daily transaction processing, and this is the main reason that it is chosen in this study as an alternative of a relational DB. On the other hand, some solutions have also been proposed towards a NoSQL DW approach; however, the proposals recognize several limitations, such as lack of standardization, software incompatibilities, inability of using the ELT process, data duplication, and as a result larger storage space need, joins, and aggregate functions may not be supported, which prove that such systems are still immature, questionable and problematic [3].
The objective of this research work is the development of a DW which includes meteorological as well as flight data collected over the last 10 years from all Greek active airports which are under the supervision of the Civil Aviation Service (CAA) and the Hellenic Air Force (HAF) for assisting decision-making processes and supporting airlines and airport operations. The gathered historical data come from measurements in the vicinity of the airports and meteorological stations that automatically collect various types of information within a close proximity to them. In particular, through their analysis, useful conclusions may be extracted related to forecasts and regarding the avoidance of flights that are scheduled to take place in the midst of severe weather phenomena. In addition, from a business point of view, travelers and airlines have the potential to save money and time, knowing that a flight is likely to be delayed or canceled due to adverse climate conditions. The frequency and severity of such extreme events is increasing recently due to the climate change, and this fact is expected to cause more disruption to global air services. For example, it would be very helpful to see if a strong wind could cause flight delays at an airport or how many flights have been canceled one day due to heavy rain in one area. Towards this direction, a new DW logical schema, the hybrid schema, was proposed by combining the three already known main DW schemas.
Prevention and treatment of weather-related flight disruptions is an important service which may be used by airlines, airport operations, air traffic management and control, and travelers for improving services, operations, safety, and customer satisfaction. A large amount of data that are collected in this context will allow for the automatic generation of new patterns through the application of different machine learning techniques such as supervised and unsupervised learning, reinforcement, and deep learning. In this study, the prediction problem of identifying the critical factors among the different dimensions of the collected data that influence and negatively affect the normal operational mode in an airport is considered as a classification task, and different decision tree induction techniques are applied, by using different libraries provided by the R programming language.
To conclude, the contributions of this paper are threefold. Firstly, a newly proposed DW logical schema was proposed, the so-called hybrid schema, as the integration of the three main DW schemas. Secondly, the development of a DW is presented, based on this hybrid schema, where meteorological data are integrated with navigation data for extracting comparative performance data, and finally, the adoption of machine learning methods for identifying induced patterns was proposed for prediction and planning purposes.
The remainder of the paper is structured as follows: Section 2 discusses briefly related work. Section 3 presents the materials and methods used, and in particular, it includes the collected and stored datasets and the new DW logical schema proposed. Section 4 describes the experimental setup. Results and discussion are provided in Section 5, where data querying and management and intelligent data analysis are presented. Finally, in the last section, the paper is concluded, and future research directions are also included.

2. Literature Review

There is a plethora of research papers which combine meteorological data with flight data for predicting airline delays using data mining, machine learning, and decision analysis methods. Due to space limitations, only some papers are presented briefly below in chronological order.
Weighted Multiple Linear Regression is applied in [4] for anticipating flight delays occurrence due to weather conditions. Several factors are considered, for example departure and arrival time, origin, and destination which are used for identifying an alarming repeated event.
In [5], a model is proposed for predicting airline delays due to bad weather conditions. Ten years of weather and flight data from the US are used, in which the authors apply data mining techniques and supervised machine learning algorithms. The trained model is cast as a binary classification for estimating scheduled flight delays.
A flight delay prediction system is presented in [6] based on weather factors such as rain, humidity, temperature, and visibility. Supervised learning techniques that rely on rule-based approaches and the Naïve Bayes classification algorithm are used towards this research direction. The authors claim that real-time prediction is achieved with promising results.
Reference [7] considers a broad set of factors which affect flight delays. A number of machine learning architectures are suggested for solving this problem. Classification and regression tasks are designed and used. They conclude that a random forest-based method gives satisfactory results and adequate performance.
Machine learning and deep learning techniques are used in [8] for predicting possible delays of flights caused by different reasons including weather conditions. Different tree-based approaches are optimized, compared and evaluated.
A flight delay prediction algorithm applying a gradient boosting machine learning process is proposed in [9]. Historical data are used, and spatiotemporal features are also considered for achieving a good generalization performance of the proposed algorithm.
A very recent and thorough literature review from studies which have been undertaken over the last two decades is presented in [10] about data science techniques used for examining flight delays which happen due to weather conditions as well as other parameters. A taxonomy is presented based on their methods, data analytics, and data management approaches.
The papers presented above do not consider data warehousing for assisting the process of predicting flight delays and other weather inclined undesirable phenomena. To the best of the authors’ knowledge, there are only a few papers reported on developing a meteorological DW towards this research direction. These works are presented briefly below. However, flight cancellations are not considered in any of these studies, nor the application of machine learning techniques.
In an early attempt, the process of developing a DW for MeteoSwiss, the Swiss national weather service, is described in [11]. Meteorological and climatology data are integrated, and their life cycle from inception to deployment is depicted. As the authors claim, the proposed DW is not a pure DW but rather adopts several components from the DW technology.
A climatic DW based on dimensional modeling is developed in [12] for the Mexico National Weather Service (SMN). The DW integrates data collected from different weather stations across Mexico. The authors argue that the model provides several geographic capabilities such as data aggregation and visualization and achieves high performance.
An agent-based data warehousing system is applied in [13] for integrating weather data from different sources. The system developed provides appropriate information to various weather-based applications in heterogeneously distributed environments.
Reference [14] presents a meteorological conceptual DW model for Uttarakhand region in India. The model uses the snowflake schema approach for efficient data storage and manipulation.
Reference [15] develops a DW for hydro-meteorological data of the city of Manizales in Colombia. The conceptual model is designed as a star schema. OLAP tools are applied to the historical data for multidimensional analysis and knowledge discovery.
A hybrid DW is described in [16] for storing climate data from the National Climatic Data Center (NCDC) of Saudi Arabia. The proposed model is based on Hadoop framework. Weather patterns are identified which can be used for emergency plans in order to encounter severe weather conditions.
In [17], a DW is used for studying the data protection software of an air traffic control production information statistics system. While meteorological and flight data are considered, the system presented in this work is mainly oriented to data statistics without including a detailed presentation of the development of the DW or any predictive model.

3. Materials and Methods

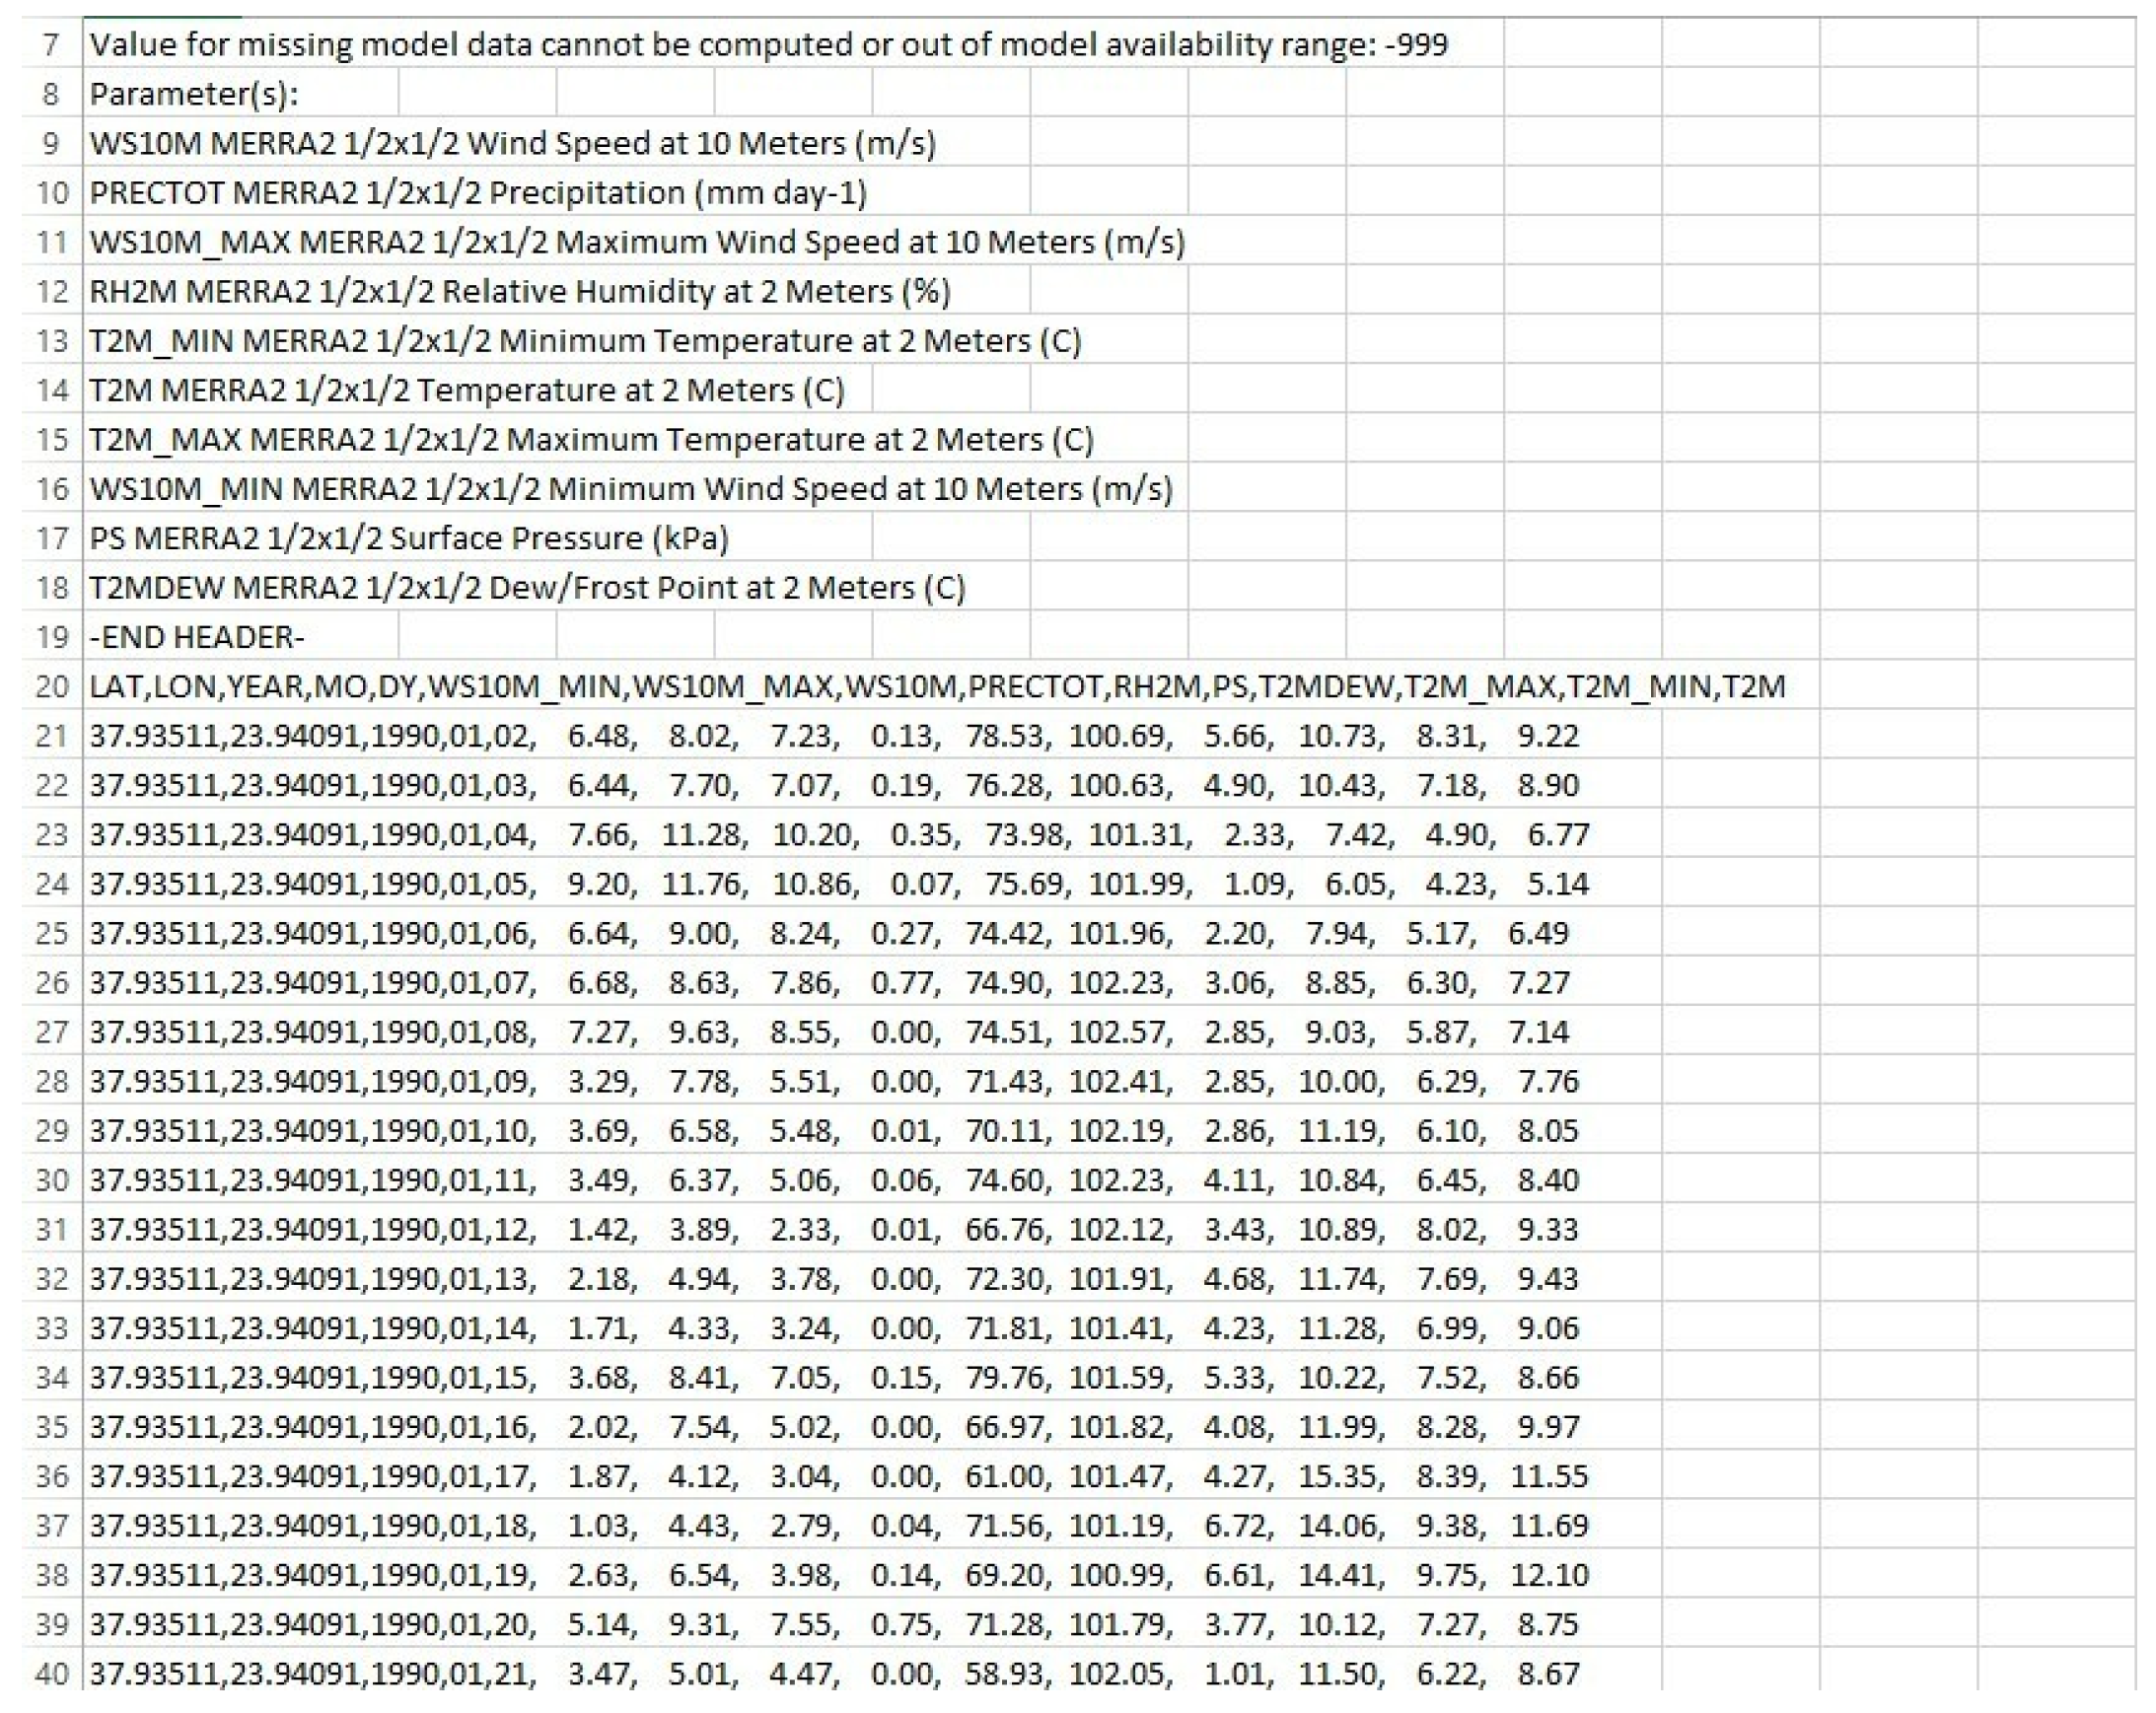
3.1. Description of the Dataset

Greece has 47 operating airports. Greek airports are divided into two categories, military and civil where civil could be either international, national, or municipal. The ecosystem of these airports generates an enormous amount of data that can be used in a number of different ways. In what follows, the types of data which are of interest for the application under study are described, based on which the DW is modeled and the predicting models are built.
Meteorological data were collected from two different websites. Specifically, Weather Underground (wunderground.com (accessed on 20 July 2022)) is a weather service that provides real-time meteorological information through its network. The network consists of over 250,000 personal and official meteorological stations. The data provided from wunderground concerns temperature, dew point, wind, humidity, and pressure. The second data source is NASA data access viewer (https://www.power.larc.nasa.gov/data-access-viewer (accessed on 20 July 2022)), which is a mapping application that contains information on solar geothermal energy, meteorology, and clouds and is developed to help the design of renewable energy systems, meteorological forecasts, and crop soil selection. The meteorological parameters of the tool are derived from the assimilation models GMAO MERRA-2 and GEOS 5.12.4 FP-IT. The first one is a new version of NASA’s Geos data acquisition system. Both models have the same grid resolution and the same physics models, while the latter has the ability to measure surface precipitation. The data provided by NASA complement the data supplied by Wunderground. In particular, precipitation data are provided only from NASA source. Additional meteorological data for some airports, mainly regional, such as those located on islands and for some time periods of the total collection task, were also given exclusively from NASA. Using the NASA power data access viewer and entering the longitude and latitude of the central facilities of the 47 Greek airports, as well as the start and end dates for the time period under study, meteorological data were obtained.
Navigation data were collected from two webpages, flightradar24 (flightradar24.com (accessed on 20 July 2022)) and flightstats (flightstats.com/v2 (accessed on 20 July 2022)), which offer delays and cancellations of flights that took place in Greece the last 10 years. The two websites complement each other up to a point, for supplying a larger amount of data; for example, flightradar24 contains data mainly for internal flights. Flightstats, on the other hand, includes international flights; however, it reveals only the delays, in contrast to the flightradar24, where flight cancellations are also provided.
Data have to be extracted from the abovementioned websites, cleaned, converted to appropriate format, integrated and finally loaded to the DW. The so-called extract-transform-load (ETL) process is a time-consuming and demanding mechanism, and careful consideration has to be taken for completing this task.

3.2. The DW Design

Design is an essential step in the construction of a DW. The development of the DW schema is part of the data modeling process. The schema describes reality and contains detailed and summarized data which are needed to be stored in the DW. It depicts the way of how data are organized as well as their associations. The main approaches to the DW schemas are star, snowflake, and constellation.
The major difference between the star schema and the snowflake schema concerns dimension tables. In the star schema all dimension tables are denormalized, while in the snowflake schema all dimension tables are completely normalized. Thus, the fact table is linked to multiple primary dimension tables, and these dimension tables are linked to other secondary dimension tables and so on, satisfying the normalization property. The constellation schema comprises multiple fact tables with different semantics containing some common dimension tables. Other schemas have also been proposed over the years, i.e., the starnest schema in [18] using nested methodology where the denormalized dimension tables are transformed to nested dimension tables for efficient query execution.
In this work, a new schema was proposed, as a combination of the three original schemas. The novel schema is called hybrid, since it is composed of the different characteristics which represent each of the three initial schemas.
Hybrid schema: {star + snowflake + constellation} schemas.
To be more specific, the hybrid schema is structured as described below. It consists of a constellation schema where more than one fact tables share one or more dimension tables, and additionally, at least one fact table forms a star schema with numerous dimensions and another fact table forms a snowflake schema with several primary and secondary dimensions. In fact, all schemas, either star or snowflake, having Date and Space dimensions and sharing common semantics, may be integrated. The result is a hybrid schema as shown in Figure 1.

4. Experimental Study

In this research work, two semantically different datasets were used, meteorological data and navigation data. The two datasets share spatiotemporal data concerning dates and airports in particular. Spatiotemporal objects and the way of modeling them in DWs are extensively discussed in [19]. For the design of the DW, a new hybrid schema presented in the previous section is adopted as the appropriate schema for representing the multidimensional model. It is designed as a collection of a star schema and a snowflake schema which share a number of common dimensions. The schema of the proposed model consists of two fact tables, MeteoFact and FlightFact, and four dimension tables, WindScale, RainIntensity, Date, and Airport. The last two dimension tables are shared from both fact tables. WindScale and RainIntensity dimension tables are connected to the MeteoFact table. The schema of the proposed hybrid MeteoFlight DW model is shown in Figure 2.
Table 1 depicts the 13 different wind types, and Table 2 the five different rainfall categories.
The semantics of the DW attributes are explained in Table 3.

ETL Process

An important stage of data warehousing and part of BI process are the ETL to ensure data cleansing and purification. In the majority of cases, the direct loading of data into the target system is not achievable due to heterogeneous, incomplete, or even incorrect data.
Therefore, in this study, after data extraction, the next step is to upload all csv files. However, data files come from different sources with different coding, and as a consequence, they cannot be uploaded without being previously cleansed. As an example, in Figure 3, a csv file of one of the airports containing meteorological data is displayed, where it is obvious that diversity and poor formatting prevent smooth uploading of data to the DW.
The cleansing stage includes data splitting and column conversions and data structure reformatting for their transformation to a standardized format ready to be loaded to the DW. In Figure 4, the raw data presented in Figure 3 are transformed after cleansing to a readable and understandable format.
The transformation process also corrects the data, removes any incorrect data and fixes any errors in the data before loading it. Missing data, an inevitable part of the ETL process, may cause distortion to findings. In this case study, large airports are fully staffed, and therefore, data are collected automatically and continuously (every half an hour). However, in small airports with low traffic, the staff number is insufficient, and automatic or semi-automatic meteorological stations do not exist. For example, at the large airport of Heraklion, there are staff members who do the data entry of the meteorological data and a semi-automatic meteorological station that operates all day long, and therefore, the measurements are collected regularly every half hour. At Samos airport, there is no such station, but there are enough staff members to cover most of the 24 h; as a result, the measurements are collected every hour. Finally, at the airport of Sitia, which is a small airport, there is no such station, and staff consists of only two people working for a maximum of 16 h, resulting in 8 h of missing meteorological data. In addition, other unexpected factors can cause data loss, such as equipment damage from a severe storm, which results in no data being produced until the damage is repaired. To conclude, a fully staffed airport in both personnel and equipment collects weather data every half hour every day for the whole year. Any restriction on the above will lead to missed data and gaps that are filled with the day’s averages.
As for the existence of incorrect data, this is either from human error when entering data or from a fault in one of the station sensors, where produced data have a large deviation from the real ones (e.g., temperature of 20 °C instead of 35 °C). These errors are almost never detected as the only way to see the data deviation is through a comparison that can be made at an airport, where there are many stations on and off it, which is not often the case, especially on small airport islands.

5. Results and Discussion

5.1. Data Querying

In this section, a number of SQL queries are presented for showing the functionality of the proposed DW, but also useful conclusions were drawn regarding the correlations that exist between flight delays and cancellations with the various meteorological data prevailing at airports during flights. Specifically, the impacts of the precipitation height, wind intensity, and temperature to air navigation events were examined.
With the following queries, the number of delays and cancellations are presented by setting some specific limits on the three main meteorological factors that affect them.
  • Query 1: Delays and cancellations depending on the wind factor per airport
This query retrieves the number of delays and cancellations, depending on the intensity of the wind and the airport. A wind intensity limit of 33 knots was used, which was considered a relatively strong wind intensity. From the results, it was observed that the delays above this intensity were 20.3 times higher in relation to intensities less than this number and for cancellations this number doubles. Unfortunately, no indication for the direction of the wind was provided except for its intensity, which is an important constraint, since a parallel wind to the runway hardly proves to be prohibitive for the smooth conduct of a flight, whereas a vertical wind of even lower intensity is capable of being vital for the completion of the flight.
SELECT COUNT (FF.Delays), COUNT (FF.Cancelations), A.AirportKey
FROM FlightFact FF, MeteoFact MF, Airport A
WHERE MF.WS10M > 33
AND A.AirportKey = FF.AirportKey
AND A.AirportKey = MF.AirportKey
GROUP BY A.AirportKey
  • Query 2: Delays and cancellations depending on precipitation factor per airport
With this query, the effect that a given precipitation quantity may have on aeronautical events was demonstrated. In this example, the limit of 40 mm of precipitation was set, which was interpreted as a quantity of 40 tons of water that falls in one day in an area of one acre. From the results, it was concluded that precipitation affected flight delays and cancellations significantly. Specifically, 15 times more delays were noticed, when precipitation was greater than 40 mm, and similarly, for cancellations this number was 23.3 times higher.
SELECT COUNT (FF.Delays), COUNT (FF.Cancelations), A.AirportKey
FROM FlightFact FF, MeteoFact MF, Airport A
WHERE MF.Precipitation > 40
AND A.AirportKey = FF.AirportKey
AND A.AirportKey = MF.AirportKey
GROUP BY A.AirportKey
  • Query 3: Delays and cancellations depending on temperature factor per airport
This query presents the effects of temperature on delays and cancellations. It can be easily observed that high temperature, i.e., greater than 35 °C, had also an important influence to the departures of aircrafts. In particular, the number of delays increased 18.5 times and the number of cancellations 20.5 with hot weather. This may be caused by several reasons, such as the fact that the health of airport ground crew exposed to heat may be affected and consequently flights may be disturbed.
SELECT COUNT (FF.Delays), COUNT (FF.Cancelations), A.AirportKey
FROM FlightFact FF, MeteoFact MF, Airport A
WHERE MF.T2M > 35
AND A.AirportKey = FF.AirportKey
AND A.AirportKey = MF.AirportKey
GROUP BY A.AirportKey
Table 4 displays the results of the above queries. In particular, after some basic simple calculations, the results showed a summary of comparisons for average delays and cancellations of flights in all Greek airports for the last 10 years associated to three meteorological factors, i.e., wind, precipitation, and temperature.
The results demonstrated the important influence that the weather has on aviation services, which as a consequence can seriously affect subsequently airports and on board crew, passengers, airline companies, as well as air traffic control.
Obviously, more advanced queries can also be useful for retrieving valuable information from the data. For example, useful conclusions can be drawn by joining wind and precipitation factors in combination with the length of airport runways, such as how this affects flight delays and cancellations.
Information retrieval using SQL is the first step of the present procedures for extracting comparative and statistical data which will be used in the subsequent subsection, where more advanced techniques based on machine learning methods will be applied for the prediction of flight delays and cancellations, depending on specific weather factors, i.e., wind, precipitation, and temperature.

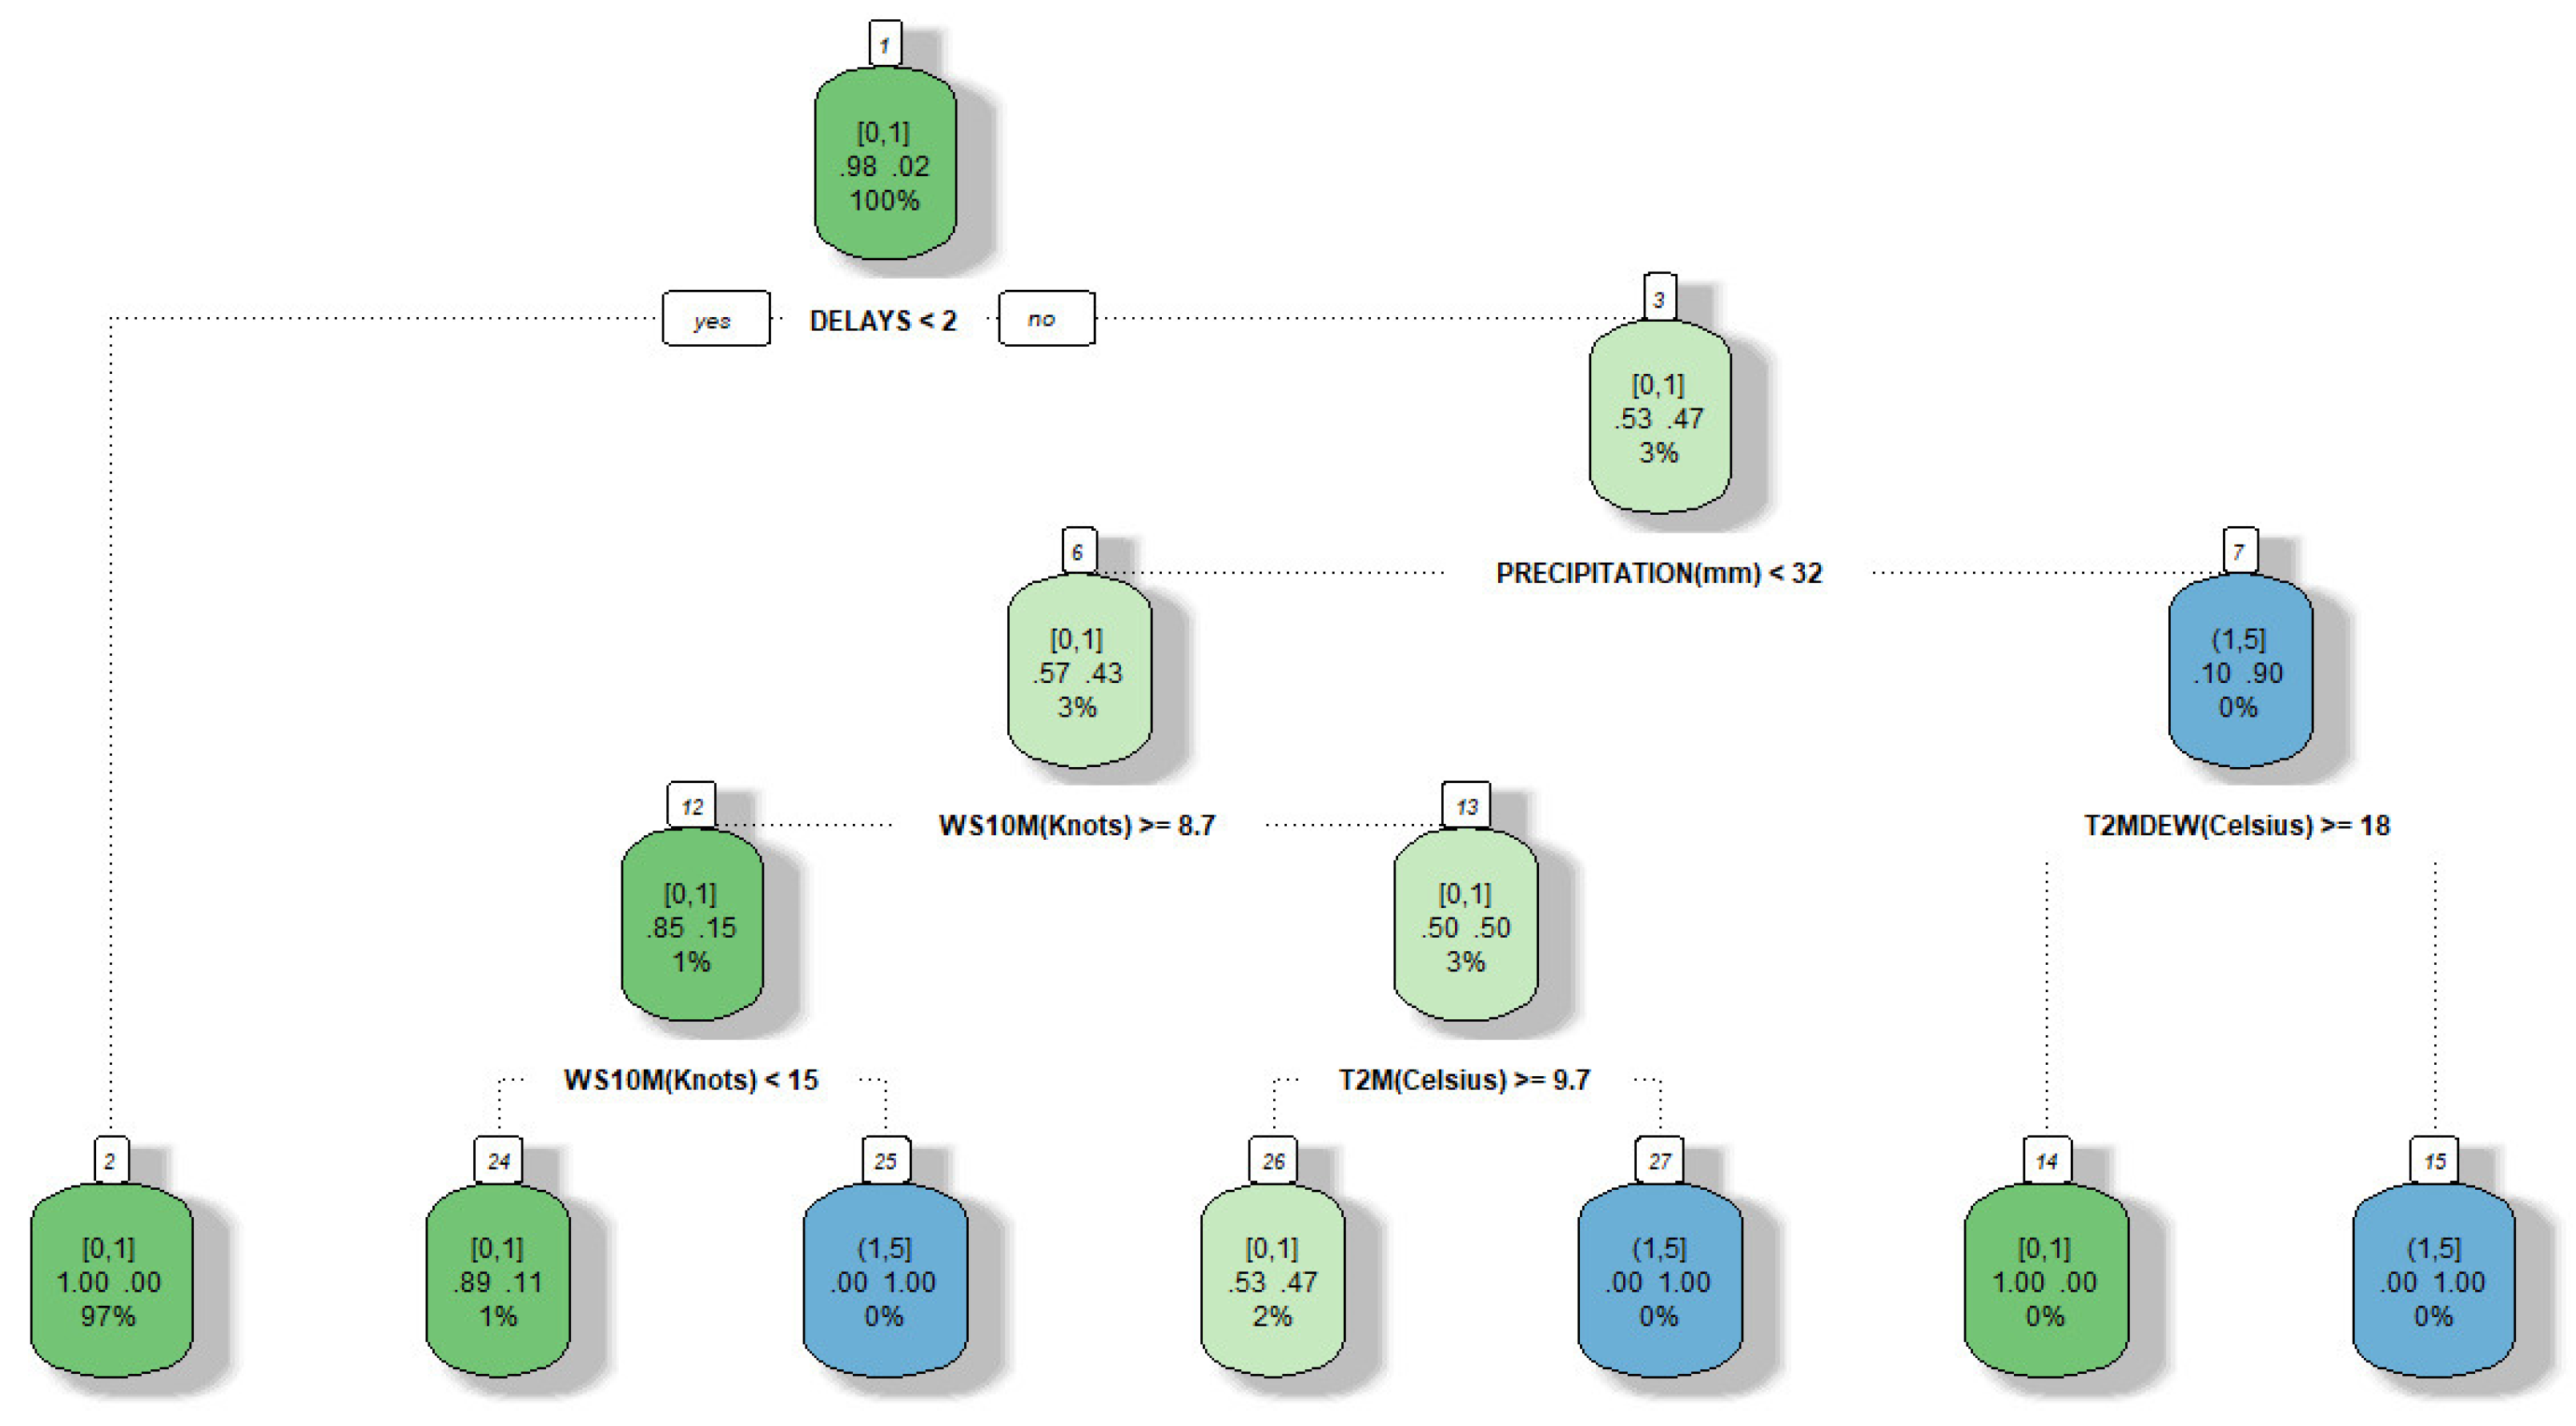
5.2. Intelligent Data Analysis

The methodological approach employed in this study and the results obtained by performing different types of analysis on the data collected are presented in this subsection. The dataset contains in total 15 variables, three of which are related to the date and time dimensions, 10 are numeric and relevant to the different measurements of the weather conditions, and two are encoding the concept under investigation, i.e., the delays and cancellations due to weather conditions prevailing in different airports in Greece. In this study, these two attributes were modeled as categorical attributes. Different experiments were conducted to find out how the date and time dimensions along with the weather-related measurements affect these two variables, which are considered as class attributes for the predictive task at hand. For the analysis, the R programming language was used along with the Rattle graphical user interface.
Initially, different characteristics of the predictor variables such as central tendency and dispersion measures, and the existence of missing values were explored. The correlations among pairs of numeric predictor variables were computed and are presented in Figure 5.
The high correlation among the groups of variables referring to the same type of measurement (there are two such groups indicated by the 4 × 4 and 3 × 3 blue dot matrices in Figure 5) indicated that all but one of the variables in each such group should be removed. For this reason, in the present analysis, only the T2M variable in the first group and the WS10M in the second group were maintained.
In order to make the experiment more reliable, the CANCELLATIONS variable was discretized into a binary factor variable with two levels: [0,1] and (1,5]. The first level represented the cases where a maximum of one cancellation happens in a day. The second level encoded the days when two to five cancellations happened. The decision tree in Figure 6 sheds light on the main reasons when and how these two values emerged.
A decision tree performs a feature selection by incorporating only those attributes that are deemed to be important for the explanation of the class attribute. It also prioritizes the attributes in a way that the most important attributes lie at the top of the tree. In the present case, the variables DELAYS and PRECIPITATION seem to be the most informative ones, followed by WS10M, T2MDEW, and T2M. Due to the imbalance between the two levels of the class attribute (there is a very large percentage of examples in the first level compared to in the second one), the nodes representing cancellations are very sparse with limited statistical importance. The following rule collects the strong cases where a large number of cancellations are observed.
Rule number: 15 [CANCELLATIONS = (1,5] cover = 9 (0%) prob = 1.00]
DELAYS >= 1.5
PRECIPITATION (mm) >= 31.9
T2MDEW (Celsius) < 18.15
In this way, all three variables involved in this rule make the case for predicting a large number of cancellations.
In order to build a decision tree to predict the number of delays, the DELAYS attribute is discretized into three levels, [0,3], (3,6], and (6,9]. The induced decision tree shown in Figure 7 indicates that the number of delays is between 0 and 3 when the PRECIPITATION is less than 41, while for the values of PRECIPITATION larger or equal than 41, when the variable WS10M assumes values smaller than 6 knots, the number of DELAYS are bounded within the interval (3,6]. For the values of the PRECIPITATION which are larger or equal than 41 and the values of WS10M which are larger or equal than six knots, the number of delays grows larger and assumes values in the range (6,9].

6. Conclusions

The effect of meteorological data to air navigation was studied in this paper. A DW was deployed for managing weather data collected from airports and automatic meteorological stations near the area. These data were combined with flight data concerning delays and cancellations gathered from diverse sources. Real meteorological and flight data were used for this study, provided by publicly available archived datasets. The DW adopts a hybrid logical schema design proposed in this paper for the first time, as it is considered the best option for the problem studied. SQL queries are given for retrieving delays and cancellations, depending on wind, precipitation, and temperature factors per airport. Finally, a data mining framework was applied for the extraction of knowledge in regard to automatically building predictive models for gaining insights into the parameters that affect the operation of airports from extreme weather conditions.
To the best of our knowledge, this is the first attempt to consider combining data warehousing and machine learning techniques for predicting flight delays and cancellations based on meteorological data. Previous studies do not focus on integrating these two research directions to analyze flight delays and cancellations according to their impact on weather conditions but present each one separately.
The current approach is not exempt as to the existence of inaccurate or missing data in the ETL process. In addition, the usual disadvantages presented in decision tree induction techniques used for classification and prediction may occur, such as the difficulty of handling complex relationships between features and instability, since minor variations in training data can cause significant change in its structure. Nevertheless, the advantages of this method, e.g., simplicity, ease of understanding, less data cleaning required, and the potentiality to be applied to any type of data, outweigh limitations and make it a powerful tool used for intelligent data analysis.
Future research directions include the use of materialized views for precomputing and storing related aggregated data which can be used to feed learning algorithms with ready-made statistical information for more efficient building of the induced models, as well as to provide the induced models with the necessary information on the spot for the continuous deduction of new results. Additionally, an alternative solution, a NoSQL database, such as Cassandra, could be adopted, and its storing and querying performance could be compared to that of the current approach.

Author Contributions

Conceptualization, G.G. and D.P.; data curation, G.G., D.P. and V.S.V.; formal analysis, G.G. and S.K.; investigation, G.G. and D.P.; methodology, G.G. and S.K.; resources, D.P. and S.K.; project administration, G.G.; software, D.P. and V.S.V.; supervision, G.G. and V.S.V.; validation, G.G. and S.K.; visualization, G.G. and V.S.V.; writing—original draft preparation, G.G. and D.P.; writing—review and editing, S.K. and V.S.V. All authors have read and agreed to the published version of the manuscript.

Funding

This research received no external funding.

Institutional Review Board Statement

Not applicable.

Informed Consent Statement

Not applicable.

Data Availability Statement

Publicly available archived datasets were used in this study. Meteorological data can be found openly on Weather Underground at www.wunderground.com and NASA data access viewer at https://www.power.larc.nasa.gov/data-access-viewer (accessed on 20 July 2022). Navigation data were collected from two webpages, flightradar24 at flightradar24.com and flightstats at flightstats.com/v2 (all accessed on 20 July 2022).

Conflicts of Interest

The authors declare no conflict of interest.

References

  1. Tsoni, R.; Garani, G.; Verykios, V.S. Incorporating Data Warehouses into Data Pipelines for Deploying Learning Analytics Dashboards. In Proceedings of the 13th International Conference on Information, Intelligence, Systems and Applications (IISA 2022), Corfu, Greece, 18–20 July 2022. [Google Scholar]
  2. Inmon, W.H. Building the Data Warehouse, 4th ed.; Wiley Publishing: Indianapolis, IA, USA, 2005; pp. 29–33. [Google Scholar]
  3. Petricioli, L.; Humski, L.; Vrdoljak, B. The Challenges of NoSQL Data Warehousing. In Proceedings of the International Conference on E-Business Technologies, Belgrade, Serbia, 21–23 September 2021; pp. 44–48. [Google Scholar]
  4. Oza, S.; Sharma, S.; Sangoi, H.; Raut, R.; Kotak, V.C. Flight Delay Prediction System Using Weighted Multiple Linear Regression. Int. J. Comput. Sci. Eng. 2015, 4, 11668–11677. [Google Scholar]
  5. Choi, S.; Kim, Y.J.; Briceno, S.; Mavris, D. Prediction of weather-induced airline delays based on machine learning algorithms. In Proceedings of the IEEE/AIAA 35th Digital Avionics Systems Conference, Sacramento, CA, USA, 25–29 September 2016; pp. 1–6. [Google Scholar] [CrossRef]
  6. Borse, Y.; Jain, D.; Sharma, S.; Vora, V.; Zaveri, A. Flight Delay Prediction System. Int. J. Eng. Res. Technol. 2020, 9, 88–92. [Google Scholar] [CrossRef]
  7. Gui, G.; Liu, F.; Sun, J.; Yang, J.; Zhou, Z.; Zhao, D. Flight Delay Prediction Based on Aviation Big Data and Machine Learning. IEEE Trans. Veh. Technol. 2020, 69, 140–150. [Google Scholar] [CrossRef]
  8. Somani, S.; Pandey, P.; Sharma, M.; Safa, M. An Approach of Applying Machine Learning Model in Flight Delay Prediction-A Comparative Analysis. Geintec 2021, 11, 1233–1244. [Google Scholar] [CrossRef]
  9. Lu, M.; Wei, P.; Hem, M.; Teng, Y. Flight Delay Prediction Using Gradient Boosting Machine Learning Classifiers. Int. J. Quantum Inf. 2021, 3, 1. [Google Scholar] [CrossRef]
  10. Carvalho, L.; Sternberg, A.; Gonçalves, L.M.; Cruz, A.B.; Soares, J.A.; Brandão, D.; Carvalho, D.; Ogasawara, E. On the relevance of data science for flight delay research: A systematic review. Transp. Rev. 2021, 41, 499–528. [Google Scholar] [CrossRef]
  11. Häberli, C.; Tombros, D. A Data Warehouse Architecture for MeteoSwiss: An Experience Report. In Proceedings of the International Workshop on Design and Management of Data Warehouses, Interlaken, Switzerland, 4–8 June 2001; pp. 9.1–9.6. [Google Scholar]
  12. Velázquez-Álvarez, J.; Torres-Jiménez, J. Design and implementation of a climatic data Warehouse. In Data Mining III; Zanasi, A., Brebbia, C.A., Ebecken, N.F.F., Melli, P., Eds.; WIT Press: Southampton, UK, 2002; Volume 28, pp. 407–416. [Google Scholar] [CrossRef] [Green Version]
  13. Kalra, G.; Steiner, D. Weather Data Warehouse: An Agent-Based Data Warehousing System. In Proceedings of the 38th Hawaii International Conference on System Sciences, Big Island, Hawaii, 3–6 January 2005. [Google Scholar] [CrossRef]
  14. Dimri, P.; Gunwant, H. Conceptual Model for Developing Meteorological Data Warehouse in Uttarakhand-A Review. J. Inform. Oper. Manag. 2012, 3, 107–110. [Google Scholar]
  15. Duque-Méndez, N.D.; Orozco-Alzate, M.; Vélez, J.J. Hydro-meteorological data analysis using OLAP. Dyna 2014, 81, 160–167. [Google Scholar] [CrossRef]
  16. Hashim, H. Hybrid Warehouse Model and Solutions for Climate Data Analysis. J. Comput. Commun. 2020, 8, 75–98. [Google Scholar] [CrossRef]
  17. Lu, J. Data Protection Software for Civil Aviation Control Flight Information System Based on FPE Algorithm. Secur. Commun. Netw. 2022, 2022, 4150660. [Google Scholar] [CrossRef]
  18. Garani, G.; Helmer, S. Integrating Star and Snowflake Schemas in Data Warehouses. Int. J. Data Warehous. Min. 2012, 8, 22–40. [Google Scholar] [CrossRef] [Green Version]
  19. Garani, G.; Cassavia, N.; Savvas, I.K. An Application of an Intelligent Data Warehouse for Modelling Spatiotemporal Objects. Int. J. Big Data Intell. Appl. 2020, 1, 36–57. [Google Scholar] [CrossRef]
Figure 1. The generic hybrid schema of the DW model.
Informatics 09 00078 g001
Figure 2. The hybrid schema of the MeteoFlight DW model.
Informatics 09 00078 g002
Figure 3. An example of a raw csv file.
Informatics 09 00078 g003
Figure 4. Data presented in Figure 3 after cleansing.
Informatics 09 00078 g004
Figure 5. Correlations of predicted numeric attributes.
Informatics 09 00078 g005
Figure 6. Decision tree predicting the ranges of cancellations within a single day.
Informatics 09 00078 g006
Figure 7. Decision tree predicting the ranges of delays within a single day.
Informatics 09 00078 g007
Table 1. Wind types.
Wind KeyWind-Scale Characterization
1calm
2light air
3light breeze
4gentle breeze
5moderate breeze
6fresh breeze
7strong breeze
8moderate gale
9fresh gale
10strong gale
11whole gale
12storm
13hurricane
Table 2. Rainfall categories.
Rain KeyRainfall Characterization
0zero
1light
2moderate
3strong
4catastrophic
Table 3. DW attributes.
Table NameCategoryAttribute NameSemanticsUnit of Measurement
MeteoFactWindWS10M_MINminimum wind speed at 10 mKnots
MeteoFactWindWS10M_MAXmaximum wind speed at 10 mKnots
MeteoFactWindWS10Maverage wind speed at 10 mKnots
MeteoFactTemperatureT2M_MINminimum temperature at two meters above the groundCelsius scale
MeteoFactTemperatureT2M_MAXmaximum temperature at two meters above the groundCelsius scale
MeteoFactTemperatureT2M average temperature at two meters above the groundCelsius scale
MeteoFactTemperatureT2MDEWdew point temperature (the temperature where the humidity reaches 100%)Celsius scale
MeteoFactPrecipitationPrecipitation1 mm = 1 L of water that falls in one square meter precipitationMillimeters (mm)
MeteoFactMoistureRH2Mpercentage of relative humidity at two meters above the earth’s surface%
MeteoFactMoistureSurfacePressureatmospheric pressure reduced to the sea levelMillibar (mbar)
WindScaleWindScaleDescriptionwind intensity phase 1–13 (see Table 1)
RainIntensityPrecipitationRainfallDescriptionprecipitation intensity phase 0–4 (see Table 2)
Table 4. Comparison of average delays/cancellations affected by a meteorological factor.
Meteorological FactorDelaysCancellations
Ratio(%)Ratio(%)
Wind (> | ≤ 33 knots)20.31929.140.23916.4
Precipitation (> | ≤ 40 mm)15.01397.123.32227.1
Temperature (> | ≤ 35 °C)18.51822.720.52031.7
Publisher’s Note: MDPI stays neutral with regard to jurisdictional claims in published maps and institutional affiliations.

