Towards an Economic Cyber Loss Index for Parametric Cover Based on IT Security Indicator: A Preliminary Analysis

Abstract
:1. Introduction
- The U.S. industry 1-in-100 years return period produces total annual cyber catastrophe insured losses of USD 14.6 billion (this can include one or more events within the same year);
- Both on-premise and cloud service providers face exogenous threats from malicious third parties. Focusing on cloud service providers, the calculated probability of ransomware is four times larger than the probability of other outages;
- The costliest cyber catastrophe scenario is widespread data loss from a leading operating systems provider with potential to generate up to USD 23.8 billion of insured loss;
- The most likely cyber catastrophe loss scenario is widespread data theft from a major email service provider.
2. Review of Related Works
3. Methodology and Dataset Description
- The number of viruses blocked on each computer using Symantec software protection; virus protection software is designed to prevent viruses, worms and Trojan horses from getting onto a computer, as well as to remove any malicious software code that has already infected a computer;
- The sample covers all the countries where at least one computer is protected by Norton, the Symantec protection software;
- The number of intrusions blocked on each computer using Symantec software protection. The intrusion prevention system (IPS) is the Symantec Endpoint Protection client’s second layer of defense after the firewall. The intrusion prevention system is a network-based system. If a known attack is detected, one or more intrusion prevention technologies can automatically block it. For example, this technology prevents malicious files from getting to a hard drive in the first place. Unlike an antivirus, which looks for known malicious files, IPS scans the network traffic stream in order to find threats using known exploits and attack vectors. IPS does not detect specific files, but rather specific methods that can be used to get malicious files onto a network. This allows IPS to protect against both known and unknown threats (see Holm 2014), even before antivirus signatures can be created for them;
- The daily numbers are split by country;
- For the antivirus extract (i.e., the number of viruses being blocked by Norton over all the computers worldwide), there are 127,231 records over the period 1st July 2016 and 31st December 2018. One record consists of the number of viruses being blocked for one day in one country;
- For the IPS extract, there are 128,054 records. One record consists of the number of IPS being blocked for one day in one country.
- The first section will concentrate on Virus activities being blocked;
- The second section will concentrate on Intrusions being blocked;
- The third section will try to link the above two cyber activities with known events which happened on the Internet.
4. Symantec Antivirus activities
- Data from weekends is filtered;
- Only the countries where number of blocks were more than 100,000 are shown.
- 14–16 Dec. 2016;
- 24 Mar. 2017 (very high activity);
- 11 May 2017;
- 9 Aug. 2017;
- 16 Nov. 2017;
- 1 Mar. 2018;
- 1 Oct. 2018;
- 19 Oct. 2018.
5. Symantec Intrusion Activities
- Data from weekends is filtered;
- Only the countries where the number of blocks were more than 100,000 are shown.
- 21 Feb 2017;
- 6 and 12 Apr 2017;
- 2 Mar 2018;
- 1 May 2018 (highest activity recorded);
- 12 Jun 2018;
- 1 Oct 2018.
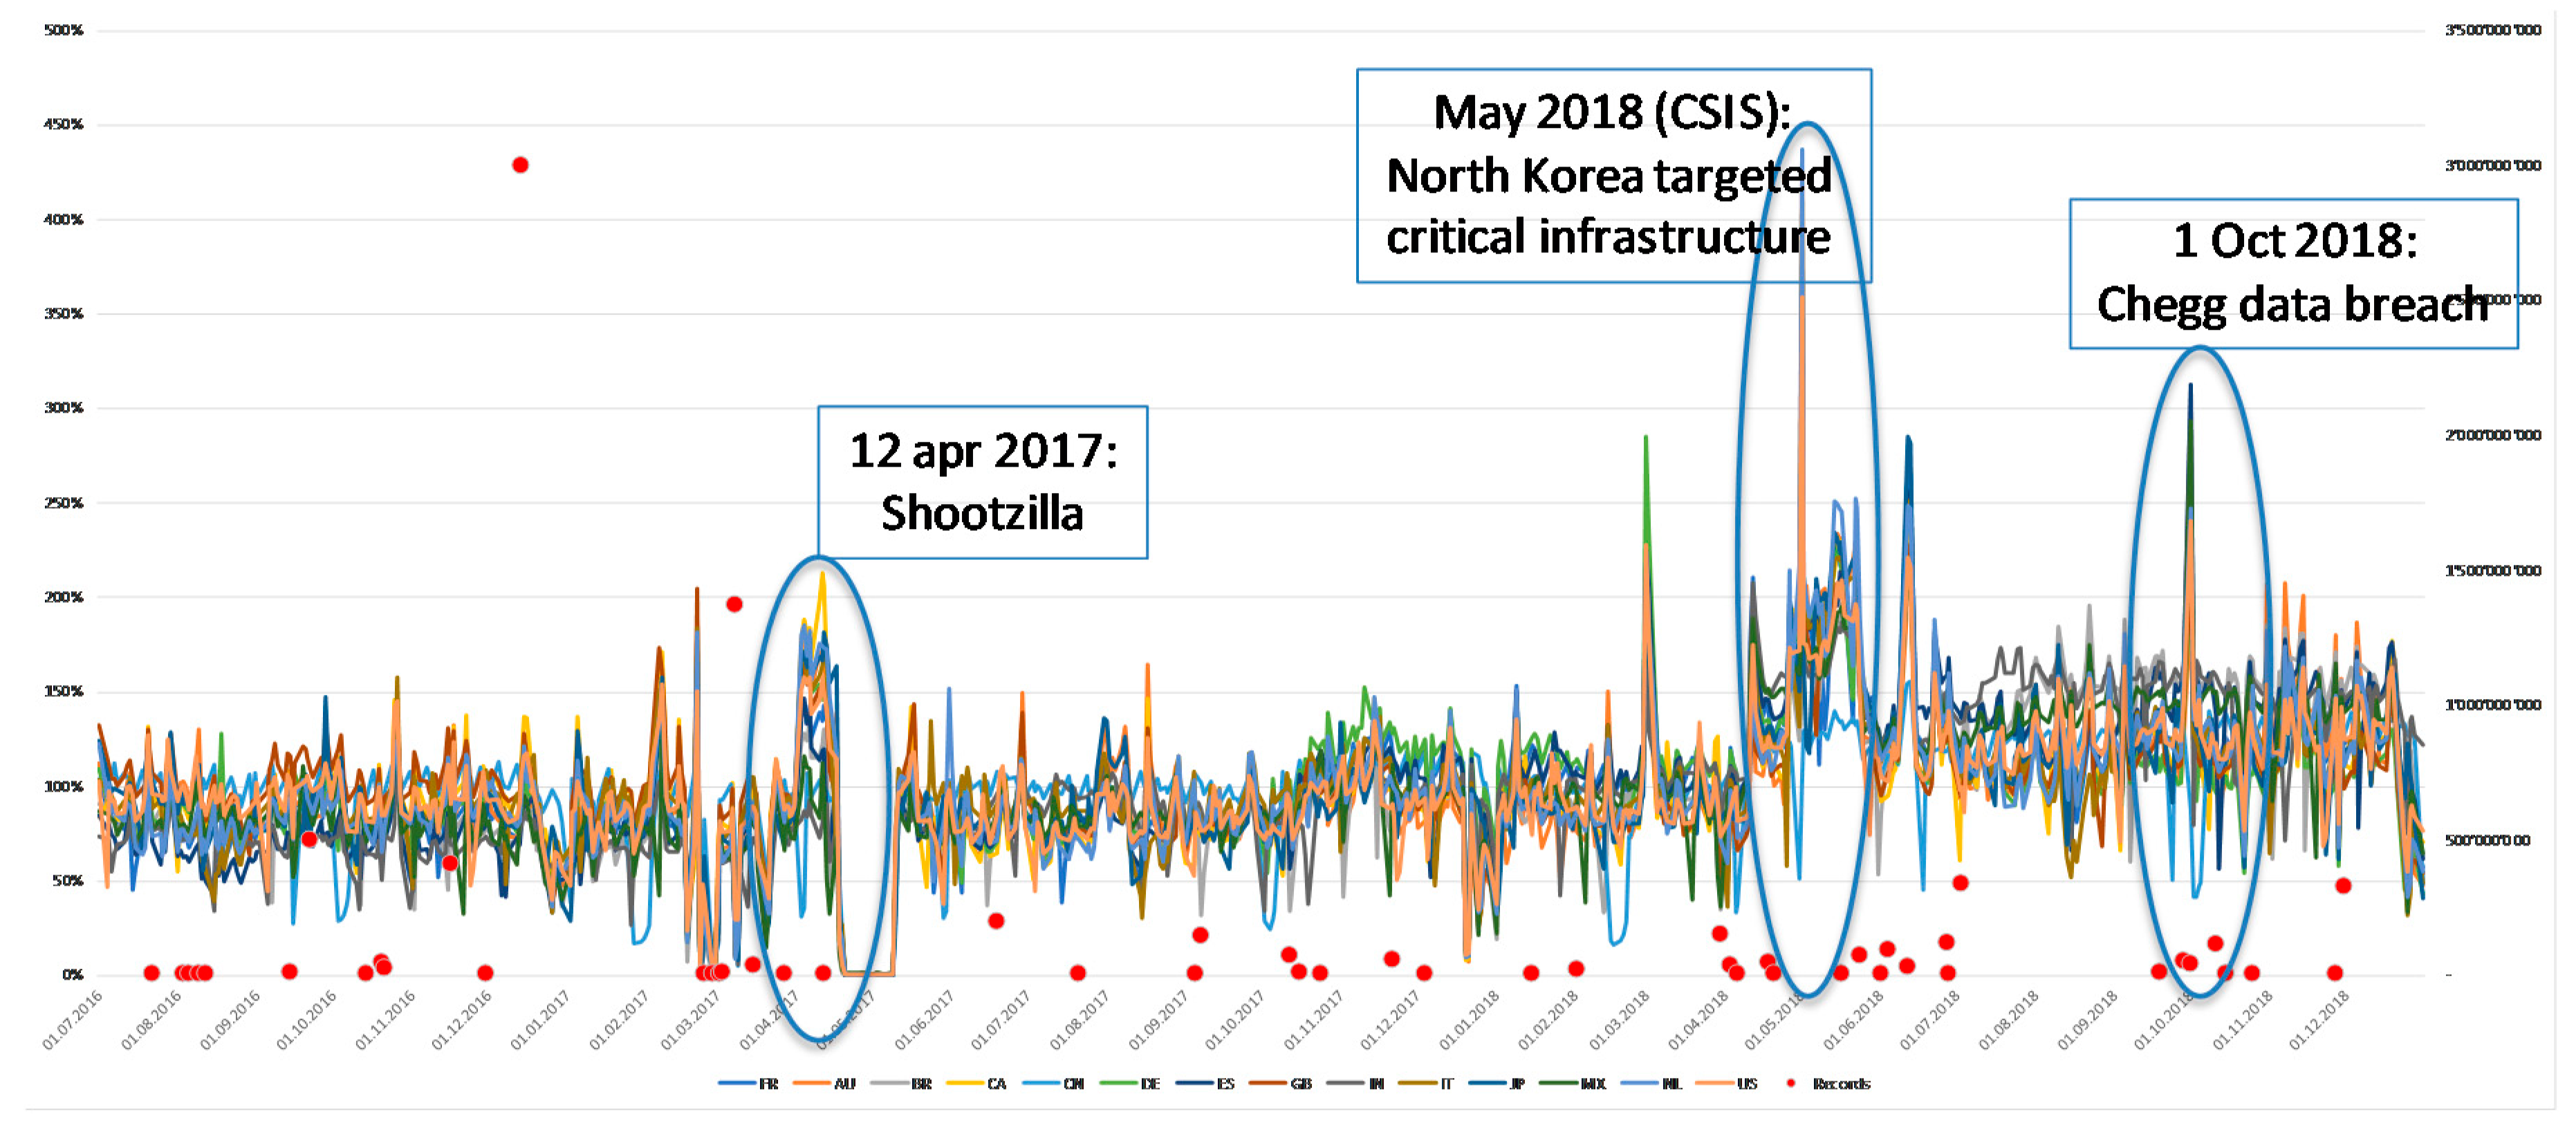
6. Cyber Activity vs. Known Data Breaches
- The date of the event shown on the database is the date when the event was disclosed publicly. However, it can relate to a time span which was much earlier and could have spread over many months;
- The events are only related to data breaches and do not include other types of cyber events.
- There is likely a delay (positive or negative) between the data breach events (positive or negative) and antivirus activity. In addition, the date of the event recorded on PrivacyRights.org is the date of the event being disclosed; it is not the date of the occurrence of the event. Such occurrence date is anyway difficult to assess as it may not be known at all (e.g., the Yahoo data breach occurred over many years/months, and the start date is not known precisely);
- The antivirus activity of Symantec may simply not be reflective of data breaches and the intrusion activity may be a better indicator;
- The data breaches recorded on PrivacyRights.org relate to large corporates, while both intrusion and antivirus activities of Symantec relate to end-user computers and not big servers of large corporates.
7. Conclusions
- The correlation matrix between IT activity in different countries confirms the systemic nature of this risk;
- The Symantec data shows that there are peak activities that could be the foundation for a cyber loss index.
- Obtain a good understanding of the IT event succession when cyber activity is seen. It relates, in particular, to the definition of the cyber event (e.g., when it started, when was at the peak, when it stopped) but also to the way in which the IT companies update their antivirus/intrusion software and how long such update would take;
- Get insurance loss data or at least loss data (e.g., from a police claims database) and try to model a dependence between IT activity and such loss data.
Funding
Conflicts of Interest
References
- Abadie, Aurélie. 2019. Cyber, la Reassurance Veut Lever Les Freins. Antony: L’argus de L’assurance. [Google Scholar]
- Billio, Monica, Mila Getmansky, Andrew W. Loc, and Loriana Pelizzon. 2012. Econometric measures of connectedness and systemic risk in the finance and insurance sectors. Journal of Financial Economics 104: 535–59. [Google Scholar] [CrossRef]
- Center for Strategic & International Studies. 2006. Significant Cyber Incidents since 2006. Available online: www.csis.org (accessed on 5 January 2020).
- Edwards, Benjamin, Steven Hofmeyr, and Stephanie Forrest. 2016. Hype and heavy tails: A closer look at data breaches. Journal of Cybersecurity 2: 3–14. [Google Scholar] [CrossRef] [Green Version]
- Eling, Martin, and Kwangmin Jung. 2018. Copula approaches for modeling cross-sectional dependence of data breach losses. Insurance: Mathematics and Economics 82: 167–80. [Google Scholar] [CrossRef]
- Eling, Martin, and Werner Schnell. 2016. What do we know about cyber risk and cyber risk insurance? The Journal of Risk Finance 17: 474–91. [Google Scholar] [CrossRef]
- Falco, Gregory, Martin Eling, Danielle Jablanski, Virginia Miller, Lawrence A. Gordon, Shaun Shuxun Wang, Joan Schmit, Russell Thomas, Mauro Elvedi, Thomas Maillart, and et al. 2019. A Research Agenda for Cyber Risk and Cyber Insurance. Stanford: Stanford University. [Google Scholar]
- Federal Bureau of Investigation. 2018. Internet Crime Report. Washington, DC: Federal Bureau of Investigation. [Google Scholar]
- Florêncio, Dinei, and Cormac Herley. 2013. Sex, Lies and Cybercrime Surveys. In Economics of Information Security and Privacy III. New York: Springer, pp. 35–53. [Google Scholar]
- Geneva Association. 2020. Exploring the opportunity for a Cyber Incident Data Exchange and Repository (CIDER). Geneva: Geneva Association. [Google Scholar]
- Guy Carpenter, Cybercube. 2019. Looking beyond the Clouds. New York: Guy Carpenter&Company LLC. [Google Scholar]
- Holm, H. 2014. Signature Based Intrusion Detection for Zero-Day Attacks: (Not) A Closed Chapter? Paper presented at the 2014 47th Hawaii International Conference on System Sciences, Waikoloa, HI, USA, January 6–9; pp. 4895–4904. [Google Scholar]
- Kasper, Daniel. 2019. Analyzing the Feasibility of Cyber Bonds by Stochastically Solving a Copula-based Model with Differential Evolution. Köln: University of Cologne. [Google Scholar]
- KPMG. 2016. Small Business Reputation & the Cyber Risk. Amstelveen: KPMG. [Google Scholar]
- Marotta, Angelica, Fabio Martinelli, Stefano Nanni, Albina Orlando, and Artsiom Yautsiukhin. 2017. Cyber-insurance survey. Computer Science Review 24: 35–61. [Google Scholar] [CrossRef]
- Swiss Insurance Association (Switzerland). 2017. Economic Impact of Cyber Accumulation Scenarios. Zürich: Cyber Working Group. [Google Scholar]
- Swiss Re. 2017. Cyber: Getting to Grips with a Complex Risk. Sigma Report 2017. Zürich: Swiss Re. [Google Scholar]


| Lag | France | Australia | Brazil | Canada | China | Germany | Spain | |||||||
| ADF | p.Value | ADF | p.Value | ADF | p.Value | ADF | p.Value | ADF | p.Value | ADF | p.Value | ADF | p.Value | |
| 0 | −10.23 | 0.01 | −9.71 | 0.01 | −12.73 | 0.01 | −10.31 | 0.01 | −10.55 | 0.01 | −9.98 | 0.01 | −10.28 | 0.01 |
| 1 | −8.99 | 0.01 | −8.71 | 0.01 | −9.55 | 0.01 | −8.65 | 0.01 | −9.51 | 0.01 | −8.93 | 0.01 | −8.46 | 0.01 |
| 2 | −7.39 | 0.01 | −7.17 | 0.01 | −7.28 | 0.01 | −7.11 | 0.01 | −8.31 | 0.01 | −7.06 | 0.01 | −6.82 | 0.01 |
| 3 | −6.87 | 0.01 | −6.94 | 0.01 | −6.91 | 0.01 | −6.44 | 0.01 | −7.7 | 0.01 | −6.66 | 0.01 | −6.44 | 0.01 |
| 4 | −6.24 | 0.01 | −6.39 | 0.01 | −5.94 | 0.01 | −5.4 | 0.01 | −7.29 | 0.01 | −6.24 | 0.01 | −6.16 | 0.01 |
| 5 | −6.52 | 0.01 | −6.48 | 0.01 | −6.01 | 0.01 | −6.34 | 0.01 | −7.51 | 0.01 | −6.36 | 0.01 | −6.01 | 0.01 |
| 6 | −6.36 | 0.01 | −6.12 | 0.01 | −5.72 | 0.01 | −5.86 | 0.01 | −7.29 | 0.01 | −6.26 | 0.01 | −5.78 | 0.01 |
| Lag | UK | India | Italy | Japan | Mexico | Holland | USA | |||||||
| ADF | p.Value | ADF | p.Value | ADF | p.Value | ADF | p.Value | ADF | p.Value | ADF | p.Value | ADF | p.Value | |
| 0 | −9.36 | 0.01 | −12.37 | 0.01 | −9.26 | 0.01 | −10.35 | 0.01 | −11.87 | 0.01 | −9.75 | 0.01 | −10.48 | 0.01 |
| 1 | −8.19 | 0.01 | −9.1 | 0.01 | −8.08 | 0.01 | −9.37 | 0.01 | −9.69 | 0.01 | −8.81 | 0.01 | −9.15 | 0.01 |
| 2 | −6.66 | 0.01 | −7.63 | 0.01 | −6.54 | 0.01 | −8.05 | 0.01 | −7.7 | 0.01 | −6.91 | 0.01 | −7.48 | 0.01 |
| 3 | −6.59 | 0.01 | −6.6 | 0.01 | −6.13 | 0.01 | −7.55 | 0.01 | −6.59 | 0.01 | −6.53 | 0.01 | −6.99 | 0.01 |
| 4 | −6.14 | 0.01 | −5.19 | 0.01 | −5.77 | 0.01 | −7.35 | 0.01 | −5.64 | 0.01 | −6.22 | 0.01 | −6.28 | 0.01 |
| 5 | −6.47 | 0.01 | −5.78 | 0.01 | −6.1 | 0.01 | −6.73 | 0.01 | −6.4 | 0.01 | −6.24 | 0.01 | −6.85 | 0.01 |
| 6 | −6.22 | 0.01 | −6.06 | 0.01 | −5.93 | 0.01 | −6.58 | 0.01 | −6.84 | 0.01 | −6.2 | 0.01 | −6.58 | 0.01 |
| FR | AU | BR | CA | CN | DE | ES | GB | IN | IT | JP | MX | NL | US | |
|---|---|---|---|---|---|---|---|---|---|---|---|---|---|---|
| FR | 100% | 80% | 75% | 72% | 61% | 88% | 89% | 84% | 71% | 86% | 82% | 83% | 88% | 83% |
| AU | 80% | 100% | 56% | 89% | 52% | 93% | 68% | 94% | 49% | 86% | 90% | 76% | 91% | 90% |
| BR | 75% | 56% | 100% | 45% | 65% | 64% | 82% | 57% | 84% | 58% | 58% | 80% | 59% | 66% |
| CA | 72% | 89% | 45% | 100% | 37% | 89% | 60% | 93% | 38% | 83% | 86% | 70% | 90% | 92% |
| CN | 61% | 52% | 65% | 37% | 100% | 55% | 59% | 48% | 72% | 49% | 55% | 67% | 45% | 54% |
| DE | 88% | 93% | 64% | 89% | 55% | 100% | 77% | 95% | 58% | 90% | 90% | 82% | 95% | 91% |
| ES | 89% | 68% | 82% | 60% | 59% | 77% | 100% | 73% | 76% | 77% | 71% | 80% | 76% | 74% |
| GB | 84% | 94% | 57% | 93% | 48% | 95% | 73% | 100% | 49% | 92% | 89% | 77% | 96% | 93% |
| IN | 71% | 49% | 84% | 38% | 72% | 58% | 76% | 49% | 100% | 53% | 55% | 77% | 52% | 60% |
| IT | 86% | 86% | 58% | 83% | 49% | 90% | 77% | 92% | 53% | 100% | 85% | 74% | 90% | 85% |
| JP | 82% | 90% | 58% | 86% | 55% | 90% | 71% | 89% | 55% | 85% | 100% | 75% | 89% | 88% |
| MX | 83% | 76% | 80% | 70% | 67% | 82% | 80% | 77% | 77% | 74% | 75% | 100% | 76% | 83% |
| NL | 88% | 91% | 59% | 90% | 45% | 95% | 76% | 96% | 52% | 90% | 89% | 76% | 100% | 90% |
| US | 83% | 90% | 66% | 92% | 54% | 91% | 74% | 93% | 60% | 85% | 88% | 83% | 90% | 100% |
| FR | AU | BR | CA | CN | DE | ES | GB | IN | IT | JP | MX | NL | US | |
|---|---|---|---|---|---|---|---|---|---|---|---|---|---|---|
| FR | 100% | 48% | 51% | 38% | 39% | 60% | 66% | 51% | 47% | 56% | 51% | 54% | 61% | 52% |
| AU | 48% | 100% | 29% | 60% | 25% | 69% | 36% | 70% | 24% | 60% | 64% | 43% | 63% | 64% |
| BR | 51% | 29% | 100% | 19% | 49% | 36% | 60% | 26% | 65% | 29% | 30% | 56% | 32% | 40% |
| CA | 38% | 60% | 19% | 100% | 11% | 61% | 27% | 69% | 16% | 58% | 59% | 36% | 62% | 68% |
| CN | 39% | 25% | 49% | 11% | 100% | 28% | 37% | 19% | 55% | 22% | 27% | 50% | 20% | 27% |
| DE | 60% | 69% | 36% | 61% | 28% | 99% | 45% | 72% | 33% | 66% | 66% | 49% | 73% | 66% |
| ES | 66% | 36% | 60% | 27% | 37% | 45% | 100% | 38% | 52% | 46% | 38% | 50% | 46% | 42% |
| GB | 51% | 70% | 26% | 69% | 19% | 72% | 38% | 100% | 22% | 71% | 64% | 40% | 74% | 67% |
| IN | 47% | 24% | 65% | 16% | 55% | 33% | 52% | 22% | 100% | 26% | 30% | 57% | 28% | 36% |
| IT | 56% | 60% | 29% | 58% | 22% | 66% | 46% | 71% | 26% | 100% | 61% | 40% | 67% | 58% |
| JP | 51% | 64% | 30% | 59% | 27% | 66% | 38% | 64% | 30% | 61% | 100% | 42% | 62% | 61% |
| MX | 54% | 43% | 56% | 36% | 50% | 49% | 50% | 40% | 57% | 40% | 42% | 100% | 43% | 52% |
| NL | 61% | 63% | 32% | 62% | 20% | 73% | 46% | 74% | 28% | 67% | 62% | 43% | 100% | 65% |
| US | 52% | 64% | 40% | 68% | 27% | 66% | 42% | 67% | 36% | 58% | 61% | 52% | 65% | 100% |
| Lag | France | Australia | Brazil | Canada | China | Germany | Spain | |||||||
| ADF | p.Value | ADF | p.Value | ADF | p.Value | ADF | p.Value | ADF | p.Value | ADF | p.Value | ADF | p.Value | |
| 0 | −9.71 | 0.01 | −9.62 | 0.01 | −10.56 | 0.01 | −10.37 | 0.01 | −9.66 | 0.01 | −9.36 | 0.01 | −10.15 | 0.01 |
| 1 | −8.44 | 0.01 | −8.22 | 0.01 | −8.56 | 0.01 | −8.5 | 0.01 | −8.77 | 0.01 | −8.05 | 0.01 | −8.31 | 0.01 |
| 2 | −7.06 | 0.01 | −6.45 | 0.01 | −6.68 | 0.01 | −7.08 | 0.01 | −7.34 | 0.01 | −6.21 | 0.01 | −6.81 | 0.01 |
| 3 | −7.06 | 0.01 | −5.92 | 0.01 | −6.19 | 0.01 | −6.92 | 0.01 | −7.52 | 0.01 | −6.02 | 0.01 | −6.48 | 0.01 |
| 4 | −6.23 | 0.01 | −5.18 | 0.01 | −5.32 | 0.01 | −6.15 | 0.01 | −7.07 | 0.01 | −5.43 | 0.01 | −5.63 | 0.01 |
| 5 | −5.69 | 0.01 | −5.39 | 0.01 | −5.14 | 0.01 | −6.1 | 0.01 | −6.55 | 0.01 | −5.17 | 0.01 | −5.31 | 0.01 |
| 6 | −5.25 | 0.01 | −5.25 | 0.01 | −4.96 | 0.01 | −5.75 | 0.01 | −5.92 | 0.01 | −4.79 | 0.01 | −4.96 | 0.01 |
| Lag | UK | India | Italy | Japan | Mexico | Holland | USA | |||||||
| ADF | p.Value | ADF | p.Value | ADF | p.Value | ADF | p.Value | ADF | p.Value | ADF | p.Value | ADF | p.Value | |
| 0 | −9.46 | 0.01 | −10.84 | 0.01 | −9.68 | 0.01 | −10.14 | 0.01 | −10.05 | 0.01 | −9.98 | 0.01 | −10.27 | 0.01 |
| 1 | −8.07 | 0.01 | −7.86 | 0.01 | −8.16 | 0.01 | −8.57 | 0.01 | −7.83 | 0.01 | −8.5 | 0.01 | −8.75 | 0.01 |
| 2 | −6.75 | 0.01 | −6.78 | 0.01 | −6.76 | 0.01 | −6.96 | 0.01 | −6.16 | 0.01 | −6.8 | 0.01 | −7.1 | 0.01 |
| 3 | −6.84 | 0.01 | −6.13 | 0.01 | −6.84 | 0.01 | −6.55 | 0.01 | −5.53 | 0.01 | −6.59 | 0.01 | −6.73 | 0.01 |
| 4 | −5.92 | 0.01 | −5.38 | 0.01 | −5.89 | 0.01 | −6.03 | 0.01 | −4.64 | 0.01 | −5.91 | 0.01 | −6.11 | 0.01 |
| 5 | −5.79 | 0.01 | −4.98 | 0.01 | −5.84 | 0.01 | −5.65 | 0.01 | −4.56 | 0.01 | −5.66 | 0.01 | −5.92 | 0.01 |
| 6 | −5.41 | 0.01 | −4.45 | 0.01 | −5.24 | 0.01 | −5.18 | 0.01 | −4.08 | 0.01 | −5.39 | 0.01 | −5.59 | 0.01 |
| FR | AU | BR | CA | CN | DE | ES | GB | IN | IT | JP | MX | NL | US | |
|---|---|---|---|---|---|---|---|---|---|---|---|---|---|---|
| FR | 100% | 84% | 84% | 85% | 60% | 93% | 93% | 84% | 82% | 93% | 87% | 87% | 92% | 88% |
| AU | 84% | 100% | 80% | 94% | 59% | 85% | 81% | 92% | 72% | 85% | 91% | 82% | 93% | 92% |
| BR | 84% | 80% | 100% | 77% | 66% | 77% | 89% | 76% | 87% | 79% | 81% | 93% | 81% | 85% |
| CA | 85% | 94% | 77% | 100% | 55% | 88% | 79% | 95% | 68% | 87% | 91% | 79% | 94% | 95% |
| CN | 60% | 59% | 66% | 55% | 100% | 60% | 62% | 57% | 68% | 58% | 61% | 67% | 56% | 62% |
| DE | 93% | 85% | 77% | 88% | 60% | 100% | 85% | 87% | 72% | 88% | 87% | 79% | 92% | 88% |
| ES | 93% | 81% | 89% | 79% | 62% | 85% | 100% | 77% | 89% | 89% | 83% | 91% | 86% | 85% |
| GB | 84% | 92% | 76% | 95% | 57% | 87% | 77% | 100% | 65% | 88% | 89% | 77% | 92% | 93% |
| IN | 82% | 72% | 87% | 68% | 68% | 72% | 89% | 65% | 100% | 74% | 76% | 90% | 74% | 78% |
| IT | 93% | 85% | 79% | 87% | 58% | 88% | 89% | 88% | 74% | 100% | 87% | 81% | 91% | 87% |
| JP | 87% | 91% | 81% | 91% | 61% | 87% | 83% | 89% | 76% | 87% | 100% | 81% | 92% | 92% |
| MX | 87% | 82% | 93% | 79% | 67% | 79% | 91% | 77% | 90% | 81% | 81% | 100% | 83% | 87% |
| NL | 92% | 93% | 81% | 94% | 56% | 92% | 86% | 92% | 74% | 91% | 92% | 83% | 100% | 93% |
| US | 88% | 92% | 85% | 95% | 62% | 88% | 85% | 93% | 78% | 87% | 92% | 87% | 93% | 100% |
© 2020 by the author. Licensee MDPI, Basel, Switzerland. This article is an open access article distributed under the terms and conditions of the Creative Commons Attribution (CC BY) license (http://creativecommons.org/licenses/by/4.0/).
Share and Cite
Dal Moro, E. Towards an Economic Cyber Loss Index for Parametric Cover Based on IT Security Indicator: A Preliminary Analysis. Risks 2020, 8, 45. https://doi.org/10.3390/risks8020045
Dal Moro E. Towards an Economic Cyber Loss Index for Parametric Cover Based on IT Security Indicator: A Preliminary Analysis. Risks. 2020; 8(2):45. https://doi.org/10.3390/risks8020045
Chicago/Turabian StyleDal Moro, Eric. 2020. "Towards an Economic Cyber Loss Index for Parametric Cover Based on IT Security Indicator: A Preliminary Analysis" Risks 8, no. 2: 45. https://doi.org/10.3390/risks8020045