Article

COVID-19 Media Chatter and Macroeconomic Reflectors on Black Swan: A Spanish and Indian Stock Markets Comparison

by
Indranil Ghosh
1,
Esteban Alfaro-Cortés
2,*,
Matías Gámez
2 and
Noelia García-Rubio
3
1
IT & Analytics Area, Institute of Management Technology Hyderabad, Shamshabad, Hyderabad 501218, Telangana, India
2
Quantitative Methods and Socio-Economic Development Group, Institute for Regional Development (IDR), University of Castilla-La Mancha (UCLM), 02071 Albacete, Spain
3
Faculty of Economics and Business Administration, University of Castilla-La Mancha (UCLM), 02071 Albacete, Spain
*
Author to whom correspondence should be addressed.
Risks 2023, 11(5), 94; https://doi.org/10.3390/risks11050094
Submission received: 27 February 2023 / Revised: 7 May 2023 / Accepted: 11 May 2023 / Published: 16 May 2023

Abstract

:
Predictive analytics of financial markets in developed and emerging economies during the COVID-19 regime is undeniably challenging due to unavoidable uncertainty and the profound proliferation of negative news on different platforms. Tracking the media echo is crucial to explaining and anticipating the abrupt fluctuations in financial markets. The present research attempts to propound a robust framework capable of channeling macroeconomic reflectors and essential media chatter-linked variables to draw precise forecasts of future figures for Spanish and Indian stock markets. The predictive structure combines Isometric Mapping (ISOMAP), which is a non-linear feature transformation tool, and Gradient Boosting Regression (GBR), which is an ensemble machine learning technique to perform predictive modelling. The Explainable Artificial Intelligence (XAI) is used to interpret the black-box type predictive model to infer meaningful insights. The overall results duly justify the incorporation of local and global media chatter indices in explaining the dynamics of respective financial markets. The findings imply marginally better predictability of Indian stock markets than their Spanish counterparts. The current work strives to compare and contrast the reaction of developed and developing financial markets during the COVID-19 pandemic, which has been argued to share a close resemblance to the Black Swan event when applying a robust research framework. The insights linked to the dependence of stock markets on macroeconomic indicators can be leveraged for policy formulations for augmenting household finance.

1. Introduction

The mayhem of the COVID-19 pandemic in the form of extreme volatility and uncertainty induced anxiety in investors’ minds and chaotic behavior in financial markets across the world (Cepoi 2020; Kamaludin et al. 2021; Sharma et al. 2021; Yu et al. 2022; Zeng et al. 2022). The steep dependence of financial assets on media sentiment pertinent to the ongoing pandemic triggers efficiency in market microstructure (Dash et al. 2014; Ding and Qin 2020; Barky et al. 2022; Kubiczek and Tuszkiewicz 2022; Saetia and Yokrattanasak 2023). Despite the sizeable literature on demystifying the nexus and spillover dynamics of different financial variables (Ali et al. 2022b; Zhang and Mao 2022; Yu and Xiao 2022; Sinlapates et al. 2023), the scarcity of robust predictive architecture required to yield the future figures for stock markets in developed and emerging economies simultaneously is an emerging problem.
Assessing the reaction of stock markets toward volatile investor sentiment during turbulent time horizons is important for financial planning (Albaity et al. 2022). The literature made traction in evaluating the quantum of risk and contagion in different assets during the COVID-19 pandemic (Ali et al. 2022a; Bhatnagar et al. 2022). However, it is equally necessary to introspect the market efficiency at a deeper level through the lens of predictive analysis. Understanding the efficiency of different financial assets is also of paramount significance for traders in the normal regime (Noreen et al. 2022). The preliminary research hypothesis of the study is to check whether the developed and emerging financial markets are predictable during the COVID-19 pandemic. The present research aims to propound an integrated framework via combining key macroeconomic variables and appropriate proxies, incorporating the hype and tenacity of COVID-19-related news in media to predict stock markets explicitly during the new normal regime. We chose the Spanish and Indian financial markets for this predictive exercise to test the robustness of the modeling framework in developed and emerging economies and subsequently generate critical insights. To accomplish the objectives, were used separately to gauge the feature contribution.
The empirical analysis is focused on India and Spain. Spulbar et al. (2020) studies the volatility transmission patterns between emerging and developed stock markets, including, among other countries, India and Spain. Asawa et al. (2020) analyzed the public health policies and social media data (twitter) of several regions in Spain and India that were comparable in terms of the following variables: population density, unemployment rate, tourism, and quality of living. Here are some macroeconomic highlights about these countries.
India is the seventh largest country in the world in area (3,287,259 sq. kms.) and the second largest in terms of population (1,380,004,385). It belongs to the South Asia region and has a lower middle-income level. In recent years, its GDP (the 6th largest in the world) has presented high growth rates, although the rate corresponding to 2020 is −7.3%, with a GNI per capita of 6440 USD in 2020. The weight of the primary sector over GDP is 18.3%, while that of the industrial sector (including construction) is 23.5%. (World Bank 2022). As for its trade profile, India occupies the twenty-first position in exports and the fourteenth position in imports (16 and 10, respectively, if intra-EU trade is excluded). Its main trading partners are USA and the EU in the case of exports and China and the EU in the case of imports. In its export ranking, the first position is for petroleum oils and oils obtained from bituminous minerals, excluding crude (HS2710); medicaments in measured doses (HS3004); diamonds, whether or not worked, but not mounted or set (HS7102); rice (HS1006) and articles of jewelry and parts thereof (HS7113) (WTO 2022).
Spain occupies the fifty-first position in surface area (505,957.3 sq. kms.) and the thirtieth position in population (47,363,419). It belongs to the Europe and Central Asia region and has a high-income level. In 2020, its GDP (the fourteenth world) showed a growth rate of −10.8% (2.1% in 2019). Its GNI per capita was 37,980 USD in 2020. The weight of the primary sector over GDP is 3.1%, while that of the industrial sector (including construction) is 20.4%. (Source: World Bank). As for its trade profile, Spain occupies the nineteenth position in exports and the sixteenth position in imports. Its main trading partner is the EU; outside the bloc, the United Kingdom, the USA, China and Morocco are major trading partners. In its export ranking, the first position is for motor cars and other motor vehicles principally designed for the transport of persons (HS8703), followed by medicaments in measured doses (HS3004), petroleum oils and oils obtained from bituminous minerals, excluding crude (HS2710); parts and accessories of the motor vehicles of headings 8701 to 8705 (HS8708); and meat of swine, fresh, chilled or frozen (HS0203) (Source: WTO. Trade Profiles).
The contributions of the present research are manifold. Firstly, the present work systematically gauges the reactions and structure of efficiency in financial markets in developed and emerging economies throughout the pandemic simultaneously. The existing literature reports the impact of COVID-19 news on stock markets in developed and emerging nations separately (Jana et al. 2022; Ghosh et al. 2023). The present research fills the gap. Secondly, the systematic selection of specific COVID-19 news-related indicators was performed using RavenPack media indexes, which attributed the general anxiety in the pandemic to explain the dynamics of chosen stocks in conjunction with several macroeconomic factors, is unique. The predictive framework carefully incorporates market fear, the effects of digital currency, and energy commodities while explaining the degree of variability in developed and emerging markets. Thirdly, we aim to contribute on the methodological front via seamlessly aligning advanced machine learning and XAI methodologies to carry out predictive modeling and uncover the dependence structure. We comprehensively examine the behavioral dynamics of 10 Spanish and 10 Indian stocks in response to COVID-19 media chatter and macroeconomic indicators for a period spanning from 1 April 2020 to 17 March 2022. The considered time horizon covers the major waves of the pandemic in Spain and India. A sizeable amount of literature concentrates on a specific period of the COVID-19 pandemic (Yousfi et al. 2021; Kamal and Wohar 2023; Yu and Xiao 2022). The present study extends the in the same way through comprehensively inspecting the extent of predictability, efficiency, and dependence patterns. The endeavor also identifies the relative ranking of different features linked to COVID-19 media chatter and macroeconomic variables in predicting the selected stocks of both countries. The insights on relative feature influence in the recent Black Swan are of enormous significance for strategic interventions. The overall findings of the current work duly rationalize the contributions and underscore the implications.
The remainder of the article is segregated as follows. A thorough review of cognate past research used to rationalize the present work is elaborated in Section 2. The detailed descriptions of individual methodological components are then enunciated in Section 3. Subsequently, the definitions and the key statistical properties of the variables are presented in Section 4. Section 5 scrupulously outlines the findings and discusses the potential implications. Finally, the manuscript is concluded in Section 6, which highlights the major insights, scope, and future research agendas.

2. Past Research

There exists a sizeable literature on introspection of the empirical behavior of financial variables across developed and developing economies. The adversarial traits of the pandemic on the economic and financial fronts were investigated and acknowledged. The financial contagions of heterogeneous assets in the global financial crisis and ongoing pandemic were compared to ascertain the impact of negative news and sentiments (Hasan et al. 2021; Khalfaoui et al. 2023; Thangamuthu et al. 2022). Nevertheless, research comparing and contrasting the penetration of the COVID-19 media chatter and macroeconomic constructs in developed and developing financial markets scrupulously, specifically in the new normal time horizon, which is characterized by a high degree of distress, is hard to find. To set the current work’s positioning and underscore the contributions, we revisit the effects of social media on financial markets and predictability modeling of the same to comprehend the prevailing research trend.

2.1. Impact of Social Media, News, and Sentiment

Salisu and Vo (2020) observed that precise tracking of health news in conjunction with financial news essentially explained the variation in financial markets in both developed and developing economies. Chundakkadan and Nedumparambil (2021) discovered that inherent negative sentiment, specifically during the nascent stage of the pandemic, triggered a high quantum of volatility in stock markets across the globe. The findings of Ahmed (2022) lend support to the psychophysical numbing phenomenon in stock markets as markets were found to be highly sensitive to the Twitter-based economic uncertainty index. Dash and Maitra (2022) established that the increased pandemic uncertainty manifested through the google search pattern induced volatility and illiquidity in the market. Research by Li et al. (2022) demonstrated that the news-based uncertainty of COVID-19 exerted a negative influence on stock markets in bearish and normal states. The findings of Hsu and Tang (2022) vouched for continual policy realignment to eradicate the unexpected volatility in financial markets owing to fickle investor sentiment in the context of the pandemic. Zhang et al. (2022) demonstrated the propagation of COVID-19 news toward commodity and digital currency-based assets. Therefore, the inherent dependence of the financial markets on external media echoes on COVID-19-related issues across the globe is apparent.

2.2. Predictive Modeling of Stock Markets during COVID-19

The literature is replete with predictive analytics of stock markets of emerging and developed economies predominantly during the pre-COVID-19 regime (Araújo et al. 2018; Qiu et al. 2016; Ravi et al. 2017; Garcia-Vega et al. 2020; Ghosh et al. 2019; Makatjane and Moroke 2021; Polamuri et al. 2021; Chen et al. 2022). The majority of these works primarily rely upon orthodox macroeconomic and technical indicators for explaining the variability. Despite the need for scalable and accurate forecasting systems to decode stock market dynamics in Black Swan events, only a handful of works linked to the pandemic regime were previously carried out. Ahmar and Val (2020) designed an econometric-driven framework for short-term forecasting in Spanish financial markets. Kamdem et al. (2020) successfully predicted commodity prices using the number of COVID cases using a long short-term memory network (LSTM) as explanatory features at the initial stage of the pandemic. Ronaghi et al. (2022) propounded a deep learning-based framework imbibing social media trends to predict stock market movements. On the other hand, Ghosh et al. (2022) resorted to conventional macroeconomic-driven features to successfully demystify the evolutionary patterns in Indian futures market using hybrid machine and deep learning-based models. The utility of macroeconomic attention-based indicators in predicting stock market return was acknowledged by Ma et al. (2022). A large proportion of the literature reports the usage of machine learning methodologies to establish the dependence of market movements on cognate aspects of COVID-19 in place of explicit predictive modeling exercises (Asl et al. 2022; Dey et al. 2022; Lúcio and Caiado 2022; Huang et al. 2022). The review suggests that the macroeconomic and media chatter were primarily used in an isolated manner for forecasting future figures for the respective stock markets. Thus, combining them in an integrated framework to gauge the predictability of Spanish and Indian stock markets separately during the COVID-19 regime would substantially contribute to the existing literature.
The review of the cognate literature implies that social media, news, and sentiment impact financial markets worldwide, specifically during the pandemic. Proper channelization of circulating information pertinent to COVID-19 is critical to gauge the magnitude and direction of the influence, which justifies the endeavor of the current work to choose RavenPack media indexes. On the other hand, the predictive modeling of stock markets during the pandemic saw the usage of context-specific macroeconomic indicators. The present research leverages the know-how effectively through applying appropriate media manifests and macroeconomic indicators to model developed and developing financial markets on the expanded time horizon, characterizing the new normal regime. It is important to consider macroeconomic explanatory variables to holistically explain the long-term variability in the financial markets. Thus, the endeavor to include dedicated media indexes and macroeconomic variables account for the short- and long-term counterparts of the overall variation in developed and developing financial markets in an integrated research framework rationalizes the contribution of the underlying research. Though the prominence of machine learning algorithms in predicting future figures is apparent, as reported in the second strand of the literature, these methodologies offer hardly any insights on the dependence structure owing to complex and black box operational procedures, unlike the first strand of literature. It is equally vital to delve into the nexus in addition to performing predictive analytics. Hence, applying XAI methodologies to decode the predictive structure is rationalized and serves critical inferences. The dedicated approach to expound on the market dynamics of leading developed and emerging economies would reflect the comparative assessment of media echo penetration and macroeconomic variables’ influence.

3. Methodology

3.1. Isometric Mapping (ISOMAP)

Developed by Tenenbaum et al. (2000), Isometric Mapping facilitated non-linear feature transformation procedure for a high-dimensional dataset. The projection to low and compact dimensions was achieved through the estimation of the geodesic manifold distances in a pairwise manner (Gao et al. 2022). The given input space distance provided a close approximation of geodesic distance for neighboring data samples. It was necessary to discover the shortest link connecting the distant data points to formulate the geodesic distance. In this work, ISOMAP was used to generate a compact representational form of raw features. The optimized feature representation was thereafter used to train the GBR framework. The fundamental operational steps of the ISOMAP model are outlined below.
Step 1: Creating the Neighborhood Graph (G): The process accomplished via forming the linkage between two points, i and j, as manifested through the distance d x i , j , if the said pair of points are nearer than ϵ ( ϵ -ISOMAP), or i is the member of K nearest neighbors of j. The edge length is kept as d x i , j .
Step 2: Estimating the Shortest Path: Set d G i , j = d x i , j , if i and j are interconnected, else set d G i , j = . Next, for all possible enumerations of k  k = 1,2 , , N , alter the entries of d G i , j by a minimum of d G i , j , d G i , k + d G k , j . The final matrix D G = d G i , j contains the shortest linkage between all pairs of points.
Step 3: Creating the d-Dimensional Embedding: If λ m represents the mth eigenvalue of the matrix τ D G and v m i accounts for the ith component of the mth eigenvector, the mth component of d-dimensional coordinate vector y i is λ m v m i .
The matrix τ D G is estimated as:
τ D G = 1 2 H D G 2 H
where H represents the centering matrix H = I n 1 N e N e N T , with e N = 1 , , 1 T R N .
The count of neighbors is set as 5 in ISOMAP for incorporating the local information.

3.2. Gradient Boosting Regression (GBR)

Developed by Schapire and Singer (1999), it extends the well-known Boosting algorithm, which is an ensemble machine learning procedure to resolve complex regression problems. In GBR, a series of classical trees was used in a forward-stage-wise direction in a sequential ensemble manner to yield the outcome (Zheng 2011; Elliott et al. 2020). The training samples were weighted via computing the gradient-driven error rate, controlling the selection probability of samples to constitute training sets for the respective base learners. The procedural steps of the GBR algorithm are mentioned below.
Step-1: For N training samples ( x 1 , y 1 , x 2 , y 2 , …………,  x N , y N ) in set P, the weights of each sample are initialed to 1/q (q: is the cardinality of set P).
Step-2: For constituent base learner (i), conduct the below steps
Step-2.1: Bootstrapped samples are collated to prepare a training set, Pi.
Step-2.2: Utilize the training set Pi for training model Dt.
Step-2.3: Compute the error of the model.
Step-2.4: If the calculated error is greater 0.5, repeat steps 2.1 to 2.3; otherwise, perform step 2.5.
Step-2.5: Update the weights of the samples in set Pi.
Step-2.6: Normalize the weight values.
Step-3: Measure the precision of the base learners.
Step-4: Aggregate the outcome of the base learners to produce the final prediction.
The entire predictive framework was implemented applying the ‘sklearn’ library of Python, wherein the process parameters of GBR were tuned leveraging the ‘GridSearchCV’ function. The number of base learners, maximum features for branching, learning rate, and maximum depth in GBR were auto-tuned through applying the said utility.

3.3. Performance Indicators

The present work deploys four performance metrics, namely Nash–Sutcliffe Efficiency ( N S E ), Theil Index ( T I ), Index of Agreement ( I A ), and Directional Predictive Accuracy ( D A ). Mathematically, they are determined as:
N S E = 1 t = 1 N Y ^ t Y t 2 t = 1 N Y t Y 2
T I = 1 N t = 1 N Y ^ t Y t 2 1 / 2 1 N t = 1 N Y ^ t 2 1 / 2 + 1 N t = 1 N Y t 2 1 / 2
I A = 1 t = 1 N ( Y ^ t Y t ) 2 t = 1 N | Y ^ t Y | + | Y t Y | 2
D A = 1 N t = 1 N D t , D t = 1 , ( Y t + 1 Y t ) Y ^ t + 1 Y t 0 0 , O t h e r w i s e
where Y t and Y ^ t represent actual and predicted figures, respectively, and Y denotes the average of actual values. Highly accurate absolute figures and trend predictions are signified if the NSE, IA, and DA values are close to 1 and TI values are substantially low.

3.4. Explainable Artificial Intelligence (XAI)

Using the XAI frameworks, we aimed to interpret and decode the black box type predictive model to gauge the nature of the influence of underlying media chatter and macroeconomic explanatory variables, which were reported to be highly effective in demystifying complex black box type models (Çelik et al. 2023; Ghosh et al. 2022; Ghosh and Datta Chaudhuri 2022; Melis et al. 2021; Lange et al. 2022). We used two explainable AI components—Shapley additive explanation (SHAP) (Lundberg and Lee 2017) and Local Interpretable Model–Agnostic Explanations (LIME) (Ribeiro et al. 2016)—using the ‘Shapash’ library of Python for analyzing global and local level influence. The SHAP-based approach followed a game theoretic approach to evaluate the contributions of respective explanatory features in predicting the target variable at the global level. LIME created a new dataset on top of a learned model through perturbing the input variables’ figures and drawing the target variable’s predictions. It then strived to map the relationship between the target and input variables on the new dataset using improved interpretable machine learning models.

4. Data Description

Daily closing prices of 10 Spanish stocks, namely ARCELORMITTAL, EBRO FOODS (EBRO), GESTAMP AUTOMOCION (GESTAMP), IAG, INDRA, REPSOL, ROVI, SIEMENS GAMESA (SIEMENS), and TELEFONICA, from 1 April 2020 to 17 March 2022, were compiled for predictive modeling to introspect predictability during the COVID-19 pandemic. Daily closing prices of 10 Indian stocks, namely APOLLO, BAJAJ AUTO (BAJAJ), EXIDE, HAVELL, INFOSYS, INTERGLOBE, Indian Oil Corporation (IOCL), ITC Limited (ITC), Sun Pharmaceutical Industries Limited (SUN), and TATASTEEL, were collated to assess the degree of predictability. The selection of stocks was made through matching the sector. For example, IAG and INTERGLOBE represent the aviation sector. Hence, accurate predictions during the chosen regime would rationalize the efficiency of predictive structure and utility of selected explanatory variables. The selection of stocks from different sectors to draw inferences on stock market predictability was inspired by the work of Ghosh and Datta Chaudhuri (2021) and Ghosh et al. (2021), wherein stocks from a variety of industrial sectors were analyzed at a granular level. We expanded the sectoral choices to account for the disruption effects of the pandemic in supply chains and other business operations. The chosen stocks represent the healthcare, automobile, manufacturing, energy, pharmaceutical, information technology, and aviation sectors. The spectrum of the industrial sectors strives to capture the disruption effects of the pandemic.
Healthcare and pharmaceutical sectors augmented the capacity, whereas the information technology sector leveraged innovation and the aviation sector suffered heavily owing to restrictions on travel. On the other hand, the automobile, manufacturing, and energy sectors had to readjust supply chains to ensure resilience in the production process amidst turbulent external factors. Careful introspection of the impact of COVID-19 media chatter and macroeconomic reflectors on the said sectors is essential to draw the research inferences. The selected stocks are true representatives of the sectors for both countries in terms of market capitalization. Table 1 outlines the important statistical properties of chosen variables.
The Frosini and ADF test statistics were used to test whether time series abide by the normal distribution and stationary property, respectively. On the other hand, Terasvirta’s NN test was used to gauge the presence of non-linear components in time series. These tests were successfully used for analyzing empirical properties of financial variables (Albulescu et al. 2021; Jana and Ghosh 2022; Ghosh et al. 2023; Inglada-Perez 2020). It was observed that the underlying Spanish and Indian stocks exhibited signs of non-parametric and non-stationary traits, as indicated via the Frosini and ADF test statistics. The clear presence of strong non-linearity in the temporal evolutionary pattern of the 20 stocks is evident from the significant Terasvirta’s NN test statistic. Significantly higher Hurst exponents, close to one, ruled out the efficient market hypothesis and the presence of long memory dependence in the chosen financial markets. The Indian stocks, on the other hand, emerged as higher priced and more volatile, as manifested through higher mean and standard deviation.
RavenPack (2023) repository preserves and updates a series of media indexes to gauge the quantum of media hype, panic, fake news, sentiment, etc., associated with the COVID-19 event across the geography. The current research considers six indices, as defined below. The values of these indices confine between 0 to 100, barring the sentiment-related index.
Firstly, the Panic Index measures the extent of panic or hysteria chatter regarding COVID-19. Higher index values sign the presence of profound panic in the media. Additionally, a Media Hype Index was also used to reflect the quantum of the proliferation of COVID-19 in news chatter. Secondly, to induct the impact of fake news and relatable entities conjugated with COVID-19, two more indices, namely Fake News Index and Infodemic Index, are used. Finally, to account for the overall media coverage and the sentiment polarity linked to floating news in media, Media Coverage Index and Sentiment Index are used. Sentiment Index, estimated based on the in-built sentiment scoring engine of RavenPack, ranges from −100 to 100, where most negative, most positive, and neutral sentiments are linked to −100, 100, and 0, respectively.
RavenPack hosts daily figures from these six indices across different countries and worldwide. We collated the above six indices for worldwide (WW), Spanish (SP), and Indian (IN) levels to form respective explanatory features on media chatter. Figure 1, Figure 2 and Figure 3 display the boxplots of these six media indicators across the regions.
The present work also considers several key macroeconomic variables to capture the volatile pattern of financial markets in emerging and developed economies during the phase of extreme distress. Daily closing prices for WTI Crude Oil (OIL), Bitcoin (BITCOIN), and Gold (GOLD) were chosen as proxies to represent the global macroeconomic state. Additionally, daily financial stress, monitored by the Office of Financial Research (OFR) (https://www.financialresearch.gov/financial-stress-index/ (accessed on 3 May 2022)) for the Eurozone, belonging to the other advanced economy (OAE) and emerging market (EM) categories was chosen to incorporate the effect of financial uncertainty in explaining stock market movements in Spain and India. To induct the in-house state of financial markets, some country-specific variables were triggered in building the predictive structure. IBEX35 and NIFTY indices were used to account for the financial market sentiments in Spain and India, respectively. Implied volatility, i.e., the market fears, for both countries were included using respective implied volatility indices, namely VIBEX and India VIX (IVIX). These features were previously reported to share interplay with equity markets (Das et al. 2019; Benlagha and El Omari 2022; Drake 2022; Nguyen 2022). Figure 4, Figure 5 and Figure 6 exhibit the violin plots of common and country-specific macroeconomic reflectors, which entail additional insights on distribution patterns for the variables. The presence of bimodal distributions in the macroeconomic reflectors can be detected.

5. Results & Discussion

5.1. Predictive Outcome

The entire dataset of underlying stocks were segmented to form the training (85%) and test (15%) sections in order to carry out the predictive analytics task. Table 2 summarize the outcome of the predictive exercise.
It was observed that the predictive performance in the training segment emerged to be highly successful for the Spanish stocks, as manifested through the four performance indicators, namely NSE, TI, IA, and DA. The NSE, IA, and DA figures appeared to be substantially high, while TI values emerged as profoundly low. Supreme predictive accuracy can be inferred to be achieved on REPSOL, GRIFOLS, ROVI, and GESTAMP. Directional accuracy of forecasts is also extremely satisfying, indicating possibility of intraday trading. The performance experienced a dip in the test segment, which was expected. Predictive accuracy suffered heavily in IAG. The quality of forecasts for SIEMENS, TELEFONICA and, INDRA was neither stubbornly great nor poor. Nevertheless, considering the timeline of the investigation, which was characterized as a Black Swan event, values of the performance indicators imply a satisfactory predictive outcome barring IAG. Predictive accuracy emerged to be highly praiseworthy in the training segment for chosen Indian stocks. Results also justify the efficiency of the predictive model in estimating accurate directional changes. Amongst the stocks, APOLLO, TATASTEEL, INFOSYS, HAVELL, and INTERGLOBE appeared to be relatively more predictable. Similar to its Spanish counterpart, the performance on the test segment degraded to some extent, as expected. On a comparative note, APOLLO, HAVELLS, and INFOSYS appeared to be strongly predictable, while the predictive accuracy of EXIDE degraded substantially on test samples. However, close observation of the performance indicators suggests that the Indian stocks are marginally more predictable than Spanish stocks as far as the test segment is concerned. Figure 7 and Figure 8 exhibit the actual and predicted figures of two Spanish and Indian stocks.
The visualization of actual and predicted figures on test segments strongly conforms to the inferences drawn based on the quantitative performance measures. Hence, inference can be drawn that the inclusion of in-house and worldwide media chatter indicators for respective countries in conjunction with the chosen macroeconomic constructs emerged to be highly effective in training the hybrid ISOMAP-GBR framework to fetch precise forecasts. It should also be noted that the dip in prediction accuracy in the test segment for a few stocks largely reflects the presence of short-run random fluctuations, indicating the steep uncertainty of the pandemic regime. To establish the statistical superiority of the proposed framework, a comparative evaluation was performed that incorporated several well-known univariate forecasting methodologies wherein the select macroeconomic and media chatter indicators are not used explicitly. Four benchmark models, namely the Auto Regressive Integrated Moving Average (ARIMA), Seasonal ARIMA (SARIMA), Box–Cox transformation, Auto Regressive Moving Average Errors, Trend and Seasonal components (BATS), and Trigonometric seasonality BATS (TBATS), were used to draw predictions in a forward-looking manner to facilitate the comparison. The hyperparameters of the competing models, i.e., autoregressive and moving average counterparts, the extent of seasonality, etc., are auto-tuned through applying grid search methodology on the basis of the Akaike Information Criterion (AIC). The model confidence set (MCS)-based superior predictability assessment was utilized to explore the relative performance of forecasting models on the test data segment. The MCS framework is capable of discriminating between the superior and inferior models through invoking appropriate loss functions. Table 3 narrates the findings, wherein the numbers stacked in the parenthesis reflect the relative ranking of the proposed and competing models.
The relative ranking duly establishes the statistical supremacy of the integrated ISOMAP-GBR predictive framework in accurately estimating the future figures of both Spanish and Indian stock markets. Thus, the inclusion of macroeconomic and media chatter indicators plays a pivotal role in recognizing the inherent complex patterns of the respective markets during the new normal regime.

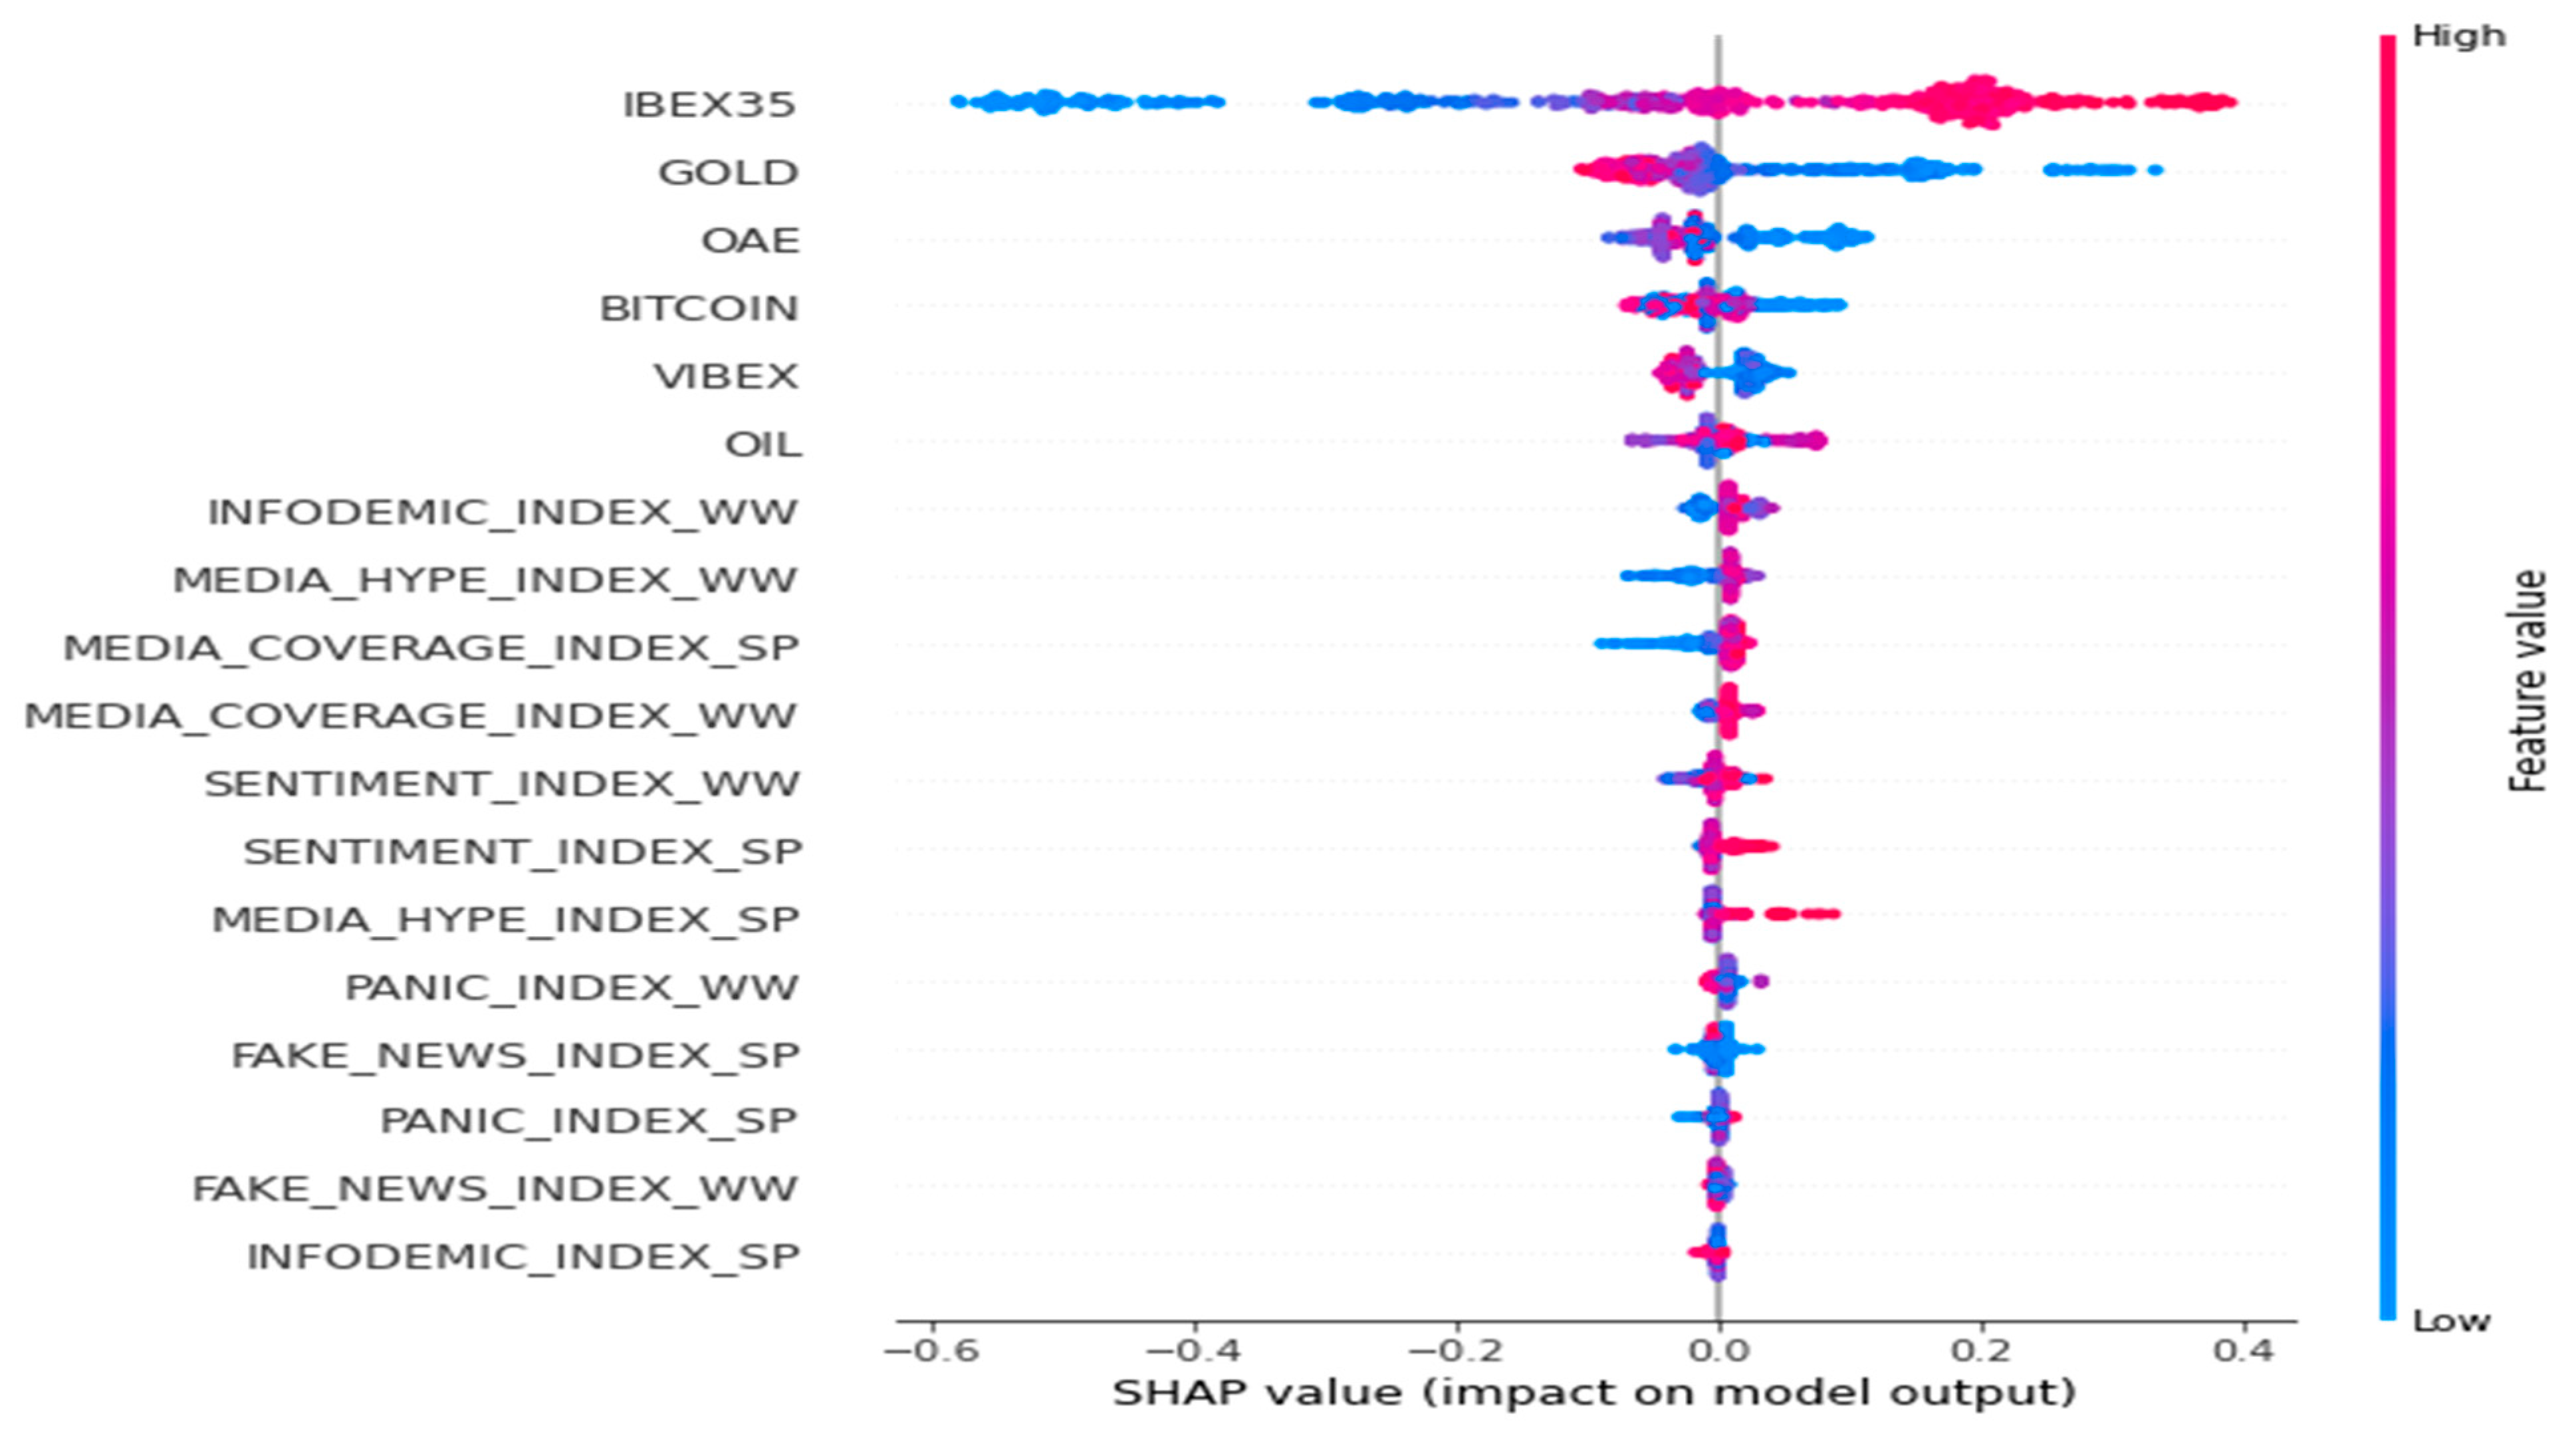
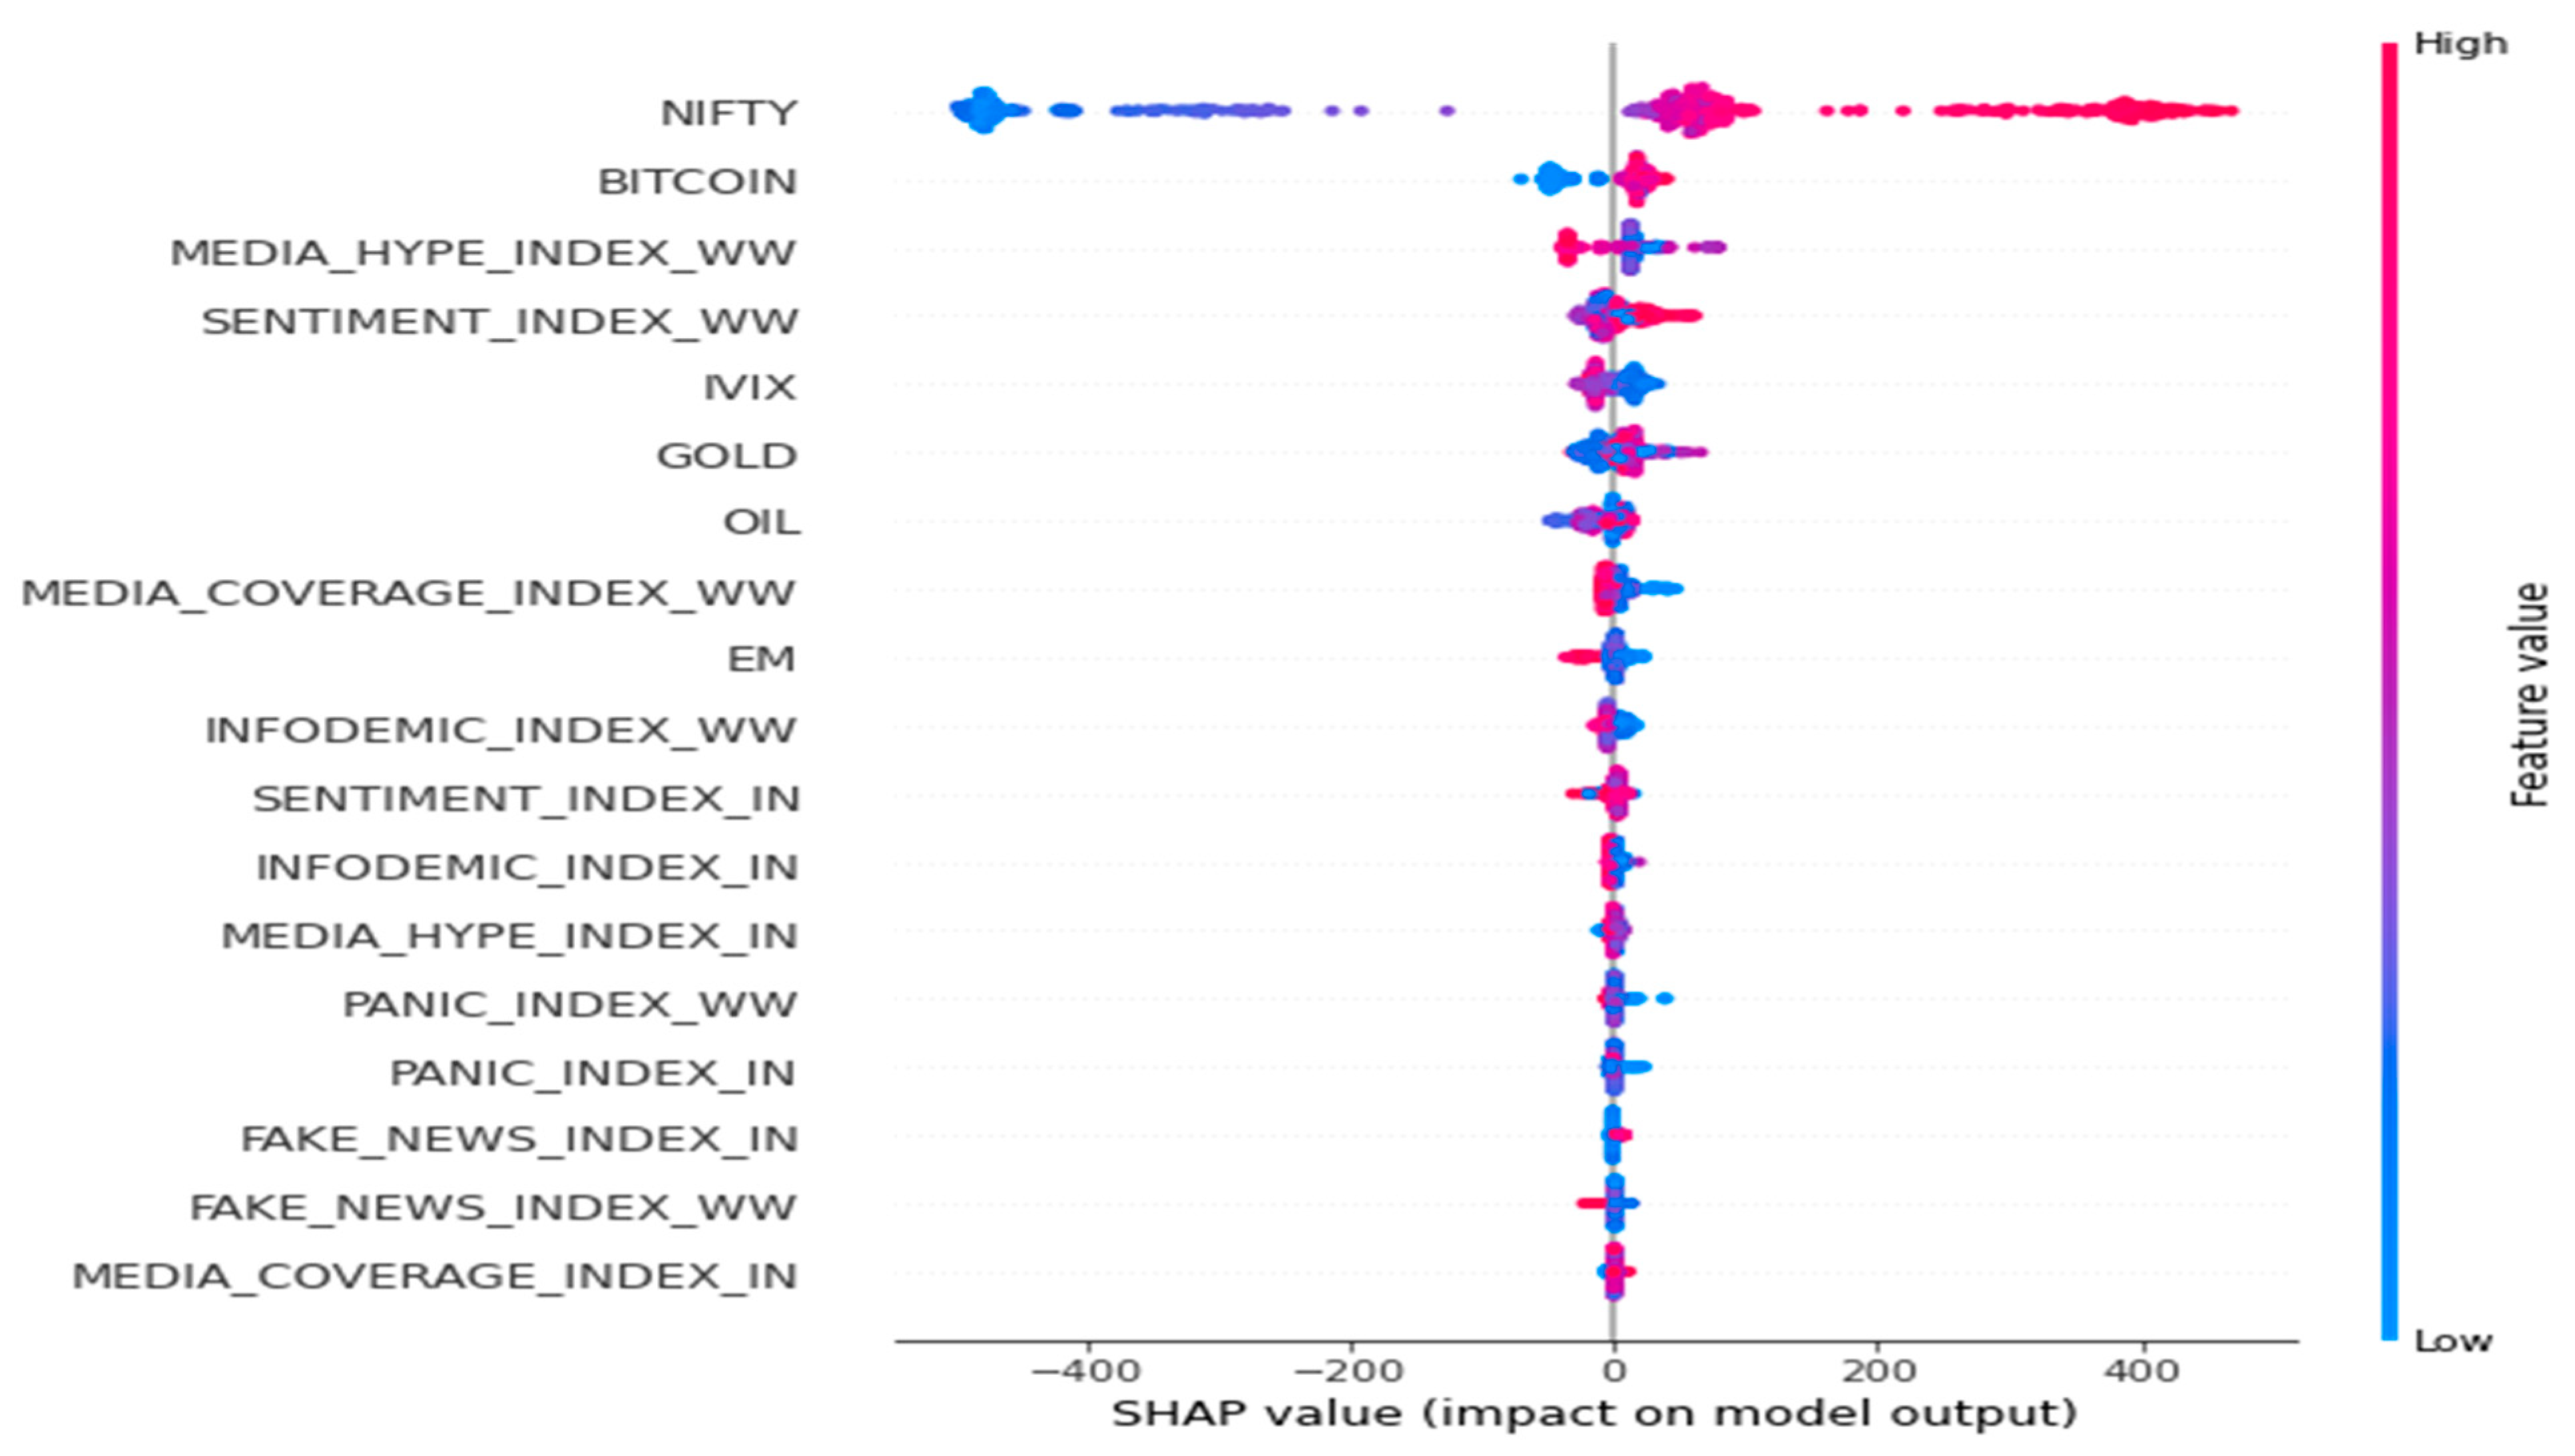
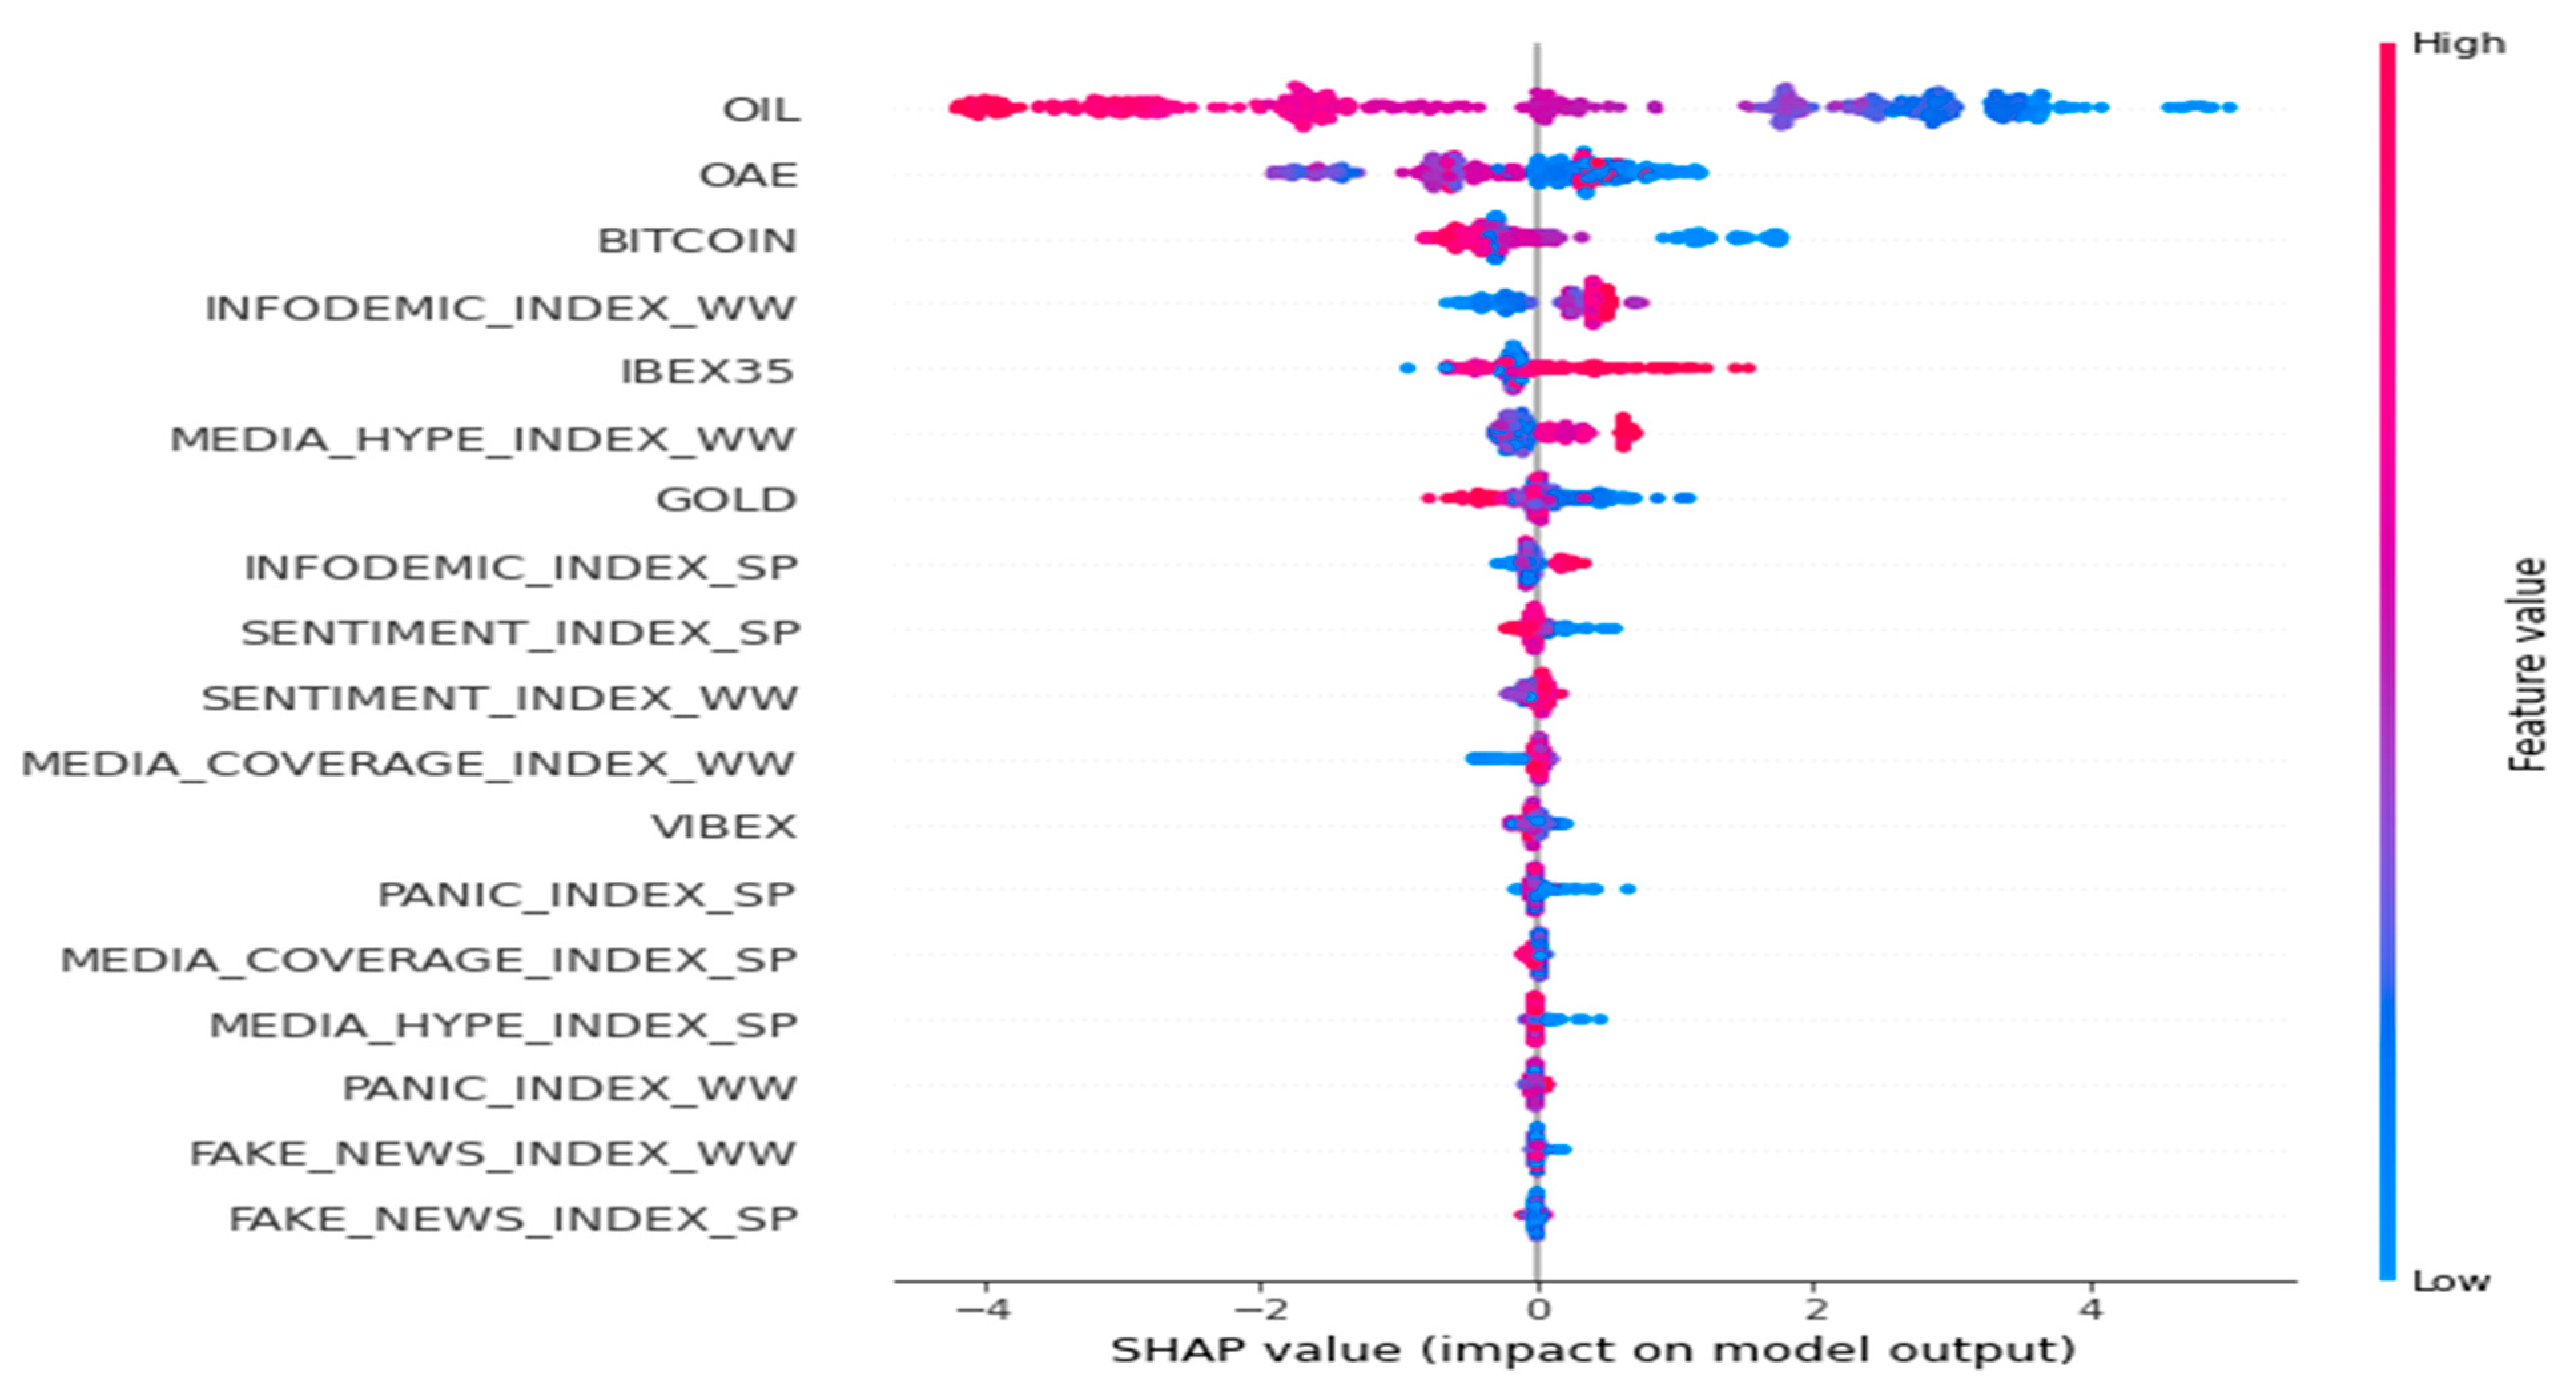
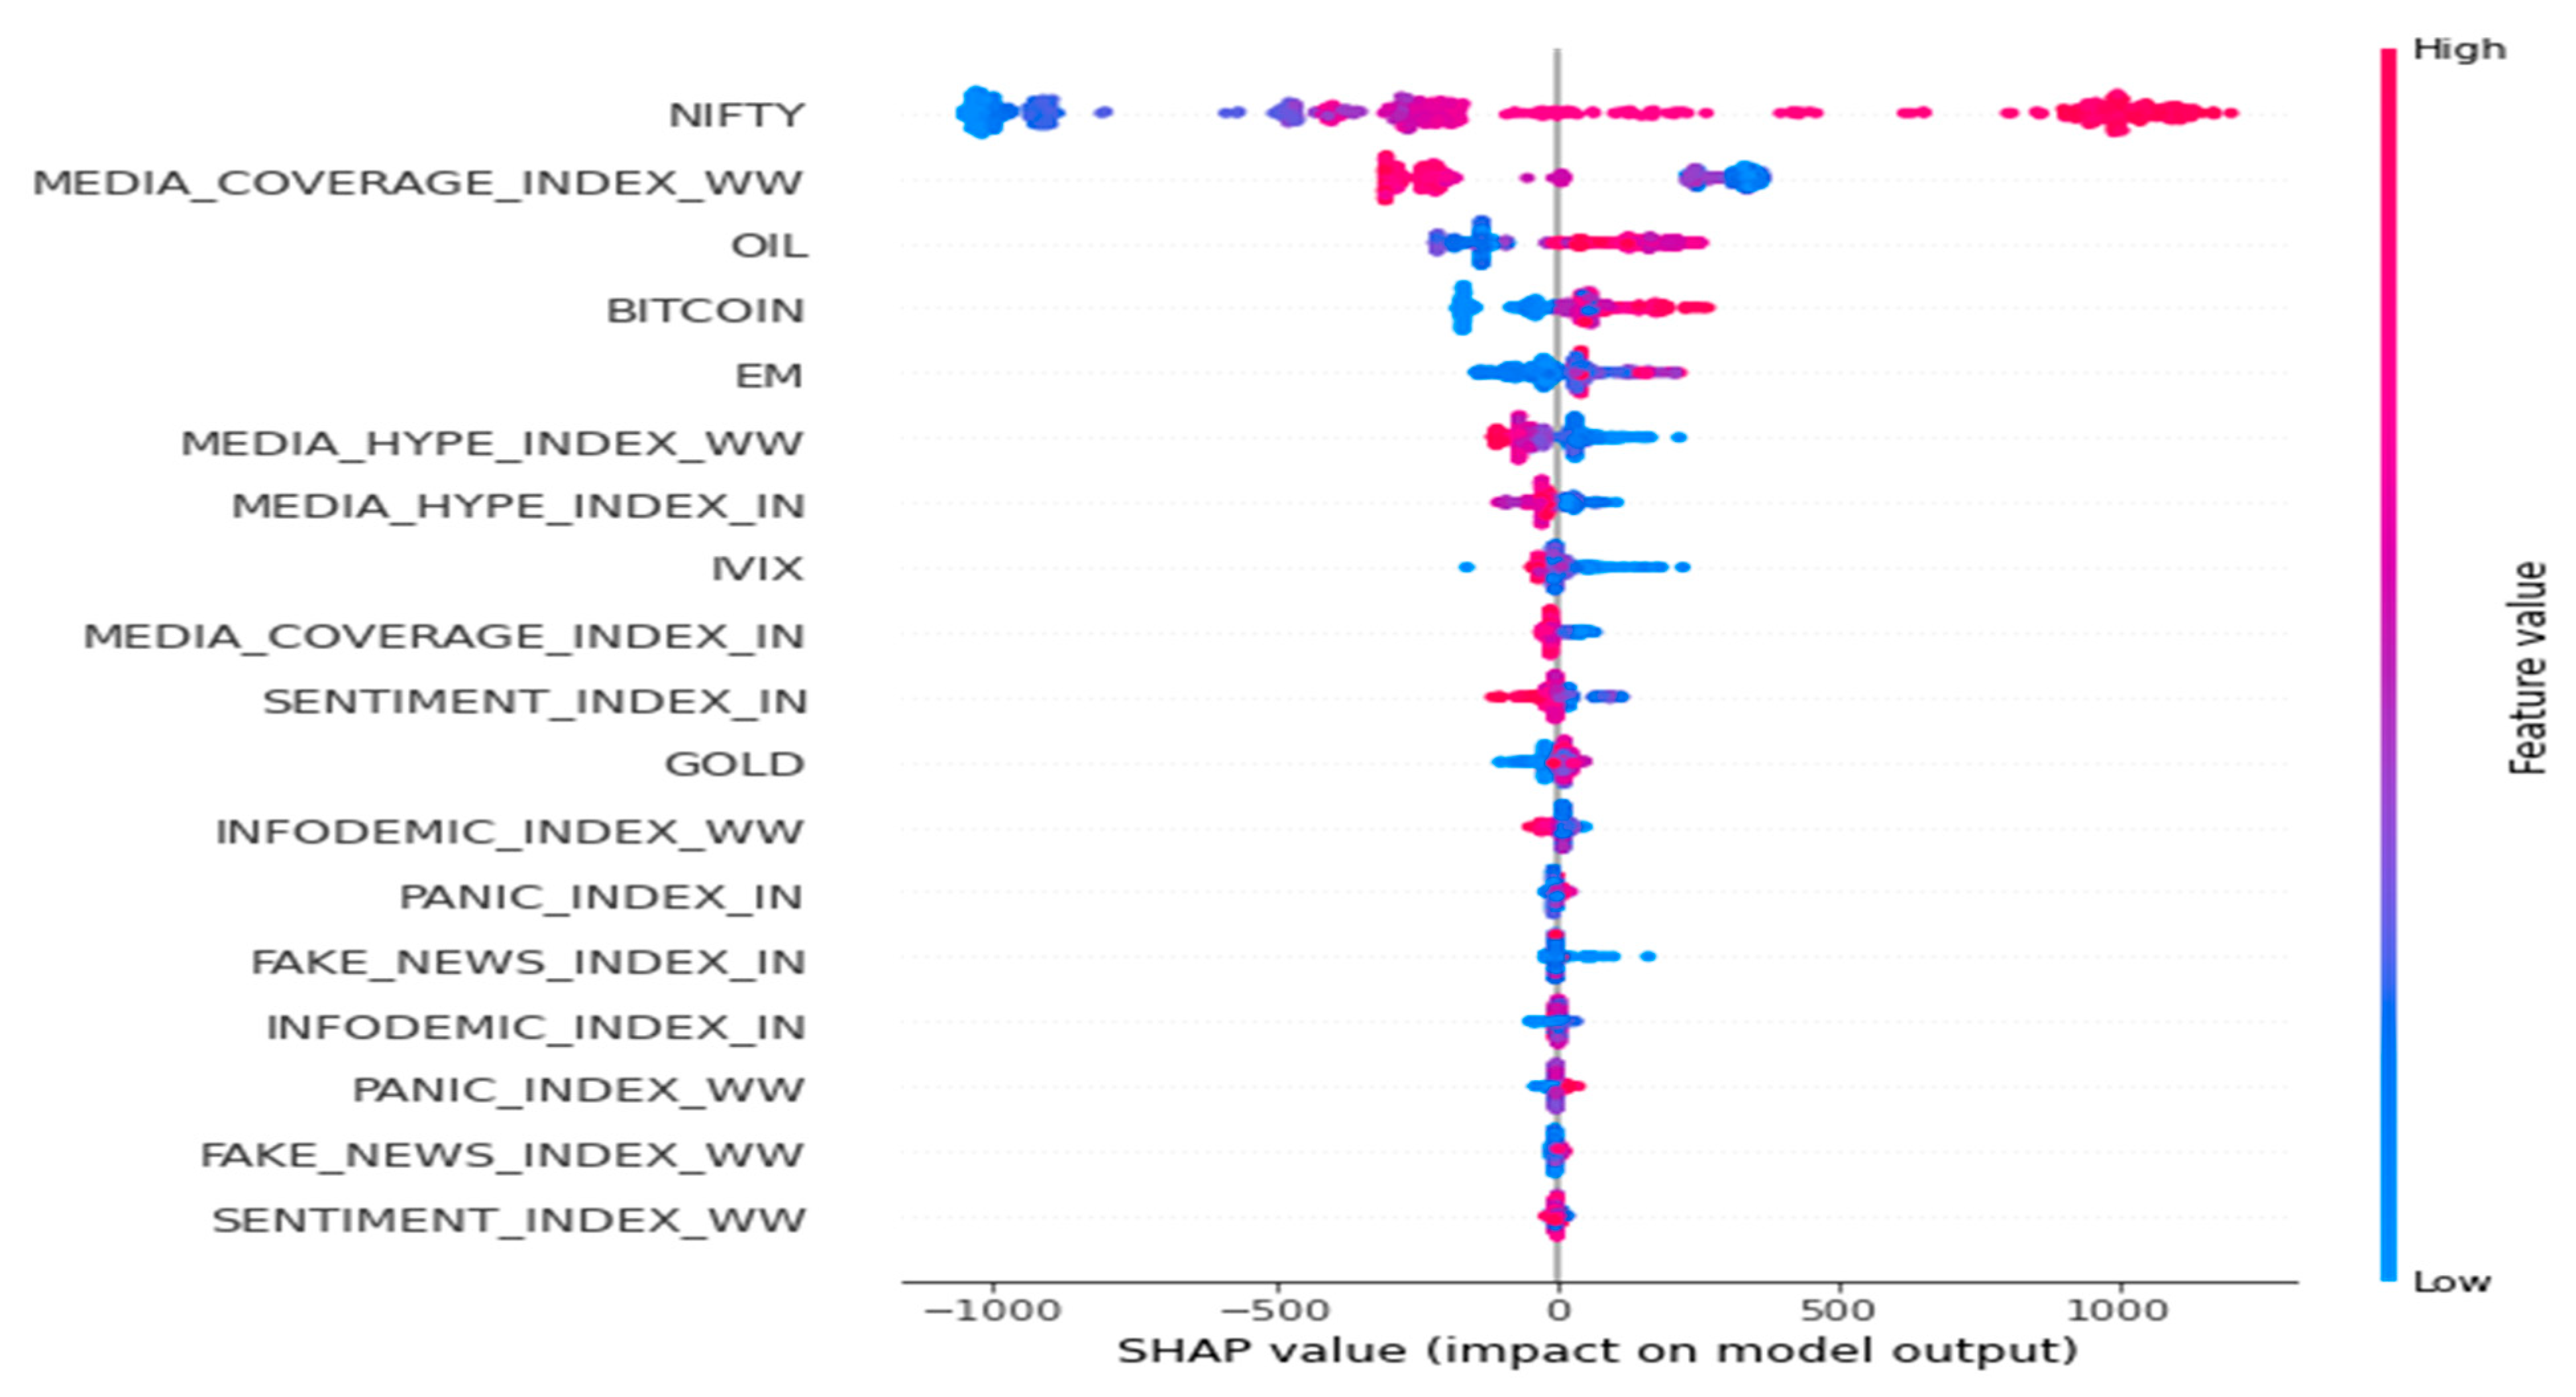
5.2. Model Interpretation

The SHAP metric is used to determine the relative influence of the considered features globally. Figure 9, Figure 10, Figure 11 and Figure 12 betray feature contributions in explaining the movements of the Spanish and Indian stocks belonging to the aviation and healthcare sectors, which were affected negatively and positively, respectively, during the pandemic.
It can be observed that the Spanish aviation stock exhibited a strong dependence on in-house market sentiment and volatility, commodities, digital currencies, and external market stress. On the other hand, the comparatively more profound contribution of the media chatter indicators in explaining the Indian counterpart is evident. Of course, the market sentiment and volatility also exerted explanatory power. Thus, the speculative nature of the Indian stock is better explained using the media chatter indices, which resulted in better predictions than those created for the Spanish stock.
Feature contribution structures suggest that the healthcare care stocks of both countries displayed dependence on in-house market sentiment, commodities, and financial stress in their respective economies. The similarity in sensitiveness to worldwide media chatter is also apparent. We then examine the influence of the features at the local level, i.e., contribution to the prediction process for a randomly chosen data sample of the aviation and healthcare stocks using the LIME procedure (Figure 13, Figure 14, Figure 15 and Figure 16).
The outcome of feature contribution at the local level indicates that global and local feature rankings are not identical. A media chatter indicator found a spot in the top five influential features at the local level, unlike the global feature list. Thus, to precisely forecast the closing prices of the underlying stocks, it is of utmost importance to track all features critically, irrespective of the top influential features. Media chatter indices must be monitored globally and locally to facilitate accurate daily trading. Maintaining a close watch on macroeconomic features is useful for strategic-level interventions.
The remaining stocks of both countries echo similar behavioral traits emphasizing the importance of both macroeconomic determinants and media chatter indices for accurate predictions. The detailed results are available on request to the authors. We summarized the top 10 feature lists for the remaining stocks in Table 4 and Table 5, wherein the rankings are stacked inside parentheses.
The feature influence ranking at the global and local level clearly suggests the utility of tracking the chosen media chatters to make precise predictions of select Spanish stocks. Unlike the aviation and healthcare sectors, the remaining sectors exhibit a marginally stronger dependence on media echo at the local level.
Akin to Spanish stock markets, Indian counterparts also demonstrate sensitiveness to media echo both globally and locally. Interestingly, a clear dominance of local media chatter indicators at the local level can be noticed. Thus, short-run fluctuations in the Indian context can largely be attributed to the media buzz regarding in-house pertinent aspects of the COVID-19 pandemic.
The overall findings duly rationalize the endeavor of designing the predictive framework that comprises the chosen indicator reflecting the COVID-19 media echo and macroeconomic state. The LIME analyses regarding Spanish and Indian financial markets justify tracking all features to precisely estimate future figures, which is of utmost importance for traders. On the other hand, the research places equal emphasis on identifying the top contributing features through the lens of SHAP-based modeling. Taming inadvertent situations in stock markets can be facilitated through strategic interventions that control the critical features via stoking different initiatives. Summarizing the important features enlisted in Table 4 and Table 5 can immensely assist traders in accomplishing the task.

6. Conclusions

The present research strives to ascertain the predictability of financial markets in highly developed and emerging economies during the time horizon that resembled a Black Swan event. The ISOMAP-GBR and XAI frameworks appeared to be highly successful in facilitating trading and revealed meaningful insights. The rigorous numerical and statistical checks rationalized the adopted methodological framework of the research and significantly contributed to the existing strand of the literature. Except for two stocks, predictive performance appeared to be more than satisfactory considering the investigation timeline. The proposed multivariate framework was shown to yield statistically superior forecasts than several benchmark univariate models. Practitioners and investors can leverage the proposed framework for practical applications. Indian stocks appeared to be relatively more predictable than Spanish stocks, suggesting higher inefficiency in the former than the latter market. Global and local macroeconomic indicators exert strong predictive influence, while the considered media chatter should also be closely tracked to decode the temporal evolutionary pattern of the underlying assets. The local level random fluctuations can be explained through precise tracking of the appropriate media chatter. The local counterparts of the media buzz exhibited marginally steeper influence in the Indian stock market. Nevertheless, the findings did not undermine the impact of macroeconomic reflectors by any means, indicating that the overall inefficiency of the financial markets was not entirely violated during the prevailing pandemic. The prominence of the media chatter pertinent to the COVID-19 pandemic emerged as the major contribution of the present research. Therefore, short-term investment in equity markets should be carried out in accordance with prevailing media hype and sentiment. The scope of the current work is limited to the financial markets of two countries. In the future, it would be challenging and practically relevant to gauge the penetration of media chatter in commodity markets and niche digital assets.
The overall results of the present work exhibit resemblance to the literature espousing the impact of COVID-19 news on stock markets (Cepoi 2020; Li et al. 2022; Bai et al. 2023). The findings linked to the developed economy, i.e., the Spanish market, in the present research conforms to the insights of the work of Thorbecke (2022), wherein the penetration of COVID-19 news in the French financial market was documented. On the other hand, the India-centric results are similar to the work of Ghosh et al. (2023). Nevertheless, the current research contributes to the existing literature through establishing a robust framework to critically analyze the pattern and dependence structure of Spanish and Indian financial markets throughout the most uncertain moments of the recent Black Swan event. The insights can be effectively leveraged for practical applications. The scope of the current study is restricted to the new normal time horizon and chosen stocks to systematically address the existing research gaps. Nonetheless, it is also important to comprehend the influence of the explanatory variables on commodity and futures markets. Those assets were proven to be closely interlinked with key financial variables in developing economies (Ghosh et al. 2021; Zhou et al. 2022). The outcome of the present research underscores the importance of further exploring this topic in later studies.

Author Contributions

Conceptualization, I.G.; Methodology, I.G.; Software, I.G. and M.G.; Validation, N.G.-R.; Formal analysis, N.G.-R.; Investigation, E.A.-C. and N.G.-R.; Data curation, E.A.-C.; Writing—original draft, I.G. and M.G.; Writing—review & editing, N.G.-R.; Visualization, E.A.-C.; Supervision, M.G.; Project administration, E.A.-C.; Funding acquisition, M.G. All authors have read and agreed to the published version of the manuscript.

Funding

This research was funded by University of Castilla-La Mancha, grant number [2022-GRIN-34255] and Regional Government of Castile-La Mancha, grant number [SBPLY/21/180225/000110].

Data Availability Statement

The data that support the findings of this study are available from Ravenpack, though restrictions apply to the availability of these data, which were used under licence for the current study; thus, they are not publicly available. Data are, however, available from the authors upon reasonable request and with permission from Ravenpack.

Conflicts of Interest

The authors declare no conflict of interest.

References

  1. Ahmar, Ansari Saleh, and Eva Boj Del Val. 2020. SutteARIMA: Short-term forecasting method, a case: COVID-19 and stock market in Spain. Science of The Total Environment 729: 138883. [Google Scholar] [CrossRef]
  2. Ahmed, W. M. A. 2022. What Drives US Stock Markets during the COVID-19 Pandemic? A Global Sensitivity Analysis. Borsa Istanbul Review 22: 939–60. [Google Scholar] [CrossRef]
  3. Albaity, Mohamed, Ray Saadaoui Mallek, and Hasan Mustafa. 2022. Bank Stock Return Reactions to the COVID-19 Pandemic: The Role of Investor Sentiment in MENA Countries. Risks 10: 43. [Google Scholar] [CrossRef]
  4. Albulescu, Claudiu Tiberiu, Aviral Kumar Tiwari, and Phouphet Kyophilavong. 2021. Nonlinearities and Chaos: A New Analysis of CEE Stock Markets. Mathematics 9: 707. [Google Scholar] [CrossRef]
  5. Ali, Kashif, Muhammad Ashfaque, Adil Saleem, Judit Bárczi, and Judit Sági. 2022a. Did the Islamic Stock Index Provide Shelter for Investors during the COVID-19 Crisis? Evidence from an Emerging Stock Market. Risks 10: 109. [Google Scholar] [CrossRef]
  6. Ali, Syez Riaz Mahmood, Walid Mensi, Kaysul Islam Anik, Mishtakur Rahman, and Sang Hoong Kang. 2022b. The impacts of COVID-19 crisis on spillovers between the oil and stock markets: Evidence from the largest oil importers and exporters. Economic Analysis and Policy 73: 345–72. [Google Scholar] [CrossRef]
  7. Araújo, Ricardo De A., Nadia Nedjah, José M. de Sexias, Adriano L. I. Oliveira, and Silvio R. De Meira. 2018. Evolutionary-morphological learning machines for high-frequency financial time series prediction. Swarm and Evolutionary Computation 42: 1–15. [Google Scholar] [CrossRef]
  8. Asawa, Parth, Manas Gaur, Kaushik Roy, and Amit Sheth. 2020. COVID-19 in Spain and India: Comparing Policy Implications by Analyzing Epidemiological and Social Media Data. arXiv. [Google Scholar] [CrossRef]
  9. Asl, Mahdi Ghaemi, Oluwasegun Babatunde Adekoya, Muhammad Mahdi Rashidi, Mohammad Ghasemi Doudkanlou, and Ali Dolatabadi. 2022. Forecast of Bayesian-based dynamic connectedness between oil market and Islamic stock indices of Islamic oil-exporting countries: Application of the cascade-forward backpropagation network. Resources Policy 77: 102778. [Google Scholar] [CrossRef]
  10. Bai, Chenjiang, Yuejiao Duan, Xiaoyun Fan, and Shuai Tang. 2023. Financial market sentiment and stock return during the COVID-19 pandemic. Finance Research Letters 54: 103709. [Google Scholar] [CrossRef]
  11. Barky, Walid, Peter John Kavalmthara, Vivienne Saverimuttu, Yiyang Liu, and Sajan Cyril. 2022. Response of stock market volatility to COVID-19 announcements and stringency measures: A comparison of developed and emerging markets. Finance Research Letters 46: 102350. [Google Scholar] [CrossRef]
  12. Benlagha, Noureddine, and Salaheddine El Omari. 2022. Connectedness of stock markets with gold and oil: New evidence from COVID-19 pandemic. Finance Research Letters 46: 102373. [Google Scholar] [CrossRef] [PubMed]
  13. Bhatnagar, Mukul, Ercan Özen, Sanjay Taneja, Simon Grima, and Ramon Rupeika-Apoga. 2022. The Dynamic Connectedness between Risk and Return in the Fintech Market of India: Evidence Using the GARCH-M Approach. Risks 10: 209. [Google Scholar] [CrossRef]
  14. Çelik, Taha Buğra, Özgür İcan, and Elif Bulut. 2023. Extending machine learning prediction capabilities by explainable AI in financial time series prediction. Applied Soft Computing 132: 109876. [Google Scholar] [CrossRef]
  15. Cepoi, Cosmin Octavian. 2020. Asymmetric dependence between stock market returns and news during COVID-19 financial turmoil. Finance Research Letters 36: 101658. [Google Scholar] [CrossRef]
  16. Chen, Qian, Xiang Gao, Jianming Mo, and Zhouling Xu. 2022. Market Reaction to Local Attention around Earnings Announcements in China: Evidence from Internet Search Activity. International Journal of Financial Studies 10: 97. [Google Scholar] [CrossRef]
  17. Chundakkadan, Radeef, and Elizabeth Nedumparambil. 2021. In search of COVID-19 and stock market behavior. Global Finance Journal 54: 100639. [Google Scholar] [CrossRef]
  18. Das, Debojyoti, M. Kannadhasan, and Malay Bhattacharyya. 2019. Do the emerging stock markets react to international economic policy uncertainty, geopolitical risk and financial stress alike? The North American Journal of Economics and Finance 48: 1–19. [Google Scholar] [CrossRef]
  19. Dash, Rajashree, P. K. Dash, and Ranjeetha Bisoi. 2014. A self adaptive differential harmony search based optimized extreme learning machine for financial time series prediction. Swarm and Evolutionary Computation 19: 25–42. [Google Scholar] [CrossRef]
  20. Dash, Saumya Ranjan, and Debasish Maitra. 2022. The COVID-19 pandemic uncertainty, investor sentiment, and global equity markets: Evidence from the time-frequency co-movements. The North American Journal of Economics and Finance 62: 101712. [Google Scholar] [CrossRef]
  21. Dey, Asim K., G. M. Tofiqul Hoque, Kumer P. Das, and Irina Panovska. 2022. Impacts of COVID-19 local spread and Google search trend on the US stock market. Physica A: Statistical Mechanics and Its Applications 589: 126423. [Google Scholar] [CrossRef] [PubMed]
  22. Ding, Guangyu, and Liangxi Qin. 2020. Study on the prediction of stock price based on the associated network model of LSTM. International Journal of Machine Learning and Cybernetics 11: 1307–17. [Google Scholar] [CrossRef]
  23. Drake, Pamela Peterson. 2022. The gold-stock market relationship during COVID-19. Finance Research Letters 44: 102111. [Google Scholar] [CrossRef] [PubMed]
  24. Elliott, D. L., K. C. Santosh, and Charles Anderson. 2020. Gradient boosting in crowd ensembles for Q-learning using weight sharing. International Journal of Machine Learning and Cybernetics 11: 2275–87. [Google Scholar] [CrossRef]
  25. Gao, Xiaofang, Jiye Liang, Wenjian Wang, Xuefei Bai, and Lina Jia. 2022. An unsupervised multi-manifold discriminant isomap algorithm based on the pairwise constraints. International Journal of Machine Learning and Cybernetics 13: 1317–36. [Google Scholar] [CrossRef]
  26. Garcia-Vega, Sergio, Xiao Jun Zeng, and John Keane. 2020. Stock returns prediction using kernel adaptive filtering within a stock market interdependence approach. Expert Systems with Applications 160: 113668. [Google Scholar] [CrossRef]
  27. Ghosh, Indranil, and Tamal Datta Chaudhuri. 2021. FEB-Stacking and FEB-DNN Models for Stock Trend Prediction: A Performance Analysis for Pre and Post COVID-19 Periods. Decision Making: Applications in Management and Engineering 4: 51–84. [Google Scholar] [CrossRef]
  28. Ghosh, Indranil, and Tamal Datta Chaudhuri. 2022. Integrating Navier-Stokes equation and neoteric iForest-BorutaShap-Facebook’s prophet framework for stock market prediction: An application in Indian context. Expert Systems with Applications 210: 118391. [Google Scholar] [CrossRef]
  29. Ghosh, Indranil, Esteban Alfaro-Cortés, Matías Gámez, and Noelia García-Rubio. 2023. Role of proliferation COVID-19 media chatter in predicting Indian stock market: Integrated framework of nonlinear feature transformation and advanced AI. Expert Systems with Applications 219: 119695. [Google Scholar] [CrossRef]
  30. Ghosh, Indranil, Rabin K. Jana, and Manas K. Sanyal. 2019. Analysis of temporal pattern, causal interaction and predictive modeling of financial markets using nonlinear dynamics, econometric models and machine learning algorithms. Applied Soft Computing 82: 105553. [Google Scholar] [CrossRef]
  31. Ghosh, Indranil, Tamal Datta Chaudhuri, Esteban Alfaro-Cortés, Matías G. Martínez, and Noelia García-Rubio. 2021. Estimating the relative effects of raw material prices, sectoral outlook and market sentiment on stock prices. Resources Policy 73: 102158. [Google Scholar] [CrossRef]
  32. Ghosh, Indranil, Tamal Datta Chaudhuri, Esteban Alfaro-Cortés, Matías Gámez, and Noelia García. 2022. A hybrid approach to forecasting futures prices with simultaneous consideration of optimality in ensemble feature selection and advanced artificial intelligence. Technological Forecasting and Social Change 181: 121757. [Google Scholar] [CrossRef]
  33. Hasan, Md Bokhtiar, M. Kabir Hassan, Md Mamunur Rashid, and Yasser Alhenawi. 2021. Are safe haven assets really safe during the 2008 global financial crisis and COVID-19 pandemic? Global Finance Journal 50: 100668. [Google Scholar] [CrossRef]
  34. Hsu, Yu Lin, and Leilei Tang. 2022. Effects of investor sentiment and country governance on unexpected conditional volatility during the COVID-19 pandemic: Evidence from global stock markets. International Review of Financial Analysis 82: 102186. [Google Scholar] [CrossRef]
  35. Huang, Qi An, Jun Chan Zhao, and Xiao Qun Wu. 2022. Financial risk propagation between Chinese and American stock markets based on multilayer networks. Physica A: Statistical Mechanics and its Applications 586: 126445. [Google Scholar] [CrossRef]
  36. Inglada-Perez, Lucia. 2020. A Comprehensive Framework for Uncovering Non-Linearity and Chaos in Financial Markets: Empirical Evidence for Four Major Stock Market Indices. Entropy 22: 1435. [Google Scholar] [CrossRef]
  37. Jana, Rabin K., and Indranil Ghosh. 2022. A residual driven ensemble machine learning approach for forecasting natural gas prices: Analyses for pre-and during-COVID-19 phases. Annals of Operations Research. [Google Scholar] [CrossRef]
  38. Jana, Rabin K., Indranil Ghosh, Fred Jawadi, Gazi Salah Uddin, and Ricardo M. Sousa. 2022. COVID-19 news and the US equity market interactions: An inspection through econometric and machine learning lens. Annals of Operations Research. [Google Scholar] [CrossRef]
  39. Kamal, Javed Bin, and Mark Wohar. 2023. Heterogenous responses of stock markets to covid related news and sentiments: Evidence from the 1st year of pandemic. International Economics 173: 68–83. [Google Scholar] [CrossRef]
  40. Kamaludin, Kamilah, Sheela Sundarasen, and Izani Ibrahim. 2021. COVID-19, Dow Jones and equity market movement in ASEAN-5 countries: Evidence from wavelet analyses. Heliyon 7: e05851. [Google Scholar] [CrossRef]
  41. Kamdem, Jules Sadefo, Rose. Bandolo Essomba, and James Njong Berinyuy. 2020. Deep learning models for forecasting and analyzing the implications of COVID-19 spread on some commodities markets volatilities. Chaos, Solitons & Fractals 140: 110215. [Google Scholar] [CrossRef]
  42. Khalfaoui, Rabeh, Salma Mefteh-Wali, Buhari Dogan, and Sudeshna Ghosh. 2023. Extreme spillover effect of COVID-19 pandemic-related news and cryptocurrencies on green bond markets: A quantile connectedness analysis. International Review of Financial Analysis 86: 102496. [Google Scholar] [CrossRef] [PubMed]
  43. Kubiczek, Jakub, and Marcin Tuszkiewicz. 2022. Intraday Patterns of Liquidity on the Warsaw Stock Exchange before and after the Outbreak of the COVID-19 Pandemic. International Journal of Financial Studies 10: 13. [Google Scholar] [CrossRef]
  44. Lange, Petter Eilif de, Borger Melsom, Christian Bakke Vennerød, and Sjur Westgaard. 2022. Explainable AI for Credit Assessment in Banks. Journal of Risk and Financial Management 15: 556. [Google Scholar] [CrossRef]
  45. Li, Cong, Shiwei Lin, Yihan Sun, Sahar Afshan, and Tanzeela Yaqoob. 2022. The asymmetric effect of oil price, news-based uncertainty, and COVID-19 pandemic on equity market. Resources Policy 77: 102740. [Google Scholar] [CrossRef] [PubMed]
  46. Lúcio, Francisco, and Jorge Caiado. 2022. COVID-19 and Stock Market Volatility: A Clustering Approach for S&P 500 Industry Indices. Finance Research Letters 49: 103141. [Google Scholar] [CrossRef]
  47. Lundberg, Scott, and Su In Lee. 2017. A Unified Approach to Interpreting Model Predictions. arXiv. [Google Scholar] [CrossRef]
  48. Ma, Feng, Xinjie Lu, Jia Liu, and Dengshi Huang. 2022. Macroeconomic attention and stock market return predictability. Journal of International Financial Markets Institutions and Money 79: 101603. [Google Scholar] [CrossRef]
  49. Makatjane, Katleho, and Ntebogang Moroke. 2021. Predicting Extreme Daily Regime Shifts in Financial Time Series Exchange/Johannesburg Stock Exchange—All Share Index. International Journal of Financial Studies 9: 18. [Google Scholar] [CrossRef]
  50. Melis, Marco, Michele Scalas, Ambra Demontis, Davide Maiorca, Battista Biggio, Giorgio Giacinto, and Fabio Roli. 2021. Do gradient-based explanations tell anything about adversarial robustness to android malware? International Journal of Machine Learning and Cybernetics 13: 217–32. [Google Scholar] [CrossRef]
  51. Nguyen, Khanh Quoc. 2022. The correlation between the stock market and Bitcoin during COVID-19 and other uncertainty periods. Finance Research Letters 46: 102284. [Google Scholar] [CrossRef] [PubMed]
  52. Noreen, Umara, Attayah Shafique, Usman Ayub, and Syed Kashif Saeed. 2022. Does the Adaptive Market Hypothesis Reconcile the Behavioral Finance and the Efficient Market Hypothesis? Risks 10: 168. [Google Scholar] [CrossRef]
  53. Polamuri, Subba Rao, Kudipudi Srinivas, and A. Krishna Mohan. 2021. Multi-Model Generative Adversarial Network Hybrid Prediction Algorithm (MMGAN-HPA) for stock market prices prediction. Journal of King Saud University - Computer and Information Sciences 34: 7433–44. [Google Scholar] [CrossRef]
  54. Qiu, Mingyue, Yu Song, and Fumio Akagi. 2016. Application of artificial neural network for the prediction of stock market returns: The case of the Japanese stock market. Chaos, Solitons & Fractals 85: 1–7. [Google Scholar] [CrossRef]
  55. RavenPack. 2023. Coronavirus Media Monitor. Available online: https://www.ravenpack.com/solutions/research/coronavirus-media-monitor (accessed on 3 May 2022).
  56. Ravi, Vadlamani, Dadabada Pradeepkumar, and Kalyanmoy Deb. 2017. Financial time series prediction using hybrids of chaos theory, multi-layer perceptron and multi-objective evolutionary algorithms. Swarm and Evolutionary Computation 36: 136–49. [Google Scholar] [CrossRef]
  57. Ribeiro, Marco Tulio, Sameer Singh, and Carlos Guestrin. 2016. “Why should I trust you?” Explaining the predictions of any classifier. Paper presented at 22nd ACM SIGKDD Conference, San Francisco, CA, USA, August 13–17. [Google Scholar] [CrossRef]
  58. Ronaghi, Farnoush, Mohammad Salimibeni, Farnoosh Naderkhani, and Arash Mohammadi. 2022. COVID19-HPSMP: COVID-19 adopted Hybrid and Parallel deep information fusion framework for stock price movement prediction. Expert Systems with Applications 187: 115879. [Google Scholar] [CrossRef]
  59. Saetia, Kittipob, and Jiraphat Yokrattanasak. 2023. Stock Movement Prediction Using Machine Learning Based on Technical Indicators and Google Trend Searches in Thailand. International Journal of Financial Studies 11: 5. [Google Scholar] [CrossRef]
  60. Salisu, Afees A., and Xuan Vinh Vo. 2020. Predicting stock returns in the presence of COVID-19 pandemic: The role of health news. International Review of Financial Analysis 71: 101546. [Google Scholar] [CrossRef]
  61. Schapire, Robert E., and Yoram Singer. 1999. Improved boosting algorithms using confidence-rated predictions. Machine Learning 37: 297–336. [Google Scholar] [CrossRef]
  62. Sharma, Gagan Deep, Aviral Kumar Tiwari, Mansi Jain, Anshita Yadav, and Burak Erkut. 2021. Unconditional and conditional analysis between COVID-19 cases, temperature, exchange rate and stock markets using wavelet coherence and wavelet partial coherence approaches. Heliyon 7: e06181. [Google Scholar] [CrossRef]
  63. Sinlapates, Parichat, Tanit Sriwong, and Surachai Chancharat. 2023. Risk Spillovers between Bitcoin and ASEAN+6 Stock Markets before and after COVID-19 Outbreak: A Comparative Analysis with Gold. Journal of Risk and Financial Management 16: 103. [Google Scholar] [CrossRef]
  64. Spulbar, Cristi, Jatin Trivedi, and Ramona Birau. 2020. Investigating abnormal volatility transmission patterns between emerging and developed stock markets: A case study. Journal of Business Economics and Management 21: 1561–92. [Google Scholar] [CrossRef]
  65. Tenenbaum, Joshua B., Vin De Silva, and John C. Langford. 2000. A Global Geometric Framework for Nonlinear Dimensionality Reduction. Science 290: 2319–23. [Google Scholar] [CrossRef] [PubMed]
  66. Thangamuthu, Mohanasundaram, Suneel Maheshwari, and Deepak Raghava Naik. 2022. Volatility Spillover Effects during Pre-and-Post COVID-19 Outbreak on Indian Market from the USA, China, Japan, Germany, and Australia. Journal of Risk and Financial Management 15: 378. [Google Scholar] [CrossRef]
  67. Thorbecke, Willem. 2022. Understanding the transmission of COVID-19 news to French financial markets in early 2020. International Economics 170: 103–14. [Google Scholar] [CrossRef]
  68. World Bank. 2022. The World Bank/Data/Countries and Economies. Available online: https://data.worldbank.org/country (accessed on 3 May 2022).
  69. WTO. 2022. World Trade Organization. Trade Profiles. Available online: https://www.wto.org/english/res_e/statis_e/trade_profiles_list_e.htm (accessed on 3 May 2022).
  70. Yousfi, Mohamed, Younes Ben Zaied, Nidhaleddine Ben Cheikh, Béchir Ben Lahouel, and Houssem Bouzgarrou. 2021. Effects of the COVID-19 pandemic on the US stock market and uncertainty: A comparative assessment between the first and second waves. Technological Forecasting and Social Change 167: 120710. [Google Scholar] [CrossRef]
  71. Yu, Xiaoling, and Kaitian Xiao. 2022. Dependencies and Volatility Spillovers among Chinese Stock and Crude Oil Future Markets: Evidence from Time-Varying Copula and BEKK-GARCH Models. Journal of Risk and Financial Management 15: 491. [Google Scholar] [CrossRef]
  72. Yu, Xiaoling, Kaitian Xiao, and Junping Liu. 2022. Dynamic co-movements of COVID-19 pandemic anxieties and stock market returns. Finance Research Letters 46: 102219. [Google Scholar] [CrossRef]
  73. Zeng, Qing, Xinjie Lu, Tao Li, and Lan Wu. 2022. Jumps and stock market variance during the COVID-19 pandemic: Evidence from international stock markets. Finance Research Letters 48: 102896. [Google Scholar] [CrossRef]
  74. Zhang, Hongwei, Huojun Hong, Yaoqi Guo, and Cai Yang. 2022. Information spillover effects from media coverage to the crude oil, gold, and Bitcoin markets during the COVID-19 pandemic: Evidence from the time and frequency domains. International Review of Economics & Finance 78: 267–85. [Google Scholar] [CrossRef]
  75. Zhang, Yongmin, and Jiaying Mao. 2022. COVID-19’s impact on the spillover effect across the Chinese and U.S. stock markets. Finance Research Letters 47: 102684. [Google Scholar] [CrossRef]
  76. Zheng, Songfeng. 2011. Gradient descent algorithms for quantile regression with smooth approximation. International Journal of Machine Learning and Cybernetics 2: 191–207. [Google Scholar] [CrossRef]
  77. Zhou, Yang, Xiaoxiao Wang, Rebecca Kechen Dong, Ruihui Pu, and Xioa Guang Yue. 2022. Natural resources commodity prices volatility: Evidence from COVID-19 for the US economy. Resources Policy 78: 102895. [Google Scholar] [CrossRef]
Figure 1. Boxplot of worldwide media indicators.
Risks 11 00094 g001
Figure 2. Boxplot of media indicators in Spain.
Risks 11 00094 g002
Figure 3. Boxplot of media indicators in India. Figure 1, Figure 2 and Figure 3 depict respective boxplots of worldwide and country-wise COVID-19 Media Chatter Indicators for explaining stock market dynamics. Presence of skewed distribution is apparent.
Risks 11 00094 g003
Figure 4. Violin plots of common macroeconomic constructs: (a) OIL; (b) BITCOIN; (c) GOLD.
Risks 11 00094 g004
Figure 5. Violin pots of dedicated macroeconomic constructs for Spanish market: (a) OAE; (b) IBEX35; (c) VIBEX.
Risks 11 00094 g005
Figure 6. Violin plots of dedicated macroeconomic constructs for Indian market: (a) EM; (b) NIFTY; (c) IVIX. Figure 4, Figure 5 and Figure 6 present the violin plots of global and market-specific macroeconomic indicators. Several indicators suggest the existence of bimodal distributions.
Risks 11 00094 g006
Figure 7. Predictive performance on test segment for ARCELORMITTAL and EBRO: (a) ARCELORMITTAL; (b) EBRO.
Risks 11 00094 g007
Figure 8. Predictive performance on test segment for APOLLO and BAJAJ: (a) APOLLO; (b) BAJAJ. Figure 7 and Figure 8 display Actual and Predicted values for chosen Spanish and Indian stocks on test data samples. Predictions are obtained using combined framework of ISOMAP and GBR. A close resemblance between actual and predicted figures justifies efficacy of predictive framework.
Risks 11 00094 g008
Figure 9. Feature contribution plot for IAG prediction.
Risks 11 00094 g009
Figure 10. Feature contribution plot for INTERGLOBE prediction.
Risks 11 00094 g010
Figure 11. Feature contribution plot for GRIFOLS prediction.
Risks 11 00094 g011
Figure 12. Feature contribution plot for APOLLO prediction. Figure 9, Figure 10, Figure 11 and Figure 12 display outcome global feature importance analysis via SHAP. Horizontal axis annotates magnitude and direction of influence of respective features arranged vertically. Color code indicates values of features.
Risks 11 00094 g012
Figure 13. Local level feature contribution for IAG prediction.
Risks 11 00094 g013
Figure 14. Local level feature contribution for INTERGLOBE prediction.
Risks 11 00094 g014
Figure 15. Local level feature contribution for GRIFOLS prediction.
Risks 11 00094 g015
Figure 16. Local level feature contribution for APOLLO prediction. Figure 13, Figure 14, Figure 15 and Figure 16 display outcome of local-level feature contribution using LIME. Vertical axis annotates magnitude of influence of respective features arranged vertically. Color code implies direction of influence.
Risks 11 00094 g016
Table 1. Key statistical properties of Spanish and Indian stocks.
SeriesMeanStd. Dev.Frosini TestADF TestTerasvirta’s NN TestHurst Exponent
Spanish stocks
ARCELORMITTAL20.2297.70354.312 ***1.000 #105.88 ***0.872 ***
EBRO18.001.1881.087 ***−0.707 #649.94 ***0.862 ***
GESTAMP4.9460.8711.59 ***0.105 #553.51 ***0.867 ***
GRIFOLS22.594.0120.649 ***−1.855 #518.02 ***0840 ***
IAG1.8230.3590.258 *−0.390 #449.19 ***0.828 ***
INDRA7.8851.2760.911 ***0.333 #533.46 ***0.853 ***
REPSOL9.2771.7450.839 ***0.373 #548.13 ***0.862 ***
ROVI46.1115.1641.027 ***1.534 #704.01 ***0.868 ***
SIEMENS23.395.7450.268 *−0.140 #542.21 ***0.853 ***
TELEFONICA3.8470.3800.831 ***−0.150 #644.9 ***0.832 ***
Indian stocks
APOLLO3118.1971308.9411.056 ***1.397 #773.12 ***0.865 ***
BAJAJ3416.201497.1430.654 ***0.896 #464.44 ***0.855 ***
EXIDE172.98916.7480.468 ***0.161 #482.16 ***0.848 ***
HAVELL978.459296.1301.043 ***0.890 #649.04 ***0.863 ***
INFOSYS1323.63376.2180.893 ***2.161 #552.01 ***0.860 ***
INTERGLOBE1594.319377.6141.014 ***0.472 #566.67 ***0.853 ***
IOCL100.33916.6900.808 ***0.777 #470.05 ***0.863 ***
ITC205.91319.4660.509 ***0.597 #618.35 ***0.842 ***
SUN641.808135.7251.059 ***1.936 #468.18 ***0.867 ***
TATASTEEL833.685401.3761.529 ***1.265 #857.9 ***0.875 ***
*** Significant at 1% level of significance, * Significant at 10% level of significance, # Not Significant, Std. Dev.: Standard Deviation, ADF Test: Augmented Dickey–Fuller Test, Terasvirta’s NN Test: Terasvirta’s Neural Network Test.
Table 2. Predictive performance on Spanish and Indian stocks.
Training SegmentTest Segment
NSETIIADANSETIIADA
Spanish stocks
ARCELORMITTAL0.98900.01870.99330.96640.93430.04740.93350.9054
EBRO0.96940.00580.98600.95680.87690.01150.94380.9054
GESTAMP0.99530.00820.99700.96880.89370.04000.91730.8649
GRIFOLS0.99700.00460.99840.98560.85790.03870.93880.8784
IAG0.94920.02210.96860.94010.59110.05620.71530.8649
INDRA0.95540.01670.97880.96160.75880.04150.81350.9045
REPSOL0.99740.00470.99850.99280.89970.02850.91530.9189
ROVI0.99640.00940.99810.97360.91300.04890.92780.9054
SIEMENS0.98530.01470.99160.97840.70290.06460.84890.8784
TELEFONICA0.94630.01170.96490.95440.74070.02200.75910.8514
Indian stocks
APOLLO0.99920.00510.99970.99270.96170.04060.98500.9589
BAJAJ0.97390.01170.98460.97090.84720.02800.90480.9041
EXIDE0.98000.00680.99000.95630.64110.03090.80650.9178
HAVELL0.99780.00680.99880.98790.96260.03000.98320.9589
INFOSYS0.99850.00530.99910.97570.97240.02440.98670.9863
INTERGLOBE0.98730.01260.99220.96120.94730.03080.97360.8767
IOCL0.99420.00060.99740.99760.93520.02130.97200.9452
ITC0.95320.01020.97080.94420.81670.02050.89860.9452
SUN0.99680.00580.99840.98540.94330.02730.97470.9452
TATASTEEL0.99840.00860.99910.99760.94830.05170.97880.9315
Table 3. Ranking of models using MCS evaluation.
SeriesARIMASARIMABATSTBATSISOMAP-GBR
Spanish stocks
ARCELORMITTAL(4)(5)(3)(2)(1)
EBRO(5)(4)(3)(2)(1)
GESTAMP(5)(4)(3)(2)(1)
GRIFOLS(5)(4)(3)(2)(1)
IAG(5)(4)(3)(2)(1)
INDRA(4)(5)(3)(2)(1)
REPSOL(4)(5)(2)(3)(1)
ROVI(5)(4)(3)(2)(1)
SIEMENS(5)(4)(3)(2)(1)
TELEFONICA(4)(5)(3)(2)(1)
Indian stocks
APOLLO(5)(4)(3)(2)(1)
BAJAJ(5)(4)(3)(2)(1)
EXIDE(4)(5)(2)(3)(1)
HAVELL(5)(4)(2)(3)(1)
INFOSYS(4)(5)(3)(2)(1)
INTERGLOBE(4)(5)(3)(2)(1)
IOCL(4)(5)(3)(2)(1)
ITC(5)(4)(3)(2)(1)
SUN(5)(4)(3)(2)(1)
TATASTEEL(4)(5)(3)(2)(1)
Table 4. Feature ranking of Spanish stocks.
SeriesGlobal LevelCount of Media ChatterLocal LevelCount of Media Chatter
ARCELORMITTALOIL (1), BITCOIN (2), MEDIA_COVERAGE_INDEX_WW (3), IBEX35 (4), VIBEX, OAE (5), MEDIA_HYPE_INDEX_WW (6), SENTIMENT_INDEX_WW (7), GOLD (8), INFODEMIC_INDEX_WW (9), SENTIMENT_INDEX_SP (10).5 (4 worldwide and 1 local indicators)MEDIA_COVERAGE_INDEX_WW (1), OIL (2), IBEX35 (3), VIBEX (4), PANIC_INDEX_WW (5), GOLD (6), FAKE_NEWS_INDEX_WW (7), FAKE_NEWS_INDEX_SP (8), BITCOIN (9), PANIC_INDEX_SP (10). 5 (3 worldwide and 2 local indicators)
EBROOIL (1), BITCOIN (2), MEDIA_HYPE_INDEX_WW (3), GOLD (4), IBEX35 (5), OAE (6), VIBEX (7), INFODEMIC_INDEX_SP (8), MEDIA_COVERAGE_INDEX_WW (9), SENTIMENT_INDEX_SP (10).4 (2 worldwide and 2 local indicators)OIL (1), BITCOIN (2), MEDIA_HYPE_INDEX_WW (3), GOLD (4), SENTIMENT_INDEX_SP (5), FAKE_NEWS_INDEX_SP (6), INFODEMIC_INDEX_WW (7), MEDIA_COVERAGE_INDEX_SP (8), PANIC_INDEX_WW (9), IBEX35 (10).6 (3 worldwide and 3 local indicators)
GESTAMPBITCOIN (1), OIL (2), IBEX35 (3), MEDIA_HYPE_INDEX_WW (4), OAE (5), GOLD (6), MEDIA_COVERAGE_INDEX_SP (7), VIBEX (8), FAKE_NEWS_INDEX_WW (9), SENTIMENT_INDEX_WW (10).4 (3 worldwide and 1 local indicators)OAE (1), OIL (2), BITCOIN (3), IBEX35 (4), VIBEX (5), MEDIA_HYPE_INDEX_WW (6), GOLD (7), SENTIMENT_INDEX_SP (8), FAKE_NEWS_INDEX_WW (9), SENTIMENT_INDEX_WW (10).4 (3 worldwide and 1 local indicators)
INDRABITCOIN (1), MEDIA_COVERAGE_INDEX_WW (2), GOLD (3), OIL (4), INFODEMIC_INDEX_WW (5), IBEX35 (6), MEDIA_HYPE_INDEX_WW, OAE (7), SENTIMENT_INDEX_WW (8), SENTIMENT_INDEX_SP (9), INFODEMIC_INDEX_SP (10).6 (4 worldwide and 2 local indicators)IBEX35 (1), BITCOIN (2), MEDIA_COVERAGE_INDEX_WW (3), GOLD (4), OIL (5), INFODEMIC_INDEX_WW (6), MEDIA_HYPE_INDEX_WW (7), INFODEMIC_INDEX_SP (8), SENTIMENT_INDEX_WW (9), VIBEX (10).5 (4 worldwide and 1 local indicators)
REPSOLOIL (1), IBEX35 (2), GOLD (3), BITCOIN (4), INFODEMC_INDEX_WW (5), VIBEX (6), SENTIMENT_INDEX_WW (7), OAE (8), MEDIA_COVERAGE_INDEX_SP (9), MEDIA_COVERAGE_INDEX_WW (10).4 (3 worldwide and 1 local indicators)OIL (1), GOLD (2), BITCOIN (3), MEDIA_HYPE_INDEX_WW (4), OAE (5), VIBEX (6), FAKE_NEWS_INDEX_WW (7), INFODEMIC_INDEX_SP (8), MEDIA_COVERAGE_INDEX_WW (9), INFODEMIC_INDEX_WW (10).5 (4 worldwide and 1 local indicators)
ROVIOIL (1), MEDIA_HYPE_INDEX_WW (2), MEDIA_COVERAGE_INDEX_WW (3), BITCOIN (4), OAE (5), GOLD (6), INFODEMIC_INDEX_WW (7), SENTIMENT_INDEX_WW (8), IBEX35 (9), MEDIA_COVERAGE_INDEX_SP (10).5 (4 worldwide and 1 local indicators)OIL (1), MEDIA_HYPE_INDEX_WW (2), MEDIA_COVERAGE_INDEX_WW (3), BITCOIN (4), OAE (5), GOLD (6), INFODEMIC_INDEX_WW (7), SENTIMENT_INDEX_WW (8), IBEX35 (9), MEDIA_COVERAGE_INDEX_SP (10).5 (4 worldwide and 1 local indicators)
SIEMENSBITCOIN (1), OAE (2), OIL (3), MEDIA_COVERAGE_INDEX_WW (4), INFODEMIC_INDEX_WW (5), GOLD (6), VIBEX (7), MEDIA_HYPE_INDEX_WW (8), SENTIMENT_INDEX_WW (9), IBEX35 (10).4 (4 worldwide indicators)BITCOIN (1), MEDIA_COVERAGE_INDEX_WW (2), OAE (3), OIL (4), MEDIA_HYPE_INDEX_WW (5), VIBEX (6), MEDIA_COVERAGE_INDEX_SP (7), IBEX35 (8), INFODEMIC_INDEX_WW (9), GOLD (10).4 (3 worldwide and 1 local indicators)
TELEFONICAGOLD (1), IBEX35 (2), BITCOIN (3), OIL (4), MEDIA_HYPE_INDEX_WW (5), INFODEMIC_INDEX_WW (6), MEDIA_COVERAGE_INDEX_WW (7), SENTIMENT_INDEX_WW (8), MEDIA_HYPE_INDEX_SP (9), FAKE_NEWS_INDEX_WW (10).6 (5 worldwide and 1 local indicators)IBEX35 (1), OIL (2), GOLD (3), MEDIA_HYPE_INDEX_WW (4), FAKE_NEWS_INDEX_WW (5), INFODEMIC_INDEX_WW (6), MEDIA_HYPE_INDEX_SP (7), MEDIA_COVERAGE_INDEX_WW (8), FAKE_NEWS_INDEX_SP (9), BITCOIN (10).6 (5 worldwide and 1 local indicators)
Table 5. Feature ranking of Indian stocks.
SeriesGlobal LevelCount of Media ChatterLocal LevelCount of Media Chatter
BAJAJNIFTY (1), OIL (2), EM (3), BITCOIN (4), SENTIMENT_INDEX_WW (5), IVIX (6), MEDIA_HYPE_INDEX_WW (7), MEDIA_HYPE_INDEX_IN (8), SENTIMENT_INDEX_IN (9), MEDIA_COVERAGE_INDEX_WW (10).5 (3 worldwide and 2 local indicators)NIFTY (1), EM (2), OIL (3), BITCOIN (4), MEDIA_HYPE_INDEX_WW (5), IVIX (6), MEDIA_HYPE_INDEX_IN (7), MEDIA_COVERAGE_INDEX_IN (8), SENTIMENT_INDEX_IN (9), SENTIMENT_INDEX_WW (10).5 (2 worldwide and 3 local indicators)
EXIDEEM (1), IVIX (2), NIFTY (3), MEDIA_COVERAGE_INDEX_WW (4), GOLD (5), OIL (6), MEDIA_HYPE_INDEX_IN (7), BITCOIN (8), SENTIMENT_INDEX_IN (9), MEDIA_COVERAGE_INDEX_IN (10). 4 (1 worldwide and 3 local indicators)EM (1), IVIX (2), GOLD (3), MEDIA_COVERAGE_INDEX_WW (4), SENTIMENT_INDEX_IN (5), NIFTY (6), FAKE_NEWS_INDEX_IN (7), INFODEMIC_INDEX_WW (8), MEDIA_HYPE_INDEX_WW (9), MEDIA_HYPE_INDEX_IN (10).6 (2 worldwide and 4 local indicators)
HAVELLOIL (1), NIFTY (2), BITCOIN (3), INFODEMIC_INDEX_IN (4), MEDIA_HYPE_INDEX_IN (5), IVIX (6), MEDIA_HYPE_INDEX_WW (7), EM (8), SENTIMENT_INDEX_WW (9), INFODEMIC_INDEX_WW (10).5 (3 worldwide and 2 local indicators)NIFTY (1), OIL (2), MEDIA_HYPE_INDEX_IN (3), INFODEMIC_INDEX_IN (4), PANIC_INDEX_WW, EM (5), FAKE_NEWS_INDEX_WW (6), SENTIMENT_INDEX_WW (7), MEDIA_COVERAGE_INDEX_IN (8), IVIX (9), MEDIA_COVERAGE_INDEX_WW (10).6 (3 worldwide and 3 local indicators)
INFOSYSNIFTY (1), BITCOIN (2), OIL (3), EM (4), IVIX (5), MEDIA_COVERAGE_INDEX_WW (6), INFODEMIC_INDEX_IN (7), MEDIA_HYPE_INDEX_WW (8), GOLD, SENTIMENT_INDEX_WW (9), GOLD (10).4 (3 worldwide and 1 local indicators)NIFTY (1), BITCOIN (2), OIL (3), SENTIMENT_INDEX_WW (4), FAKE_NEWS_INDEX_IN (5), MEDIA_HYPE_INDEX_WW (6), IVIX (7), GOLD (8), MEDIA_COVERAGE_INDEX_WW (9), MEDIA_HYPE_INDEX_IN (10).5 (3 worldwide and 2 local indicators)
IOCLNIFTY (1), MEDIA_COVERAGE_INDEX_WW (2), OIL (3), MEDIA_HYPE_INDEX_WW (4), BITCOIN (5), IVIX (6), EM (7), SENTIMENT_INDEX_IN (8), SENTIMENT_INDEX_WW (9), GOLD (10).4 (3 worldwide and 1 local indicators)NIFTY (1), OIL (2), MEDIA_COVERAGE_INDEX_WW (3), SENTIMENT_INDEX_IN (4), EM (5), BITCOIN (6), MEDIA_COVERAGE_INDEX_IN (7), IVIX (8), MEDIA_HYPE_INDEX_IN (9), MEDIA_HYPE_INDEX_WW (10).5 (2 worldwide and 3 local indicators)
ITCNIFTY (1), OIL (2), MEDIA_HYPE_INDEX_WW (3), MEDIA_HYPE_INDEX_IN (4), IVIX (5), EM (6), SENTIMENT_INDEX_WW (7), GOLD (8), BITCOIN (9), SENTIMENT_INDEX_IN (10).4 (2 worldwide and 2 local indicators)NIFTY (1), OIL (2), MEDIA_HYPE_INDEX_IN (3), MEDIA-HYPE_INDEX_WW (4), SENTIMENT_INDEX_IN (5), SENTIMENT_INDEX_WW (6), PANIC_INDEX_IN, IVIX (7), FAKE_NEWS_INDEX_WW (8), FAKE_NEWS_INDEX_IN (9), GOLD (10).7 (3 worldwide and 4 local indicators)
SUNMEDIA_COVERAGE_INDEX_WW (1), NIFTY (2), OIL (3), BITCOIN (4), MEDIA_HYPE_INDEX_WW (5), IVIX (6), MEDIA_HYPE_INDEX_IN (7), EM (8), GOLD (9), PANIC_INDEX_WW (10).4 (3 worldwide and 1 local indicators)MEDIA_COVERAGE_INDEX_WW (1), NIFTY (2), MEDIA_HYPE_INDEX_WW (3), MEDIA_HYPE_INDEX_IN (4), IVIX (5), EM (6), OIL (7), FAKE_NEWS_INDEX_WW (8), INFODEMIC_INDEX_WW (9), BITCOIN (10)5 (4 worldwide and 1 local indicators)
TATASTEELMEDIA_COVERAGE_INDEX_WW (1), MEDIA_HYPE_INDEX_WW (2), NIFTY (3), OIL (4), BITCOIN (5), IVIX (6), EM (7), MEDIA_HYPE_INDEX_IN (8), INFODEMIC_INDEX_IN (9), FAKE_NEWS_INDEX_IN (10).5 (2 worldwide and 3 local indicators)MEDIA_COVERAGE_INDEX_WW (1), NIFTY (2), MEDIA_HYPE_INDEX_WW (3), OIL (4), BITCOIN (5), SENTIMENT_INDEX_IN (6), MEDIA_HYPE_INDEX_IN (7), FAKE_NEWS_INDEX_IN (8), EM (9), PANIC_INDEX_WW (10).6 (3 worldwide and 3 local indicators)
Disclaimer/Publisher’s Note: The statements, opinions and data contained in all publications are solely those of the individual author(s) and contributor(s) and not of MDPI and/or the editor(s). MDPI and/or the editor(s) disclaim responsibility for any injury to people or property resulting from any ideas, methods, instructions or products referred to in the content.

