Review

A Conceptual Model of Investment-Risk Prediction in the Stock Market Using Extreme Value Theory with Machine Learning: A Semisystematic Literature Review

1
Doctoral Program of Mathematics, Faculty of Mathematics and Natural Sciences, Universitas Padjadjaran, Sumedang 45363, Indonesia
2
Department of Mathematics, Faculty of Mathematics and Natural Sciences, Universitas Padjadjaran, Sumedang 45363, Indonesia
3
Faculty of Ocean Engineering Technology and Informatics, Universiti Malaysia Terengganu, Kuala Terengganu 21030, Malaysia
*
Author to whom correspondence should be addressed.
Risks 2023, 11(3), 60; https://doi.org/10.3390/risks11030060
Submission received: 14 December 2022 / Revised: 18 February 2023 / Accepted: 20 February 2023 / Published: 14 March 2023

Abstract

:
The COVID-19 pandemic has been an extraordinary event, the type of event that rarely occurs but that has major impacts on the stock market. The pandemic has created high volatility and caused extreme fluctuations in the stock market. The stock market can be characterized as either linear or nonlinear. One method that can detect extreme fluctuations is extreme value theory (EVT). This study employed a semisystematic literature review on the use of the EVT method to estimate investment risk in the stock market. The literature used was selected by applying the preferred reporting items for systematic review and meta-analyses (PRISMA) guidelines, sourced from the ScienceDirect.com, ProQuest, and Scopus databases. A bibliometric analysis was conducted to determine the study characteristics and identify any research gaps. The results of the analysis show that studies on this topic are rarely carried out. Research in this field is generally performed only in univariate cases and is very complicated in multivariate cases. Given these limitations, further research could focus on developing a conceptual model that is dynamic and sensitive to extreme fluctuations, with multivariable inputs, in order to predict investment risk. The model developed here considered the variables that affect stock price fluctuations as the input data. The combination of VaR–EVT and machine-learning methods is effective in increasing model accuracy because it combines linear and nonlinear models.
MSC:
91G50; 91G70; 62M20; 60G70; 68T07

1. Introduction

The COVID-19 pandemic has had a huge impact on the global economy through the closing of financial market indices; thus, it has caused great uncertainty in the global economic sector (Altig et al. 2020). Stock market losses from the pandemic are inevitable. The reaction of the stock market to developments in the pandemic has considerably affected the financial markets (O’Donnell et al. 2021). Uncontrolled fluctuations in stock markets around the world have made investors increasingly worried about making decisions. The shocks caused by the pandemic have significantly affected the markets, showing higher volatility for all financial indices, and these have had a negative spillover effect on global markets. As a result, the stock market shows the characteristics of extreme fluctuations, demonstrating enormous increases in reaction to the pandemic and the subsequent economic crash, as shown in Figure 1, a chart of the movement of the NASDAQ Composite (USA), DAX 30 (Germany), and IDX Composite (Indonesia) stock indices in the time period 2 January 2019 to 29 December 2022; the data were sourced from finance.yahoo.com (accessed on 29 January 2023).
Figure 1 shows that the composite stock index greatly fluctuated and fell to its lowest point after COVID-2019 was declared a pandemic by the World Health Organization on 11 March 2020. The high volatility in the stock market creates a high level of risk. This high risk can lead to large profits or large losses for investors. These conditions usually raise doubts among investors about their investment activities because it is difficult to identify the best decisions. Therefore, investors need an appropriate method that considers the dynamics of extreme values in order to mitigate uncertainty before making investment decisions.
The amount of risk or maximum loss that may occur should be estimated for every investment. J.P. Morgan proposed a concept called value at risk (VaR), which summarizes the near-impossible losses on investments at a specified level of confidence (Morgan 1996). This method is very popular in investment-risk prediction, and Basel II recommended it as the main risk management tool (Rossignolo et al. 2012). However, in 2008, the global financial crisis revealed that VaR ignores liquidity risk and underestimates correlation risk. Therefore, these risks are very important to control. Tail risks are often associated with negative events with a greater impact but have a low probability of occurrence. The emergence of the extreme value theory (EVT) helped to solve the problem. Parkinson (1980) was a pioneer in the use of the EVT method in finance. EVT is a method used to assess the risk of extreme events caused by unwanted events, such as natural disasters and pandemics, which have major social and economic impacts. This method can be used to study the frequency of rare events and develop predictive models to predict the frequency of extreme events in the future, to estimate the magnitude of the risks faced (Longin 2000). In May 2012, the Basel Committee on Banking Supervision mentioned that several weaknesses have been identified from using value at risk because it is unable to capture tail risk. Since then, expected shortfall (ES) or conditional value at risk (CVaR) have been recommended for calculating market, credit, and operational risks (Tabasi et al. 2019). According to Trabelsi and Tiwari (2019), CVaR is the expected loss under the condition that it exceeds VaR.
A combination of several models shows better performance than a single model and is the main direction in forecasting (Hajirahimi and Khashei 2019). The hybrid method is an appropriate alternative to produce accurate performance when compared with the single model (Büyükşahin and Ertekin 2019). A combination of the EVT and ANN methods has been applied in various studies (Ibn Musah et al. 2018), such as aiming to investigate the risks associated with the principal stock exchange of Ghana with the combined use of EVT with artificial neural networks (ANNs). The log-return data were used in the empirical analysis. ANNs are used for forecasting when the market will rise or fall in a 5-month trading period. EVT can be used to calculate the measure of risk associated with both tails of the daily return dataset and to determine the maximum monthly return to clarify whether it is increasing or decreasing. The training was conducted to model the maximum monthly increase and decrease, as well as to ascertain market trends over the previous 5 months. The results show that the stock will rise in the 4th to 5th months, whereas in the 3rd to 4th months, it experiences losses. Using GPD with the POT method shows good agreement with the EVT above a certain threshold.
VaR can be much more accurately calculated by using EVT, such as in a study by Omari et al. (2020), implementing a dynamic method for forecasting a 1-day-ahead VaR, with combines the GARCH models and EVT to examine the extreme behavior of major economic stock indices during the period before and during the outbreak of the pandemic. Comprehensive in-sample volatility modeling was implemented with skewed Student’s-t distribution assumptions, and the information selection criteria were used to establish their goodness of fit. Furthermore, the VaR quantiles were estimated by using the conditional-EVT (C-EVT) framework to obtain out-of-sample VaR forecasting results. The combined GARCH and EVT model performed relatively well in estimating the risk for all stock indices. The back-testing results demonstrate that the E-GARCH skewed-Student’s-t and C-EVT models are the most appropriate techniques for better measuring and forecasting VaR in comparison with the conventional method.
The GARCH–EVT combination method implemented by Echaust and Just (2020) aimed to determine the predictive ability of value-at-risk estimates when each estimate is made with the optimal choice of the tails of the distribution. Here, 5 methods were applied to describe the tail, namely the distance-metric method with the mean absolute penalty function, the minimization of the AMSE estimate, the path-stability algorithm, the fixed-quantile procedure, and the automated eyeball method. The model with optimal tail selection performed relatively well in estimating the risk for all threshold choices, and the optimal tail selection method did not improve the value-at-risk prediction accuracy; using the C-EVT approach while taking the 95th percentile of the sample as the threshold could obtain an accurate estimate of the tail risk.
In investing, analyzing stocks is very important to observe the current situations and conditions. Investors can predict stock prices by analyzing stock fluctuation trends on the basis of using historical data on stock price movements. On the basis of the results of this stock price forecasting, an overview of stock returns in the future is obtained. These results are very important data for predicting investment risk. Data are crucial factors for improving forecasting accuracy. Internet data and social media are regarded as significant data sources for many public and private organizations, particularly in academia and industry for research, thanks to the sophistication of information and communication technology (Firdaniza et al. 2022). Developments in computing technology, with the emergence of new technologies and the widespread adoption of artificial intelligence techniques to make everyday tasks much more intelligent and predictable and to anticipate changes (Najem et al. 2022), have made machine-learning-based forecasting popular. Wu et al. (2021) collected considerable online oil news and used the convolutional neural network method to automatically extract and filter relevant information. The experimental results show that social media information contributes to oil price forecasting.
Melina et al. (2022) developed a short-term prediction model to predict the price of shares listed on the stock exchange based in Jakarta, Indonesia, during the pandemic, using an ANN-based machine-learning approach. The proposed model predicts stock prices with factors that influence stock fluctuations, including the COVID-19 trend indicator and the COVID-19 government response stringency index in Indonesia, as input variables. As a result, the proposed model achieved high forecast accuracy in terms of stock price prediction.
Recent research conducted by Ilyas et al. (2022) has proposed a new hybrid method, consisting of a fully modified Hodrick Prescott filter (FMHP) to improve prediction accuracy. This method consists of three main components: machine-learning-based prediction, novel features, and a noise-filtering technique. The FMHP aids in removing noise from the financial dataset and smoothing it out. Sentiment features based on Twitter data and stock price characteristics are examples of novel features. The machine-learning algorithms used in the study include random forests, ARIMA, recurrent neural networks, and support vector regression algorithms. Several new features are embedded for predicting stock prices, such as the return open price, return of firm, return close price, changes in return close price, changes in return open price, and volume per total. Sentiment scores, sentiment features, and preprocessed Twitter data are all fed into the training model. To produce precise forecasts for the closing price of the stock, the model learns from the supplied data. The hybrid FMHP model improves its prediction accuracy to 70.88%, the error rate to 0.1, and the root-mean-square error (RMSE) to 0.04.
This description shows that research on investment-risk prediction in the stock market that uses the EVT method uses one input variable, namely daily stock returns. This model is static because it does not consider other variables that arise from extraordinary events that cause fluctuations in the stock market. The novelty of this research is the proposed conceptual model for predicting investment risk in the stock market using an EVT approach based on machine learning, which is dynamic and sensitive to extreme fluctuations. This model was developed with multivariable inputs. Factors that affect stock fluctuations and variables that arise from extraordinary events need to be considered when building a model. The combination of VaR–EVT and machine-learning methods is effective for increasing model accuracy because it combines linear and nonlinear models. We conclude that modeling investment-risk predictions on the stock market with an EVT approach, based on machine learning, is necessary for the development of investment-risk models on the stock market in the future. This model can read heavy tail patterns in the distribution of data; therefore, it can detect extreme values. This model can also study the relationship patterns of nonlinear variables that affect stock price fluctuations when extraordinary events occur and then create turmoil in the stock market. This model has the potential to produce accurate results. It is dynamic and sensitive to extreme fluctuations because it considers extreme variables that arise from extraordinary events, making stock market input data volatile.
This research is very useful for investors in the stock market, policymakers, governments, banks, academics, research institutions, and researchers. It is hoped that a conceptual model for predicting investment risk, one that is dynamic and sensitive to extreme fluctuations, will minimize the prediction error of investment risk in the stock market because it will consider the variables that arise as a result of extraordinary events, such as the COVID-19 pandemic, or other pandemics that will occur in the future, so that the collapse of the financial sector does not happen again.

2. Results

In this section, we will present an analysis of the results obtained on the basis of the plan represented by the previously defined research questions. The series of activities carried out displays the results of the study selection, selection by quality assessment, bibliometric analysis, and analysis of general characteristics of the literature. In addition, the results of a review of the bibliographical information, publications, citations by year, articles by the number of citations, journals by the number of citations, keywords, stock markets covered, methodologies, and properties will be presented.

2.1. Planning

Planning when conducting S-SLR is very important when performing a baseline study and when reducing publication bias in this study. The scope of this S-SLR was determined on the basis of the objectives represented by the research questions. We concentrated on and limited ourselves to articles on the topic of the hybrid method including VaR and CVaR while taking the EVT approach. The fundamental question is, what is the purpose of this study? This study benefited from an S-SLR on the use of the EVT method to estimate investment risk in the stock market, as a study basis and reference for developing a conceptual model for predicting investment risk in the stock market that is dynamic and sensitive to extreme fluctuations. Table 1 presents some research questions (QR) from this study.
The answers to QR1 are described above; answers to QR2–QR3 are presented in Section 2.5; and the solution to QR4 is presented in the Section 4.

2.2. Searching the Literature

The initial step of searching the literature is to define eligibility on the basis of the inclusion criteria (IC) and the exclusion criteria (EC). Table 2 presents the IC and EC of this study.
The search strategy was carried out by using keywords that matched the topic of this study, namely (“forecasting” OR “prediction” OR “predicting”) AND (“VaR” OR “CVaR” OR “risk”) AND (“stock market”) AND (“extreme value theory” OR “EVT”). By using these keywords, it was hoped that studies using the VaR–CVaR hybrid method, the EVT approach, and those focusing on the stock market would be filtered.

2.3. Study Selection

The study selection was carried out by applying PRISMA guidelines, as visualized with the PRISMA flowchart (Liberati et al. 2009). In this study, the selected literature had to meet the quality assessment (QA) criteria, which are presented in Table 3.
A literature search was performed using the Publish or Perish 8 software for the Scopus database sources, using search tools for peer-reviewed journal articles on www.sciencedirect.com (accessed on 31 January 2023) for sources in the ScienceDirect database, and using search tools on www.proquest.com (accessed on 31 January 2023) for the ProQuest database source. Table 4 presents the process of searching the literature on the basis of using keywords.
According to the IC presented in Table 2, it was found that the literature did not meet the IC2 criteria; thus, 13 articles were deleted from the SD sources, and 361 articles were deleted from the PQ sources, leaving 364 from the three databases. Next, two articles were deleted because of duplication, leaving 362 articles. Deletion was also performed if the title and abstract were deemed not relevant to the topic. At this stage, 264 articles had been deleted, leaving 98 articles. Further selection was conducted by reading the contents of the articles. By following the QA presented in Table 2, 85 articles were removed because they did not meet QA1, QA2, or QA3. Table 5 presents the studies that were selected on the basis of using the QA.
The result retained 13 selected articles, which were then used for the S-SLR. The selected literature was compressed and compiled in a .ris file, a file type that is supported by a number of reference managers. This format file can be used as an input file in VOSviewer software. Figure 2 presents the stages of applying PRISMA in the search process and strategies for obtaining relevant studies.

2.4. Bibliometric Analysis

In this study, a bibliometric analysis was performed on the basis of using visual bibliometric networks, produced by VOSviewer software. Visual bibliometric networks are derived to determine the relationship between data and words contained in the selected literature; next, the results are processed to observe topic mapping in the literature (Kalfin et al. 2022). Figure 2 shows a network visualization of 13 studies. In this network visualization, the words contained in the literature are items. Items are represented by circles and labels. The sizes of the labels and circles are determined by the weight of the item: the higher the weight of the item, the more often the word is talked about and the bigger the label and circle. The connecting lines between items represent link associations. Moreover, the higher number of connecting lines, i.e., the more connecting lines that fit into the circle of words, the more connections between words in the circle and other words. In general, the closer two items are to each other, the stronger the association. Clusters are distinguished by color. Word circles with the same color mean they belong to the same cluster. Generally, the distance between items in one cluster is very close. A visualization of the bibliometric networks is shown in Figure 3.
Figure 3 shows a visualization of the bibliometric network, divided into three clusters. Cluster 1 is red, cluster 2 is green, and cluster 3 is blue. In cluster 1, the items of model, value, risk, approach, VaR, generalized Pareto distribution, return, daily return, and high-frequency data have strong relationships because they are in the same cluster. This cluster shows the existence of a word circle that refers to the approach used in the investment prediction model on the stock market, namely the word circle “generalized Pareto distribution”. These words indicate that the most widely used method is the POT method, which is based on the generalized Pareto distribution, rather than on the block maxima method, to identify extreme values. In the GPD method, the extreme value is that which exceeds the threshold. Generally, this model uses daily return data as the input. In this cluster, risk and return items are also dominant. This clarifies that investment always contains elements of risk and return. The goal of investors is to achieve the maximum profit while accounting for the elements of risk and return; therefore, the higher the expected return, the higher the risk that will be borne.
In cluster 2, extreme value theory and study are very dominant items. In this cluster, there are also the items of GARCH, accuracy, back testing, the stock market index, and performance. This cluster explains that the hybrid VaR model with the extreme value theory and GARCH approaches is very dominant in this study. The back-testing method is used for model validation.
In cluster 3, stock market and estimation are the dominant items, as seen from the size of each circle. In this cluster, there are also item analyses, data, shortfalls, and predictions. The dominance of stock market items and items contained in this cluster illustrates that the selection process from the literature has been carried out in accordance with this study, namely the analysis, prediction, and estimation of investment risk in the stock market. Figure 4 shows the relationship between extreme value theory and other items.
Figure 4 shows that extreme value theory items have a strong relationship with VaR items, as well as a direct relationship with daily returns, but no relationship with high-frequency-data items. This relation illustrates that VaR calculations can be performed with high-frequency data. However, there are very few cases of using high-frequency data in the EVT method because high-frequency data include multivariate cases. A bridging method is needed so that the EVT approach can accommodate high-frequency data as an input model for estimating investment risk. This image illustrates the investment-risk-prediction model with the EVT approach, generally using only one data input, namely daily returns. This model works well in univariate cases and has weaknesses in multivariate cases. These findings can be used as basic reference points for developing future models.

2.5. General Characteristic of the Literature

At this stage, we describe and analyze the general characteristics of the literature on the basis of publications, citations, publications by journals, keywords, and others.

2.5.1. Publications and Citations by Year

Figure 5 shows the number of article publications and citations by year, from 2019 to 2022.
Figure 5 shows the number of article publications and citations from 2019 to 2022. In 2019, three articles were published; in 2020, six articles were published; in 2021, three articles were published; and in 2022, one article was published. Figure 4 also shows the total number of citations per year. In 2019, two articles yielded 45 citations. This is the highest number of citations obtained for articles published during the COVID-19 pandemic. In 2020, six articles yielded 29 citations; in 2021, they yielded 8 citations; and in 2022, they yielded 4 citations. This illustrates that research on investment-risk predictions in the stock market using the VaR or CVaR method with the EVT approach has very rarely been carried out.

2.5.2. Citations

Table 6 presents the cited articles and information on each journal that published each article.
Table 6 shows the most cited articles. The most cited article was that written by Karmakar and Paul (2019), published in the International Journal of Forecasting, which obtained 32 citations. The second-most-cited article was that written by Tabasi et al. (2019), published in Administrative Sciences, cited 11 times. The third-most-cited article was that written by Sobreira and Louro (2020), published in Finance Research Letters, cited eight times. The fourth-most-cited article was that written by Ji et al. (2020), published in the Journal of Empirical Finance, cited seven times. The fifth-most-cited article was that written by Bień-Barkowska (2020), published in the journal Entropy, cited seven times. The sixth-most-cited article was that written by Song et al. (2021), published in Journal of Asian Economics, cited five times. Furthermore, the article was that was written by Chebbi and Hedhli (2022), published in the quarterly review of economics and finance, was cited four times. Finally, the thirteenth-most-cited article was that written by Ghourabi et al. (2021), published in the International Journal of Finance and Economics, cited one time. The number of citations illustrates that research on this topic is still scant and that more research is needed.

2.5.3. Journals

Table 7 presents the most influential journals in this study. The data and information were sourced from www.scimagojr.com (accessed on 2 February 2023). The table is sorted by the most citations.
Table 7 shows all the studies sourced from reputable journals. In total, four articles were sourced from Q1 journals, and nine articles were sourced from Q2 journals. This illustrates that the literature in this study was of high quality and scientific because it all came from reputable journals. This fact also explains that research on the analysis and prediction of the level of investment risk in the capital market is a very important topic for scientific developments, especially risk management.

2.5.4. Keywords

In research articles, the list of keywords contains the most important words, making the article searchable for other researchers. In addition, keywords are needed for bibliometric analyses. Figure 6 shows the 10 most commonly used keywords in the selected literature.
Figure 6 shows as many as 65 keywords used in all studies. Value at risk is the most frequently used keyword, used in 12% of studies; the second-most-frequently-used keyword was extreme value theory, used in 9% of studies; and the third-most-frequently-used keywords were back testing and expected shortfall, used in 5% of the studies. These keywords indicate that the selected literature adhered to the topic of this study.

2.5.5. Stock Markets Covered

Figure 7 shows the stock market, which was used as a source of research data in the literature. Figure 7 shows the stock markets covered as a data source. The S&P 500 is the most widely used research source: four articles used S&P 500 data; three articles used the CAC 40 and FTSE 100; and two articles used China Securities Index 300, DAX 30, S&P CNX Nifty Index, and SSE Composite Index. Figure 8 shows the country location of the stock market, which are research data extracted from the literature.
Figure 8 shows that the US stock market is the most commonly investigated: six times in total. The second-most-frequently-investigated is the Chinese stock market, used in five studies. The France stock market and the Indian stock market were each investigated three times. Furthermore, the Germany stock market was studied twice. Figure 7 and Figure 8 indicate that related data sources in the literature represent stock markets from developed and developing countries.

2.5.6. Methodology

Table 8 presents the methodology used in this study to model investment-risk predictions with the EVT approach.
Table 8 shows a summary of the proposed model for modeling investment-risk estimation, which showed better performance than that of competing models.

3. Materials and Methods

3.1. Materials

The materials in this study were research articles that used the VaR–CVaR hybrid model with the EVT approach for analysis, prediction, and measuring the level of investment risk in the stock market. The data were pulled from articles published during the COVID-19 pandemic, i.e., from 2019 to 2022. The literature was sourced from the online databases Scopus (S), ScienceDirect (SD), and ProQuest (PQ). The search process was carried out in January 2023.
VaR is used because it is a popular method for measuring risk in estimating the maximum possible expected loss over a certain period and at a certain level of confidence from the normal curve concept (Hidayana et al. 2022). CVaR is used because it is an alternative to VaR. Another percentile risk-assessment metric is this one. (Ullah et al. 2022). EVT is used because the measuring tail risk method can be applied to VaR forecasting (Karmakar and Shukla 2015). The S, SD, and PQ database sources were chosen because they are online databases where each has a large repository for academics and are popular and reliable article search engines.

3.2. Methods

This study is a semisystematic literature review (S-SLR) with a hybrid of VaR, CvaR, and the EVT method in the analysis and estimation of investment risk in the stock market, which can identify and assess gaps in the literature with scientific evidence to provide a framework/background for developing a conceptual model for predicting investment risk in the dynamic stock market while being sensitive to extreme fluctuations. The stages in an S-SLR are divided into three main phases: planning, conducting, and analyzing and reporting (Kitchenham and Charters 2007).
The S-SLR planning stage begins with determining the objectives of this study and then determining the research questions to ensure that the review is focused. This stage also determines the need for researchers to summarize all available information about the topic being studied to identify gaps in previous research.
The stages associated with conducting the review are identifying research and selecting the main studies. Research identification generates a search strategy and selects the initial articles on the basis of defined keywords, aiming to detect as many relevant studies as possible. The selection process was carried out by using PRISMA guidelines that are based on inclusion and exclusion criteria. An assessment of the quality of the studies was carried out to provide more-detailed inclusion/exclusion criteria and minimize publication bias.
Analyzing and reporting the review consist of the following stages:
  • Interpret all available research to provide specific answers to the research questions developed at the planning stage.
  • Perform a bibliometric analysis by using the VOSviewer application. The bibliometric analysis is carried out on the selected studies to determine the relationships between words contained in the article; next, the results were processed to identify shifts in topics in the article (Sukono et al. 2022).
  • Analyze the general characteristics of the literature and examine the mathematical model to predict investment risk in the stock market in reference to the methods and models used in the development of the conceptual model.
  • Determine gaps in the literature from models and methods to predict investment risks in the stock market by using EVT. The goal is to identify gaps to fill, which will assist in developing future models.
  • Report the review, propose a conceptual model, and provide directions for future studies.

4. Discussion

In this section, we will review and analyze the literature, gaps in the existing literature, and conceptual models for predicting investment risks in the stock market, which is dynamic and sensitive to extreme fluctuations.

4.1. Literature Analysis

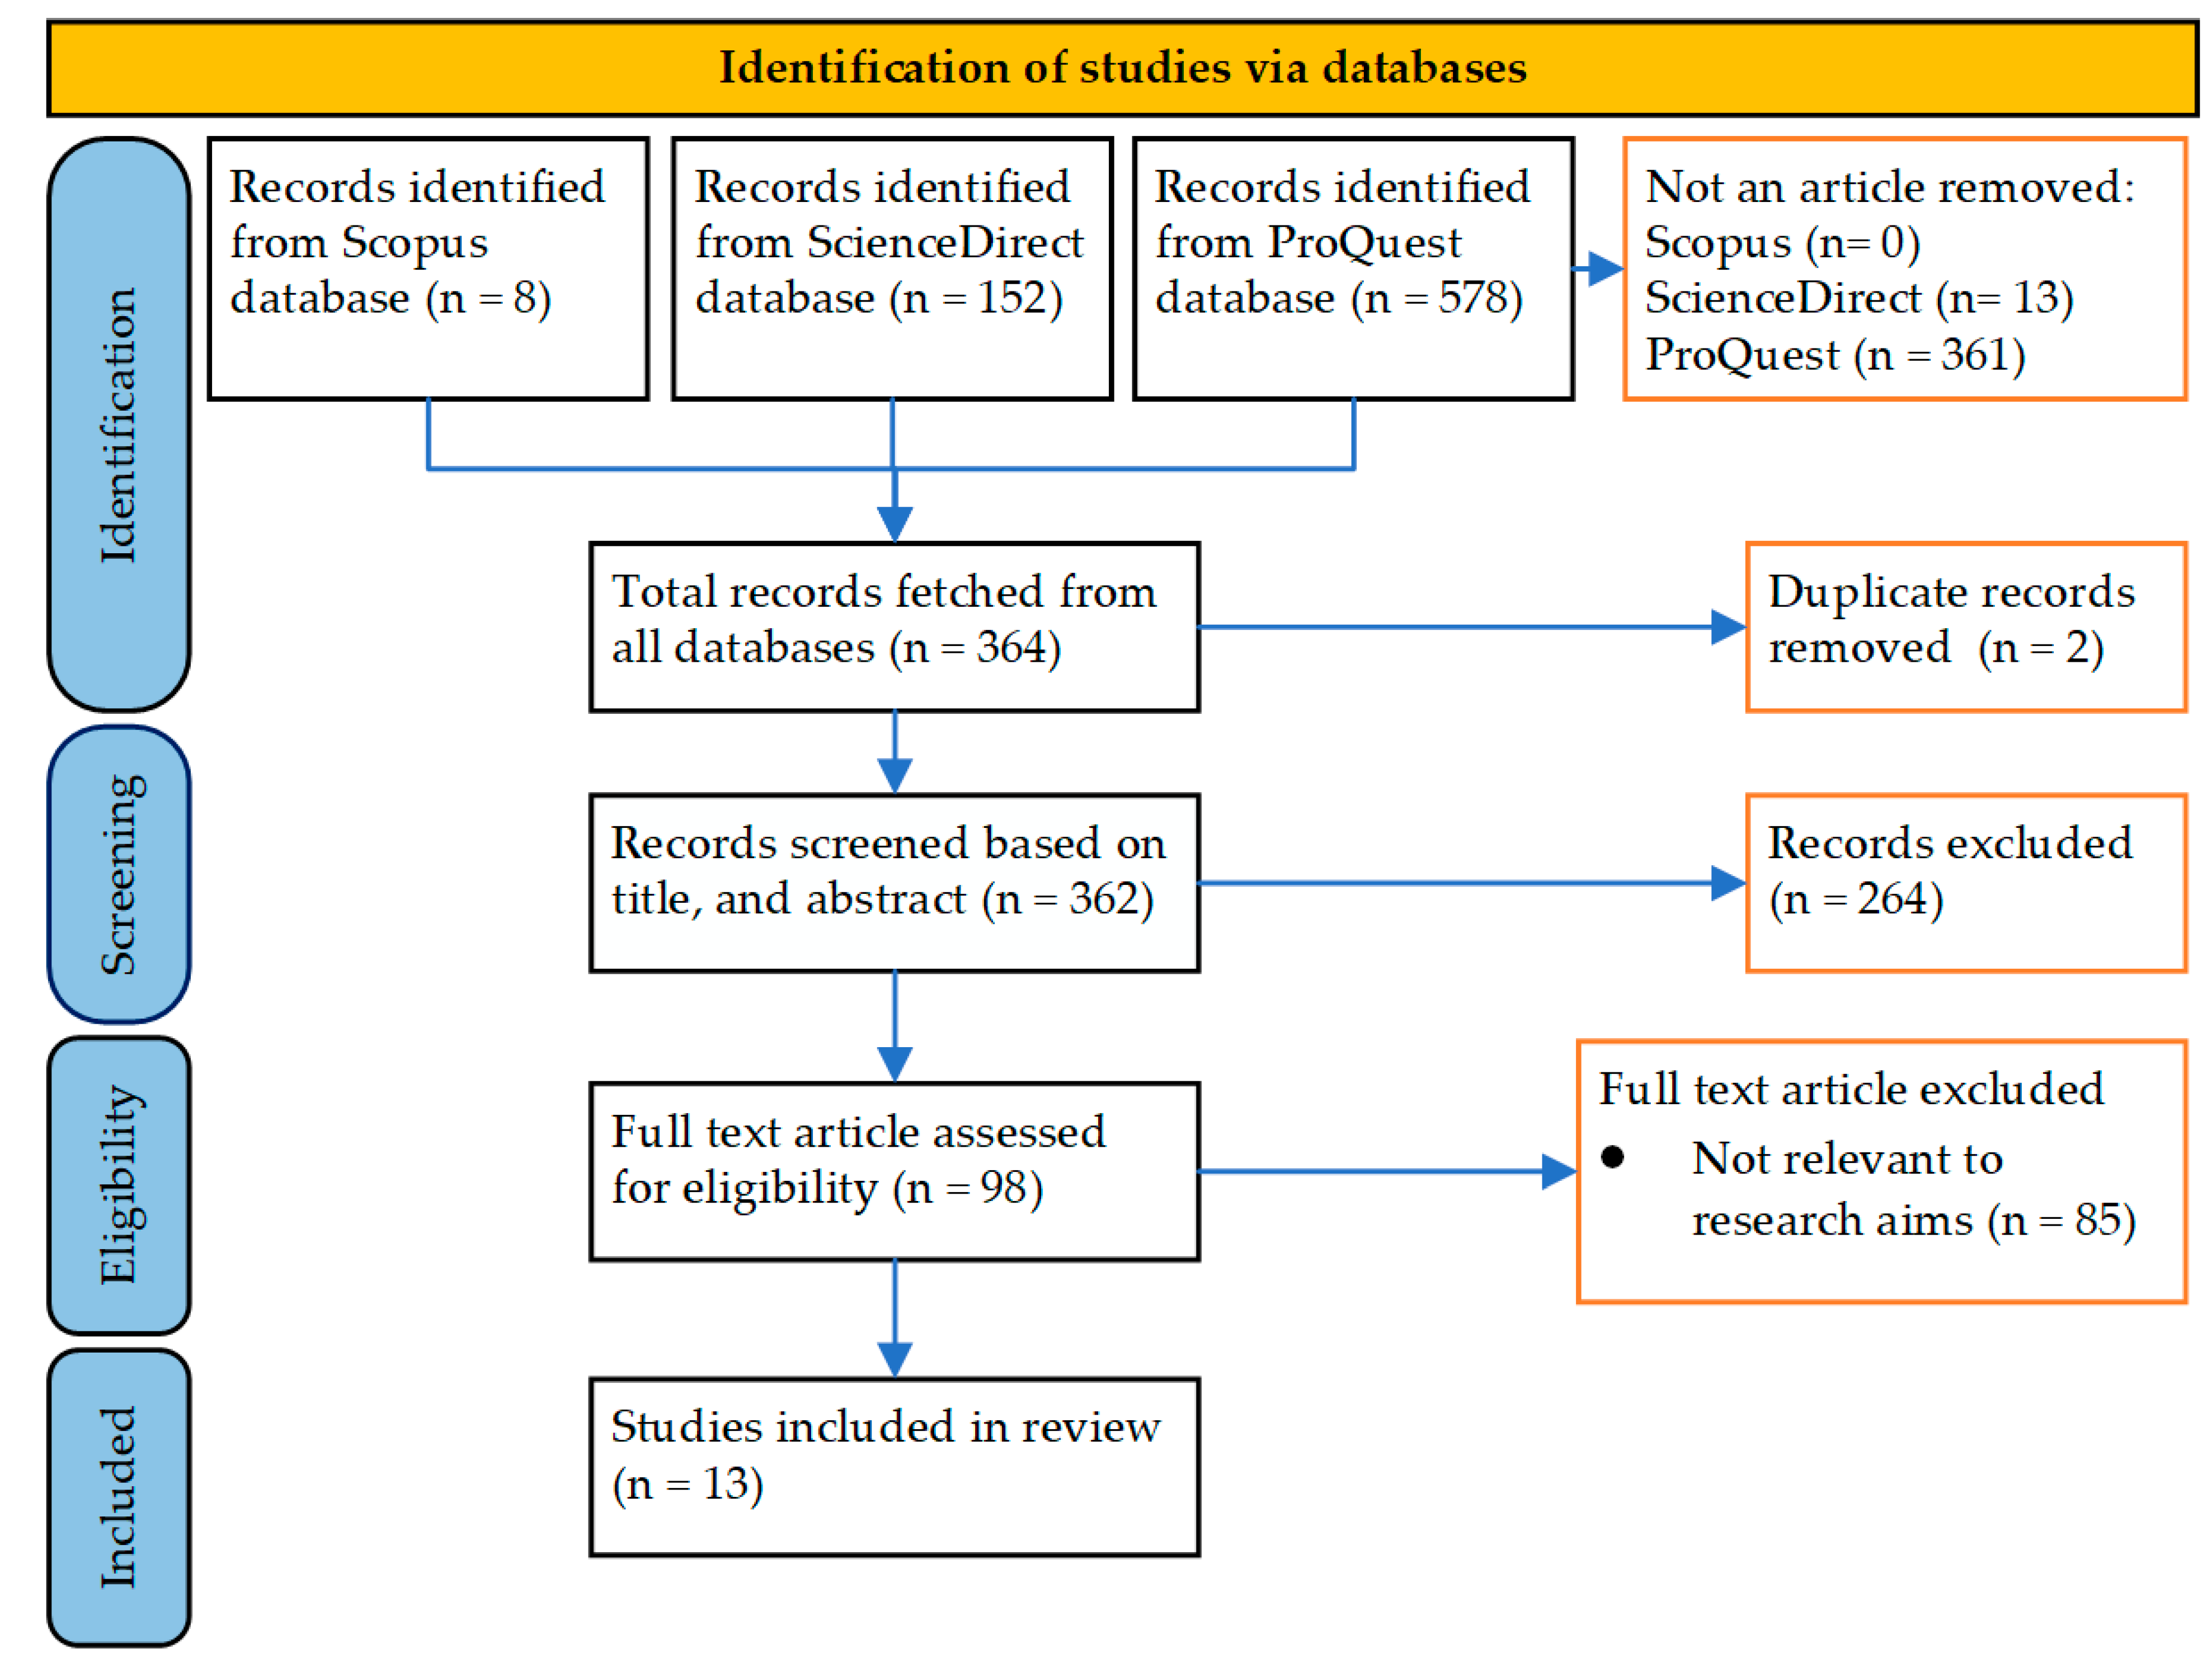
Predicting the level of investment risk in the stock market is an interesting challenge. Moreover, the pandemic caused turmoil and disruption in the economic sector, especially the stock market. However, research on this topic is scant; only 13 studies were selected and used in this S-SLR. The VaR method was used to estimate investment risk here. However, in reality, data related to the financial sector often contain extreme values; to overcome this, an EVT approach is needed. In identifying and detecting movements in extreme values, two methods can be used, namely block maxima (BM) and peaks over threshold (POT) (Chen and Yu 2020).
The BM method identifies extreme values through the maximum value of data observations entered into a particular block or period. This approach produces only one extreme value in each block. Generalized extreme value (GEV) parameter estimation uses the maximum likelihood estimation (MLE) method when the closed form is produced by the parameter’s maximum value of the likelihood function, and it can be solved by using Newton’s technique. The goal is to obtain the location parameter (μ), the scale parameter (σ), and the shape parameter (ξ). According to Chebbi and Hedhli (2022), this method is inefficient because it identifies only one extreme value and ignores other extreme values; this method focuses only on events with a larger magnitude. The BM method largely removes data because only one extreme value from each block is used; thus, in practice, it is increasingly being replaced by methods based on peaks over threshold (POT), where all the data representing extreme values are used.
One well-known EVT model is the POT, which assumes that extreme risks are independently and identically distributed from the generalized Pareto distribution (GPD) (Ji et al. 2020). The POT method is preferred over the BM method (Song et al. 2021). This can be seen from the literature used in this study, in which the POT method was used to identify extreme values. The POT method is generally used because of its efficiency when data on extreme events are limited (Chen and Yu 2020). According to Ji et al. (2019), the GPD assumes a flexible structure by changing the shape parameter to accommodate various tail behaviors in the general framework of the EVT. Research by Bień-Barkowska (2020) concluded that the POT method is more efficient for practical applications because it uses all large realizations of variables, provided that they exceed a sufficiently high threshold.
The POT method is one way of identifying extreme data behavior patterns by determining the extreme threshold value. Data that exceed the threshold are extreme values (Saputra et al. 2022). The threshold value ( u ) is determined as optimally as possible, resulting in a minimum error rate. Let X 1 , X 2 , X 3 , , X n be a sequence of independent and identically distributed random variables, with a common distribution function, F . The POT model approach focuses on estimating the distribution function, F u , of values of X above a high u . The distribution of excesses over a high u is defined as follows:
F u y = P X u y X > u = F u + y F ( u ) 1 F ( u ) = F x F ( u ) 1 F ( u )
for 0 y < x 0 u , where x 0 is the right endpoint of F .
As shown by Balkema and Haan (1974) and Pickands (1975), for a large class of underlying distribution functions, F , the conditional excess distribution function, F u ( y ) , for a large u is accurately approximated by F u ( y )   G ξ , σ y , as u :
l i m u o s u p 0 y < x 0 u F u y G ξ , σ ( y ) = 0
where G ξ , σ ( y ) is the GPD given by Singvejsakul et al. (2021).
G ξ , σ ( y ) = 1 ( 1 + ξ y σ ) 1 ξ , i f   ξ 0 1 exp ( y σ ) , i f   ξ = 0 ,
where σ > 0 , y 0 for ξ > 0 and 0 y 1 ξ when ξ < 0 . Parameter σ is a scale parameter, and ξ is a shape parameter. If ξ > 0 , then G ξ , σ ( y ) is a reparametrized version of the classical GPD. If ξ = 0 , then G ξ , σ ( y ) is an exponential distribution, and if ξ < 0 , then G ξ , σ ( y ) is known as a Pareto type-II distribution. GPD parameter estimation uses the MLE method to obtain the scale parameter ( σ ) and shape parameters ( ξ ) (Chebbi and Hedhli 2022).
When letting x = u + y , an approximation of F ( x ) , for x > u , can be obtained from Equation (1), as follows:
F x = 1 F u G ξ , σ y x u + F u , x > u
The function F ( u ) can be estimated nonparametrically by using the empirical distribution function as an estimate of the cumulative distribution function (Omari et al. 2020):
F u = n N u n
where n is the total number of observations and N u is the number of observations that exceed the threshold. By substituting Equation (3) and Equation (5) into Equation (4), an estimate for F ( x ) can be obtained as follows:
F ^ x = 1 N u n 1 + ξ ^ x u σ ^ 1 ξ
The high quantile estimator, or the VaR, for α F ^ ( u ) can be obtained from inverting Equation (6), as follows:
α = 1 N u n 1 + ξ ^ q α F u σ ^ 1 ξ ^
1 + ξ ^ q α F u σ ^ 1 ξ ^ = n N u ( 1 α )
ξ ^ q α F u σ ^ = n N u ( 1 α ) ξ ^ 1
q α F u α ^ ξ ^ n N u ( 1 α ) ξ ^ 1
V a R ^ α = q α F = u + σ ^ ξ ^ n N u ( 1 α ) ξ ^ 1
where α is the confidence level of VaR, N u is the observations that exceed the threshold, n is the number of observations, σ ^ is the scale parameter, and ξ ^ is the shape parameter.
The conditional expected loss under the assumption that it surpasses VaR is referred to as CVaR. Contrary to VaR, CVaR always returns a bigger magnitude for risk because it measures the average loss in the very tail of the distribution. VaR can be derived as follows (Long et al. 2020):
C V a R α X : = E X | X V a R α ( X )
The combination of EVT with other models yields better forecasting accuracy, as shown in research conducted by Chaiboonsri and Wannapan (2021), which aimed to methodically devise a quantum-wave distribution (QWD) to better analyze risks and returns for stock markets in ASEAN countries, especially in extreme value predictions of VaR and ES, as based on quantum mechanics (QM). The scope of the research process starts from observation and screening data; next, the raw data are modified by a Gaussian–random-walk distributional set and QWD. Afterward, two values are inserted into the function of the GPD extreme value analysis. By setting the prior density for parameters at the Bayesian estimation u , heavy loss tails are clarified and evaluated. Bayesian simulations and statistics are applied to the present estimation outputs. Bayesian inference for calculating risks and the ES predictions are both compatible with the distribution produced by the QM carried out in the wave equation. Quantum distributions are empirically notable for generating genuine distributions, and they may be able to close the information gap in data analyses. Ghourabi et al. (2021) conducted research that aimed to evaluate the estimation ability of the generalized autoregressive score model to calculate risk scores by applying EVT. The generalized autoregressive score section is responsible for capturing the dynamics of transient volatility. EVT provides a model of extreme tail behavior. This method produces much-more-accurate VaR predictions. In research performed by Chen and Yu (2020), the authors proposed an asymmetric power autoregressive conditional heteroscedasticity model with the generalized Pareto distribution, aiming to determine the optimal margin level. Estimations of VaR were measured by using Equation (11). The residual tail distribution of the APARCH model was estimated by using the generalized Pareto distribution, based on EVT, by using Equation (3). The result was that the proposed model offered better 1-day forecasts than the other models did. Research by Ji et al. (2020) introduced a general framework of a SEPP with a truncated the generalized Pareto distribution to measure extreme risk in the stock market below price limits. Similar to GARCH modeling, where the variance is a function of past shocks and where the variance in the sign distribution depends on previous events through intensity, the flexible, truncated, generalized Pareto distribution works to accommodate price constraints. The measurement results showed that the proposed process can accurately explain the empirical data. Research conducted by Ji et al. (
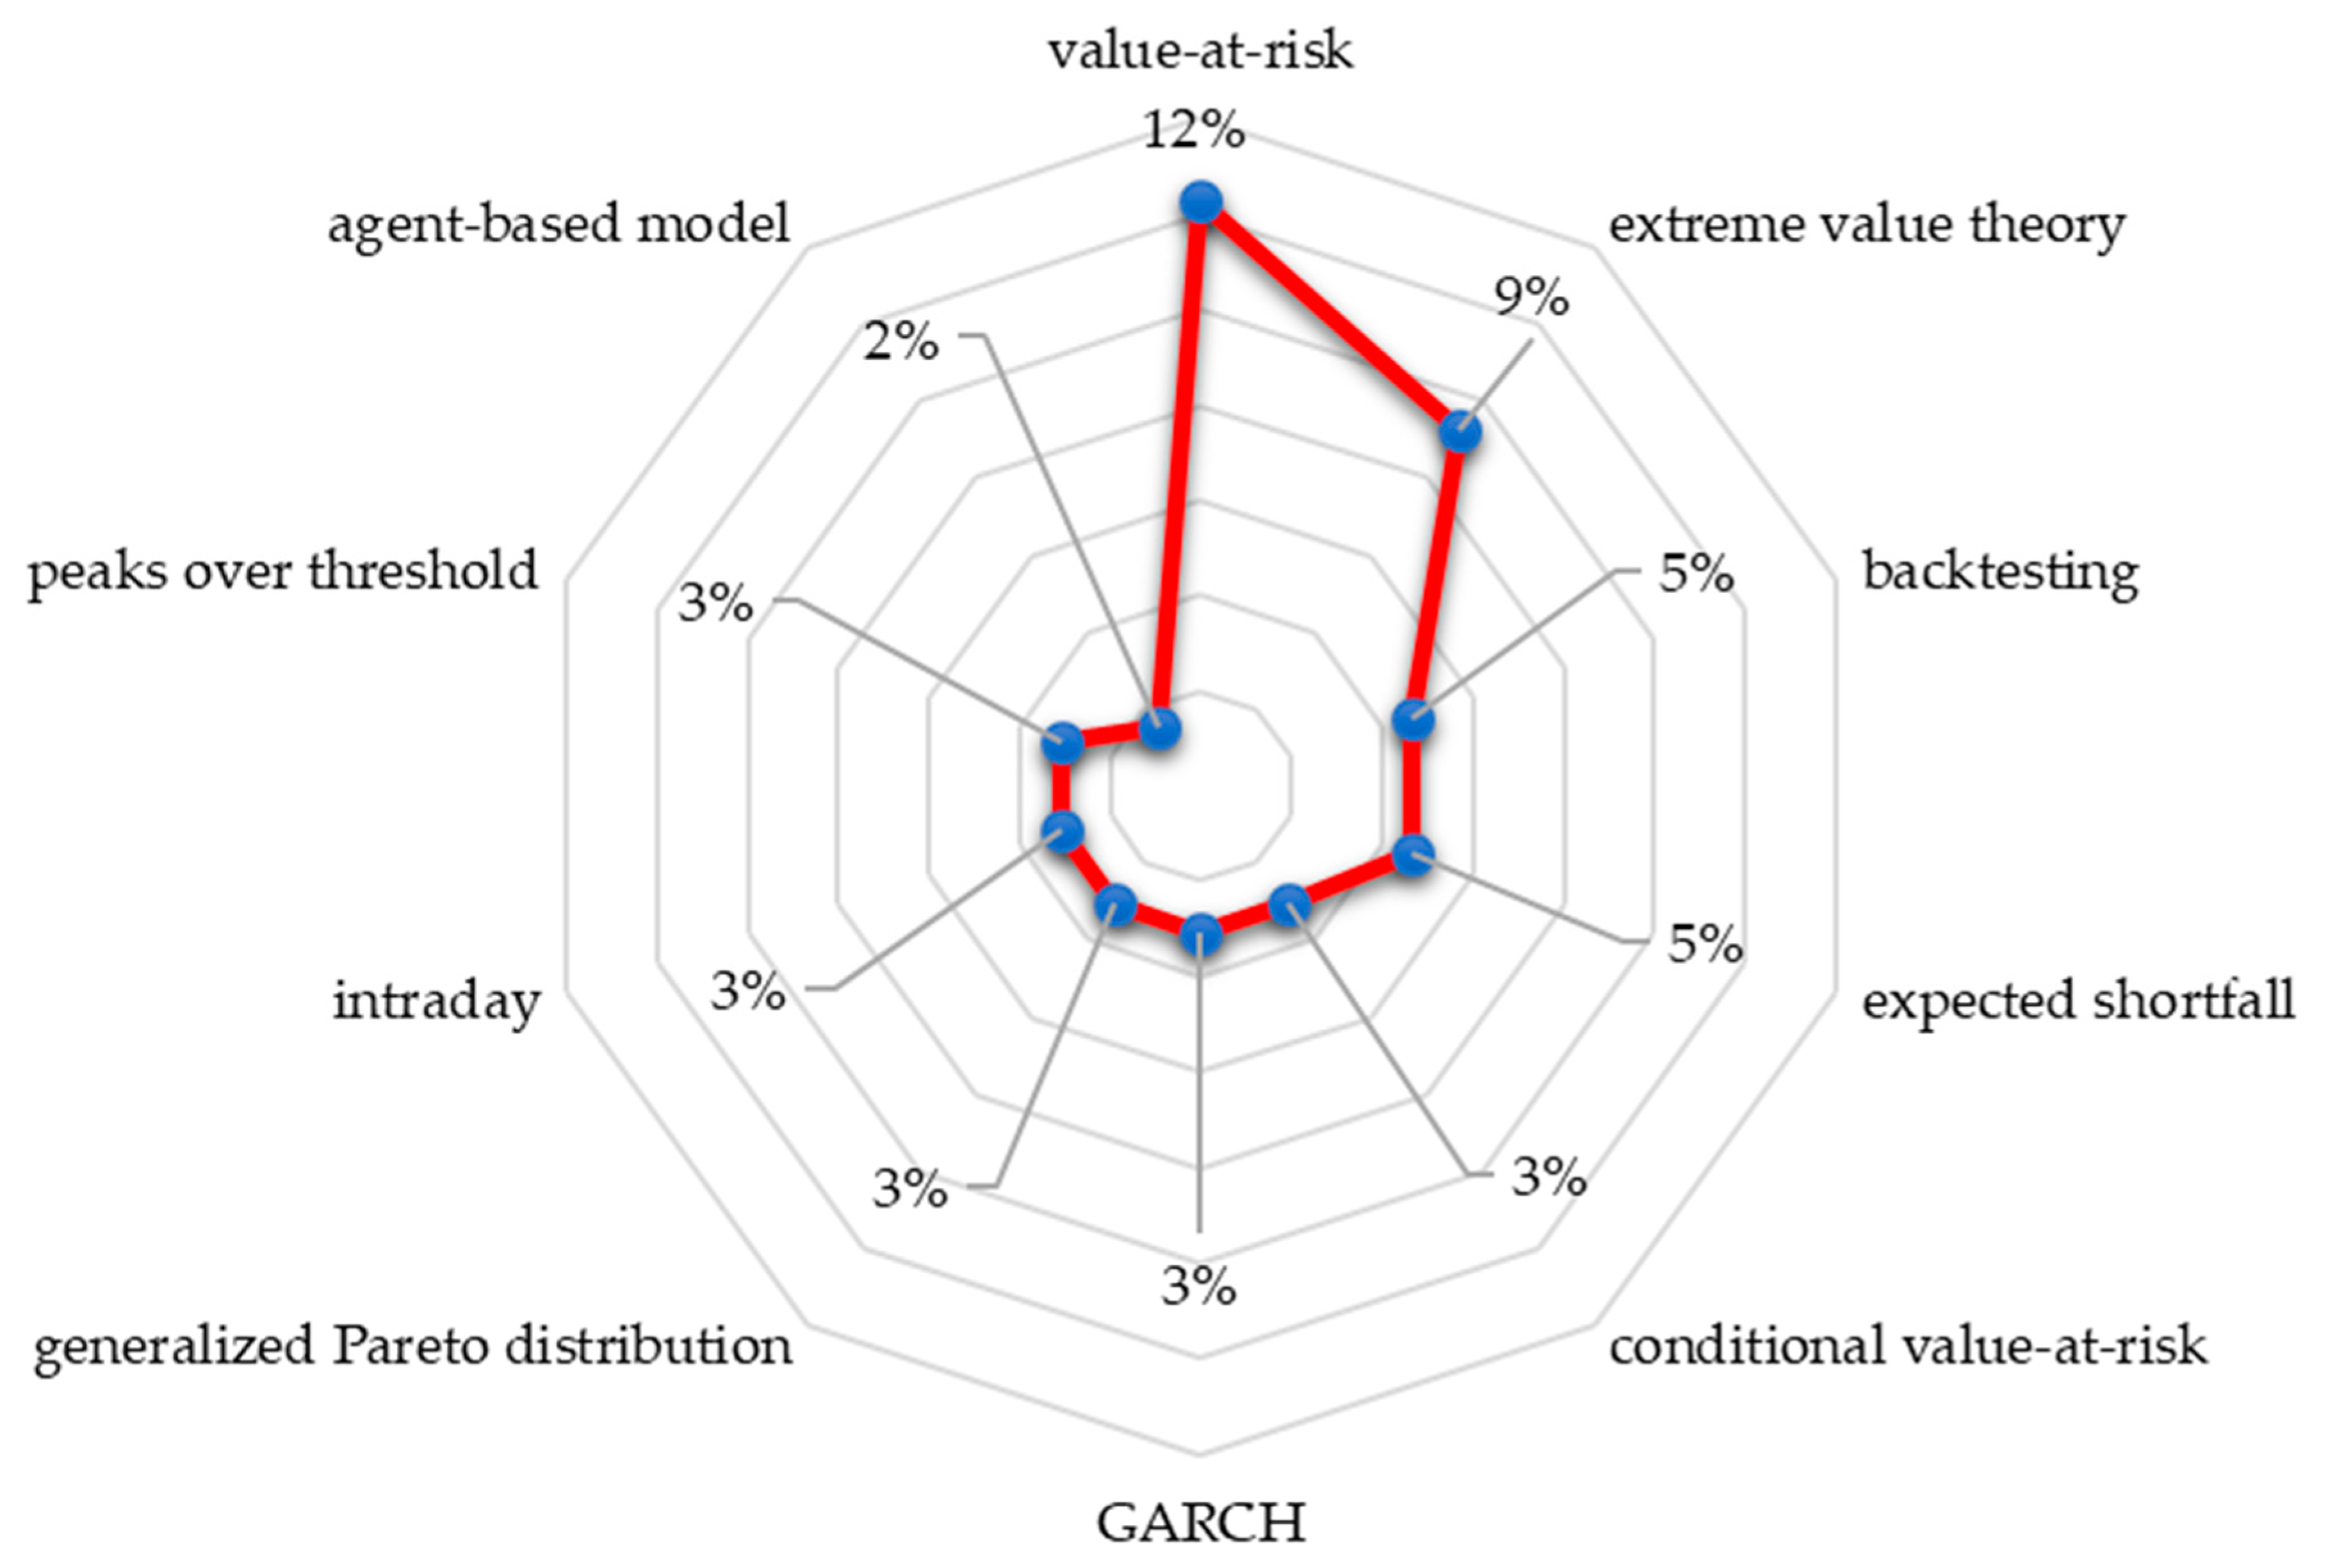
2019) focused on investigating the extreme risk of returning financial assets by using the agent-based model. The spread of extreme risk is caused by two important mechanisms that contribute to fact style, namely panic aggregation and market fraction movements. Extreme risks above a certain threshold can be independent and identically distributed by the generalized Pareto distribution by using Equation (3). A Monte Carlo simulation was performed for the VaR estimation. The results showed that the proposed model had good performance in predicting VaR. Tabasi et al. (2019) conducted research to calculate market risk in Iran’s largest stock exchange, by estimating the CVaR. This research applied the GARCH model, in combination with the POT model, assuming t-distributions or normal for the RV. The GARCH procedure described the random variable’s volatility, and then used the EVT, to model the residuals. After the estimation of the VaR and the ES, the validity of these estimations needed to be investigated by the back-testing models. The results of the study showed that utilizing the POT model had a positive impact on the models and on the estimation of risk in the financial market.
Predicting VaR by taking only the EVT approach identifies the limitations of this model in predicting dynamic VaR. The GARCH approach allows the model to dynamically capture the volatility characteristics of financial time series. Predicting the VaR of financial markets by accounting for the volatility in the extreme value approach is predominant in the literature. A good model uses several combinations with complementary goals, such as the research by Karmakar and Paul (2019), employing the CGARCH–EVT-Copula model to predict intraday VaR and ES or CVaR portfolios by using high-frequency data. EVT focuses directly on the tails and could therefore yield better estimates and forecasts of risk. EVT is not independently and identically distributed, and the GARCH model is used to fit the return series. The GARCH–EVT model is used to draw the marginal distributions, and the multivariate dependence structure between markets is modeled by a parametric family of extreme value copulas that are perfectly suitable for non-normal distributions and nonlinear dependence. The combined GARCH–EVT-Copula model becomes the natural choice for estimating the portfolio of VaR, as well as that of ES or CVaR.
A POT approach using Equation (3) managed to catch the extreme values and was successful during the research. VaR was estimated by using Equation (11). Back-testing evidence showed that the employed model showed relatively better performance than the other models. A study by Banerjee and Paul (2020) explored the MCS-GARCH model’s forecasting intraday VaR and ES for both developed and emerging markets.
This study proposes the MCS-GARCH model for superior volatility estimation because it expresses the intraday conditional variance in prices as a product of three components: the daily variance component, the intraday variance component, and the diurnal variance pattern. The results show that the combined conditional-EVT model performs much better than the standalone GARCH model.
In research conducted by Miloš (2020), procedures were developed to assess tail risk portfolios on the basis of using EVT, without the need to use multivariate constraining relationships. This study overcame the main drawback of EVT against multivariate cases by combining the simplicity of univariate EVT and orthogonal generalized autoregressive conditional heteroskedasticity while capturing tail correlations and extreme comovements. Research conducted by Song et al. (2021) proposed an intraday-return-based VaR dynamic conditional score with a GPD sensor based on high-frequency data, such as intraday returns, contributing to the estimation of the tail risk of daily returns. This model added several types of realized volatility to the peaks-over-threshold model to better estimate daily returns. This model performed better at estimating the risk of extreme tail returns, as evidenced by several back-testing methods.
Highlights of the results are as follows:
  • All the above studies used one input variable in the model, namely daily returns.
  • All the studies in the literature used the POT method, based on GPD.
  • Predicting VaR using only the EVT approach identified the limitations of this model in predicting dynamic VaR.
  • The above research illustrates that the EVT approach is better if it uses a hybrid method and works well in univariate cases or when using one input variable.
  • The EVT method shows difficulties in multivariate cases.

4.2. Gaps in the Existing Literature

The results of this study indicate an interesting area to study. Input variables are very important parts of a model. In general, the investment-risk-prediction model with the EVT approach uses only one input data variable, namely daily stock data. This model is rigid and static (Ibn Musah et al. 2018). As in the research conducted by Karmakar and Paul (2019), if an explosion or crisis is encountered in the future, the possibility of a fat tail error is unlimited, which illustrates that the VaR model with the EVT approach is static and insensitive to extreme changes. This model works in the univariate case; there is no definite way to apply it in the multivariate case. This is in line with research conducted by Miloš (2020), and although EVT is a natural choice for modeling tail risk, its main drawback is the complexity of expanding multivariate cases (Miloš 2020). This illustrates that this method will experience difficulties when dealing with multivariate cases.
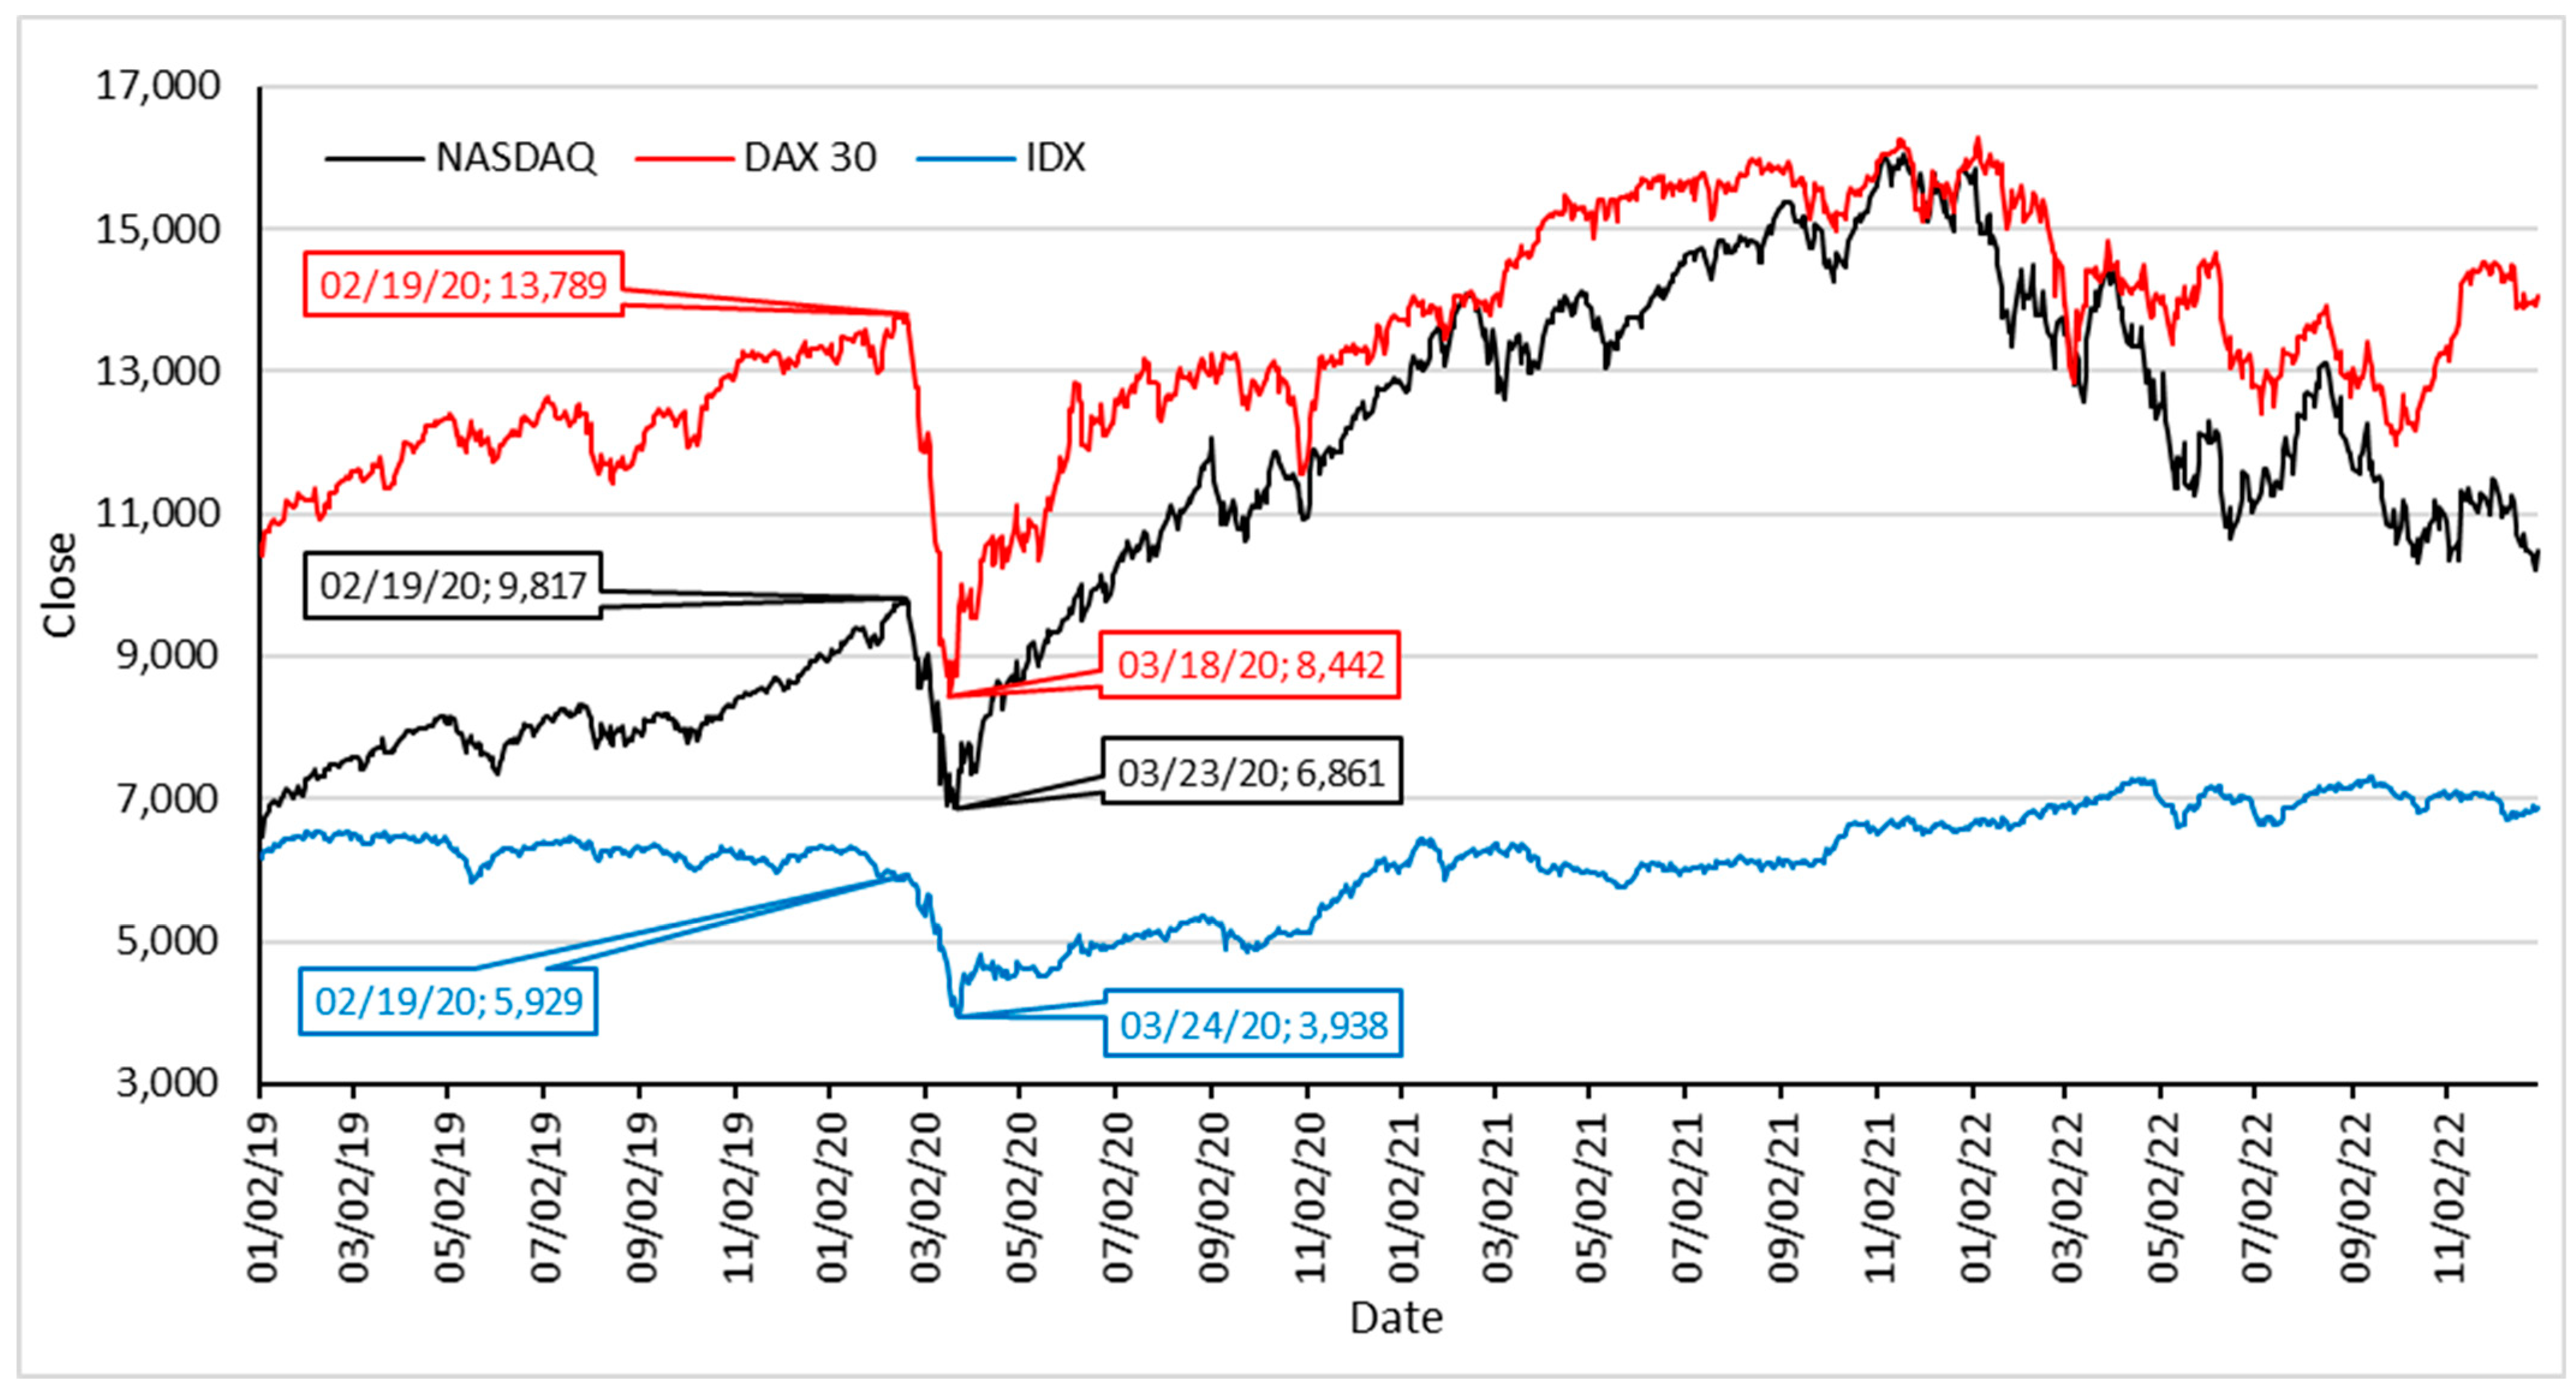
Stock return is the level of yield or profit from stock investment activities; thus, stock returns are closely related to fluctuations in stock prices. Stock price fluctuations are influenced by many factors (Wu and Duan 2017), including the closing price of shares, currency exchange rates, global oil prices, inflation rates, internal stock factors, and external stock factors. In addition to these factors, stock price fluctuations are influenced by extreme events that cause the stock market to fluctuate, such as the pandemic. Information about the severity of COVID-19 rapidly spread throughout the world thanks to the sophistication of communication, information, and social media technologies. Many variables have arisen as a result of the pandemic, which have had a considerable effect on stock price fluctuations, such as panic, the number of infected cases, the number of deaths, the level of vaccine attainment, the level of government efforts in tackling the pandemic, trends in COVID-19, and the outcry on social media. These variables are called X-variable factors (X-FV), which are variables that occur as a result of extraordinary events and that have a major impact on the stock market. For example, the pandemic occurred in the period from 2019 to 2022. However, in the literature published during the pandemic period, no studies used this variable as input data in the model. Most investment-risk prediction models use only one data input, namely daily stock returns. The results generally conclude that the designed models fail to anticipate the effects of extraordinary events such as the pandemic. This is reflected in the disruption of the financial sector during the pandemic. For the model to be dynamic and sensitive to extreme fluctuations, multivariable input data, including X-FV, must be considered as model input data. The common theme that can be found is the importance of investment-risk-prediction models in a stock market that are dynamic and sensitive to extreme fluctuations, and they can be made as such by including X-VF in their input variables.

4.3. Conceptual Model

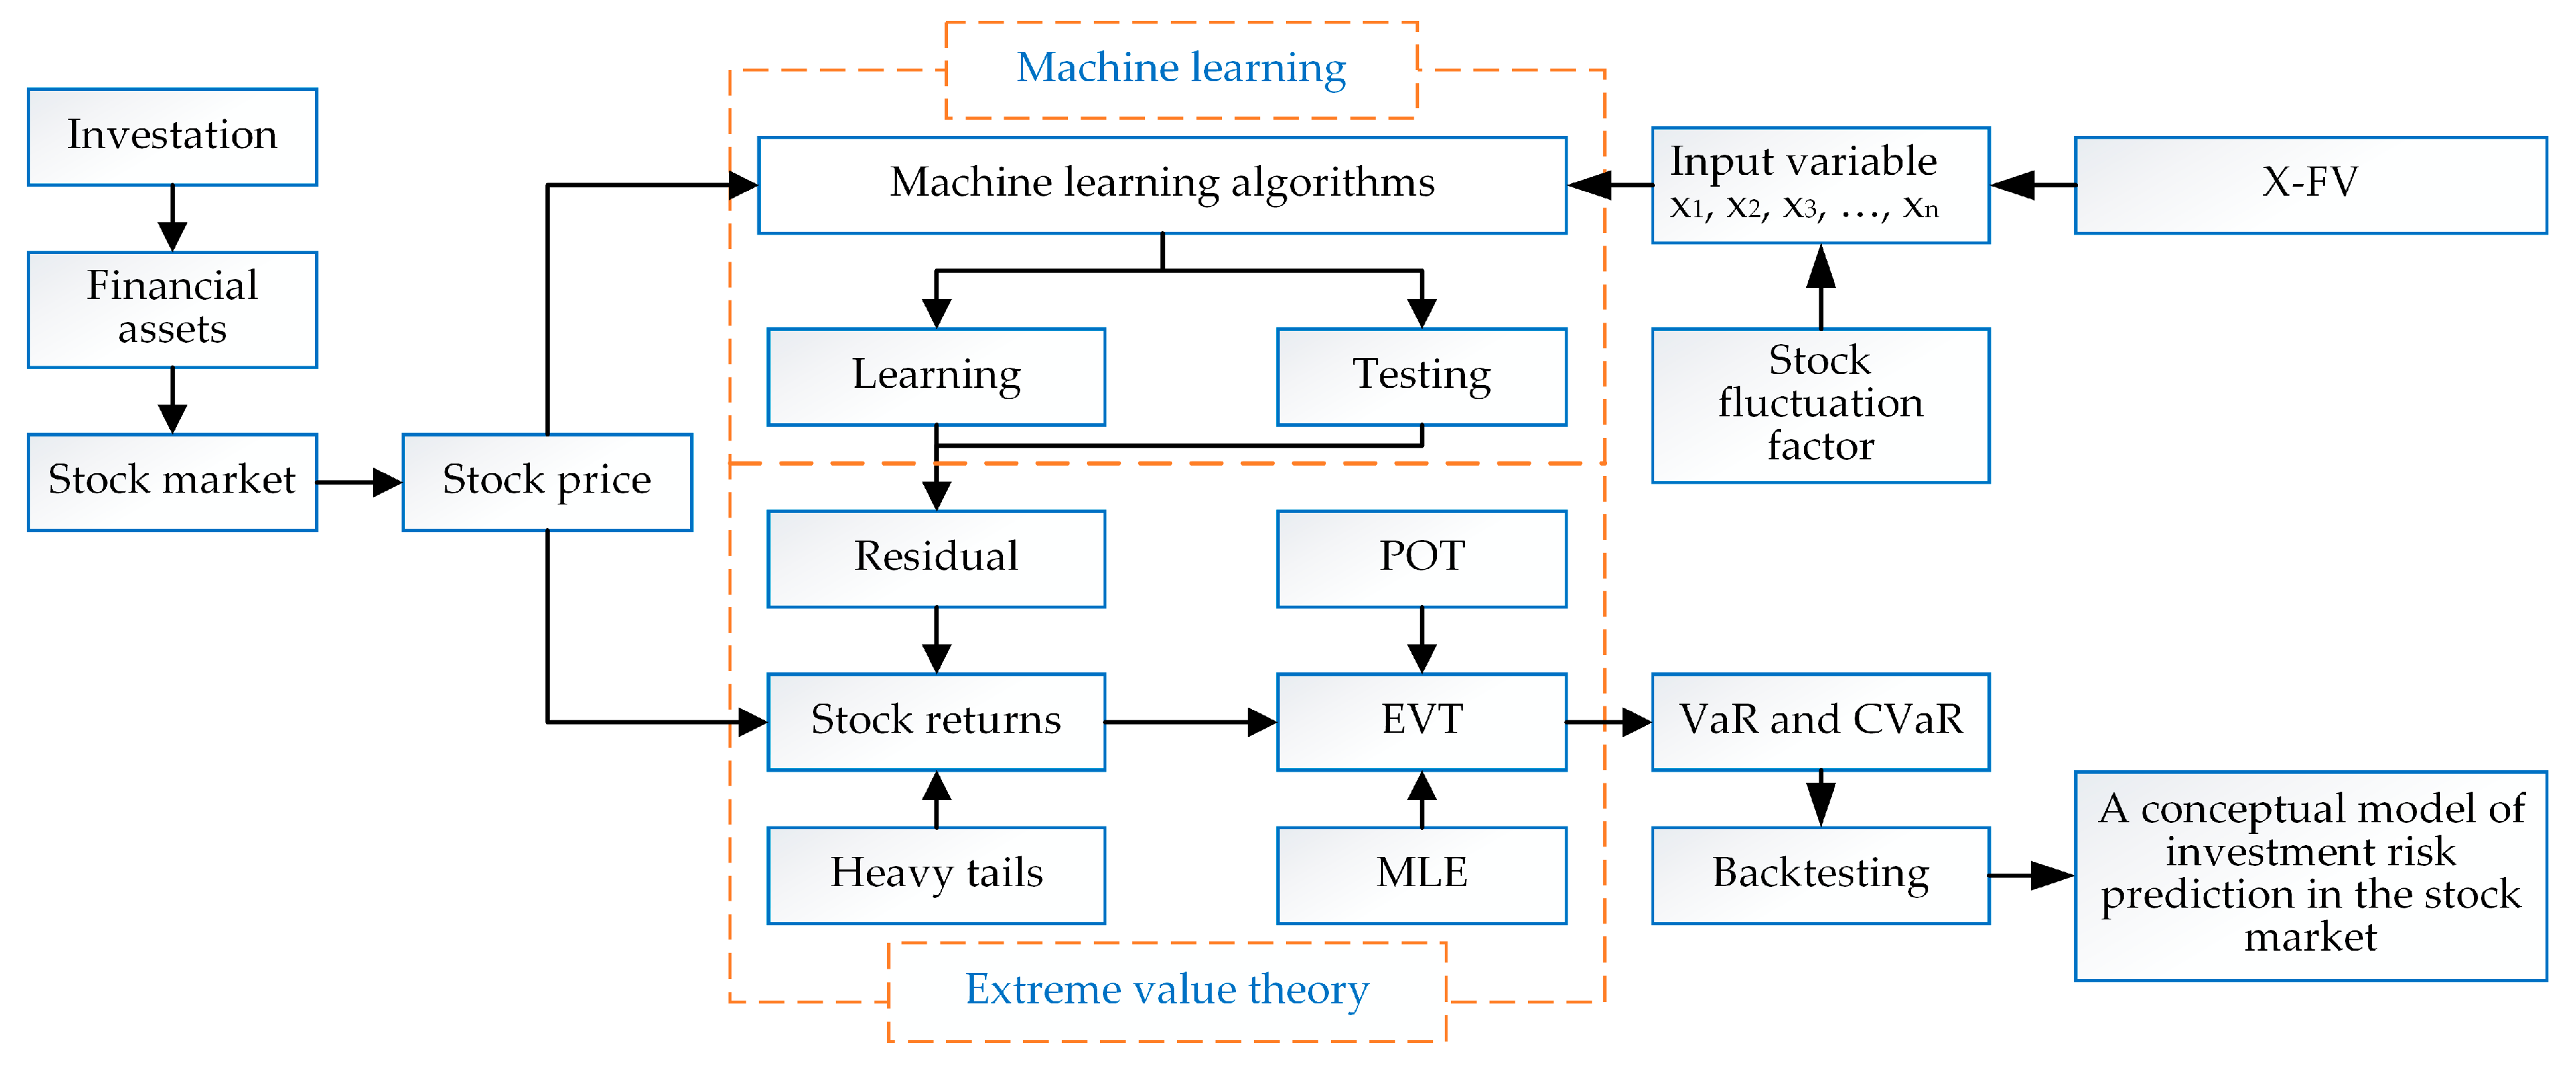
The research gap shows that models used in the literature have focused only on one variable and have ignored X-FV, which means that a model following the EVT approach will not consider variables that arise from extraordinary events that make the stock market fluctuate. It is thus necessary to develop a conceptual model of investment-risk prediction for a stock market that is dynamic and sensitive to extreme fluctuations. The model framework uses VaR–EVT methods with machine learning; therefore, this model is dynamic and capable of handling multivariate cases. The combination of EVT and machine learning makes the models complementary. This model is based on machine-learning algorithms that have the unique advantage of handling large numbers of data, such as financial market data (Chen et al. 2020). Machine-learning algorithms show extraordinary abilities in approaching nonlinear systems and extracting meaningful features from high-dimensional data; because of these abilities, machine-learning algorithms can assist or replace traditional forecasting methods (Buizza et al. 2022) when modern investors face high-dimensional prediction problems, with high data frequency and thousands of observed variables potentially relevant for forecasting (Martin and Nagel 2022).
Machine-learning algorithms are grouped into three categories, namely supervised-learning algorithms, reinforcement-learning algorithms, and unsupervised-learning algorithms (Fausett 1994). K-near neighbors, linear regression, ANNs, SVMs, decision trees, and random forests comprise supervised-learning algorithms. Examples of unsupervised-learning algorithms are the k-means algorithm, hierarchical cluster analysis, a priori, PCA kernel, and t-distributed.
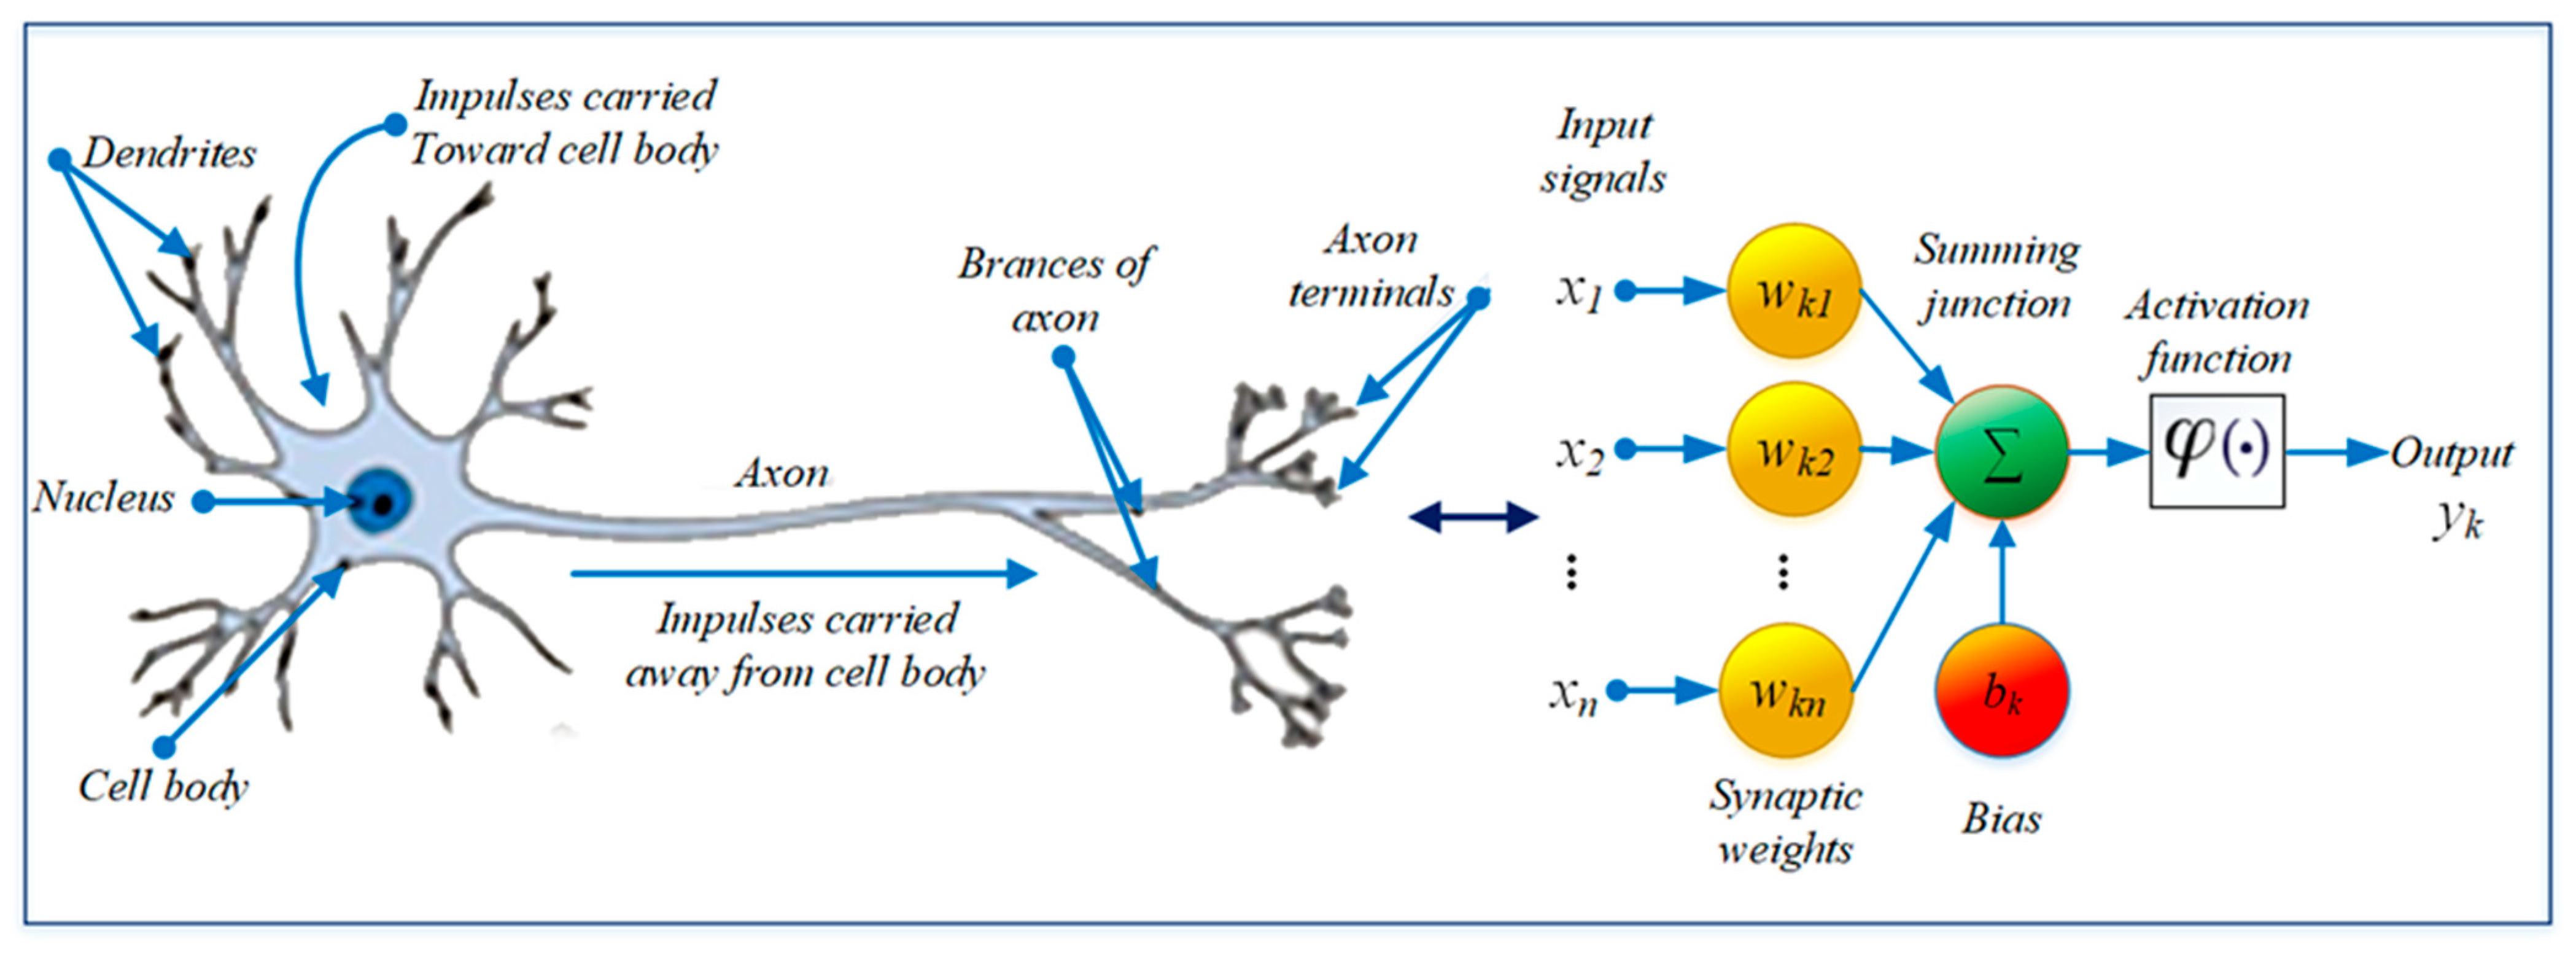
The conceptual model of an investment-risk-prediction EVT machine-learning-based approach was developed by using ANN-supervised-learning algorithms. An ANN was chosen because the ability of this algorithm is very good in forecasting (Qiu and Song 2016). ANNs are the types of adaptive computational models that are inspired by the biological human or animal brain system. Figure 9 shows the neural network concepts.
An ANN accommodates multivariable input data; thus, it is reliable in multivariate cases. Let { x 1 , x 2 , x 3 , , x n } be the input variables and { w k 1 , w k 2 , w k 3 , , w k n } be the weights on k neurons; next, the neurons will calculate all the inputs, as shown in Equation (13) (Haykin 2009):
u k = b k + j = 1 n w k , j x j
The b k parameter is biased, in that it has the effect of increasing or decreasing the network input of the activation function φ(.). The result of Equation (13) is later changed to be nonlinear by the activation function, before it becomes a neuron output signal, as shown in Equation (14):
y k = φ ( u k + b k )
The values of the parameters b 1 , b 2 , b 3 and w k 1 , w k 2 , w k 3 , ,   a n d   w k n are obtained as a result of learning from the input variables. The value of the weight is often limited to prevent it from becoming too large; this is generally achieved through the decay parameter, which is usually set to a value of 0.1. Next, the weights take random values, which are updated using the observed data, thus indicating the presence of nonlinear elements in the forecasts generated by this machine learning. The output of this model is a prediction based on the results of learning and testing variables that affect stock fluctuations, including X-FV, where the lowest error rate is based on two measured metrics: mean-square error and RMSE (Bakar et al. 2021).
Furthermore, the EVT method will identify extreme values of the machine-learning output by using Equation (3), to obtain the parameters σ and ξ . These parameters will later be used to obtain a 1-day-ahead estimate of investment risk by using Equation (11). Back testing was performed to validate the model (Berger and Moys 2021). Figure 10 shows the framework for the conceptual model of the stock market.
This model will continuously predict short-term investment risk. The purpose of this short-term prediction is that the output of the model will follow the dynamics of the variables that affect the stock market ecosystem. Variable changes that occur every day will be the input data for the next prediction; thus, this model is dynamic and sensitive to extreme fluctuations.

5. Conclusions

In this study, an S-SLR was conducted to research the topic of investment-risk prediction in the stock market. The aim was to utilize the S-SLR to develop a predictive model for the level of investment risk in the stock market, which is dynamic and sensitive to extreme fluctuations. This study started from the planning stage, and at the selection study stage, 13 relevant articles had been identified in the literature. A bibliometric analysis was carried out to obtain quantitative and qualitative descriptions of the literature based on the year of publication, citations, journal sources, methodology, etc. Next, the results were processed with VOSviewer software to identify the mapping of words in articles that were relevant to this study. This S-SLR was developed by using quality literature. This is reflected in the identification of journal sources from the literature, where all the studies were sourced from reputable journals from Q1 and Q2. The S-SLR showed that most of the research in this field uses only daily returns as input data. This series of processes provides insights into scientific research, which will assist in generating descriptions, comparisons, visualizations, and research gaps that can become references for the development of conceptual models in the future.
Research gaps were identified as references for the development of models and study methods in the future. Input model data comprise one such area highlighted as a research gap. Input data affect the output of a model. A model for predicting the level of investment risk in the stock market with the EVT approach is successful with univariate cases; there is no definite way when used in multivariate cases. Therefore, all models use only one input data variable, namely daily stock returns, thus allowing the model to be static. Combining the linear and nonlinear models makes the model opportunities dynamic and able to handle multivariate cases. In the machine-learning-based model, input data can be multivariable, including factors that affect stock fluctuations and including X-FV as the model input variable. X-FV is a variable that arises from the occurrence of extraordinary events, which have a considerable effect on disrupting the financial sector, especially the capital market. On the basis of this research gap, a conceptual model for predicting investment risk in a stock market that is dynamic and sensitive to extreme fluctuations has been developed and proposed.
This study uses three databases, namely S, SD, and PQ. These database sources have a similar syntax for writing keywords. The goal is that the selected articles are generated from similar keywords in each database source. Including more database sources can be done in future research to obtain more significant results.

Author Contributions

Conceptualization, M.; methodology, S., H.N. and N.M.; validation, S.; formal analysis, S.; investigation, S., H.N. and N.M.; resources, S.; writing—original draft preparation, M.; writing—review and editing, S.; visualization, S.; supervision, S. All authors have read and agreed to the published version of the manuscript.

Funding

The APC was funded by Universitas Padjadjaran. Grant number 2203/UN6.3.1/PT.00/2022.

Data Availability Statement

Not applicable.

Acknowledgments

The authors are grateful to the Directorate of Research, Community Service and Innovation or DRPM Universitas Padjadjaran for providing an internal research grant, fiscal year 2022, and to the “Academic Leadership Grant (ALG)” program under Sukono.

Conflicts of Interest

The authors declared no conflict of interest.

References

  1. Altig, Dave, Scott Baker, Jose Maria Barrero, Nicholas Bloom, Philip Bunn, Scarlet Chen, Steven J. Davis, Julia Leather, Brent Meyer, Emil Mihaylov, and et al. 2020. Economic Uncertainty before and during the COVID-19 Pandemic. Journal of Public Economics 191: 104274. [Google Scholar] [CrossRef] [PubMed]
  2. Bakar, Maharani A., Norizan Mohamed, Danang A. Pratama, M. Fawwaz, A. Yusran, Nor Azlida Aleng, Z. Yanuar, and L. Niken. 2021. Modelling Lock-down Strictness for COVID-19 Pandemic in ASEAN Countries by Using Hybrid ARIMA-SVR and Hybrid SEIR-ANN. Arab Journal of Basic and Applied Sciences 28: 204–24. [Google Scholar] [CrossRef]
  3. Balkema, A. A., and L. de Haan. 1974. Residual Life Time at Great Age. The Annals of Probability 2: 792–804. [Google Scholar] [CrossRef]
  4. Banerjee, A., and Samit Paul. 2020. Idiosyncrasies of Intraday Risk in Emerging and Developed Markets: Efficacy of the MCS-GARCH Model and Extreme Value Theory. Global Business Review, 1–23. [Google Scholar] [CrossRef]
  5. Berger, Theo, and Gunnar Moys. 2021. Value-at-Risk Backtesting: Beyond the Empirical Failure Rate. Expert Systems with Applications 177: 114893. [Google Scholar] [CrossRef]
  6. Bień-Barkowska, Katarzyna. 2020. Looking at Extremes without Going to Extremes: A New Self-Exciting Probability Model for Extreme Losses in Financial Markets. Entropy 22: 789. [Google Scholar] [CrossRef]
  7. Buizza, Caterina, César Quilodrán Casas, Philip Nadler, Julian Mack, Stefano Marrone, Zainab Titus, Clémence Le Cornec, Evelyn Heylen, Tolga Dur, Luis Baca Ruiz, and et al. 2022. Data Learning: Integrating Data Assimilation and Machine Learning. Journal of Computational Science 58: 101525. [Google Scholar] [CrossRef]
  8. Büyükşahin, Ümit Çavuş, and Şeyda Ertekin. 2019. Improving Forecasting Accuracy of Time Series Data Using a New ARIMA-ANN Hybrid Method and Empirical Mode Decomposition. Neurocomputing 361: 151–63. [Google Scholar] [CrossRef] [Green Version]
  9. Chaiboonsri, Chukiat, and Satawat Wannapan. 2021. Applying Quantum Mechanics for Extreme Value Prediction of VaR and ES in the ASEAN Stock Exchange. Economies 9: 13. [Google Scholar] [CrossRef]
  10. Chebbi, Ali, and Amel Hedhli. 2022. Revisiting the Accuracy of Standard VaR Methods for Risk Assessment: Using the Copula-EVT Multidimensional Approach for Stock Markets in the MENA Region. Quarterly Review of Economics and Finance 84: 430–45. [Google Scholar] [CrossRef]
  11. Chen, Yan, and Wenqiang Yu. 2020. Setting the Margins of Hang Seng Index Futures on Different Positions Using an APARCH-GPD Model Based on Extreme Value Theory. Physica A: Statistical Mechanics and Its Applications 544: 123207. [Google Scholar] [CrossRef]
  12. Chen, Yanjun, Kun Liu, Yuantao Xie, and Mingyu Hu. 2020. Financial Trading Strategy System Based on Machine Learning. Mathematical Problems in Engineering 2020: 3589198. [Google Scholar] [CrossRef]
  13. Echaust, Krzysztof, and Małgorzata Just. 2020. Value at Risk Estimation Using the GARCH-EVT Approach with Optimal Tail Selection. Mathematics 8: 114. [Google Scholar] [CrossRef] [Green Version]
  14. Fausett, Laurene. 1994. Fundamentals of Neural Networks: Architectures, Algorithms, and Applications. Upper Saddle River: Prentice-Hall, Inc. [Google Scholar]
  15. Firdaniza, Firdaniza, Budi Nurani Ruchjana, Diah Chaerani, and Jaziar Radianti. 2022. Information Diffusion Model in Twitter: A Systematic Literature Review. Information 13: 13. [Google Scholar] [CrossRef]
  16. Ghourabi, Mohamed E. L., Asma Nani, and Imed Gammoudi. 2021. A Value-at-Risk Computation Based on Heavy-Tailed Distribution for Dynamic Conditional Score Models. International Journal of Finance & Economics 26: 2790–99. [Google Scholar] [CrossRef]
  17. Hajirahimi, Zahra, and Mehdi Khashei. 2019. Hybrid Structures in Time Series Modeling and Forecasting: A Review. Engineering Applications of Artificial Intelligence 86: 83–106. [Google Scholar] [CrossRef]
  18. Haykin, Simon. 2009. Neural Networks and Learning Machines, 3rd ed. New York: Pearson Education, Inc. [Google Scholar]
  19. Hidayana, Rizki Apriva, Herlina Napitupulu, and Sukono Sukono. 2022. An Investment Decision-Making Model to Predict the Risk and Return in Stock Market: An Application of ARIMA-GJR-GARCH. Decision Science Letters 11: 235–46. [Google Scholar] [CrossRef]
  20. Ibn Musah, Abdul-Aziz, Jianguo Du, Hira Salah ud din Khan, and Alhassan Alolo Abdul-Rasheed Akeji. 2018. The Asymptotic Decision Scenarios of an Emerging Stock Exchange Market: Extreme Value Theory and Artificial Neural Network. Risks 6: 132. [Google Scholar] [CrossRef] [Green Version]
  21. Ilyas, Qazi M., Khalid Iqbal, Sidra Ijaz, Abid Mehmood, and Surbhi Bhatia. 2022. A Hybrid Model to Predict Stock Closing Price Using Novel Features and a Fully Modified Hodrick–Prescott Filter. Electronics 11: 3588. [Google Scholar] [CrossRef]
  22. Ji, Jingru, Donghua Wang, and Dinghai Xu. 2019. Modelling the Spreading Process of Extreme Risks via a Simple Agent-Based Model: Evidence from the China Stock Market. Economic Modelling 80: 383–91. [Google Scholar] [CrossRef] [Green Version]
  23. Ji, Jingru, Donghua Wang, Dinghai Xu, and Chi Xu. 2020. Combining a Self-Exciting Point Process with the Truncated Generalized Pareto Distribution: An Extreme Risk Analysis under Price Limits. Journal of Empirical Finance 57: 52–70. [Google Scholar] [CrossRef]
  24. Kalfin, Sukono, Sudradjat Supian, and Mustafa Mamat. 2022. Insurance as an Alternative for Sustainable Economic Recovery after Natural Disasters: A Systematic Literature Review. Sustainability 14: 4349. [Google Scholar] [CrossRef]
  25. Karmakar, Madhusudan, and Girja K. Shukla. 2015. Managing Extreme Risk in Some Major Stock Markets: An Extreme Value Approach. International Review of Economics & Finance 35: 1–25. [Google Scholar] [CrossRef]
  26. Karmakar, Madhusudan, and Samit Paul. 2019. Intraday Portfolio Risk Management Using VaR and CVaR:A CGARCH-EVT-Copula Approach. International Journal of Forecasting 35: 699–709. [Google Scholar] [CrossRef]
  27. Kitchenham, Barbara, and Stuart Charters. 2007. Guidelines for Performing Systematic Literature Reviews in Software Engineering. Available online: https://www.elsevier.com/__data/promis_misc/525444systematicreviewsguide.pdf (accessed on 29 January 2023).
  28. Liberati, Alessandro, Douglas G. Altman, Jennifer Tetzlaff, Cynthia Mulrow, Peter C. Gøtzsche, John P. A. Ioannidis, Mike Clarke, P. J. Devereaux, Jos Kleijnen, and David Moher. 2009. The PRISMA statement for reporting systematic reviews and meta-analyses of studies that evaluate healthcare interventions: Explanation and elaboration. BMJ 339: b2700. [Google Scholar] [CrossRef] [Green Version]
  29. Long, H. V., H. B. Jebreen, I. Dassios, and D. Baleanu. 2020. On the Statistical GARCH Model for Managing the Risk by Employing a Fat-Tailed Distribution in Finance. Symmetry 12: 1698. [Google Scholar] [CrossRef]
  30. Longin, François M. 2000. From Value at Risk to Stress Testing: The Extreme Value Approach. Journal of Banking & Finance 24: 1097–130. [Google Scholar] [CrossRef]
  31. Martin, Ian W. R., and Stefan Nagel. 2022. Market Efficiency in the Age of Big Data. Journal of Financial Economics 145: 154–77. [Google Scholar] [CrossRef]
  32. Melina, Sukono, Herlina Napitupulu, Aceng Sambas, Anceu Murniati, and Valentina Adimurti Kusumaningtyas. 2022. Artificial Neural Network-Based Machine Learning Approach to Stock Market Prediction Model on the Indonesia Stock Exchange During the COVID-19. Engineering Letters 30: 988–1000. [Google Scholar]
  33. Miloš, Božović. 2020. Portfolio Tail Risk: A Multivariate Extreme Value Theory Approach. Entropy 22: 1425. [Google Scholar] [CrossRef]
  34. Morgan, John Pierpont. 1996. RiskMetrics Technical Document, 4th ed. New York: RiskMetrics. [Google Scholar]
  35. Najem, Rihab, Meryem Fakhouri Amr, Ayoub Bahnasse, and Mohamed Talea. 2022. Artificial Intelligence for Digital Finance, Axes and Techniques. Procedia Computer Science 203: 633–38. [Google Scholar] [CrossRef]
  36. O’Donnell, Niall, Darren Shannon, and Barry Sheehan. 2021. Immune or At-Risk? Stock Markets and the Significance of the COVID-19 Pandemic. Journal of Behavioral and Experimental Finance 30: 1–10. [Google Scholar] [CrossRef]
  37. Omari, Cyprian, Simon Mundia, Immaculate Ngina, Mundia Maina, and Immaculate Ngina. 2020. Forecasting Value-at-Risk of Financial Markets under the Global Pandemic of COVID-19 Using Conditional Extreme Value Theory. Journal of Mathematical Finance 10: 569–97. [Google Scholar] [CrossRef]
  38. Parkinson, Michael. 1980. The Extreme Value Method for Estimating the Variance of the Rate of Return. The Journal of Business 53: 61–65. [Google Scholar] [CrossRef]
  39. Pickands, James. 1975. Statistical Inference Using Extreme Order Statistics. The Annals of Statistics 3: 119–31. [Google Scholar] [CrossRef]
  40. Qiu, Mingyue, and Yu Song. 2016. Predicting the Direction of Stock Market Index Movement Using an Optimized Artificial Neural Network Model. PLoS ONE 11: e0155133. [Google Scholar] [CrossRef] [Green Version]
  41. Rossignolo, Adrian F., Meryem Duygun Fethi, and Mohamed Shaban. 2012. Value-at-Risk Models and Basel Capital Charges: Evidence from Emerging and Frontier Stock Markets. Journal of Financial Stability 8: 303–19. [Google Scholar] [CrossRef] [Green Version]
  42. Saputra, Moch Panji Agung, Sukono, and Diah Chaerani. 2022. Estimation of Maximum Potential Losses for Digital Banking Transaction Risks Using the Extreme Value-at-Risks Method. Risks 10: 10. [Google Scholar] [CrossRef]
  43. Singvejsakul, Jittima, Chukiat Chaiboonsri, and Songsak Sriboonchitta. 2021. The Optimization of Bayesian Extreme Value: Empirical Evidence for the Agricultural Commodities in the US. Economies 9: 30. [Google Scholar] [CrossRef]
  44. Sobreira, Nuno, and Rui Louro. 2020. Evaluation of Volatility Models for Forecasting Value-at-Risk and Expected Shortfall in the Portuguese Stock Market. Finance Research Letters 32: 101098. [Google Scholar] [CrossRef]
  45. Song, Shijia, Fei Tian, and Handong Li. 2021. An Intraday-Return-Based Value-at-Risk Model Driven by Dynamic Conditional Score with Censored Generalized Pareto Distribution. Journal of Asian Economics 74: 101314. [Google Scholar] [CrossRef]
  46. Sukono, Hafizan Juahir, Riza Andrian Ibrahim, Moch Panji Agung Saputra, Yuyun Hidayat, and Igif Gimin Prihanto. 2022. Application of Compound Poisson Process in Pricing Catastrophe Bonds: A Systematic Literature Review. Mathematics 10: 2668. [Google Scholar] [CrossRef]
  47. Tabasi, Hamed, Vahidreza Yousefi, Jolanta Tamošaitienė, and Foroogh Ghasemi. 2019. Estimating Conditional Value at Risk in the Tehran Stock Exchange Based on the Extreme Value Theory Using GARCH Models. Administrative Sciences 9: 40. [Google Scholar] [CrossRef] [Green Version]
  48. Trabelsi, Nader, and Aviral K. Tiwari. 2019. Market-Risk Optimization among the Developed and Emerging Markets with CVaR Measure and Copula Simulation. Risks 7: 78. [Google Scholar] [CrossRef] [Green Version]
  49. Ullah, Malik Z., Fouad O. Mallawi, Mir Asma, and Stanford Shateyi. 2022. On the Conditional Value at Risk Based on the Laplace Distribution with Application in GARCH Model. Mathematics 10: 3018. [Google Scholar] [CrossRef]
  50. Wu, Binghui, and Tingting Duan. 2017. A Performance Comparison of Neural Networks in Forecasting Stock Price Trend. International Journal of Computational Intelligence Systems 10: 336–46. [Google Scholar] [CrossRef] [Green Version]
  51. Wu, Binrong, Lin Wang, Sirui Wang, and Yu-Rong Zeng. 2021. Forecasting the US Oil Markets Based on Social Media Information during the COVID-19 Pandemic. Energy 226: 120403. [Google Scholar] [CrossRef]
Figure 1. Stock index movements during the pandemic.
Risks 11 00060 g001
Figure 2. PRISMA flowchart.
Risks 11 00060 g002
Figure 3. Visualization of bibliometric networks.
Risks 11 00060 g003
Figure 4. Visualization of linkages between extreme value theory items.
Risks 11 00060 g004
Figure 5. The number of article publications and citations.
Risks 11 00060 g005
Figure 6. The 10 most commonly used keywords.
Risks 11 00060 g006
Figure 7. Stock markets covered.
Risks 11 00060 g007
Figure 8. Stock market locations by country.
Risks 11 00060 g008
Figure 9. Neural network concepts.
Risks 11 00060 g009
Figure 10. Conceptual model framework.
Risks 11 00060 g010
Table 1. Questions research.
QRQuestions
QR1What is the purpose of this research?
QR2How did the VaR–CVaR model function as an EVT method for predicting investment risk in the stock market during the COVID-19 pandemic?
QR3What are the input variables commonly used?
QR4What is the investment-risk-prediction model that is dynamic and sensitive to extreme fluctuations?
Table 2. Inclusion and exclusion criteria.
Criteria ICEC
IC1The study of the analysis, prediction, forecasting, and estimation of investment risk in the stock market with the VaR–CVaR hybrid method with the EVT approach.Studies that are not related to the analysis, prediction, forecasting, and estimation of investment risk in the stock market.
IC2Research articles from peer-reviewed international journals.None of the research articles.
IC3Articles published in the period 2019 to 2022.Articles published outside the period 2019 to 2022.
IC4Using English.Using a language other than English.
Table 3. Quality assessment criteria.
QAInformation
QA1Is the article analysis, forecasting, estimation, or prediction of investment risk in the stock market?
QA2Does the article use the hybrid VaR—CVaR method with EVT, block maxima, peaks over threshold, GEV distribution, and GPD?
QA3Is the primary source of the stock market data in the form of stocks?
Table 4. Search results by keyword (K).
KQueryResults
SSDPQTotal
K1(“forecasting” OR “prediction” OR “predicting”) AND (“var” OR “cvar” OR “risk”)200383,4681,122,4611,506,129
K2K1 AND (“stock market”)20011,51476,94388,657
K3K2 AND (“extreme value theory” OR “EVT”)8152578738
Table 5. Selection by QA.
NumberSourcesAuthorsQA1QA2QA3
1 (Ji et al. 2019)Jingru Ji; Donghua Wang; Dinghai Xu.
2(Karmakar and Paul 2019)Madhusudan Karmakar; Samit Paul.
3(Tabasi et al. 2019)Hamėd Tabasi; Jolanta Tamosaitiene; Vahidreza Yousėfi; Foroogh Ghasemi.
4(Banerjee and Paul 2020)Aditya Banerjee; Samit Paul.
5(Bień-Barkowska 2020)Katarzyna Bień-Barkowska.
6(Chen and Yu 2020)Yan Chen; Wenqiang Yu.
7(Ji et al. 2020)Jingru Ji; Dinghai Xu; Donghua Wang; Chi Xu.
8(Miloš 2020)Miloš Božović.
9(Sobreira and Louro 2020)Nuno Sobreira; Rui Louro.
10(Chaiboonsri and Wannapan 2021)Chukiat Chaiboonsri; SatawatWannapan.
11(Ghourabi et al. 2021)Mohamed El Ghourabi; Asma Nani; Imed Gammoudi.
12(Song et al. 2021)Shijia Song; Fei Tian; Handong Li.
13(Chebbi and Hedhli 2022)Ali Chebbi; Amel Hedhli.
Table 6. Shows the articles by the number of citations.
RankSourcesJournalCitations
1(Karmakar and Paul 2019)International Journal of Forecasting.32
2(Tabasi et al. 2019)Administrative Sciences.11
3(Sobreira and Louro 2020)Finance Research Letters.8
4(Ji et al. 2020)Journal of Empirical Finance.7
5(Bień-Barkowska 2020)Entropy.7
6(Song et al. 2021)Journal of Asian Economics.5
7(Chebbi and Hedhli 2022)The Quarterly Review of Economics and Finance.4
8(Chen and Yu 2020)Physica A: Statistical Mechanics and its Applications.4
9(Chaiboonsri and Wannapan 2021)Economies.2
10(Banerjee and Paul 2020)Global Business Review.2
11(Ji et al. 2019)Economic Modeling.2
12(Miloš 2020)Entropy.1
13(Ghourabi et al. 2021)International Journal of Finance and Economics.1
Table 7. Journals by the number of citations.
NumberJournalISSNCountryPublisherHQuartilesSJRArticlesCitations
Index2021
1International Journal of Forecasting1692070NetherlandsElsevier100Q11.99132
2Administrative Sciences20763387SwitzerlandMDPI AG23Q20.48111
3Finance Research Letters15446123NetherlandsElsevier BV62Q12.0118
4Entropy10994300SwitzerlandMDPI81Q20.5528
5Journal of Empirical Finance9275398NetherlandsElsevier80Q11.2017
6Journal of Asian Economics10490078NetherlandsElsevier51Q20.6515
7Physica A: Statistical Mechanics and its Applications3784371NetherlandsElsevier170Q10.8914
8Quarterly Review of Economics and Finance10629769NetherlandsElsevier55Q20.6914
9Economies22277099SwitzerlandMDPI19Q20.4412
10Global Business Review9721509IndiaSage Publications India Pvt. Ltd.30Q20.4512
11Economic Modeling2649993NetherlandsElsevier87Q21.0712
12International Journal of Finance and Economics10769307UKJohn Wiley and Sons Ltd.41Q20.4211
Table 8. The methodology.
SourcesBest ModelModel Used
(Ji et al. 2019)The agent-based (AB) model.The AB model.
(Karmakar and Paul 2019)CGARCH–EVT-Copula.CGARCH, CGARCH–EVT-Clayton, CGARCH-HS, GARCH–EVT, CGARCH–t-EVT, CGARCH–Gumbel-EVT, CGARCH–EVT-Copula, and CGARCH- BB1-EVT.
(Tabasi et al. 2019)POT-GARCH with a Student’s t distribution (T-SD) for residual values (RV).GARCH with a T-SD for RV, GARCH model with a normal distribution for RV, and POT-GARCH with a normal distribution for RV.
(Banerjee and Paul 2020)MCS–GARCH–EVT.EGARCH-EVT, CGARCH–EVT, MCS-GARCH, MCS-GARCH–EVT, GARCH, EGARCH, CGARCH, and GARCH–EVT.
(Bień-Barkowska 2020)SEP-POT.SEP-POT, EGARCH skewed–t, and SEI-POT.
(Chen and Yu 2020)APARCH-GPD.APARCH-t, APARCH-GPD, and EWMA.
(Ji et al. 2020)The self-exciting point process (SEEP) with the truncated GPD.The SEEP with the truncated GPD.
(Miloš 2020)mv GARCH–GP.mv GARCH–GP, mv GJR–GP.
(Sobreira and Louro 2020)GARCH–EVT. IGARCH, GARCH, GJR–GARCH, EGARCH, GARCH–EVT, EGARCH-EVT, IGARCH-EVT, and GJR–GARCH-EVT.
(Chaiboonsri and Wannapan 2021)Quantum mechanics (QM).QM.
(Ghourabi et al. 2021)VaR based GAS-EVT.VaR based GAS-EVT, and Dekker’s-VaR.
(Song et al. 2021)GP–DCS-VaR.GP–DCS-VaR, RGARCH–SSTD-RV, RGARCH–GED-RV, RGARCH–NIG-RV, RGARCH–SSTD-RRV, RGARCH–GED-RRV, and RGARCH–NIG-RRV.
(Chebbi and Hedhli 2022)GARCH–EVT–vine copula.GARCH–EVT–vine copula, EWMA, HS, and GARCH.
Disclaimer/Publisher’s Note: The statements, opinions and data contained in all publications are solely those of the individual author(s) and contributor(s) and not of MDPI and/or the editor(s). MDPI and/or the editor(s) disclaim responsibility for any injury to people or property resulting from any ideas, methods, instructions or products referred to in the content.

