
Divergent Trends in the Prevalence of Children’s Asthma, Rhinitis and Atopic Dermatitis and Environmental Influences in the Urban Setting of Zagreb, Croatia

Abstract
:1. Introduction
2. Materials and Methods
- Questions on early-life exposure (attending day care, breastfeeding, pertussis vaccination, smoking during pregnancy and parasite infestations);
- Exposure that influences the microbiome (dog and cat exposure in the first year of life and during the last 12 months);
- Exposure to the indoor environment (mould and dampness in the first year of life and during the last 12 months, using feather pillows during the last 12 months and the frequency of hamburger consumption during the last 12 months).
3. Results
3.1. Demographic Data
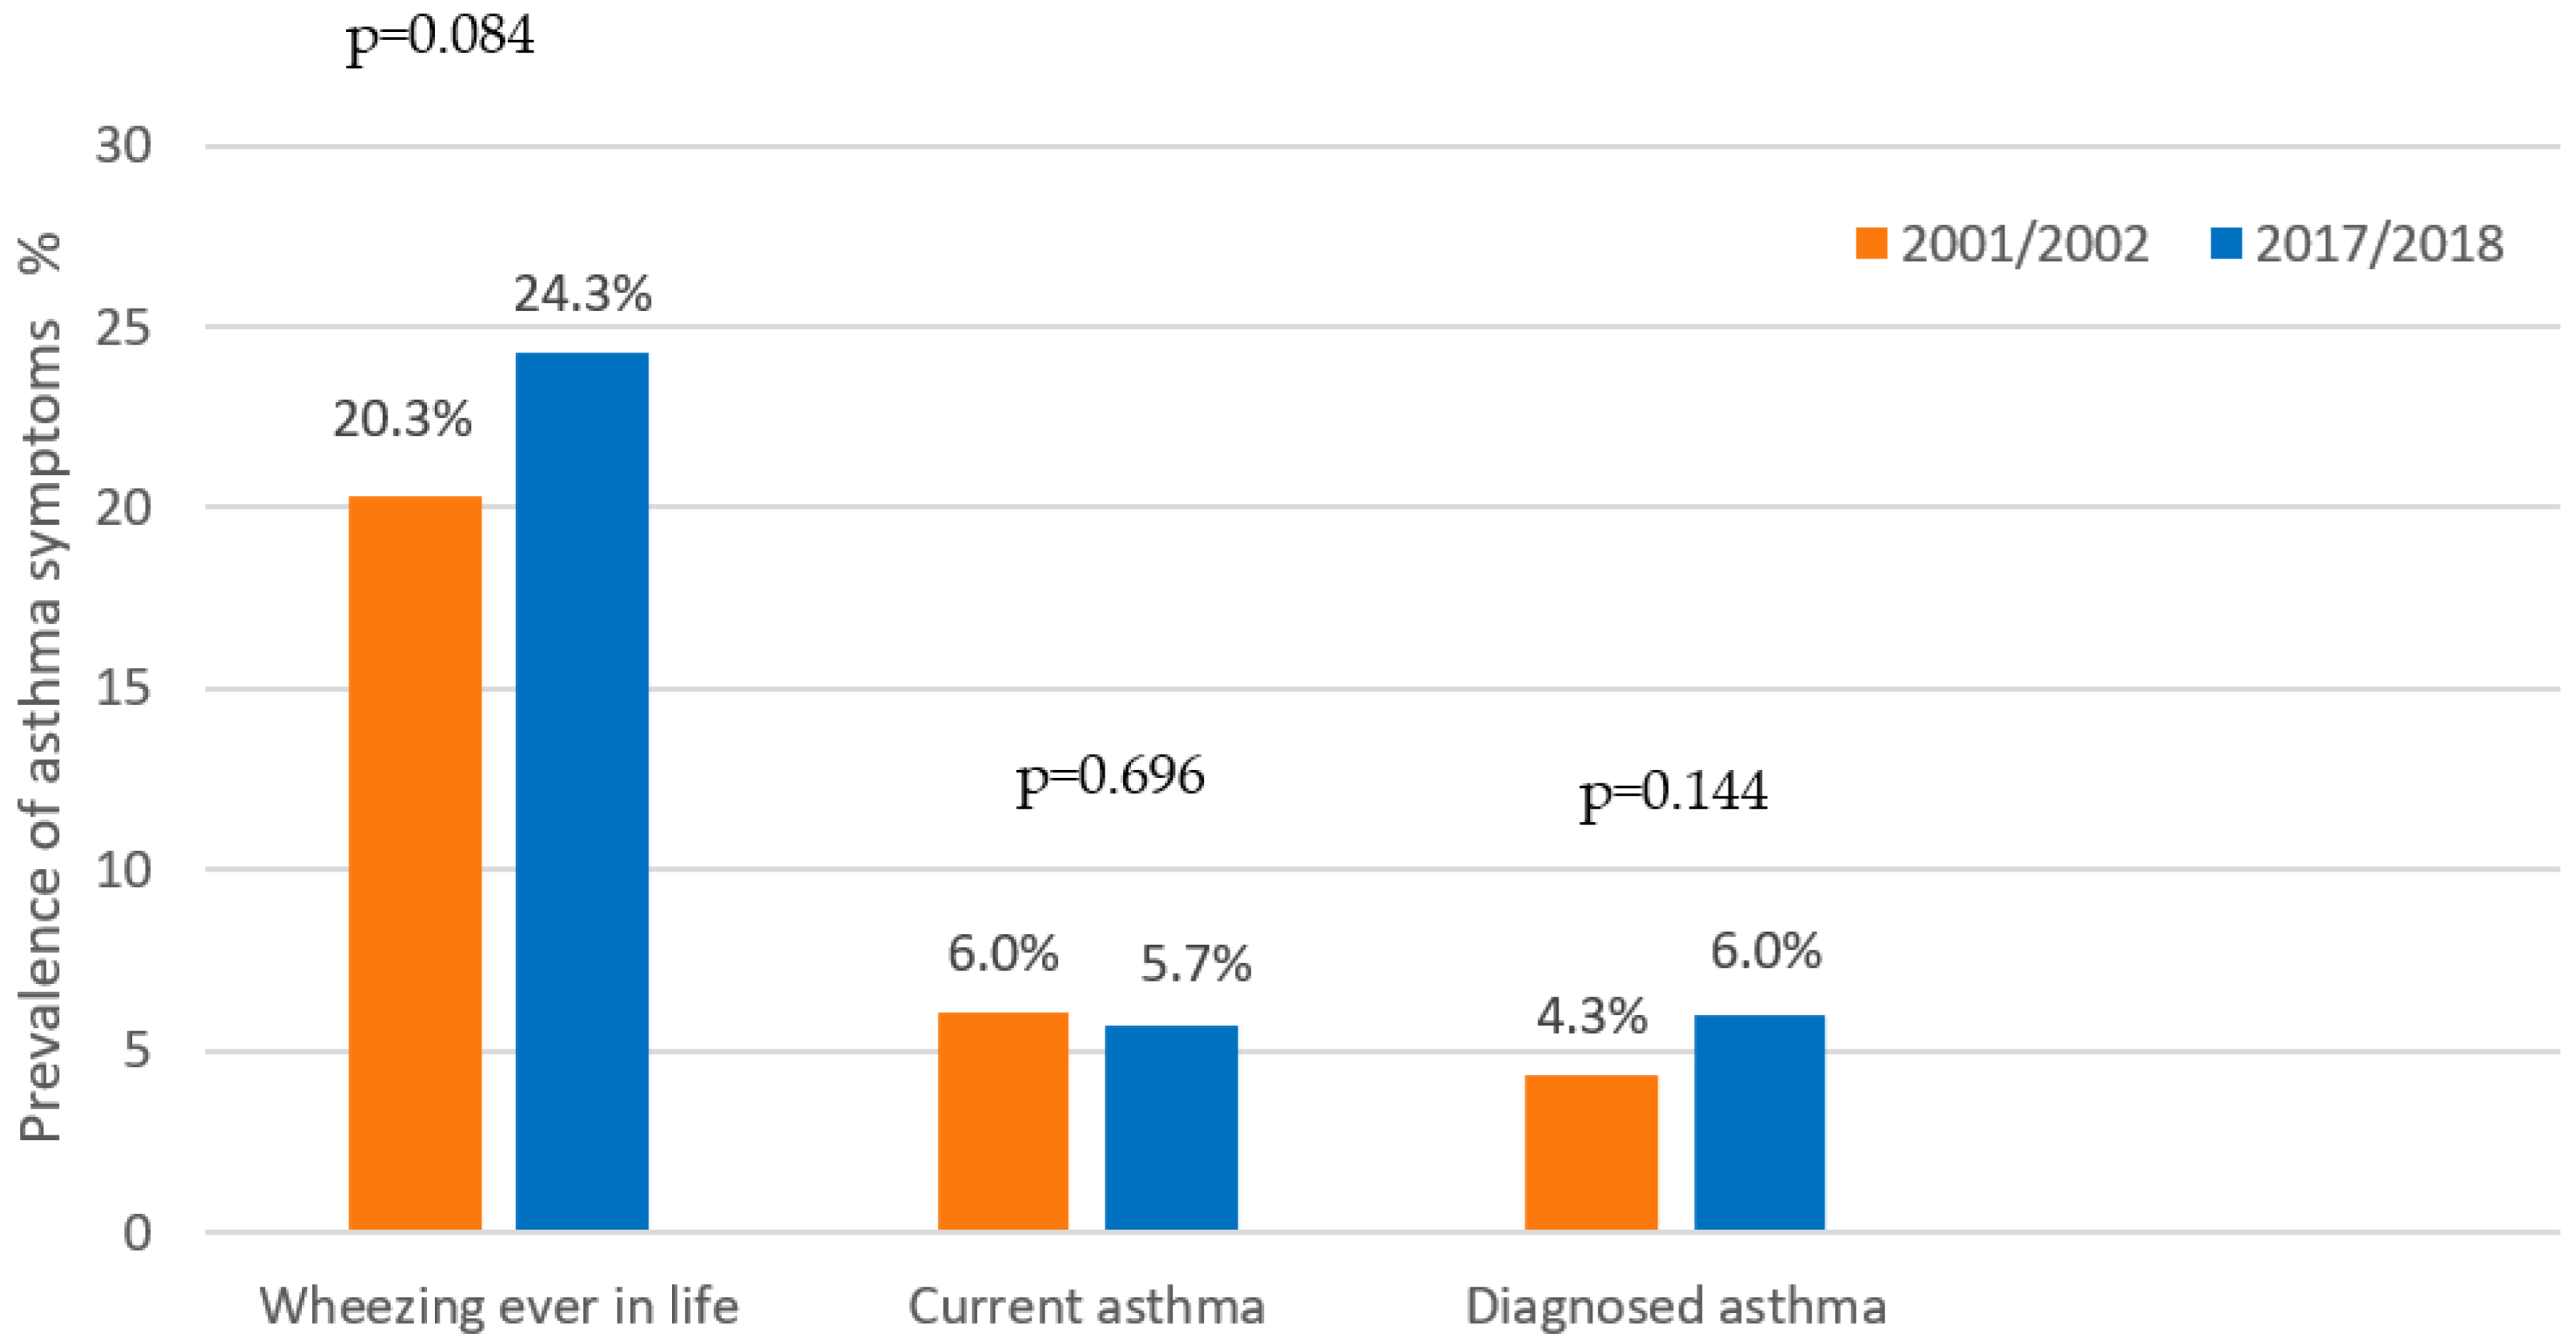
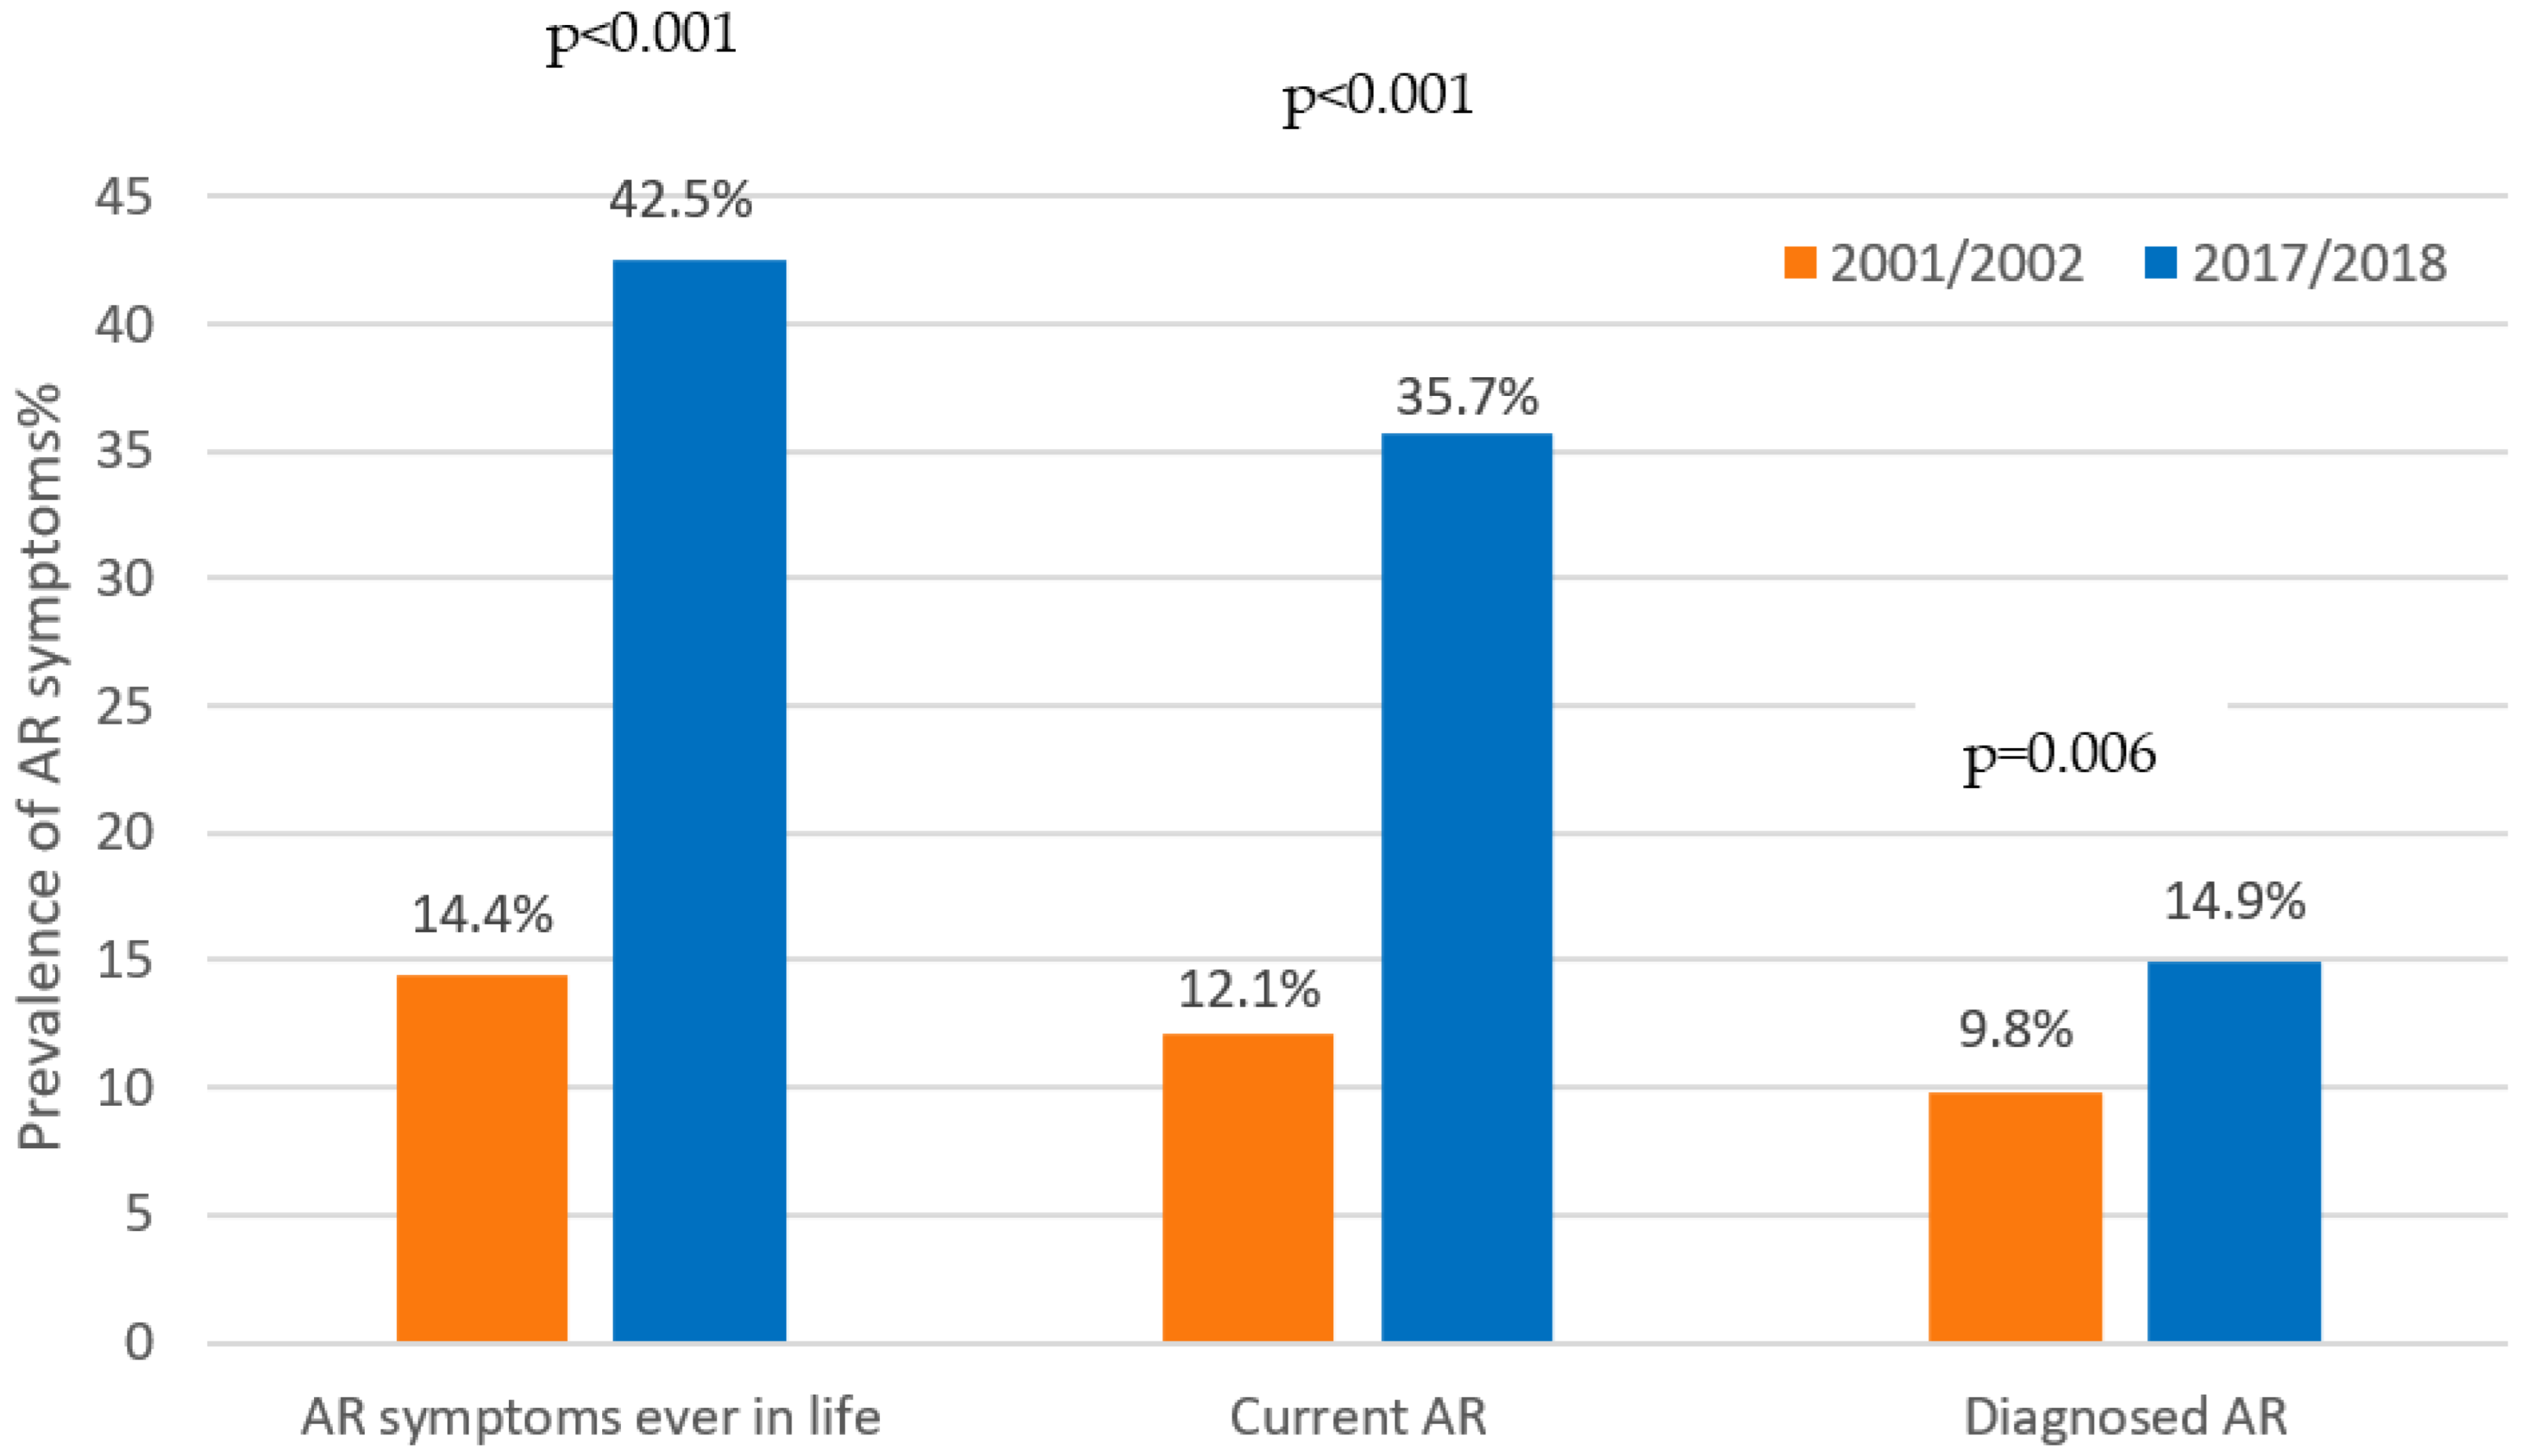
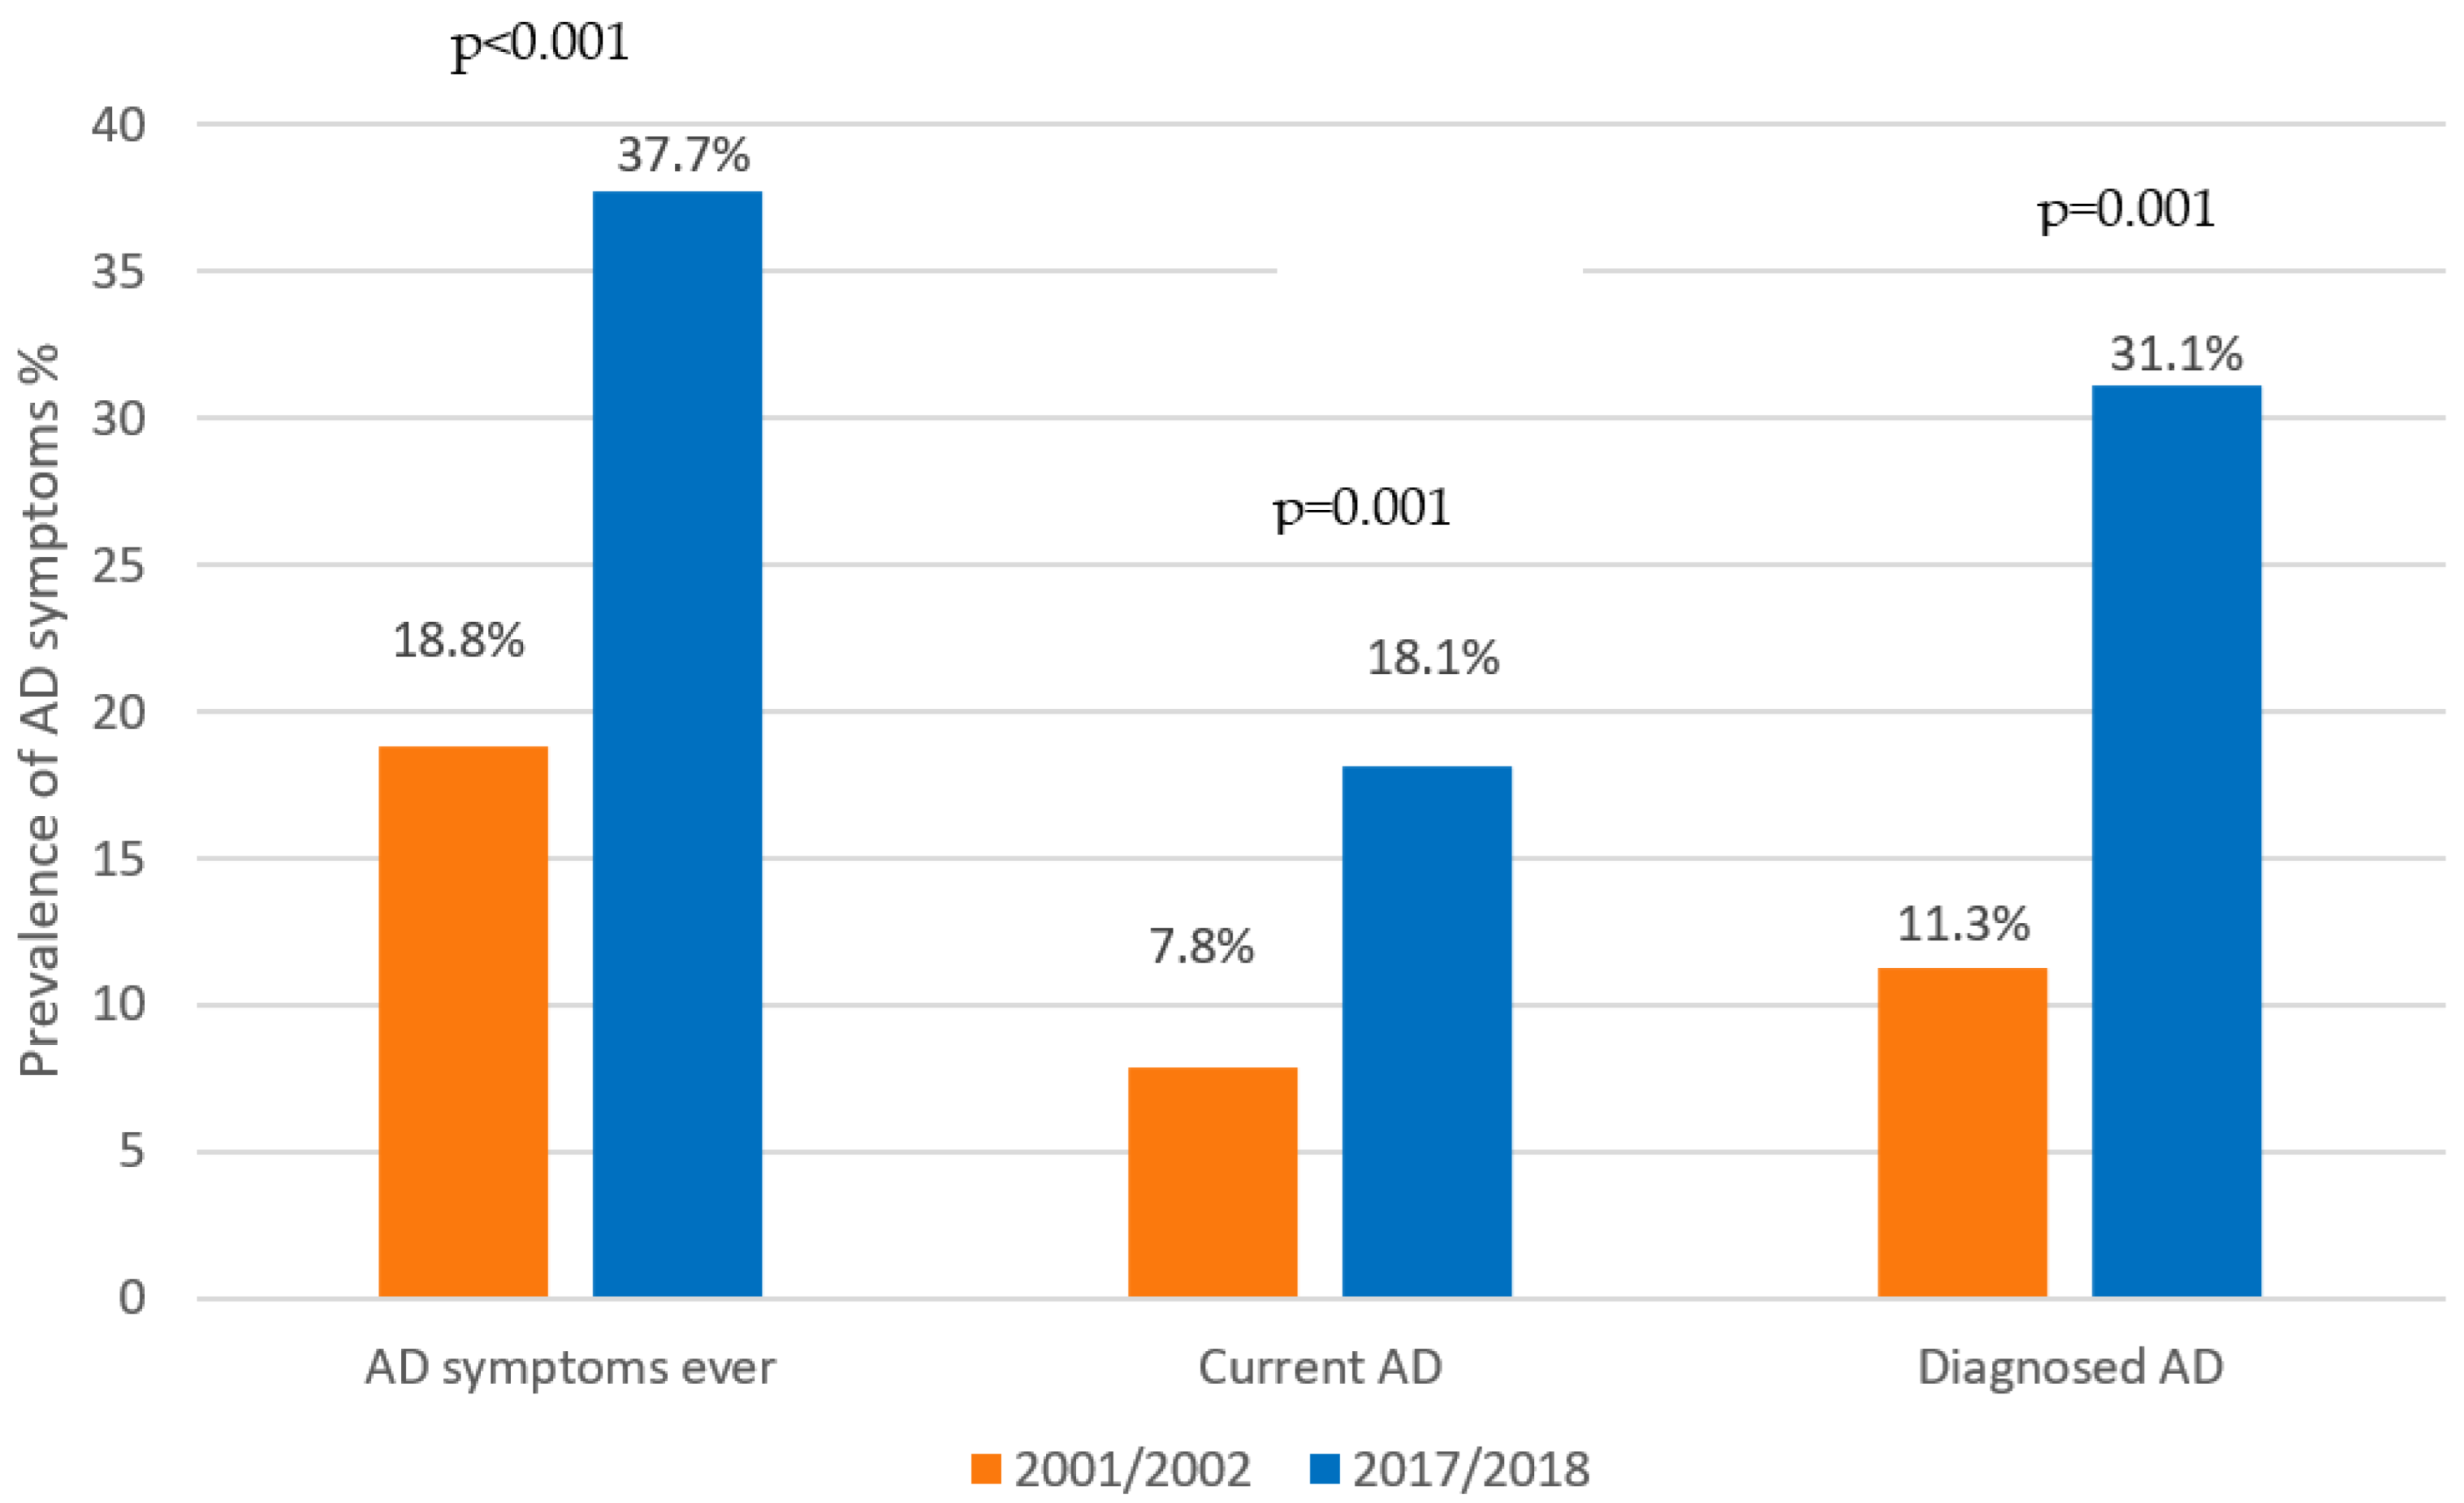
3.2. Current Prevalence of Allergic Symptoms and Comparison with the Year 2002
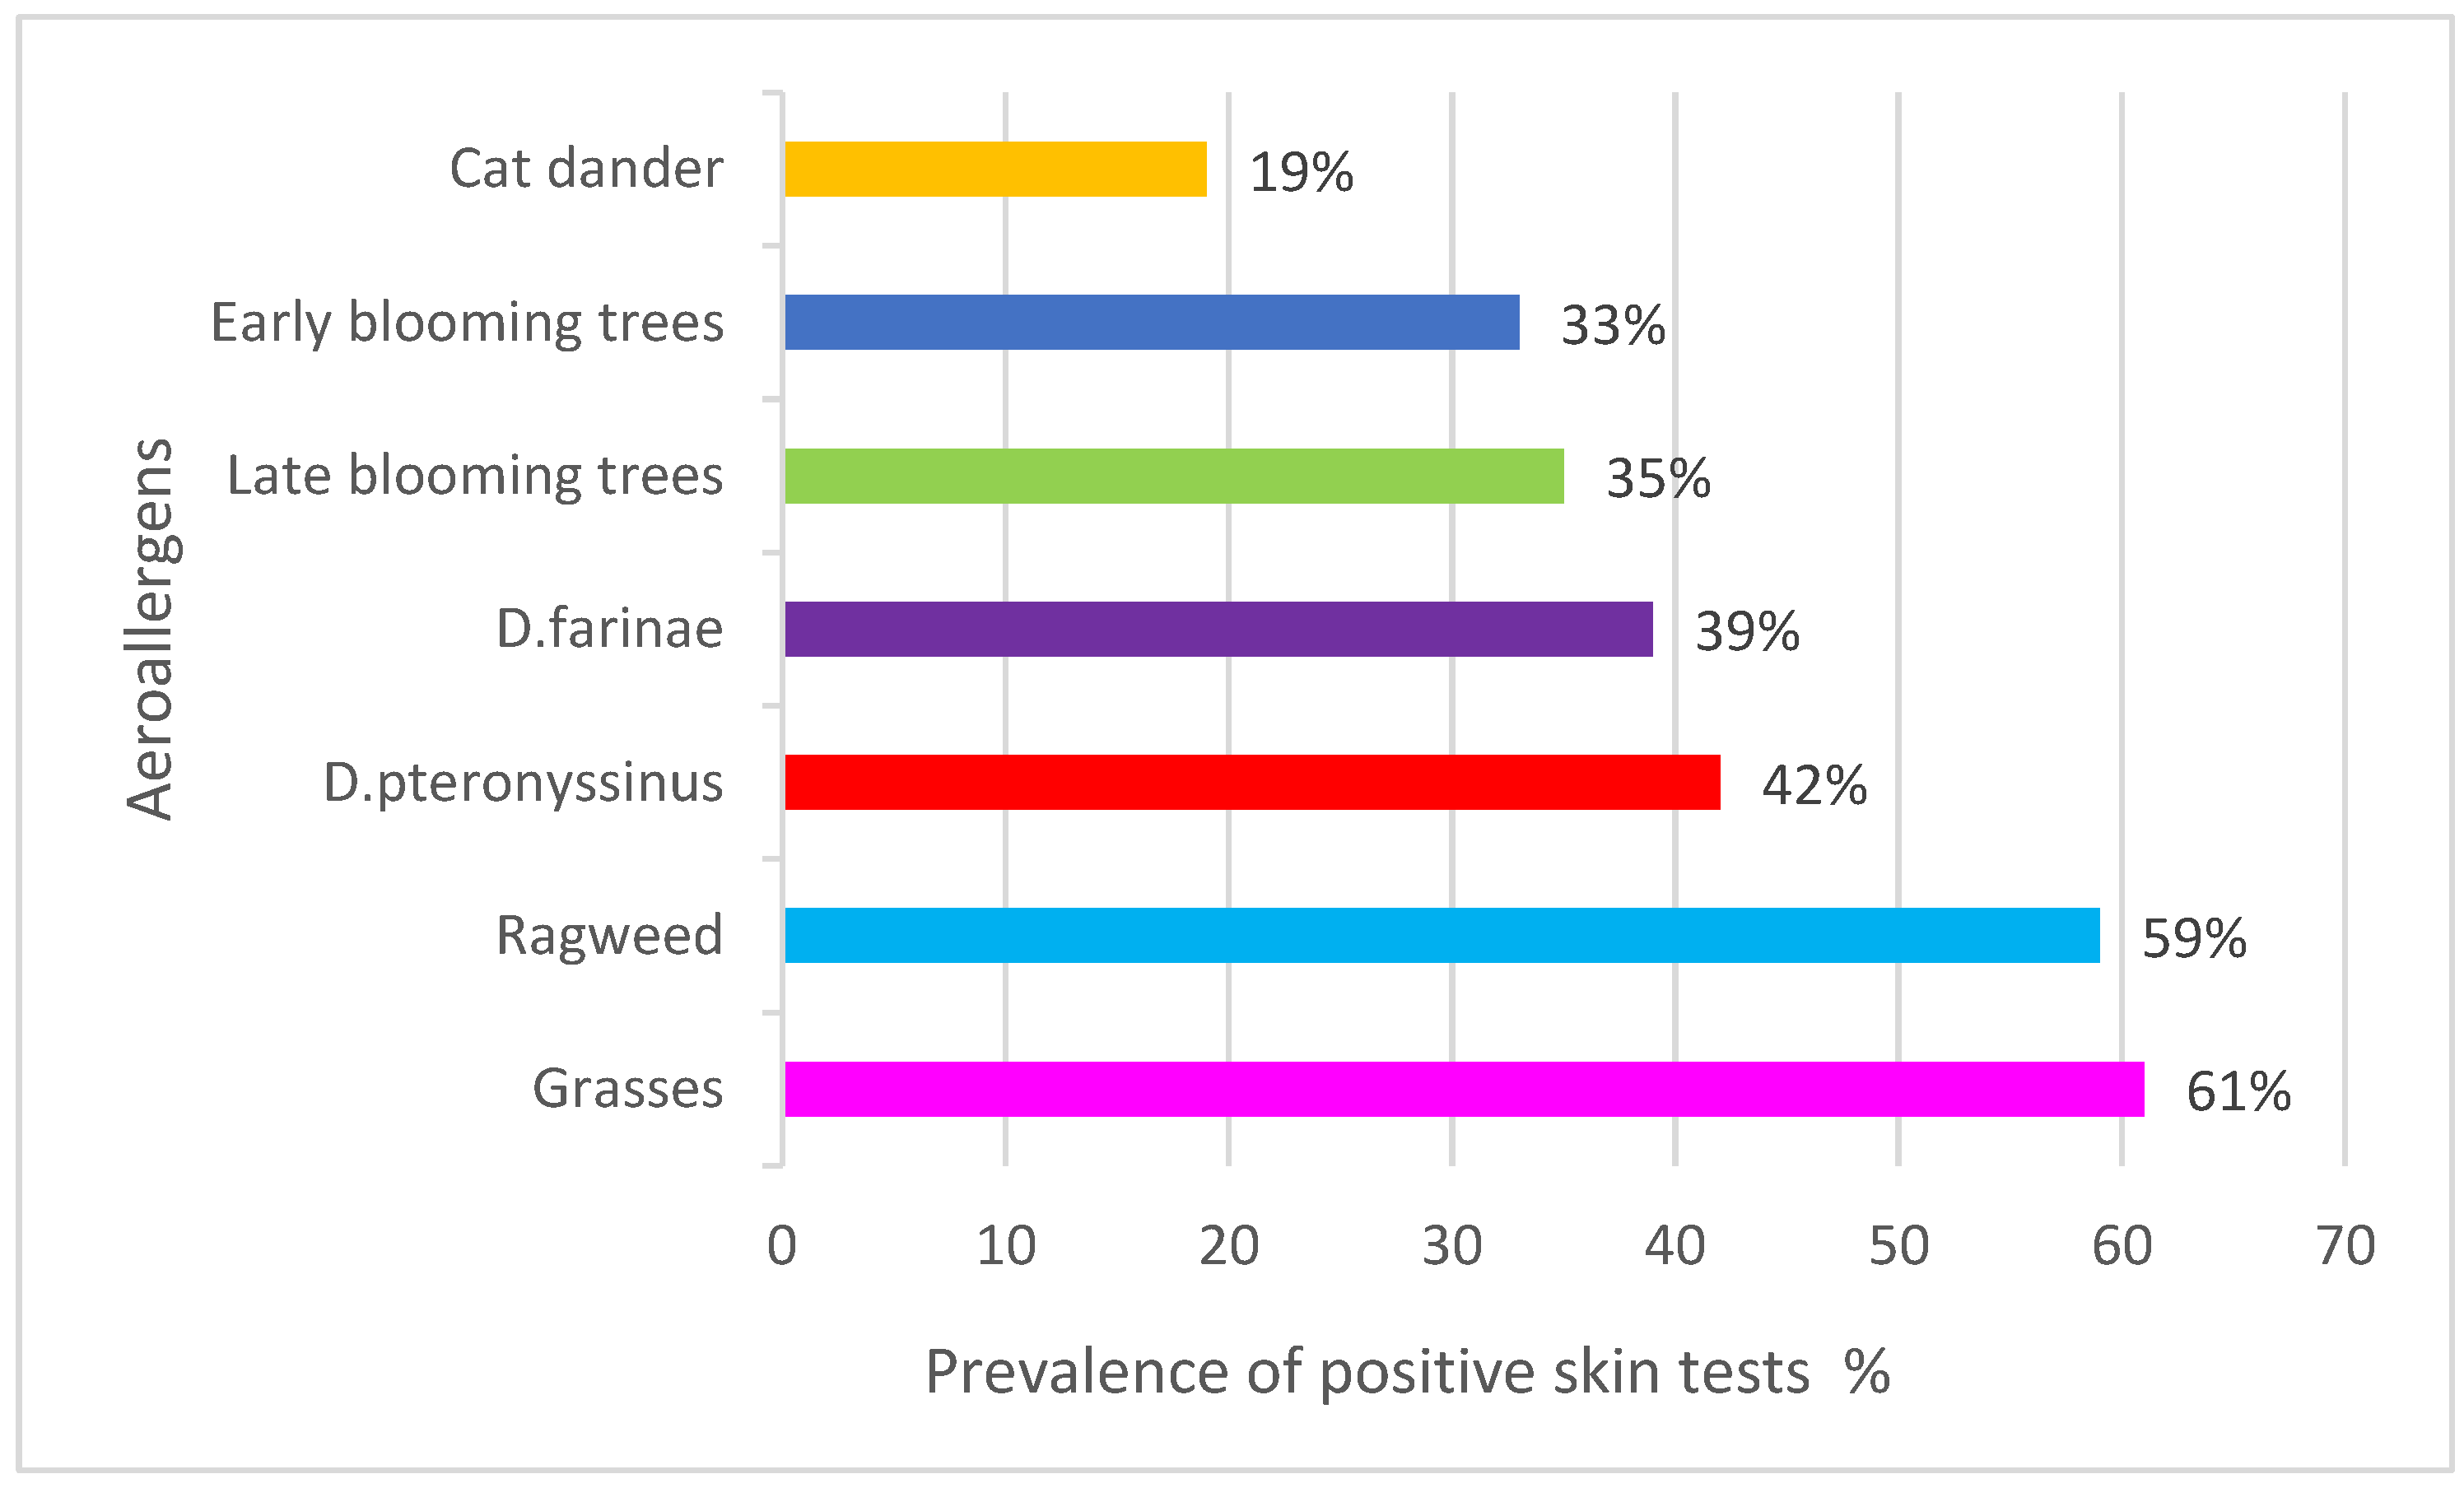
3.3. Skin Sensitivity to Common Aeroallergens
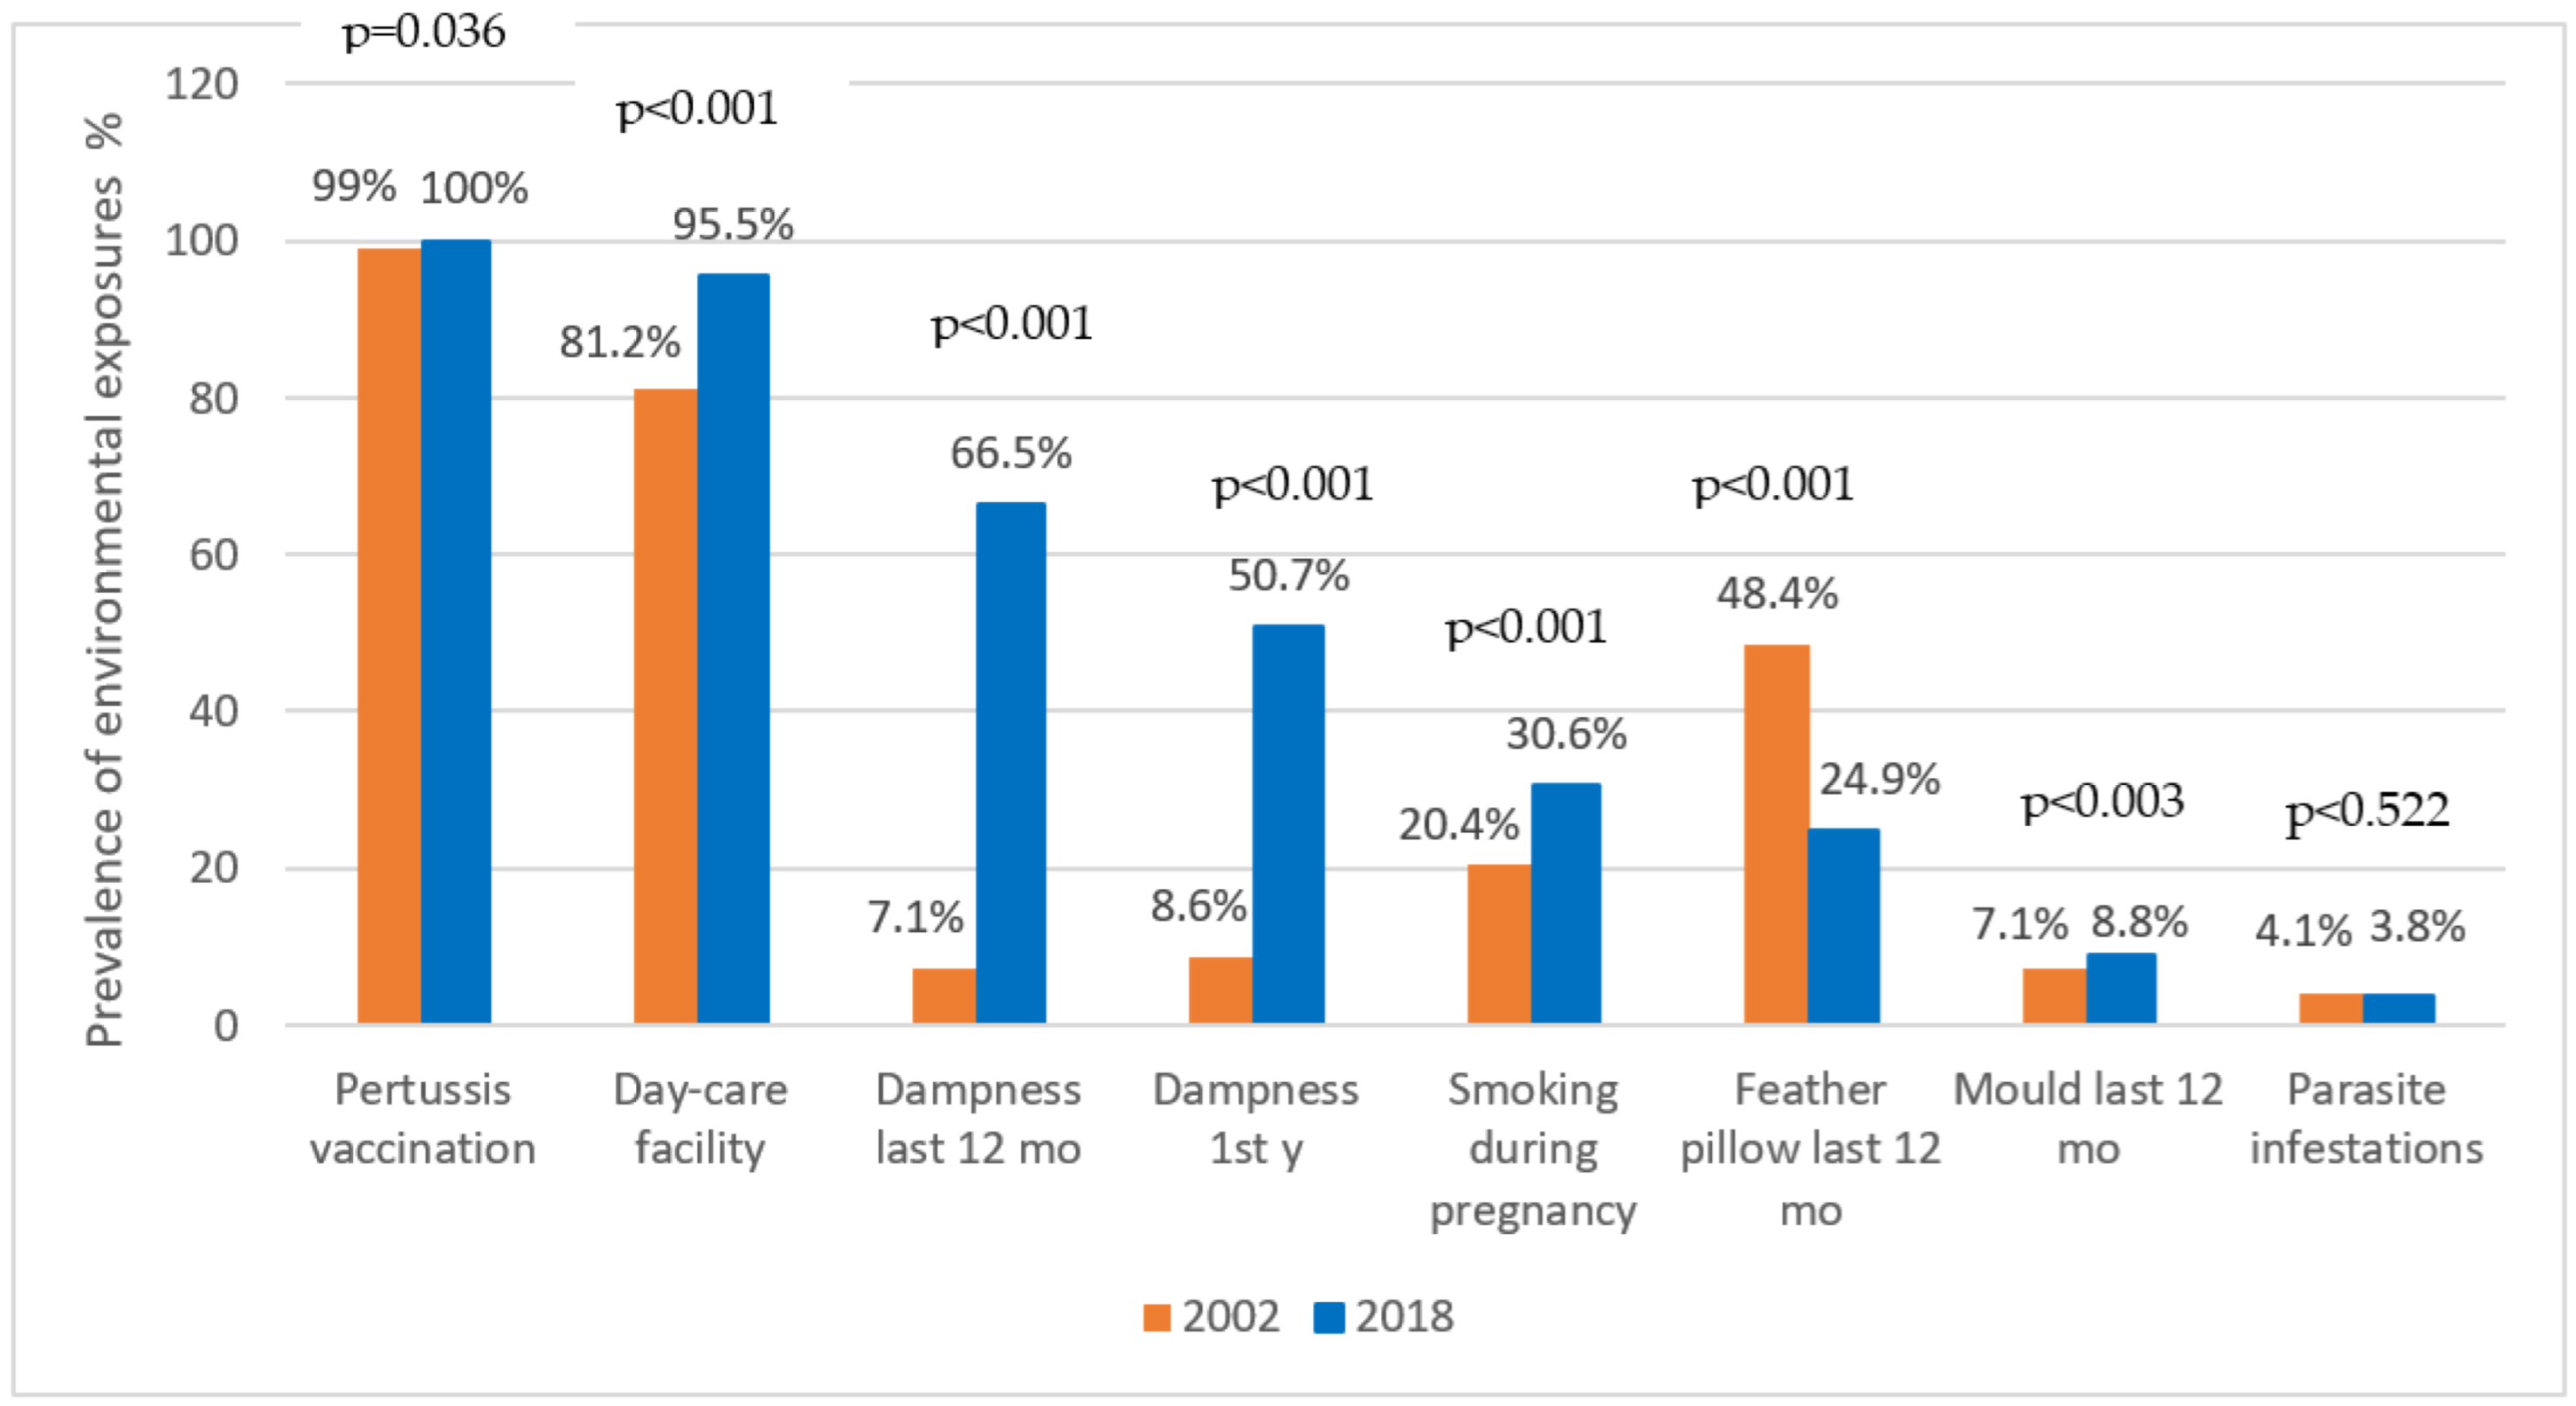
3.4. Environmental Exposure
4. Discussion
5. Conclusions
Author Contributions
Funding
Institutional Review Board Statement
Informed Consent Statement
Data Availability Statement
Conflicts of Interest
References
- Haahtela, T. A biodiversity hypothesis. Allergy 2019, 74, 1445–1456. [Google Scholar] [CrossRef] [PubMed] [Green Version]
- Platts-Mills, T.A. The allergy epidemics: 1870–2010. J. Allergy Clin. Immunol. 2015, 136, 3–13. [Google Scholar] [CrossRef] [PubMed] [Green Version]
- Hossny, E.; Ebisawab, M.; El-Gamala, Y.; Arasic, S.; Dahdahc, L.; El-Owaidy, R.; Galvan, C.A.; Lee, B.W.; Levin, M.; Martinez, S.; et al. Challenges of managing food allergy in the developing world. World Allergy Organ. J. 2019, 12, 100089. [Google Scholar] [CrossRef] [PubMed]
- Rutter, C.E.; Silverwood, R.; Asher, M.; Ellwood, P.; Pearce, N.; Garcia-Marcos, L.; Strachan, D.P. Comparison of individual-level and population-level risk factors for rhinoconjunctivitis, asthma, and eczema in the International Study of Asthma and Allergies in Childhood (ISAAC) Phase Three. World Allergy Organ. J. 2020, 13, 100123. [Google Scholar] [CrossRef] [PubMed]
- Lynch, S.V.; Vercelli, D. Microbiota, Epigenetics, and Trained Immunity. Convergent Drivers and Mediators of the Asthma Trajectory from Pregnancy to Childhood. Am. J. Respir. Crit. Care Med. 2021, 203, 802–808. [Google Scholar] [CrossRef] [PubMed]
- Asher, M.; Keil, U.; Anderson, H.; Beasley, R.; Crane, J.; Martinez, F.; Mitchell, E.; Pearce, N.; Sibbald, B.; Stewart, A.; et al. International Study of Asthma and Allergies in Childhood (ISAAC): Rationale and methods. Eur. Respir. J. 1995, 8, 483–491. [Google Scholar] [CrossRef] [Green Version]
- The International Study of Asthma and Allergies in Childhood (ISAAC) Steering Committee. Worldwide variation in prevalence of symptoms of asthma, allergic rhinoconjunctivitis, and atopic eczema: ISAAC. Lancet 1998, 351, 1225–1232. [Google Scholar] [CrossRef]
- Asher, M.I.; Montefort, S.; Bjorksten, B.; Lai, C.K.; Strachan, D.P.; Weiland, S.K.; Williams, H.; The ISAAC Phase Three Study Group. Worldwide time trends in the prevalence of symptoms of asthma, allergic rhinoconjunctivitis, and eczema in childhood: Isaac phases one and three repeat multicountry cross-sectional surveys. Lancet 2006, 368, 733–743. [Google Scholar] [CrossRef]
- Mallol, J.; Crane, J.; von Mutius, E.; Odhiambo, J.; Keil, U.; Stewart, A. The International Study of Asthma and Allergies in Childhood (ISAAC) Phase Three: A global synthesis. Allergol. Immunopathol. 2013, 4, 73–85. [Google Scholar] [CrossRef] [Green Version]
- Dharmage, S.; Perret, J.L.; Custovic, A. Epidemiology of Asthma in Children and Adults. Front. Pediatr. 2019, 7, 246. [Google Scholar] [CrossRef]
- Brozek, G.; Lawson, J.; Shpakou, A.; Fedortsiv, O.; Hryshchuk, L.; Rennie, D.; Zejda, J. Childhood asthma prevalence and risk factors in three Eastern European countries-the Belarus, Ukraine, Poland Asthma Study (BUPAS): An international prevalence study. BMC Pulm. Med. 2016, 16, 1–11. [Google Scholar] [CrossRef] [PubMed] [Green Version]
- Sultész, M.; Horváth, A.; Molnár, D.; Katona, G.; Mezei, G.; Hirschberg, A.; Gálffy, G. Prevalence of allergic rhinitis, related comorbidities and risk factors in schoolchildren. Allergy Asthma Clin. Immunol. 2020, 16, 98–109. [Google Scholar] [CrossRef] [PubMed]
- Marković, A.S.; Pevec, B.; Pevec, M.R.; Ćustović, A. Prevalence of asthma, allergic rhinitis and conjunctivitis, and atopic eczema symptoms: ISAAC in a population of schoolchildren in Zagreb. Acta Med. Croat. 2003, 57, 281–285. [Google Scholar]
- Marković, A.S.; Čvorišćec, B.; Pevec, B.; Pevec, M.R. Increasing incidence of allergy in Croatia. Rad Med. Sci. 2008, 11, 105–116. [Google Scholar]
- Marković, A.S.; Pevec, B.; Pevec, M.R.; Ćustović, A.; Predović, J. Allergic diseases in relationship with environmental factors in a population of school children in Zagreb, Croatia. Arch. Ind. Hyg. Toxicol. 2004, 55, 221–228. [Google Scholar]
- Marković, A.S.; Pevec, B.; Pevec, M.R.; Turkalj, M.; Zimić, L.; Čvoriščec, B. Skin reactivity to inhalant allergens in Zagreb school children. Period Biol. 2007, 109, 161–164. [Google Scholar]
- Torow, N.; Hornef, M.W. The Neonatal Window of Opportunity: Setting the Stage for Life-Long Host-Microbial Interaction and Immune Homeostasis. J. Immunol. 2017, 198, 557–563. [Google Scholar] [CrossRef] [Green Version]
- Heinzerling, L.; Mari, A.; Bergmann, K.C.; Bresciani, M.; Burbach, G.; Darsow, U.; Durham, S.; Fokkens, W.; Gjomarkaj, M.; Haahtela, T.; et al. The skin prick test–European standards. Clin. Transl. Allergy 2013, 3, 3. [Google Scholar] [CrossRef] [Green Version]
- Brożek, G.; Jankowski, M.; Jarosinska, A.; Zejda, J.; Kocot, K.; Gawlewicz, J.; Lenart, J.; Nowak, M.; Mrowicki, W.; Nowak, B. Prevalence of asthma, respiratory symptoms and allergic diseases in children aged 6–9 in Katowice (Poland). Eur. Respir. J. 2019, 54, PA5071. [Google Scholar] [CrossRef]
- Siroux, V.; Boudier, A.; Nadif, R.; Lupinek, C.; Valenta, R.; Bousquet, J. Association between asthma, rhinitis, and conjunctivitis multimorbidities with molecular IgE sensitization in adults. Allergy 2019, 744, 824–827. [Google Scholar] [CrossRef]
- Simpson, A.; John, S.L.; Jury, F.; Niven, R.; Woodcock, A.; Ollier, W.E.; Custovic, A. Endotoxin exposure, CD14, and allergic disease: An interaction between genes and the environment. Am. J. Respir. Crit. Care Med. 2006, 174, 386–392. [Google Scholar] [CrossRef] [PubMed]
- Celedón, J.C.; Milton, D.K.; Ramsey, C.D.; Litonjua, A.A.; Ryan, L.; Platts-Mills, T.A.; Gold, D.R. Exposure to dust mite allergen and endotoxin in early life and asthma and atopy in childhood. J. Allergy Clin. Immunol. 2007, 120, 144–149. [Google Scholar] [CrossRef] [PubMed] [Green Version]
- Tovey, E.R.; Almqvist, C.; Li, Q.; Crisafulli, D.; Marks, G.B. Nonlinear relationship of mite allergen exposure to mite sensitization and asthma in a birth cohort. J. Allergy Clin. Immunol. 2008, 122, 114–118. [Google Scholar] [CrossRef] [PubMed]
- Illi, S.; von Mutius, E.; Lau, S.; Niggemann, B.; Grüber, C.; Wahn, U.; Multicentre Allergy Study (MAS) Group. Perennial allergen sensitisation early in life and chronic asthma in children: A birth cohort study. Lancet 2006, 368, 763–770. [Google Scholar] [CrossRef] [PubMed]
- Barnish, M.S.; Tagiyeva, N.; Devereux, G.S.; Aucott, L.S.; Turner, S.W. Diverging prevalences and different risk factors for childhood asthma and eczema: A cross-sectional study. BMJ Open 2015, 5, e008446. [Google Scholar] [CrossRef] [Green Version]
- Astma School. Available online: http://www.bolnica-srebrnjak.hr/index.php/en/asthma-school (accessed on 1 January 2020).
- Artuković, M.; Prus, V.; Marković, A.S.; Bukvić, B.K.; Blekić, M. Public Health programs against allergies. In Allergy Week; Croatian Society for Allergology and Clinical Immunology: Zagreb, Croatia, 2018; pp. 13–16. [Google Scholar]
- Ostojic, V.; Cvoriscec, B.; Ostojic, S.B.; Reznikoff, D.; Stipic-Markovic, A.; Tudjman, Z. Improving Asthma Control Through Telemedicine: A Study of Short-Message Service. Telemed. E-Health 2005, 11, 28–35. [Google Scholar] [CrossRef]
- Egulja, S.; Starešina, R.V.; Buljević, D.; Valković, M.Z. Rural vs Urban: Does the place of living make a difference in asthma control among asthmatic children in Croatia? Allergy 2013, 68, 368. [Google Scholar]
- Available online: https://www.stampar.hr/hr/oznake/skola-nepusenja (accessed on 28 May 2020).
- Grgurić, J. New programs for breastfeeding promotion. Paediatr. Croat. 2014, 58, 151–158. [Google Scholar]
- Topalušić, I.; Marković, A.S. Partnership of physicians and pharmacists in asthma control. In Partnership of Family-Care Physicians and Pharmacists in Asthma Control; Croatian Society for Allergology and Clinical Immunology: Zagreb, Croatia, 2015; pp. 9–10. [Google Scholar]
- Pavić, I. Asthma therapeutic options for primary care professionals. In Proceedings of the Second Congress of the Croatian Society for Allergology and Clinical Immunology, Zagreb, Croatia, 6–9 September 2015; p. 30. [Google Scholar]
- Van Schayck, O.C.; Maas, T.; Kaper, J.; Knottnerus, A.J.; Sheikh, A. Is there any role for allergen avoidance in the primary prevention of childhood asthma? J. Allergy Clin. Immunol. 2007, 119, 1323–1328. [Google Scholar] [CrossRef]
- Chan-Yeung, M.; Ferguson, A.C.; Watson, W.; Dimich-Ward, H.; Rousseau, R.; Lilley, M.; DyBuncio, A.; Becker, A. The Canadian Childhood Asthma Primary Prevention Study: Outcomes at 7 years of age. J. Allergy Clin. Immunol. 2005, 116, 49–55. [Google Scholar] [CrossRef]
- Macdonald, C.; Sternberg, A.; Hunter, P.R. A Systematic Review and Meta-Analysis of Interventions Used to Reduce Exposure to House Dust and Their Effect on the Development and Severity of Asthma. Environ. Health Perspect. 2007, 115, 1691–1695. [Google Scholar] [CrossRef] [PubMed] [Green Version]
- Chan-Yeung, M.; Manfreda, J.; Dimich-Ward, H.; Ferguson, A.C.; Watson, W.; Becker, A. A randomized controlled study on the effectiveness of a multifaceted intervention program in the primary prevention of asthma in high-risk infants. Arch. Pediatr. Adolesc. Med. 2000, 154, 657–663. [Google Scholar] [CrossRef] [PubMed] [Green Version]
- Arshad, S.H.; Bateman, B.; Matthews, S.M. Primary prevention of asthma and atopy during childhood by allergen avoidance in infancy: A randomised controlled study. Thorax 2003, 58, 489–493. [Google Scholar] [CrossRef] [PubMed] [Green Version]
- Gao, X.; Yin, M.; Yang, P.; Li, X.; Di, L.; Wang, W.; Cui, H.; Yan, X.; Liu, J. Effect of Exposure to Cats and Dogs on the Risk of Asthma and Allergic Rhinitis: A Systematic Review and Meta-analysis. Am. J. Rhinol. Allergy 2020, 34, 703–714. [Google Scholar] [CrossRef] [PubMed]
- Jhun, I.; Phipatanakul, W. Early exposure to dogs and farm animals reduces risk of childhood asthma. Evid.-Based Med. 2016, 21, 80–82. [Google Scholar] [CrossRef] [PubMed]
- Lodge, C.J.; Allen, K.J.; Lowe, A.J.; Hill, D.J.; Hosking, C.S.; Abramson, M.J.; Dharmage, S.C. Perinatal Cat and Dog Exposure and the Risk of Asthma and Allergy in the Urban Environment: A Systematic Review of Longitudinal Studies. Clin. Dev. Immunol. 2012, 2012, 176484. [Google Scholar] [CrossRef]
- Fall, T.; Ekberg, S.; Lundholm, C.; Fang, F.; Almqvist, C. Dog characteristics and future risk of asthma in children growing up with dogs. Sci. Rep. 2018, 8, 16899. [Google Scholar] [CrossRef] [PubMed] [Green Version]
- Fisk, W.J.; Lei-Gomez, Q.; Mendell, M.J. Meta-analyses of the associations of respiratory health effects with dampness and mold in homes. Indoor Air 2007, 17, 284–296. [Google Scholar] [CrossRef]
- Tischer, C.; Chen, C.-M.; Heinrich, J. Association between domestic mould and mould components, and asthma and allergy in children: A systematic review. Eur. Respir. J. 2011, 38, 812–824. [Google Scholar] [CrossRef] [Green Version]
- Wolf, J.; O’Neill, N.R.; Rogers, C.A.; Muilenberg, M.L.; Ziska, L.H. Elevated Atmospheric Carbon Dioxide Concentrations Amplify Alternaria alternata Sporulation and Total Antigen Production. Environ. Health Perspect. 2010, 118, 1223–1238. [Google Scholar] [CrossRef] [Green Version]
- Burke, H.; Leonardi-Bee, J.; Hashim, A.; Pine-Abata, H.; Chen, Y.; Cook, D.G.; Britton, J.R.; McKeever, T.M. Prenatal and Passive Smoke Exposure and Incidence of Asthma and Wheeze: Systematic Review and Meta-analysis. Pediatrics 2012, 129, 735–744. [Google Scholar] [CrossRef] [PubMed] [Green Version]
- Gasana, J.; Dillikar, D.; Mendy, A.; Forno, E.; Vieira, E.R. Motor vehicle air pollution and asthma in children: A meta-analysis. Environ. Res. 2012, 117, 36–45. [Google Scholar] [CrossRef] [PubMed]
- Su, M.W.; Tung, K.Y.; Liang, P.H.; Tsai, C.H.; Kuo, N.W.; Lee, Y.L. Gene-gene and gene-environmental interactions of childhood asthma: A multifactor dimen-sion reduction approach. PLoS ONE 2012, 7, e30694. [Google Scholar] [CrossRef] [PubMed] [Green Version]
- Hwang, B.-F.; Young, L.-H.; Tsai, C.-H.; Tung, K.-Y.; Wang, P.-C.; Su, M.-W.; Lee, Y.-L. Fine Particle, Ozone Exposure, and Asthma/Wheezing: Effect Modification by Glutathione S-transferase P1 Polymorphisms. PLoS ONE 2013, 8, e52715. [Google Scholar] [CrossRef]
- Ungvári, I.; Hadadi, E.; Virág, V.; Nagy, A.; Kiss, A.; Kalmár, A.; Zsigmond, G.; Semsei, F.; Falus, A.; Szalai, C. Relationship between air pollution, NFE2L2 gene polymorphisms and childhood asthma in a Hungarian population. J. Community Genet. 2012, 3, 25–33. [Google Scholar] [CrossRef] [Green Version]
- Sordillo, J.E.; Kelly, R.; Bunyavanich, S.; McGeachie, M.; Qiu, W.; Croteau-Chonka, D.C.; Soto-Quiros, M.; Avila, L.; Celedón, J.C.; Brehm, J.M.; et al. Genome-wide expression profiles identify potential targets for gene-environment interactions in asthma severity. J. Allergy Clin. Immunol. 2015, 136, 885–892. [Google Scholar] [CrossRef]
- Report on Air Pollution in the City of Zagreb in 2018. Available online: https://eko.zagreb.hr/ (accessed on 1 October 2019).
- Air Quality in the Republic of Croatia. Available online: http://iszz.azo.hr/iskzl/ (accessed on 1 October 2019).
- Myers, J.M.B.; Hershey, G.K.K. Eczema in Early Life: Genetics, the Skin Barrier, and Lessons Learned from Birth Cohort Studies. J. Pediatr. 2010, 157, 704–714. [Google Scholar] [CrossRef] [Green Version]
- Duffy, D.L.; Martin, N.G.; Battistutta, D.; Hopper, J.L.; Mathews, J.D. Genetics of Asthma and Hay Fever in Australian Twins. Am. Rev. Respir. Dis. 1990, 142, 1351–1358. [Google Scholar] [CrossRef] [Green Version]
- Paaso, E.M.; Jaakkola, M.S.; Rantala, A.K.; Hugg, T.T.; Jaakkola, J.J. Allergic diseases and asthma in the family predict the persistence and onset-age of asthma: A prospective cohort study. Respir. Res. 2014, 15, 152. [Google Scholar] [CrossRef] [PubMed] [Green Version]
- Krautenbacher, N.; Kabesch, M.; Horak, E.; Braun-Fahrländer, C.; Genuneit, J.; Boznanski, A.; Von Mutius, E.; Theis, F.; Fuchs, C.; Ege, M.J. Asthma in farm children is more determined by genetic polymorphisms and in non-farm children by environmental factors. Pediatr. Allergy Immunol. 2021, 32, 295–304. [Google Scholar] [CrossRef]
- Ha, J.; Lee, S.W.; Yon, D.K. Ten-Year trends and prevalence of asthma, allergic rhinitis, and atopic dermatitis among the Korean population, 2008–2017. Clin. Exp. Pediatr. 2020, 63, 278–283. [Google Scholar] [CrossRef] [PubMed]
- Zhang, Y.; Zhang, L. Increasing Prevalence of Allergic Rhinitis in China. Allergy Asthma Immunol. Res. 2019, 11, 156–169. [Google Scholar] [CrossRef]
- Wang, X.D.; Zheng, M.; Lou, H.F.; Wang, C.S.; Zhang, Y.; Bo, M.Y.; Ge, S.Q.; Zhang, N.; Zhang, L.; Bachert, C. An increased prevalence of self-reported allergic rhinitis in major Chinese cities from 2005 to 2011. Allergy 2016, 71, 1170–1180. [Google Scholar] [CrossRef] [PubMed] [Green Version]
- Keil, T.; Bockelbrink, A.; Reich, A.; Hoffmann, U.; Kamin, W.; Forster, J.; Schuster, A.; Willich, S.N.; Wahn, U.; Lau, S. The natural history of allergic rhinitis in childhood. Pediatr. Allergy Immunol. 2010, 21, 962–969. [Google Scholar] [CrossRef] [PubMed]
- Grabenhenrich, L.B.; Keil, T.; Reich, A.; Gough, H.; Beschorner, J.; Hoffmann, U.; Bauer, C.-P.; Forster, J.; Schuster, A.; Schramm, D.; et al. Prediction and prevention of allergic rhinitis: A birth cohort study of 20 years. J. Allergy Clin. Immunol. 2015, 136, 932–940.e12. [Google Scholar] [CrossRef]
- Westman, M.; Kull, I.; Lind, T.; Melén, E.; Stjärne, P.; Toskala, E.; Wickman, M.; Bergström, A. The link between parental allergy and offspring allergic and nonallergic rhinitis. Allergy 2013, 68, 1571–1578. [Google Scholar] [CrossRef]
- Vachová, M.; Panzner, P.; Vlas, T.; Vítovcová, P. Analysis of Sensitization Profiles in Central European Allergy Patients Focused on Animal Allergen Molecules. Int. Arch. Allergy Immunol. 2020, 181, 278–284. [Google Scholar] [CrossRef]
- Renand, A.; Archila, L.D.; McGinty, J.; Wambre, E.; Robinson, D.; Hales, B.J.; Thomas, W.R.; Kwok, W.W. Chronic cat allergen exposure induces a T H 2 cell–dependent IgG 4 response related to low sensitization. J. Allergy Clin. Immunol. 2015, 136, 1627–1635.e13. [Google Scholar] [CrossRef] [Green Version]
- Kelly, L.A.; Erwin, E.A.; Platts-Mills, T.A.E. The indoor air and asthma: The role of cat allergens. Curr. Opin. Pulm. Med. 2012, 18, 29–34. [Google Scholar] [CrossRef] [Green Version]
- Liu, J.; Wang, Y.; Liu, S.; Cao, S.; Xu, C.; Zhang, M.; Liu, S. Protocol for a prospective multicenter cross-sectional observational study to investigate the role of air pollution on allergic rhinitis prevalence. Medicine 2020, 99, e19497. [Google Scholar] [CrossRef] [PubMed]
- Ozturk, A.; Bayraktar, R.; Gogebakan, B.; Mumbuc, S.; Bayram, H. Comparison of inflammatory cytokine release from nasal epithelial cells of non-atopic non-rhinitic, allergic rhinitic and polyp subjects and effects of diesel exhaust particles in vitro. Allergol. Immunopathol. 2017, 45, 473–481. [Google Scholar] [CrossRef] [PubMed]
- Koehler, C.; Paulus, M.; Ginzkey, C.; Hackenberg, S.; Scherzad, A.; Ickrath, P.; Hagen, R.; Kleinsasser, N. The Proinflammatory Potential of Nitrogen Dioxide and Its Influence on the House Dust Mite Allergen Der p 1. Int. Arch. Allergy Immunol. 2016, 171, 27–35. [Google Scholar] [CrossRef] [PubMed]
- Horváth, A.; Balásházy, I.; Farkas, A.; Sarkany, Z.; Hofmann, W.; Czitrovszky, A.; Dobos, E. Quantification of airway deposition of intact and fragmented pollens. Int. J. Environ. Health Res. 2011, 21, 427–440. [Google Scholar] [CrossRef] [PubMed]
- Topalušić, I.; Marković, A.S.; Škreb, N. Urban-Rural Gradient of Allergic Rhinitis: A Cross-Sectional Study in Croatian Children. Med. Jadertina 2020, 50, 44. [Google Scholar]
- Keil, A.P.; Buckley, J.P.; O’Brien, K.M.; Ferguson, K.; Zhao, S.; White, A.J. A Quantile-Based g-Computation Approach to Addressing the Effects of Exposure Mixtures. Environ. Health Perspect. 2020, 128, 047004. [Google Scholar] [CrossRef] [PubMed] [Green Version]
- Granum, B.; Oftedal, B.; Agier, L.; Siroux, V.; Bird, P.; Casas, M.; Warembourg, C.; Wright, J.; Chatzi, L.; de Castro, M.; et al. Multiple environmental exposures in early-life and allergy-related outcomes in childhood. Environ. Int. 2020, 144, 106038. [Google Scholar] [CrossRef]
- Krmpotic, D.; Luzar-Stiffler, V.; Rakusic, N.; Markovic, A.S.; Hrga, I.; Pavlovic, M. Effects of Traffic Air Pollution and Hornbeam Pollen on Adult Asthma Hospitalizations in Zagreb. Int. Arch. Allergy Immunol. 2011, 156, 62–68. [Google Scholar] [CrossRef]
- Lemonnier, N.; Melén, E.; Jiang, Y.; Joly, S.; Ménard, C.; Aguilar, D.; Acosta-Perez, E.; Bergström, A.; Boutaoui, N.; Bustamante, M.; et al. A novel whole blood gene expression signature for asthma, dermatitis, and rhinitis multimorbidity in children and adolescents. Allergy 2020, 75, 3248–3260. [Google Scholar] [CrossRef]
- Chereces-Panta, P.; Man, S.C.; Dumitrescu, D.; Mirestean, I.; Iacob, D.; Ichim, G. Epidemiological Survey 6 Years Apart: Increased Prevalence of Asthma and Other Allergic Diseases in Schoolchildren Aged 13–14 Years in Cluj-Napoca, Romania (Based on Isaac Questionnaire). J. Clin. Med. 2011, 6, 10–16. [Google Scholar]
- Roduit, C.; Frei, R.; Depner, M.; Karvonen, A.M.; Renz, H.; Braun-Fahrländer, C.; Schmausser-Hechfellner, E.; Pekkanen, J.; Riedler, J.; Dalphin, J.-C.; et al. Phenotypes of Atopic Dermatitis Depending on the Timing of Onset and Progression in Childhood. JAMA Pediatr. 2017, 171, 655–662. [Google Scholar] [CrossRef]
- Gallay, C.; Meylan, P.; Mermoud, S.; Johannsen, A.; Lang, C.; Rivolta, C.; Christen-Zaech, S. Genetic predisposition and environmental factors associated with the development of atopic dermatitis in infancy: A prospective birth cohort study. Eur. J. Pediatr. 2020, 179, 1367–1377. [Google Scholar] [CrossRef] [PubMed]
- Liang, Y.; Chang, C.; Lu, Q. The Genetics and Epigenetics of Atopic Dermatitis—Filaggrin and Other Polymorphisms. Clin. Rev. Allergy Immunol. 2016, 51, 315–328. [Google Scholar] [CrossRef]
- González-Tarancón, R.; Sanmartín, R.; Lorente, F.; Salvador-Rupérez, E.; Hernández-Martín, A.; Rello, L.; Puzo, J.; Gilaberte, Y. Prevalence of FLG loss-of-function mutations R501X, 2282del4, and R2447X in Spanish children with atopic dermatitis. Pediatr. Dermatol. 2020, 37, 98–102. [Google Scholar] [CrossRef]
- Van den Oord, R.A.H.M.; Sheikh, A. Filaggrin gene defects and risk of developing allergic sensitisation and allergic disorders: Systematic review and meta-analysis. BMJ 2009, 339, b2433. [Google Scholar] [CrossRef] [PubMed] [Green Version]
- Pipinić, I.S.; Varnai, V.M.; Turk, R.; Breljak, D.; Kezić, S.; Macan, J. Low frequency of filaggrin null mutations in Croatia and their relation with allergic diseases. Int. J. Immunogenet. 2013, 3, 192–198. [Google Scholar] [CrossRef] [PubMed]
- Toncic, R.J.; Kezic, S.; Jakasa, I.; Hadzavdic, S.L.; Balic, A.; Petkovic, M.; Pavicic, B.; Zuzul, K.; Marinovic, B. Filaggrin loss-of-function mutations and leels of fillagrin mutations and levels of filaggrin degradation products in adult patients with atopic dermatitis in Croatia. J. Eur. Acad. Dermatol. Venereol. 2020, 34, 1789–1794. [Google Scholar] [CrossRef]
- Guo, Q.; Liang, F.; Tian, L.; Schikowski, T.; Liu, W.; Pan, X. Ambient air pollution and the hospital outpatient visits for eczema and dermatitis in Beijing: A time-stratified case-crossover analysis. Environ. Sci. Process. Impacts 2019, 21, 163–173. [Google Scholar] [CrossRef]
- Woo, Y.; Park, S.-Y.; Choi, K.; Hong, E.; Kim, S.; Kim, H. Air Pollution and Atopic Dermatitis (AD): The Impact of Particulate Matter (PM10) on an AD Mouse-Model. Int. J. Mol. Sci. 2020, 21, 6079. [Google Scholar] [CrossRef]
- Levin, M.E.; Botha, M.; Basera, W.; Facey-Thomas, H.E.; Gaunt, B.; Gray, C.L.; Kiragu, W.; Ramjith, J.; Watkins, A.; Genuneit, J. Environmental factors associated with allergy in urban and rural children from the South African Food Allergy (SAFFA) cohort. J. Allergy Clin. Immunol. 2020, 145, 415–426. [Google Scholar] [CrossRef] [Green Version]
- Ellwood, P.; Asher, M.I.; Garcia-Marcos, L.; Williams, H.; Keil, U.; Robertson, C.; Nagel, G.; the ISAAC Phase III Study Group. Do fast foods cause asthma, rhinoconjunctivitis and eczema? Global findings from the International Study of Asthma and Allergies in Childhood (ISAAC) Phase Three. Thorax 2013, 68, 351–360. [Google Scholar] [CrossRef] [Green Version]
- Paller, A.S.; Spergel, J.M.; Mina-Osorio, P.; Irvine, A.D. The atopic march and atopic multimorbidity: Many trajectories, many pathways. J. Allergy Clin. Immunol. 2019, 143, 46–55. [Google Scholar] [CrossRef] [PubMed]
- Gabryszewski, S.J.; Chang, X.; Dudley, J.W.; Mentch, F.; March, M.; Holmes, J.H.; Moore, J.; Grundmeier, R.W.; Hakonarson, H.; Hill, D.A. Unsupervised modeling and genome-wide association identify novel features of allergic march trajectories. J. Allergy Clin. Immunol. 2021, 147, 677–685.e10. [Google Scholar] [CrossRef] [PubMed]


| Allergic Conditions | |
|---|---|
| Wheezing ever-in-a-lifetime | Has your child ever had wheezing in his life? |
| Current asthma * | Has your child had wheezing during the last 12 months in the absence of a cold? |
| Self-reported diagnosed asthma | Has your child ever had asthma? |
| AR symptoms ever-in-a-lifetime | Has your child ever had a runny nose in the absence of a cold? |
| Current AR * | Has your child had a runny nose without a cold during last 12 months? |
| Self-reported diagnosed AR | Has your child ever had allergic rhinitis? |
| AD symptoms ever-in-a-lifetime | Has your child ever had an itchy rash which was coming and going for at least six months? |
| Current AD * | Has your child had an itchy rash which was coming and going during last 12 months? |
| Self-reported diagnosed AD | Has your child ever had atopic dermatitis? |
| Family History and Environmental Exposure | |
|---|---|
| Mother’s asthma | 20 (4.4%) |
| Mother’s AR | 87 (19.2%) |
| Mother’s AD | 49 (10.2%) |
| Father’s asthma | 25 (5.5%) |
| Father’s AR | 69 (15.2%) |
| Father’s AD | 28 (6.2%) |
| Attending day care | 425 (95.5%) |
| Breastfeeding | 414 (91.8%) |
| Pertussis vaccination | 449 (100%) |
| Parasite infestations | 17 (3.8%) |
| Dog in the 1st year | 42 (9.3%) |
| Dog during the last 12 months | 97 (21.4%) |
| Cat in the 1st year | 31 (6.8%) |
| Cat during the last 12 months | 43 (9.5%) |
| Tobacco smoke during pregnancy | 139 (30.6%) |
| Home dampness in the 1st year | 230 (50.7%) |
| Home dampness during the last 12 months | 302 (66.5%) |
| Mould in the 1st year | 36 (7.9%) |
| Mould during the last 12 months | 40 (8.8%) |
| Feather pillows the last 12 months | 113 (24.9%) |
| Hamburger consumption | |
| Never | 343 (75.5%) |
| <once/week | 65 (14%) |
| 1–2x/week | 40 (8.8%) |
| 3–6x/week | 3 (0.6%) |
| Once/day | 3 (0.6%) |
| Wheezing Ever-in-a-Lifetime | Wheezing during the Last 12 Months | Diagnosed Asthma | AR Ever-in-a-Lifetime | AR during Last 12 Months | Diagnosed AR | AD Ever-in-a-Lifetime | AD during the Last 12 Months | Diagnosed AD | |
|---|---|---|---|---|---|---|---|---|---|
| Mother’s asthma | OR 1.612 95% CI 0.448–5.803, p = 0.465 | OR 1.555, 95% CI 0.041–32.482, p = 0.933 | OR 8.909, 95% CI 0.698–113. 636, p = 0.092 | OR 1.657, 95% CI 0.507–5.418 p = 0.404 | OR 1.488, 95% CI 0.102–21.621, p = 0.771 | OR 2.769 95% CI 0.519–14,772 p = 0.233 | OR 0.637, 95% CI 0.178–2.283, p = 0.489 | OR 0.415, 95% CI 0.079–2.170, p = 0.297 | OR 1.152, 95% CI 0.347–3.824, p = 0.817 |
| Mother’s AR | OR 2.813, 95% CI 1.608–4.921, p = 0.001 | OR 4.167, 95% CI 1.284–13.527, p = 0.018 | OR 3.082, 95% CI 1.178–8.065, p = 0.022 | OR 1.689, 95% CI 1.018–2.803 p = 0.043 | OR 2.354, 95% CI 0.860–6.438 p = 0.095 | OR 2.371 95% CI 1.257–4.473 p = 0.008 | OR 0.941, 95% CI 0.545–1.624, p = 0.827 | OR 1.068, 95% CI 0.493–2.314 p = 0.868 | OR 1.327, 95% CI 0.775–2.273, p = 0.303 |
| Mother’s AD | OR 1.250, 95% CI 0.530–2.947, p = 0.610 | OR 0.483, 95% CI 0.038–6.211, p = 0.577 | OR 0.105, 95% CI 0.010–1.107, p = 0.061 | OR 0.987, 95% CI 0.461–2.112 p = 0.973 | OR 1.323, 95% CI 0.262–6.692 p = 0.735 | OR 0.418 95% CI 0.118–1.481 p = 0.177 | OR 5.124, 95% CI 2.199–11.943, p = 0.001 | OR 1.922, 95% CI 0.749–4.93, p = 0.174 | OR 2.752, 95% CI 1.275–5.943, p = 0.010 |
| Father’s asthma | OR 2.372, 95% CI 0.890–6.327, p = 0.084 | OR 0.516, 95% CI 0.053–5.069, p = 0.570 | OR 2.128, 95% CI 0.506–8.950. p = 0.303 | OR 1.559, 95% CI 0.645–3.767 p = 0.324 | OR 1.433, 95% CI 0.250–8.223 p = 0.686 | OR 1.744 95% CI 0.572–5.315 p = 0.328 | OR 2.516, 95% CI 0.976–6.485 p = 0.056 | OR 0.748, 95% CI 0.205–2.734, p = 0.661 | OR 1.123, 95% CI 0.433–2.912, p = 0.812 |
| Father’s AR | OR 2.527, 95% CI 1.338–4.773, p = 0.004 | OR 1.696, 95% CI 0.397–7.248, p = 0.476 | OR 5.595, 95% CI 2.068–15.132, p = 0.001 | OR 1.497, 95% CI 0.844–2.654 p = 0.167 | OR 1.477, 95% CI 0.512–4.257 p = 0.470 | OR 2.841, 95% CI 1.414–5.706 p = 0.003 | OR 1.983, 95% CI 1.087–3.617, p = 0.026 | OR 1.572, 95% CI 0.703–3.516, p = 0.271 | OR 2.095, 95% CI 1.159–3.787, p = 0.014 |
| Father’s AD | OR 1.547, 95% CI 0.615–3.892, p = 0.354 | OR 0.278, 95% CI 0.028–2.801, p = 0.277 | OR 0.303, 95% CI 0.033–2.755, p = 0.289 | OR 1.140, 95% CI 0.493–2.633 p = 0.759 | OR 1.275, 95% CI 0.282–5.770 p = 0.752 | OR 1.188 95% CI 0.429–3.289 p = 0.740 | OR 2.083, 95% CI 0.849–5.108, p = 0.109 | OR 2.894, 95% CI 0.848–9.878, p = 0.090 | OR 2.362, 95% CI 0.993–5.622, p = 0.052 |
| Attending day care | OR 0.317, 95% CI 0.686–16.038, p = 0.136 | OR 1.098, 95% CI 0.043–28.357, p = 0.955 | OR 0.420, 95% CI 0.070–2.525, p = 0.343 | OR 1.745, 95% CI 0.608–5.004 p = 0.300 | OR 2.182, 95% CI 0.303–15.710, p = 0.439 | OR 4.173 95% CI 0.495–35.129 p = 0.300 | OR 3.033, 95% CI 0.898–10.245, p = 0.074 | OR 0.371, 95% CI 0.047–2.951, p = 0.349 | OR 1.724, 95% CI 0.515–5.768, p = 0.377 |
| Dog in the 1st year | OR 0.834, 95% CI 0.351–1.980, p = 0.680 | OR 7.548, 95% CI 0.989–57.647, p = 0.051 | OR 3.455, 95% 0.988–12.079, p = 0.052 | OR 1.003, 95% CI 0.479–2.100 p = 0.994 | OR 0.853 95% CI 0.172–4.236 p = 0.846 | OR 0.550 95% CI 0.171–1.776 p = 0.318 | OR 0.663, 95% CI 0.289–1.521 p = 0.332 | OR 2.312, 95% CI 0.524–10.199, p = 0.269 | OR 1.001, 95% CI 0.436–2.299, p = 0.998 |
| Dog during the last 12 months | OR 2.033, 95% CI 1.127–3.667, p = 0.018 | OR 0.812, 95% CI 0.208–3.163, p = 0.764 | OR 1.961, 95% CI 0.682–5.639, p = 0.211 | OR 1.200, 95% CI 0.712–2.021 p = 0.493 | OR 1.677 95% CI 0.556–5.052 p = 0.359 | OR 1.441 95% CI 0.707–2.937 p = 0.315 | OR 0.837, 95% CI 0.474–1.478 p = 0.539 | OR 1.545, 95% CI 0.604–3.95, p = 0.364 | OR 0.764, 95% CI 0.425–1.373 p = 0.368 |
| Cat in the 1st year | OR 0.525, 95% CI 0.165–1.673, p = 0.276 | OR 12.273, 95% CI 0.823–183.006, p = 0.069 | OR 0.883, 95% CI 0.148–5.259, p = 0.892 | OR 1.093, 95% CI 0.452–2.640 p = 0.844 | OR 1.880 95% CI 0.406–8.717 p = 0.420 | OR 1.635 95% CI 0.481–5.561 p = 0.431 | OR 0.831, 95% CI 0.312–2.215 p = 0.712 | OR 0.520, 95% CI 0.081–3.345, p = 0.491 | OR 0.792, 95% CI 0.286–2.188, p = 0.652 |
| Cat during the last 12 months | OR 1.446, 95% CI 0.622–3.362, p = 0.392 | OR 1.672, 95% CI 0.256–10.931 p = 0.592 | OR 1.593, 95% CI 0.336–7.540, p = 0.557 | OR 0.737, 95% CI 0.350–1.550 p = 0.421 | OR 0.277 95% CI 0.087–0.883 p = 0.030 | OR 0.892 95% CI 0.307–2.59 p = 0.833 | OR 0.827, 95% CI 0.372–1.836 p = 0.640 | OR 1.500, 95% CI 0.412–5.462, p = 0.539 | OR 1.133, 95% CI 0.515–2.495, p = 0.756 |
| Tobacco smoke during pregnancy | OR 1.253, 95% CI 0.743–2.112, p = 0.398 | OR 0.805, 95% CI 0.207–3.137, p = 0.755 | OR 0.718, 95% CI 0.244–2.114, p = 0.548 | OR 1.235, 95% CI 0.799–1.910 p = 0.343 | OR 1.584, 95% CI 0.659–3.806 p = 0.304 | OR 1.511 95% CI 0.816–2.797 p = 0.189 | OR 0.934, 95% CI 0.586–1.486, p = 0.772 | OR 1.228, 95% CI 0.590–2.557, p = 0.583 | OR 1.073, 95% CI 0.665–1.729, p = 0.773 |
| Home dampness in the 1st year | OR 0.672, 95% CI 0.368–1.226, p = 0.195 | OR 3.734, 95% CI 0.877–15.903 p = 0.075 | OR 1.351, 95% CI 0.417–4.379, p = 0.616 | OR 1.034, 95% CI 0.636–1.678 p = 0.894 | OR 1.015, 95% CI 0.409–2.524 p = 0.974 | OR 1.071 95% CI 0.532–2.158 p = 0.847 | OR 1.314, 95% CI 0.780–2.213, p = 0.304 | OR0.866, 95% CI 0.401–1.968, p = 0.713 | OR 0.942, 95% CI 0.554–1.602, p = 0.827 |
| Home dampness during the last 12 months | OR 0.723, 95% CI 0.394–1.329, p = 0.297 | OR 2.185, 95% CI 0.496–9.628, p = 0.302 | OR 0.649, 95% CI 0.201–2.101, p = 0.471 | OR 1.106, 95% CI 0.660–1.854 p = 0.703 | OR 2.220 95% CI 0.866–5.688 p = 0.097 | OR 1.063 95% CI 0.503–2.245 p = 0.873 | OR 0.748, 95% CI 0.429–1.306, p = 0.307 | OR 1.372, 95% CI 0.595–3.163, p = 0.458 | OR 0.981, 95% CI 0.556–1.733, p = 0.949 |
| Mold in the 1st year | OR 0.889, 95% CI 0.333–2.376, p = 0.814 | OR 14.505, 95% CI 1.076–195.524, p = 0.044 | OR 1.162, 95% CI 0.166–8−148, p = 0.880 | OR 1.098, 95% CI 0.455–2.651 p = 0.836 | OR 3.818 95% CI 0.470–31.025 p = 0.210 | OR 1.909 95% CI 0.542–6.722 p = 0.314 | OR 1.242, 95% CI 0.486–3.173, p = 0.651 | OR 0.315, 95% CI 0.072–1.374, p = 0.124 | OR 0.677, 95 %CI 0.245–1.869, p = 0.451 |
| Mold during the last 12 months | OR 1.242, 95% CI 0.448–3.444, p = 0.667 | OR 2.481, 95% CI 0.280–21.998, p = 0.414 | OR 1.194, 95% CI 0.189–7.523, p= 0.851 | OR 0.908, 95% CI 0.400–2.063 p = 0.818 | OR 0.507 95% CI 0.109–2.349 p = 0.385 | OR 0.402 95% CI 0.106–1.529 p = 0.181 | OR 1.215, 95% CI 0.519–2.846, p = 0.654 | OR 3.067, 95% CI 0.818–11.491, p = 0.096 | OR 1.609, 95% CI 0.672–3.851, p = 0.286 |
Publisher’s Note: MDPI stays neutral with regard to jurisdictional claims in published maps and institutional affiliations. |
© 2022 by the authors. Licensee MDPI, Basel, Switzerland. This article is an open access article distributed under the terms and conditions of the Creative Commons Attribution (CC BY) license (https://creativecommons.org/licenses/by/4.0/).
Share and Cite
Topalušić, I.; Stipić Marković, A.; Artuković, M.; Dodig, S.; Bucić, L.; Lugović Mihić, L. Divergent Trends in the Prevalence of Children’s Asthma, Rhinitis and Atopic Dermatitis and Environmental Influences in the Urban Setting of Zagreb, Croatia. Children 2022, 9, 1788. https://doi.org/10.3390/children9121788
Topalušić I, Stipić Marković A, Artuković M, Dodig S, Bucić L, Lugović Mihić L. Divergent Trends in the Prevalence of Children’s Asthma, Rhinitis and Atopic Dermatitis and Environmental Influences in the Urban Setting of Zagreb, Croatia. Children. 2022; 9(12):1788. https://doi.org/10.3390/children9121788
Chicago/Turabian StyleTopalušić, Iva, Asja Stipić Marković, Marinko Artuković, Slavica Dodig, Lovro Bucić, and Liborija Lugović Mihić. 2022. "Divergent Trends in the Prevalence of Children’s Asthma, Rhinitis and Atopic Dermatitis and Environmental Influences in the Urban Setting of Zagreb, Croatia" Children 9, no. 12: 1788. https://doi.org/10.3390/children9121788