
Associations between Sclerostin and Anthropometric and Metabolic Parameters in Children and Adolescents

 , ,
, ,
Abstract
:1. Introduction
2. Patients and Methods
2.1. Participants
2.2. Anthropometry Measurements
2.3. Laboratory Evaluations
2.4. Statistical Analysis
3. Results
3.1. Clinical Characteristics and Laboratory Data of the Participants
3.2. Associations between Serum Sclerostin Level and Anthropometric Parameters
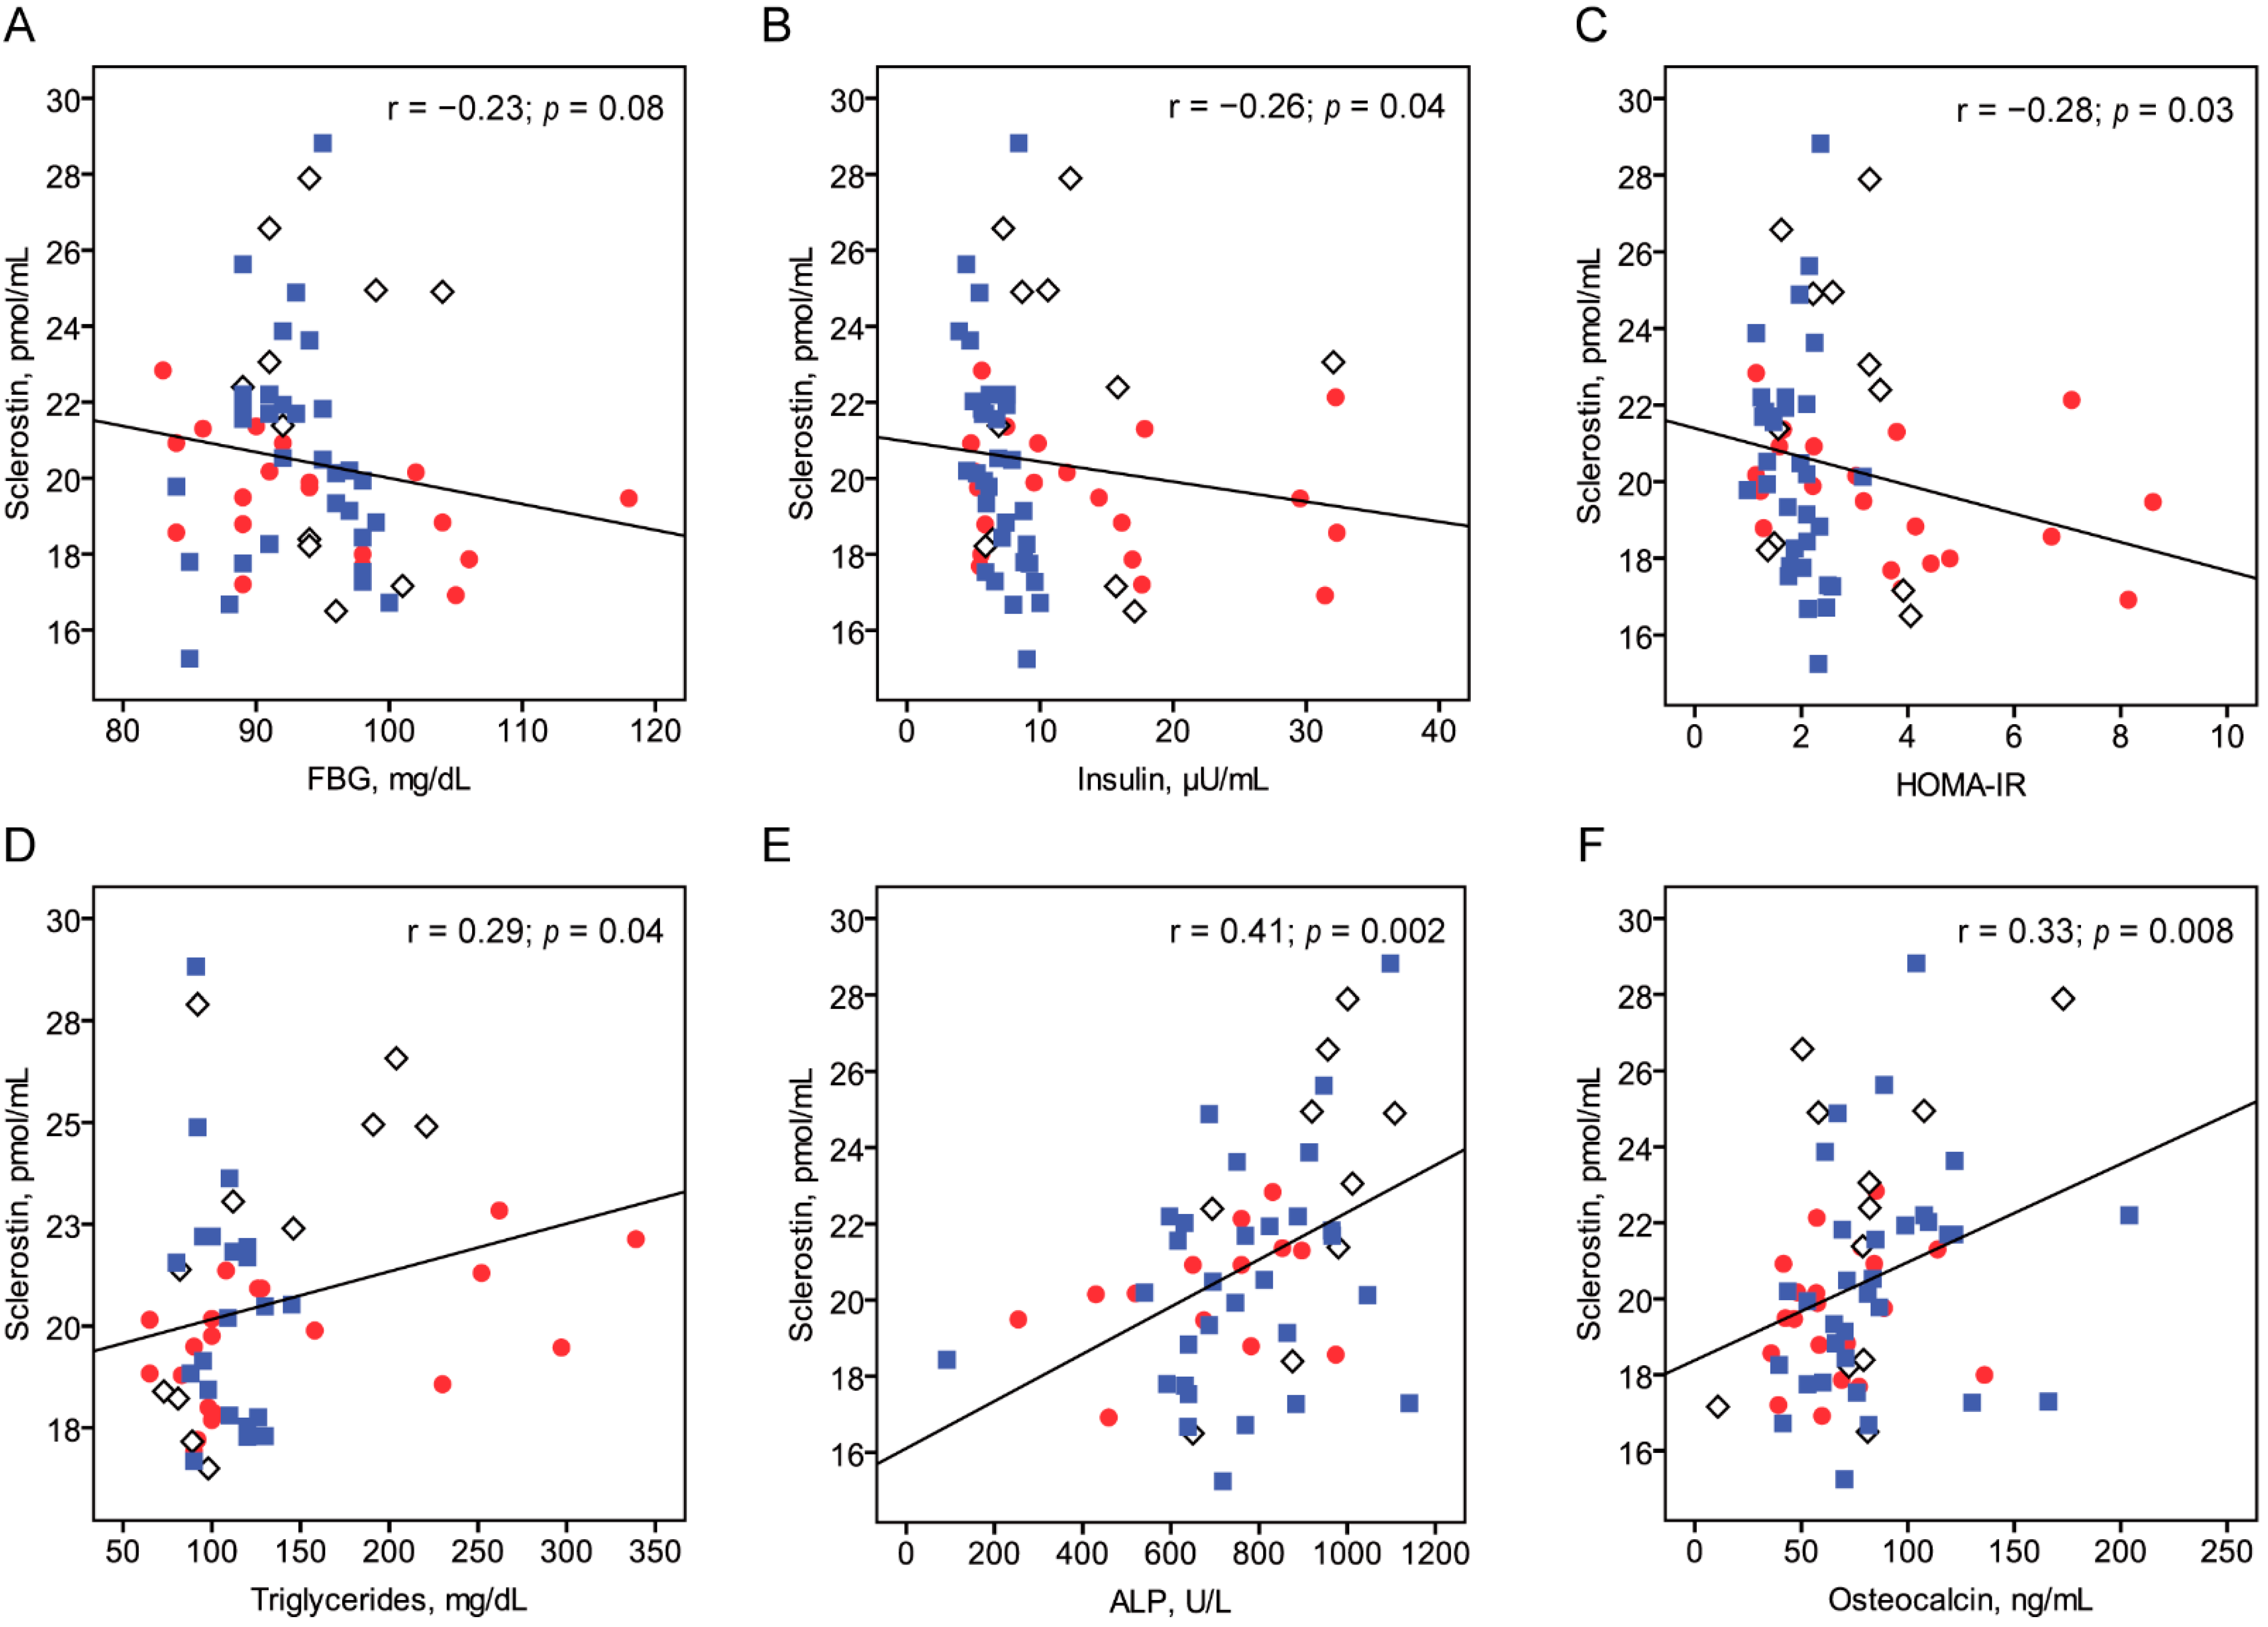
3.3. Association between Serum Sclerostin Level and Metabolic Parameters
4. Discussion
Supplementary Materials
Author Contributions
Funding
Institutional Review Board Statement
Informed Consent Statement
Data Availability Statement
Acknowledgments
Conflicts of Interest
References
- Daniele, G.; Winnier, D.; Mari, A.; Bruder, J.; Fourcaudot, M.; Pengou, Z.; Tripathy, D.; Jenkinson, C.; Folli, F. Sclerostin and Insulin Resistance in Prediabetes: Evidence of a Cross Talk Between Bone and Glucose Metabolism. Diabetes Care 2015, 38, 1509–1517. [Google Scholar] [CrossRef] [Green Version]
- Lee, N.K.; Sowa, H.; Hinoi, E.; Ferron, M.; Ahn, J.D.; Confavreux, C.; Dacquin, R.; Mee, P.J.; McKee, M.D.; Jung, D.Y.; et al. Endocrine Regulation of Energy Metabolism by the Skeleton. Cell 2007, 130, 456–469. [Google Scholar] [CrossRef] [Green Version]
- Baron, R.; Rawadi, G. Targeting the Wnt/β-Catenin Pathway to Regulate Bone Formation in the Adult Skeleton. Endocrinology 2007, 148, 2635–2643. [Google Scholar] [CrossRef] [PubMed] [Green Version]
- Drake, M.T.; Khosla, S. Hormonal and Systemic Regulation of Sclerostin. Bone 2017, 96, 8–17. [Google Scholar] [CrossRef] [Green Version]
- Kim, S.P.; Frey, J.L.; Li, Z.; Kushwaha, P.; Zoch, M.L.; Tomlinson, R.E.; Da, H.; Aja, S.; Noh, H.L.; Kim, J.K.; et al. Sclerostin Influences Body Composition by Regulating Catabolic and Anabolic Metabolism in Adipocytes. Proc. Natl. Acad. Sci. USA 2017, 114, E11238–E11247. [Google Scholar] [CrossRef] [PubMed] [Green Version]
- Delgado-Calle, J.; Sato, A.Y.; Bellido, T. Role and Mechanism of Action of Sclerostin in Bone. Bone 2017, 96, 29–37. [Google Scholar] [CrossRef] [Green Version]
- MacDonald, B.T.; Tamai, K.; He, X. Wnt/β-Catenin Signaling: Components, Mechanisms, and Diseases. Dev. Cell 2009, 17, 9–26. [Google Scholar] [CrossRef] [PubMed] [Green Version]
- Ng, L.; Kaur, P.; Bunnag, N.; Suresh, J.; Sung, I.; Tan, Q.; Gruber, J.; Tolwinski, N. WNT Signaling in Disease. Cells 2019, 8, 826. [Google Scholar] [CrossRef] [Green Version]
- García-Martín, A.; Rozas-Moreno, P.; Reyes-García, R.; Morales-Santana, S.; García-Fontana, B.; García-Salcedo, J.A.; Muñoz-Torres, M. Circulating Levels of Sclerostin Are Increased in Patients with Type 2 Diabetes Mellitus. J. Clin. Endocrinol. Metab. 2012, 97, 234–241. [Google Scholar] [CrossRef] [Green Version]
- Yu, O.H.Y.; Richards, B.; Berger, C.; Josse, R.G.; Leslie, W.D.; Goltzman, D.; Kaiser, S.M.; Kovacs, C.S.; Davison, K.S. The Association between Sclerostin and Incident Type 2 Diabetes Risk: A Cohort Study. Clin. Endocrinol. 2017, 86, 520–525. [Google Scholar] [CrossRef] [PubMed]
- Stanik, J.; Kratzsch, J.; Landgraf, K.; Vogel, M.; Thiery, J.; Kiess, W.; Körner, A. The Bone Markers Sclerostin, Osteoprotegerin, and Bone-Specific Alkaline Phosphatase Are Related to Insulin Resistance in Children and Adolescents, Independent of Their Association with Growth and Obesity. Horm. Res. Paediatr. 2019, 91, 1–8. [Google Scholar] [CrossRef] [PubMed]
- Wędrychowicz, A.; Sztefko, K.; Starzyk, J.B. Sclerostin and Its Association with Insulin Resistance in Children and Adolescents. Bone 2019, 120, 232–238. [Google Scholar] [CrossRef]
- Kim, J.H.; Yun, S.; Hwang, S.; Shim, J.O.; Chae, H.; Lee, Y.; Lee, J.H.; Kim, S.C.; Lim, D.; Yang, S.; et al. The 2017 Korean National Growth Charts for Children and Adolescents: Development, Improvement, and Prospects. Korean J. Pediatr. 2018, 61, 135. [Google Scholar] [CrossRef]
- Pyle, S.I.; Greulich, W.W. Radiographic Atlas of Skeletal Development of the Hand and Wrist; Stanford University Press: Stanford, CA, USA, 1959; ISBN 978-0-8047-0398-7. [Google Scholar]
- Marshall, W.A.; Tanner, J.M. Variations in Pattern of Pubertal Changes in Girls. Arch. Dis. Child. 1969, 44, 291–303. [Google Scholar] [CrossRef] [Green Version]
- American Diabetes Association. Management of Dyslipidemia in Children and Adolescents With Diabetes. Diabetes Care 2003, 26, 2194–2197. [Google Scholar] [CrossRef] [Green Version]
- Expert Panel on Detection, Evaluation, and Treatment of High Blood Cholesterol in Adults. Executive Summary of the Third Report of the National Cholesterol Education Program (NCEP) Expert Panel on Detection, Evaluation, and Treatment of High Blood Cholesterol in Adults (Adult Treatment Panel III). JAMA J. Am. Med. Assoc. 2001, 285, 2486–2497. [Google Scholar] [CrossRef]
- Moran, A.; Jacobs, D.R.; Steinberger, J.; Hong, C.P.; Prineas, R.; Luepker, R.; Sinaiko, A.R. Insulin Resistance during Puberty: Results from Clamp Studies in 357 Children. Diabetes 1999, 48, 2039–2044. [Google Scholar] [CrossRef]
- Rasmussen-Torvik, L.J.; Pankow, J.S.; Jacobs, D.R.; Steffen, L.M.; Moran, A.M.; Steinberger, J.; Sinaiko, A.R. Heritability and Genetic Correlations of Insulin Sensitivity Measured by the Euglycaemic Clamp: Short Report. Diabet. Med. 2007, 24, 1286–1289. [Google Scholar] [CrossRef] [PubMed]
- Schwartz, B.; Jacobs, D.R.; Moran, A.; Steinberger, J.; Hong, C.-P.; Sinaiko, A.R. Measurement of Insulin Sensitivity in Children: Comparison between the Euglycemic-Hyperinsulinemic Clamp and Surrogate Measures. Diabetes Care 2008, 31, 783–788. [Google Scholar] [CrossRef] [Green Version]
- Manley, S.E.; Stratton, I.M.; Clark, P.M.; Luzio, S.D. Comparison of 11 Human Insulin Assays: Implications for Clinical Investigation and Research. Clin. Chem. 2007, 53, 922–932. [Google Scholar] [CrossRef] [PubMed] [Green Version]
- Tagi, V.M.; Giannini, C.; Chiarelli, F. Insulin Resistance in Children. Front. Endocrinol. 2019, 10, 342. [Google Scholar] [CrossRef] [PubMed] [Green Version]
- Levy-Marchal, C.; Arslanian, S.; Cutfield, W.; Sinaiko, A.; Druet, C.; Marcovecchio, M.L.; Chiarelli, F. Insulin Resistance in Children: Consensus, Perspective, and Future Directions. J. Clin. Endocrinol. Metab. 2010, 95, 5189–5198. [Google Scholar] [CrossRef] [PubMed] [Green Version]
- Urano, T.; Shiraki, M.; Ouchi, Y.; Inoue, S. Association of Circulating Sclerostin Levels with Fat Mass and Metabolic Disease—Related Markers in Japanese Postmenopausal Women. J. Clin. Endocrinol. Metab. 2012, 97, E1473–E1477. [Google Scholar] [CrossRef] [Green Version]
- Fairfield, H.; Rosen, C.J.; Reagan, M.R. Connecting Bone and Fat: The Potential Role for Sclerostin. Curr. Mol. Biol. Rep. 2017, 3, 114–121. [Google Scholar] [CrossRef]
- Mödder, U.I.; Hoey, K.A.; Amin, S.; McCready, L.K.; Achenbach, S.J.; Riggs, B.L.; Melton, L.J.; Khosla, S. Relation of Age, Gender, and Bone Mass to Circulating Sclerostin Levels in Women and Men. J. Bone Miner. Res. 2011, 26, 373–379. [Google Scholar] [CrossRef] [Green Version]
- Kirmani, S.; Amin, S.; McCready, L.K.; Atkinson, E.J.; Melton, L.J.; Müller, R.; Khosla, S. Sclerostin Levels during Growth in Children. Osteoporos. Int. 2012, 23, 1123–1130. [Google Scholar] [CrossRef] [Green Version]
- Kanbur, N.Ö.; Derman, O.; Kınık, E. The Relationships between Pubertal Development, IGF-1 Axis, and Bone Formation in Healthy Adolescents. J. Bone Min. Metab. 2004, 23, 76–83. [Google Scholar] [CrossRef] [PubMed]
- Wędrychowicz, A.; Sztefko, K.; Starzyk, J.B. Sclerostin and Its Significance for Children and Adolescents with Type 1 Diabetes Mellitus (T1D). Bone 2019, 120, 387–392. [Google Scholar] [CrossRef]
- Kanazawa, I. Osteocalcin as a Hormone Regulating Glucose Metabolism. World J. Diabetes 2015, 6, 1345–1354. [Google Scholar] [CrossRef]
- Wang, J.S.; Mazur, C.M.; Wein, M.N. Sclerostin and Osteocalcin: Candidate Bone-Produced Hormones. Front. Endocrinol. 2021, 12, 584147. [Google Scholar] [CrossRef] [PubMed]
- D’Onofrio, L.; Maddaloni, E.; Buzzetti, R. Osteocalcin and Sclerostin: Background Characters or Main Actors in Cardiovascular Disease? Diabetes/Metab. Res. Rev. 2020, 36, e3217. [Google Scholar] [CrossRef]
- Dimitri, P.; Jacques, R.M.; Paggiosi, M.; King, D.; Walsh, J.; Taylor, Z.A.; Frangi, A.F.; Bishop, N.; Eastell, R. Leptin May Play a Role in Bone Microstructural Alterations in Obese Children. J. Clin. Endocrinol. Metab. 2015, 100, 594–602. [Google Scholar] [CrossRef] [PubMed]
- Gajewska, J.; Ambroszkiewicz, J.; Klemarczyk, W.; Chełchowska, M.; Weker, H.; Szamotulska, K. The Effect of Weight Loss on Body Composition, Serum Bone Markers, and Adipokines in Prepubertal Obese Children after 1-Year Intervention. Endocr. Res. 2018, 43, 80–89. [Google Scholar] [CrossRef] [PubMed]
- Amrein, K.; Amrein, S.; Drexler, C.; Dimai, H.P.; Dobnig, H.; Pfeifer, K.; Tomaschitz, A.; Pieber, T.R.; Fahrleitner-Pammer, A. Sclerostin and Its Association with Physical Activity, Age, Gender, Body Composition, and Bone Mineral Content in Healthy Adults. J. Clin. Endocrinol. Metab. 2012, 97, 148–154. [Google Scholar] [CrossRef] [Green Version]
- Jürimäe, J.; Karvelyte, V.; Remmel, L.; Tamm, A.-L.; Purge, P.; Gruodyte-Raciene, R.; Kamandulis, S.; Maasalu, K.; Gracia-Marco, L.; Tillmann, V. Serum Sclerostin Concentration Is Associated with Specific Adipose, Muscle and Bone Tissue Markers in Lean Adolescent Females with Increased Physical Activity. J. Pediatr. Endocrinol. Metab. 2021, 34, 755–761. [Google Scholar] [CrossRef]
- Strollo, R.; Soare, A.; Manon Khazrai, Y.; Di Mauro, A.; Palermo, A.; Del Toro, R.; Fallucca, S.; Giovanna Belluomo, M.; Dugo, L.; Pianesi, M.; et al. Increased Sclerostin and Bone Turnover after Diet-Induced Weight Loss in Type 2 Diabetes: A Post Hoc Analysis of the MADIAB Trial. Endocrine 2017, 56, 667–674. [Google Scholar] [CrossRef] [PubMed]


| Characteristic | All Subjects (n = 63) | Obese (n = 20) | Overweight (n = 11) | Control (n = 32) | p Value | |
|---|---|---|---|---|---|---|
| All | Obese vs. Control a | |||||
| Age, years | 10.9 (6.4–17.5) | 10.2 (6.4–17.5) | 10.3 (7.7–16.1) | 11.2 (8.1–14.4) | 0.90 | >0.99 |
| Male sex | 32/63 (50.8) | 13/20 (65.0) | 5/11 (45.5) | 14/32 (43.8) | 0.31 b | 0.41 b |
| Height SDS | 0.57 (−1.28–2.85) | 1.06 (−0.83–2.85) | 1.00 (−0.05–2.25) | −0.56 (−1.28–2.34) | <0.001 | 0.001 |
| BMI, kg/m2 | 21.0 (13.9–36.0) | 26.8 (21.5–36.0) | 21.6 (18.7–25.5) | 17.9 (13.9–21.9) | <0.001 | <0.001 |
| BMI SDS | 1.02 (−1.91–3.03) | 2.16 (1.70–3.03) | 1.37 (1.02–1.63) | 0.06 (−1.91–0.93) | <0.001 | <0.001 |
| Puberty | 39/63 (61.9) | 10/20 (50.0) | 8/11 (72.7) | 21/32 (65.6) | 0.38 b | 0.79 b |
| Fasting glucose, mg/dL | 93 (83–118) | 92 (83–118) | 94 (89–104) | 93 (84–100) | 0.60 | >0.99 |
| Fasting insulin, μU/mL | 7.5 (3.9–32.3) | 10.9 (4.8–32.3) | 10.6 (5.9–32.0) | 6.7 (3.9–10.0) | 0.005 | 0.051 |
| IGF-1, ng/mL | 286 (85–758) | 209 (85–539) | 329 (195–758) | 279 (137–652) | 0.39 | >0.99 |
| HOMA–IR | 2.1 (1.0–8.6) | 3.4 (1.1–8.6) | 2.6 (1.4–4.1) | 2.0 (1.0–3.2) | 0.01 | 0.03 |
| Total cholesterol, mg/dL b | 180 (120–240) | 190 (151–240) | 169 (122–198) | 168 (120–185) | <0.001 | <0.001 |
| LDL cholesterol, mg/dL c | 105 (71–198) | 125 (76–198) | 91 (71–173) | 96 (88–135) | 0.002 | 0.01 |
| HDL cholesterol, mg/dL c | 50 (32–95) | 47 (36–89) | 45 (32–64) | 51 (35–95) | 0.28 | 0.49 |
| Triglycerides, mg/dL c | 105 (65–339) | 101 (65–339) | 98 (73–221) | 110 (80–145) | 0.82 | >0.99 |
| Dyslipidemia c | 20/52 (38.5) | 12/20 (60.0) | 5/11 (45.5) | 3/21 (14.3) | 0.009 b | 0.007 b |
| ALP, U/L | 765 (92–1141) | 760 (254–974) | 956 (650–1108) | 748 (92–1141) | 0.03 | >0.99 |
| 25-hydroxy vitamin D, ng/mL | 13.1 (5.2–25.1) | 11.9 (5.9–16.1) | 10.8 (5.2–16.7) | 13.8 (6.0–25.1) | 0.08 | 0.24 |
| Osteocalcin, ng/mL | 72.4 (10.8–204.0) | 59.1 (35.8–136.0) | 79.2 (10.8–173.0) | 78.6 (39.5–204.0) | 0.10 | 0.11 |
| Sclerostin, pmol/L | 20.1 (15.2–28.8) | 19.6 (16.9–22.8) | 22.4 (16.5–27.9) | 20.2 (15.2–28.8) | 0.25 | >0.99 |
| Variable | All Subjects (n = 63) | Obese (n = 20) | Overweight (n = 11) | Control (n = 32) | ||||
|---|---|---|---|---|---|---|---|---|
| r | p Value | r | p Value | r | p Value | r | p Value | |
| Chronological age, years | 0.11 | 0.40 | −0.002 | 0.99 | 0.26 | 0.45 | 0.22 | 0.23 |
| Bone age, years | 0.25 | 0.06 | 0.20 | 0.43 | 0.95 | <0.001 | 0.21 | 0.26 |
| Height SDS | 0.22 | 0.09 | 0.50 | 0.02 | 0.34 | 0.31 | 0.05 | 0.80 |
| BMI SDS | −0.001 | >0.99 | 0.29 | 0.21 | −0.26 | 0.43 | 0.06 | 0.74 |
| Variable | All Subjects (n = 63) | Obese (n = 20) | Overweight (n = 11) | Control (n = 32) | ||||
|---|---|---|---|---|---|---|---|---|
| r | p Value | r | p Value | r | p Value | r | p Value | |
| HbA1C | 0.05 | 0.79 | 0.18 | 0.45 | 0.16 | 0.64 | −0.46 | 0.35 |
| Fasting glucose, mg/dL | −0.23 | 0.08 | −0.49 | 0.03 | −0.21 | 0.54 | −0.20 | 0.28 |
| Fasting insulin, μU/mL | −0.26 | 0.04 | −0.21 | 0.38 | −0.02 | 0.96 | −0.61 | <0.001 |
| IGF-1, ng/mL | 0.15 | 0.36 | −0.32 | 0.48 | 0.43 | 0.24 | 0.14 | 0.54 |
| HOMA–IR | −0.28 | 0.03 | −0.48 | 0.03 | −0.13 | 0.71 | −0.36 | 0.04 |
| Total cholesterol, mg/dL a | −0.10 | 0.50 | 0.31 | 0.19 | −0.40 | 0.23 | −0.15 | 0.51 |
| LDL cholesterol, mg/dL a | −0.01 | 0.92 | 0.30 | 0.19 | −0.14 | 0.69 | 0.17 | 0.48 |
| HDL cholesterol, mg/dL a | −0.15 | 0.28 | −0.002 | 0.99 | −0.39 | 0.23 | −0.37 | 0.10 |
| Triglycerides, mg/dL a | 0.29 | 0.04 | 0.53 | 0.02 | 0.58 | 0.06 | −0.24 | 0.30 |
| ALP, U/L | 0.41 | 0.002 | 0.30 | 0.31 | 0.55 | 0.13 | 0.26 | 0.16 |
| Osteocalcin, ng/mL | 0.33 | 0.008 | 0.19 | 0.43 | 0.36 | 0.29 | 0.34 | 0.06 |
| 25-hydroxy vitamin D, ng/mL | −0.04 | 0.76 | −0.32 | 0.17 | 0.13 | 0.73 | −0.02 | 0.91 |
| Variable | All Subjects (n = 63) | Obese (n = 20) | Control (n = 32) | |||
|---|---|---|---|---|---|---|
| r | p Value | r | p Value | r | p Value | |
| HbA1C | −0.05 | 0.76 | 0.01 | 0.97 | −0.53 | 0.36 |
| Fasting glucose, mg/dL | −0.23 | 0.09 | −0.50 | 0.04 | −0.22 | 0.28 |
| Fasting insulin, μU/mL | −0.38 | 0.003 | −0.38 | 0.13 | −0.67 | <0.001 |
| IGF-1, ng/mL | 0.12 | 0.51 | −0.19 | 0.81 | 0.03 | 0.90 |
| HOMA–IR | −0.39 | 0.003 | −0.60 | 0.01 | −0.39 | 0.047 |
| Total cholesterol, mg/dL b | −0.19 | 0.20 | 0.28 | 0.28 | −0.05 | 0.85 |
| LDL cholesterol, mg/dL b | −0.12 | 0.41 | 0.32 | 0.21 | 0.05 | 0.84 |
| HDL cholesterol, mg/dL b | −0.12 | 0.42 | −0.08 | 0.76 | −0.39 | 0.12 |
| Triglycerides, mg/dL b | 0.22 | 0.14 | 0.35 | 0.17 | −0.33 | 0.19 |
| ALP, U/L | 0.36 | 0.01 | 0.03 | 0.94 | 0.24 | 0.25 |
| Osteocalcin, ng/mL | 0.36 | 0.006 | 0.14 | 0.60 | 0.31 | 0.12 |
| 25-hydroxy vitamin D, ng/mL | 0.11 | 0.42 | −0.13 | 0.61 | 0.06 | 0.77 |
Publisher’s Note: MDPI stays neutral with regard to jurisdictional claims in published maps and institutional affiliations. |
© 2021 by the authors. Licensee MDPI, Basel, Switzerland. This article is an open access article distributed under the terms and conditions of the Creative Commons Attribution (CC BY) license (https://creativecommons.org/licenses/by/4.0/).
Share and Cite
Kim, S.-H.; Choi, Y.J.; Ahn, M.B.; Cho, W.K.; Cho, K.S.; Jung, M.H.; Suh, B.-K. Associations between Sclerostin and Anthropometric and Metabolic Parameters in Children and Adolescents. Children 2021, 8, 788. https://doi.org/10.3390/children8090788
Kim S-H, Choi YJ, Ahn MB, Cho WK, Cho KS, Jung MH, Suh B-K. Associations between Sclerostin and Anthropometric and Metabolic Parameters in Children and Adolescents. Children. 2021; 8(9):788. https://doi.org/10.3390/children8090788
Chicago/Turabian StyleKim, Shin-Hee, Yun Jung Choi, Moon Bae Ahn, Won Kyoung Cho, Kyoung Soon Cho, Min Ho Jung, and Byung-Kyu Suh. 2021. "Associations between Sclerostin and Anthropometric and Metabolic Parameters in Children and Adolescents" Children 8, no. 9: 788. https://doi.org/10.3390/children8090788