
Fractures in Children Due to Firearm Activity

1
Department of Orthopaedic Surgery, Riley Children’s Hospital, Indiana University School of Medicine, Indianapolis, IN 46202, USA
2
Division of Student Affairs, Indiana University School of Medicine, Indianapolis, IN 46202, USA
*
Author to whom correspondence should be addressed.
Children 2023, 10(4), 651; https://doi.org/10.3390/children10040651
Submission received: 30 January 2023
/
Revised: 16 March 2023
/
Accepted: 27 March 2023
/
Published: 30 March 2023
(This article belongs to the Special Issue Research in Paediatric Orthopaedic Surgery)
Abstract
:The purpose of this study was to investigate fracture patterns due to pediatric firearm injuries. The data used was from the US Firearm Injury Surveillance Study 1993–2019. Over these 27 years, there were 19,033 children with fractures due to firearm activity with an average age of 12.2 years; 85.2% were boys and the firearm was a powder type in 64.7%. The finger was the most common fracture location, while the tibia/fibula was the most common location for those admitted to the hospital. Children ≤ 5 years of age sustained more skull/face fractures; most spine fractures occurred in the 11–15-year age group. The injury was self-inflicted in 65.2% of the non-powder and 30.6% of the powder group. The injury intent was an assault in 50.0% of the powder and 3.7% of the non-powder firearm group. Powder firearms accounted for the majority of the fractures in the ≤5 and 11–15 year-olds, non-powder firearms accounted for the majority of the fractures in the 6–10 year-olds. Injuries occurring at home decreased with increasing age; there was an increase in hospital admissions over time. In conclusion, our findings support the need for safe storage of firearms in the home away from children. This data will be helpful to assess any changes in prevalence or demographics with future firearm legislation or other prevention programs. The increasing acuity of firearm-associated injuries seen in this study is detrimental to the child, impacts familial wellbeing, and results in significant financial costs to society.
1. Introduction
Injuries due to firearms are a significant health burden [1,2,3]. Deaths attributed to firearms in the US population are equivalent to those from motor vehicle crashes and falls [2]. Additionally, firearm injuries result in significant societal costs, including both financial damage and loss of human life/work [3,4,5]. These injuries do not occur solely in adults, but also in children [6,7,8,9]. Pediatric firearm injuries result in significant costs to society [6,10,11,12]. Deleterious firearm injuries in children also result in emotional trauma for families due to the loss or injury of a child, financial burden [6,7,8,9], and rehabilitation costs, as 8.4% of children with firearm injuries are discharged to a rehabilitation facility [13].
Pediatric orthopaedists are often called upon to care for a child with a fracture arising from a firearm injury [14]. There are several studies regarding firearm injury fracture patterns and associated demographics in children [14,15,16,17,18,19,20,21,22,23,24]. These studies, although informative, are limited in scope by various parameters. For example, some studies only include a certain geographic area [16,19,20,23,24,25], only those admitted to the hospital [14,19,20,24], short time periods [16,17,23,25], or difficult fractures [15,26]. Most are either limited to powder firearms [14,15,16,17,19,20,23,24,25] or non-powder firearms [18] and very few studies mention spine fractures [14,19]. The difference between powder and non-powder firearms is the source of the energy used to project the bullet out of the gun. Powder firearms use the gases from the explosion of the gunpowder, while non-powder firearms use compressed air or other gases. One study covers an entire nation, albeit a small one (Jamaica) [17].
It was the purpose of this study to concentrate on the demographics and fracture patterns of injuries due to firearms in children over a quarter of a century using a national emergency department (ED) visit the database. This will include both those treated and released as well as admitted to the hospital, all areas of the country, and both powder and non-powder firearms. The strength of this study is that it will provide a large overview of pediatric fractures from injuries due to firearm activity, be useful as baseline data for future studies regarding these injuries, and perhaps serve as a guide for injury prevention programs.
2. Materials and Methods
2.1. Data Source
The data for this study was obtained from the Inter-University Consortium for Political and Social Research Firearm Injury Surveillance Study 1993–2020 (ICPSR 38574) (https://www.icpsr.umich.edu/web/NACJD/studies/38574, accessed on 18 December 2022) collected by the National Electronic Injury Surveillance System (NEISS). The NEISS, a branch of the US Consumer Product Safety Commission, collects data from a probability sample of hospitals in the United States and its territories that have at least six beds and an ED. The sample contains five strata, four based on size (the total number of emergency room visits reported by the hospital and are small, medium, large, and very large) and one stratum consisting of children’s hospitals. There are ~100 hospitals in the NEISS, and this number varies slightly from year to year. Patient information is collected daily from each NEISS hospital for every patient treated in the ED due to an injury associated. The ICPSR data set consists of any patient seeking care in the ED for firearm-related injury, regardless of activity involved during the injury (e.g., hunting, committing a crime, suicide, assault), and whether the patient had been shot by the firearm or injured in some other way (e.g., a skull/face fracture from being pistol-whipped, a clavicle fracture from a rifle recoil, etc.). Further details regarding the acquisition of the ICPSR/NEISS data and guidelines for use of such data can be accessed from their respective websites (ICPSR—www.icpsr.umich.edu, NEISS—www.cpsc.gov/library/neiss.html, accessed on 18 December 2022). This study of publicly available de-identified data was considered exempt by our local Institutional Review Board.
The data from 1993 through 2020 was downloaded from the ICPSR website; however, due to changes in injury patterns associated with the COVID pandemic, those data from the year 2020 were excluded [27,28,29,30,31,32], including firearm injuries [33,34,35]. The data includes age, sex, race, type of firearm, the perpetrator of the injury (e.g., self, stranger, etc.), intent of injury (unintentional, assault, suicide, law enforcement), anatomic location of the injury, incident locale (home, street/highway, etc.), disposition from the ED, involvement of drugs/crime/fight/argument in the incident, and was the patient shot or not with the firearm. Race was classified as White, Black, Amerindian (Hispanic and Native American), and Asian [36]. We limited our study to those 15 years or younger. The 16-year-old age limit was used as most patients ≥ 16 years of age demonstrate adult fracture patterns and 16 is when the transition into adult activities, such as driving, begins.
Fractures were identified using two different methods. The first method was to identify fractures using the NEISS diagnosis code of 57, the code for a fracture. As the most serious injury is used to determine the diagnosis by the NEISS, many patients sustained fractures along with more serious injuries, such as a pneumothorax. In order to identify additional fractures, the database column CMTX was utilized; this column is a description of the event where patient identification has been purged by the CDC and CPSC. The database was searched for other fractures using the FIND command in Microsoft Excel™ (Microsoft® Office 365 Apps for enterprise) using the terms fx and frac. To further search for spinal injuries the database was searched using the terms spinal, verte, paral (for paralyzed), spine, cervical, thoracic, parapl and quadri (for paraplegia and quadriplegia), and each vertebral level (e.g., C1, C-1) from C1 through S4. The anatomic location of the fracture was then determined and ranked from the most serious to least serious when there was more than one fracture. Fractures of the spine were classified as the most severe, followed by the skull, pelvis, sternum/ribs, and, finally, the long bones of the appendicular skeleton beginning from proximal to distal respectively. The fracture locations were condensed into 5 major groups: spine, upper extremity, lower extremity (including the pelvis), skull/face, and rib(s).
Patients were separated into 3 groups by age (≤5, 6 through 10, and 11 through 15 years). The 27 years covered in this study were separated into 3 equal groups of 9 years (1993 through 2001, 2002 through 2010, and 2010 through 2019). Finally, we wished to study differences in fracture patterns by assessing if the shooting was a drive-by shooting or not; drive-by shootings were found by searching the database using the FIND command for the terms driveb, drive-by, drive-b, driveth, drive th, and drive-th.
2.2. Statistical Analysis
Statistical analyses were performed with SUDAAN 11.0.01™ software (RTI International, Research Triangle Park, North Carolina, 2013) which accounts for the weighted, stratified nature of the data, giving an estimated number of ED visits, along with 95% confidence intervals (CI) of the estimate N denoted by brackets [ ]. When the actual number of patients (n) is <20, the estimated number (N) becomes unstable and should be interpreted with caution; thus, we report both the n and N. Analyses between groups of continuous data were performed with the t-test (2 groups) or ANOVA (3 or more groups). Differences between groups of categorical data were analyzed by the χ2 test. For all analyses a p < 0.05 was considered statistically significant.
3. Results
Over the 27-year period of 1993 through 2019, there were 111,796 actual ED visits for injuries due to firearms, resulting in an estimated 3,359,809 [2,956,755, 3,744,864] ED visits after appropriate statistical analysis using the weighted data. Of these 3.36 million ED visits, an estimated 434,458 [356,526, 526,747] (13.0%) were in those <16 years of age. Of these 434,458 ED patients an estimated 19,033 [15,814, 22,852] (4.4%) sustained fractures. Therefore, these 19,033 ED visits comprise this study. From here on, only the estimated number (N) will be given in the manuscript text and used in the figures; both the actual (n) and estimated number (N) of ED visits are given in the Tables.
The average was 12.2 years; 85.2% were boys and the firearm was a powder type in 64.7%. All the data for the many different variables are given in Table 1.
There were 19,370 fractures in these 19,033 patients. The exact number of fractures was known in 19,011 patients and was 1 in 18,640 (98.05%), 2 in 365 (1.92%), and 3 in 6 (0.03%). The detailed anatomic distributions for all patients as well as two separate groups of those released from the ED and those admitted to the hospital are shown in Table 2.
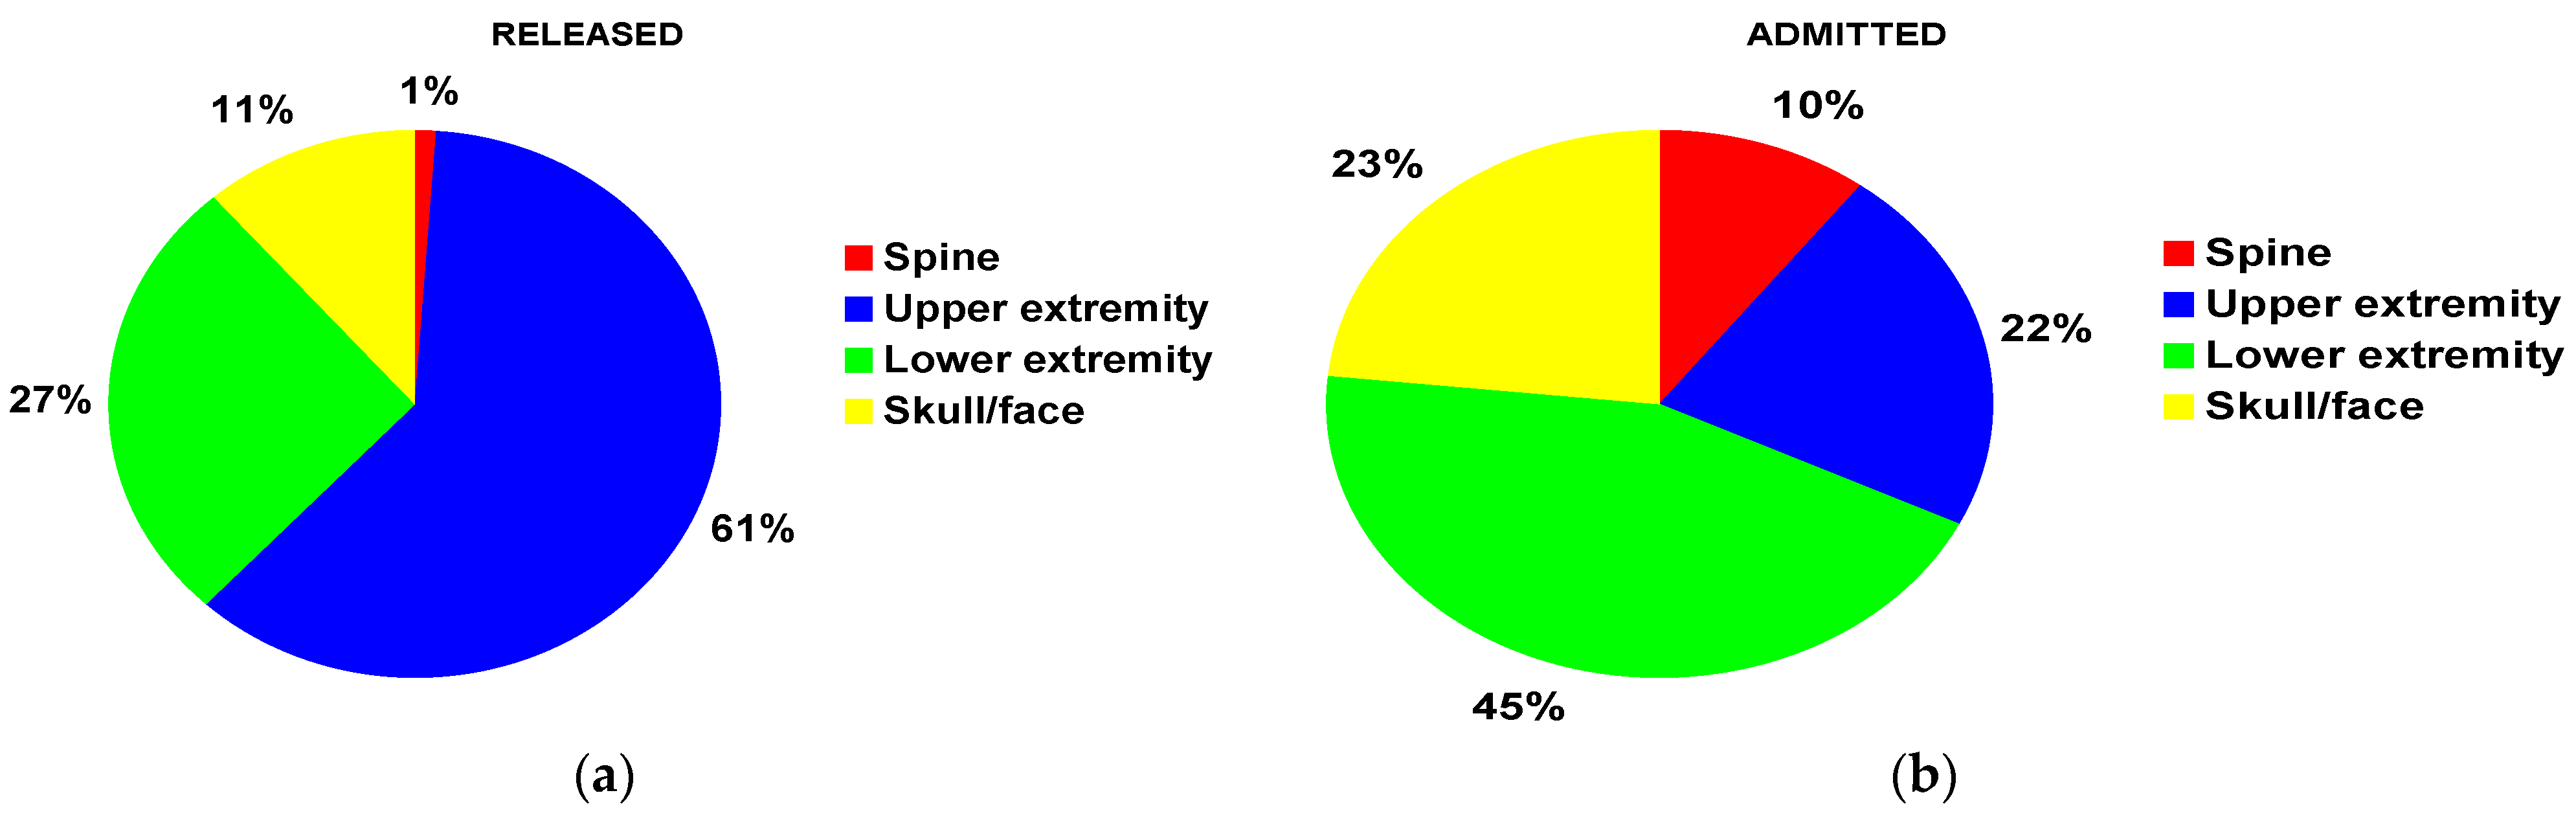
The finger was the most common fracture location for patients both overall and released from the ED. The tibia/fibula was the most common fracture location for those admitted to the hospital. For those released from the ED, the upper extremity was the most common location (61%) (Figure 1a) and for those admitted to the hospital, it was the lower extremity (45%) (Figure 1b).
There were very few Asian children, children with isolated rib fractures and those having more than one fracture. Thus, we excluded Asian children, those with an isolated rib fracture, and those with more than one fracture. All the subsequent analyses were performed with these exclusions.
3.1. Analyses by Fracture Group
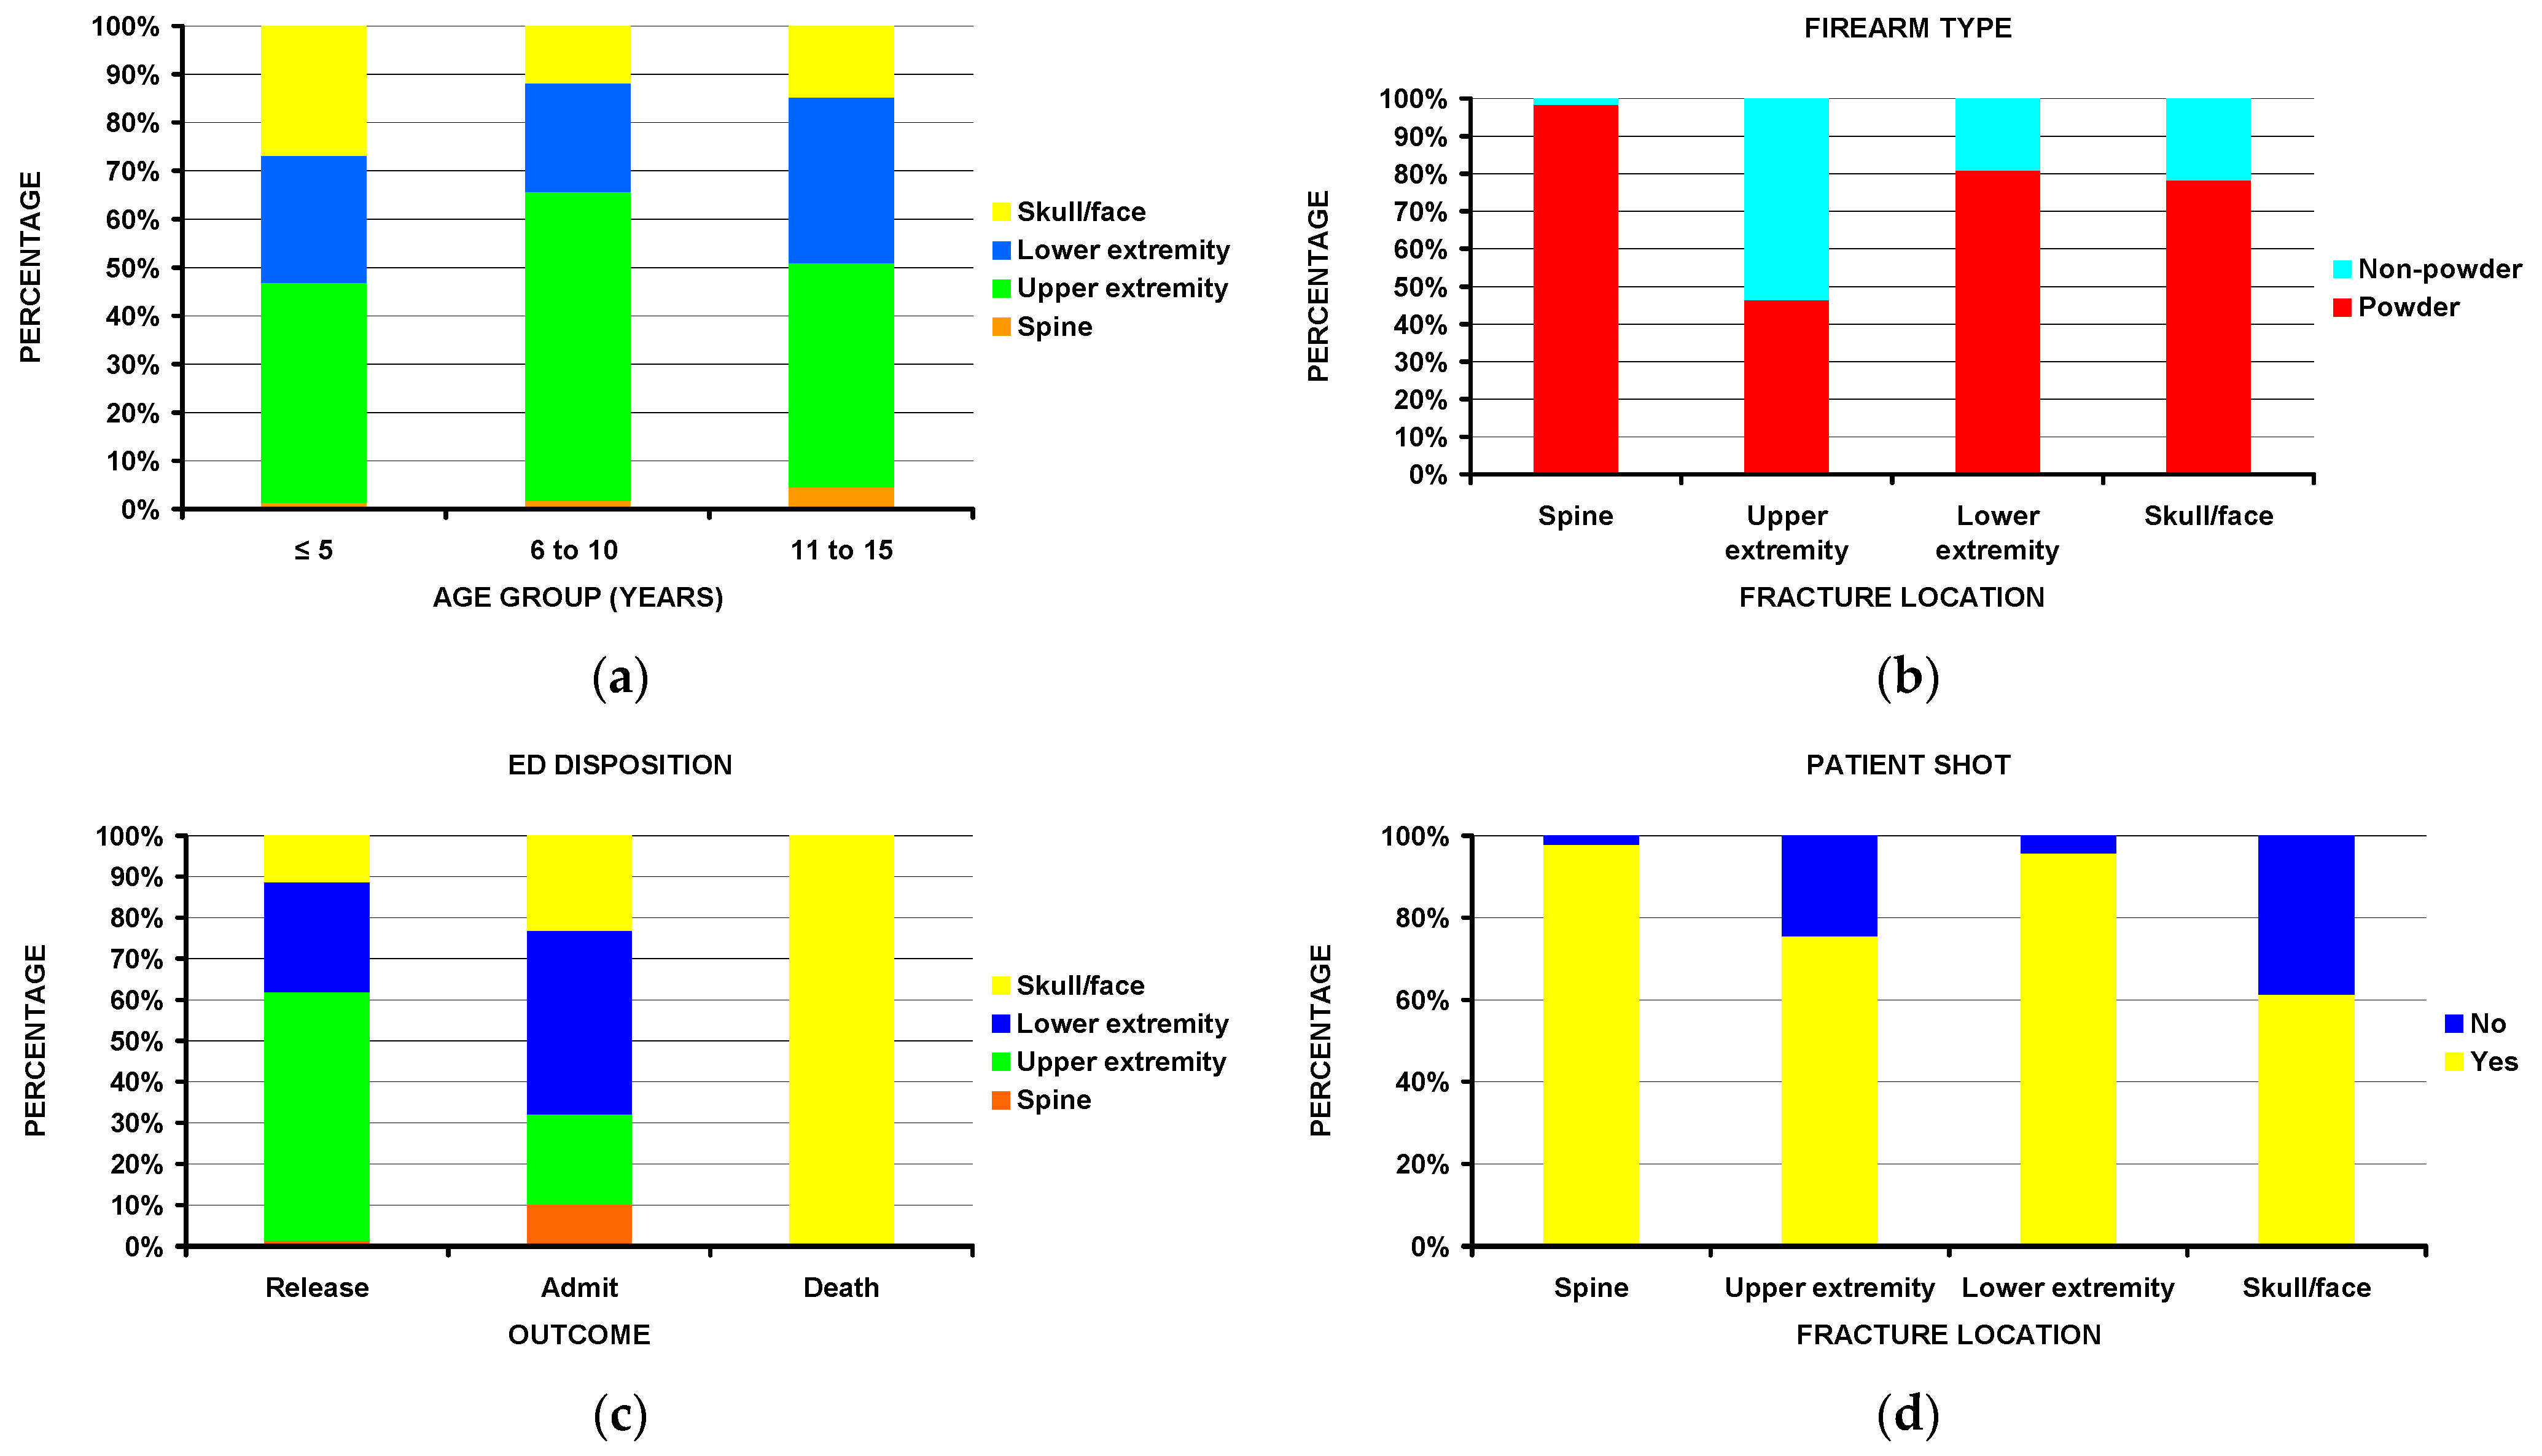
Notable differences (Table 3) include children ≤ 5 years of age sustained more skull/face fractures (Figure 2a). Most spine fractures, while rare, occurred in the 11–15-year age group. Fractures of the upper extremity accounted for 58.6% of all the fractures in the 6–10 age group. Nearly all spine fractures (98%) were associated with powder firearms (Figure 2b). Patients with lower extremity fractures were more commonly admitted to the hospital compared to those with upper extremity fractures; the few deaths occurred exclusively in those with fractures to the skull/face (Figure 2c). While most of the patients sustained a gunshot wound (i.e., were shot), nearly all of those with spine fractures were shot, while 39% of those with skull/face fractures were not shot (Figure 2d). Other statistically significant differences existed by race, perpetrator, incident locale, and injury intent.
3.2. Analyses by Powder vs. Non-Powder Firearms
In addition to the differences described above by fracture location and firearm type, there were notable differences by sex, race, disposition from the ED, perpetrator of the injury, injury intent, incident locale, and age groups (Table 4).
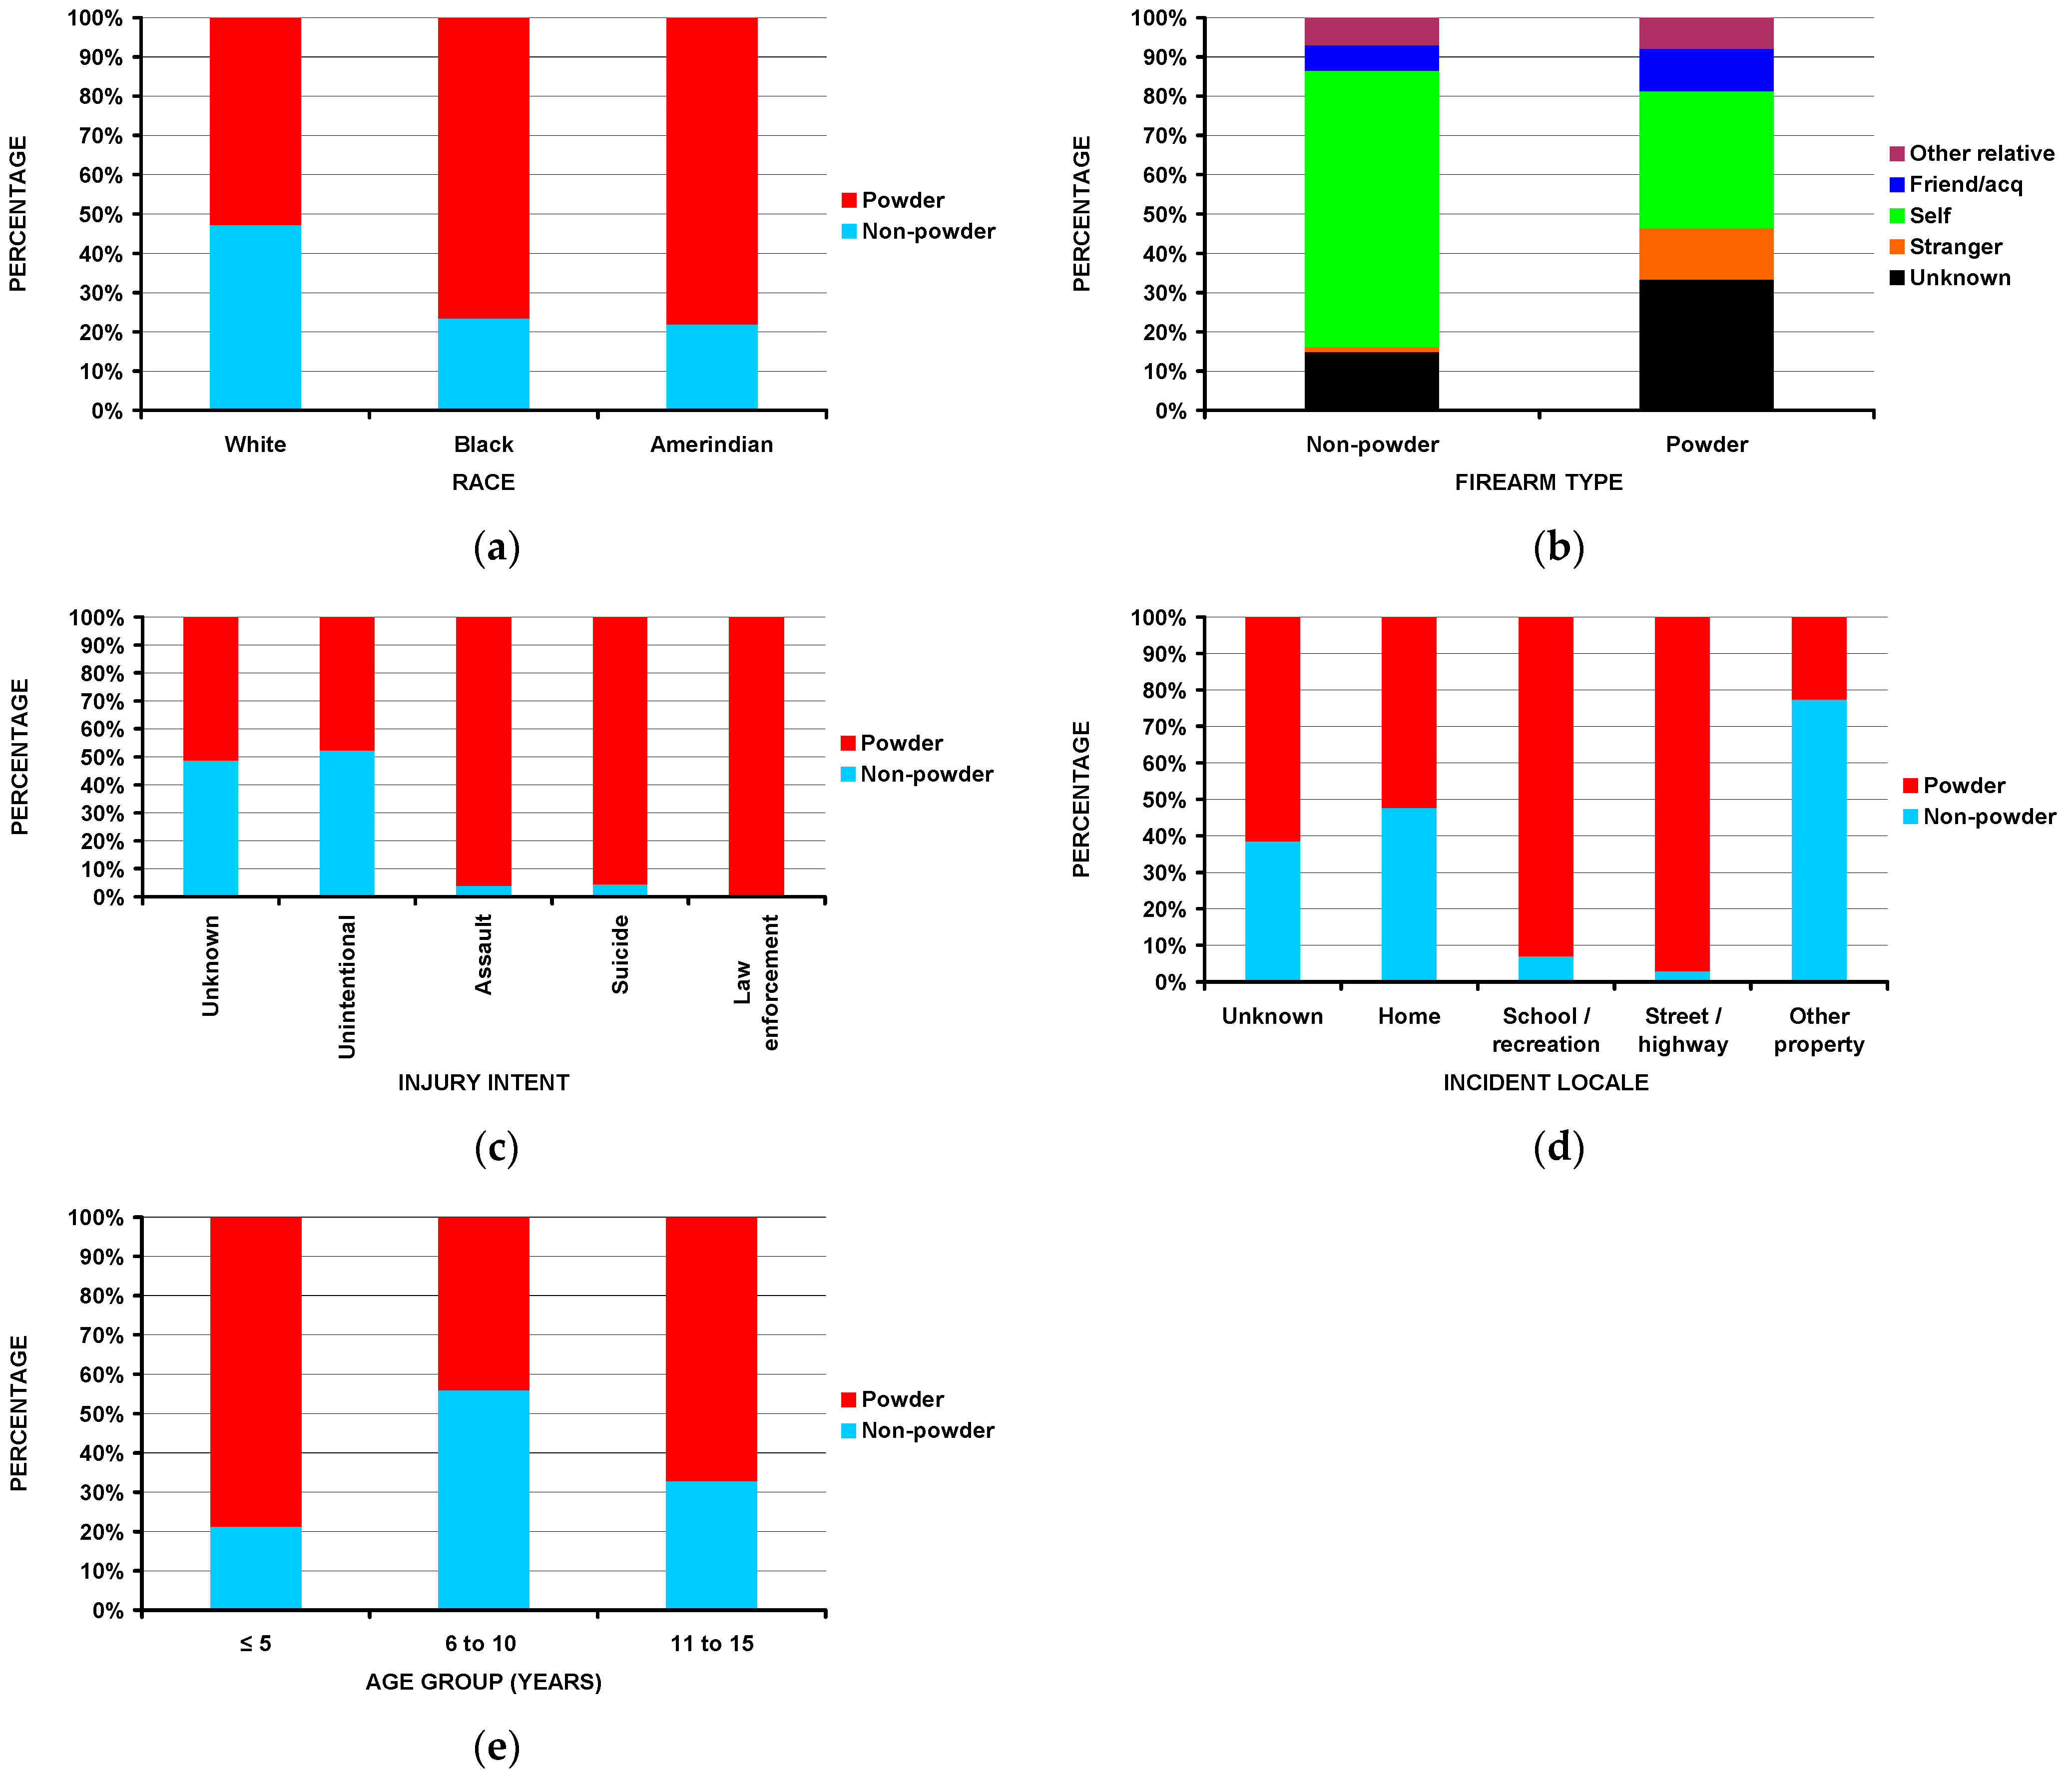
Boys comprised 81.3% of the powder and 92.1% of the non-powder firearm groups (p = 0.0024). White children accounted for 45.7% of the powder and 71.6% of the non-powder firearm group (p = 0.0005) (Figure 3a). Of those patients with fractures due to powder firearms, 42.5% were admitted to the hospital, while only 6.0% of those due to non-powder firearms were admitted (p < 10−4). The injury was self-inflicted in 65.2% of the non-powder and 30.6% of the powder group (Figure 3b) (p < 10−4). The injury intent was an assault in 50.0% of the powder and 3.7% of the non-powder firearm group (Figure 3c) (p < 10−4). While the injuries occurred at schools or places of recreation in only 6.8% of all the patients (Table 1), those fractures which occurred at schools or places of recreation were due to powder firearms in 92.9% (Figure 3d) (p < 10−4). Although there was minimal difference in the average age between the two groups (12.5 years—powder, 11.7 years—non-powder, p = 0.58), there was a significant difference between the three age groups. Powder firearms accounted for the majority of the fractures in the ≤5 and 11–15 yea-olds, non-powder firearms accounted for the majority of the fractures in the 6–10-year-old group (Figure 3e) (p = 0.006). No differences were observed in the patient being shot or not shot by firearm type.
3.3. Analyses by Being Shot or Not Shot
In addition to the differences by major fracture, groups noted above, there were notable differences by incident locale and disposition from the ED (Table 5).
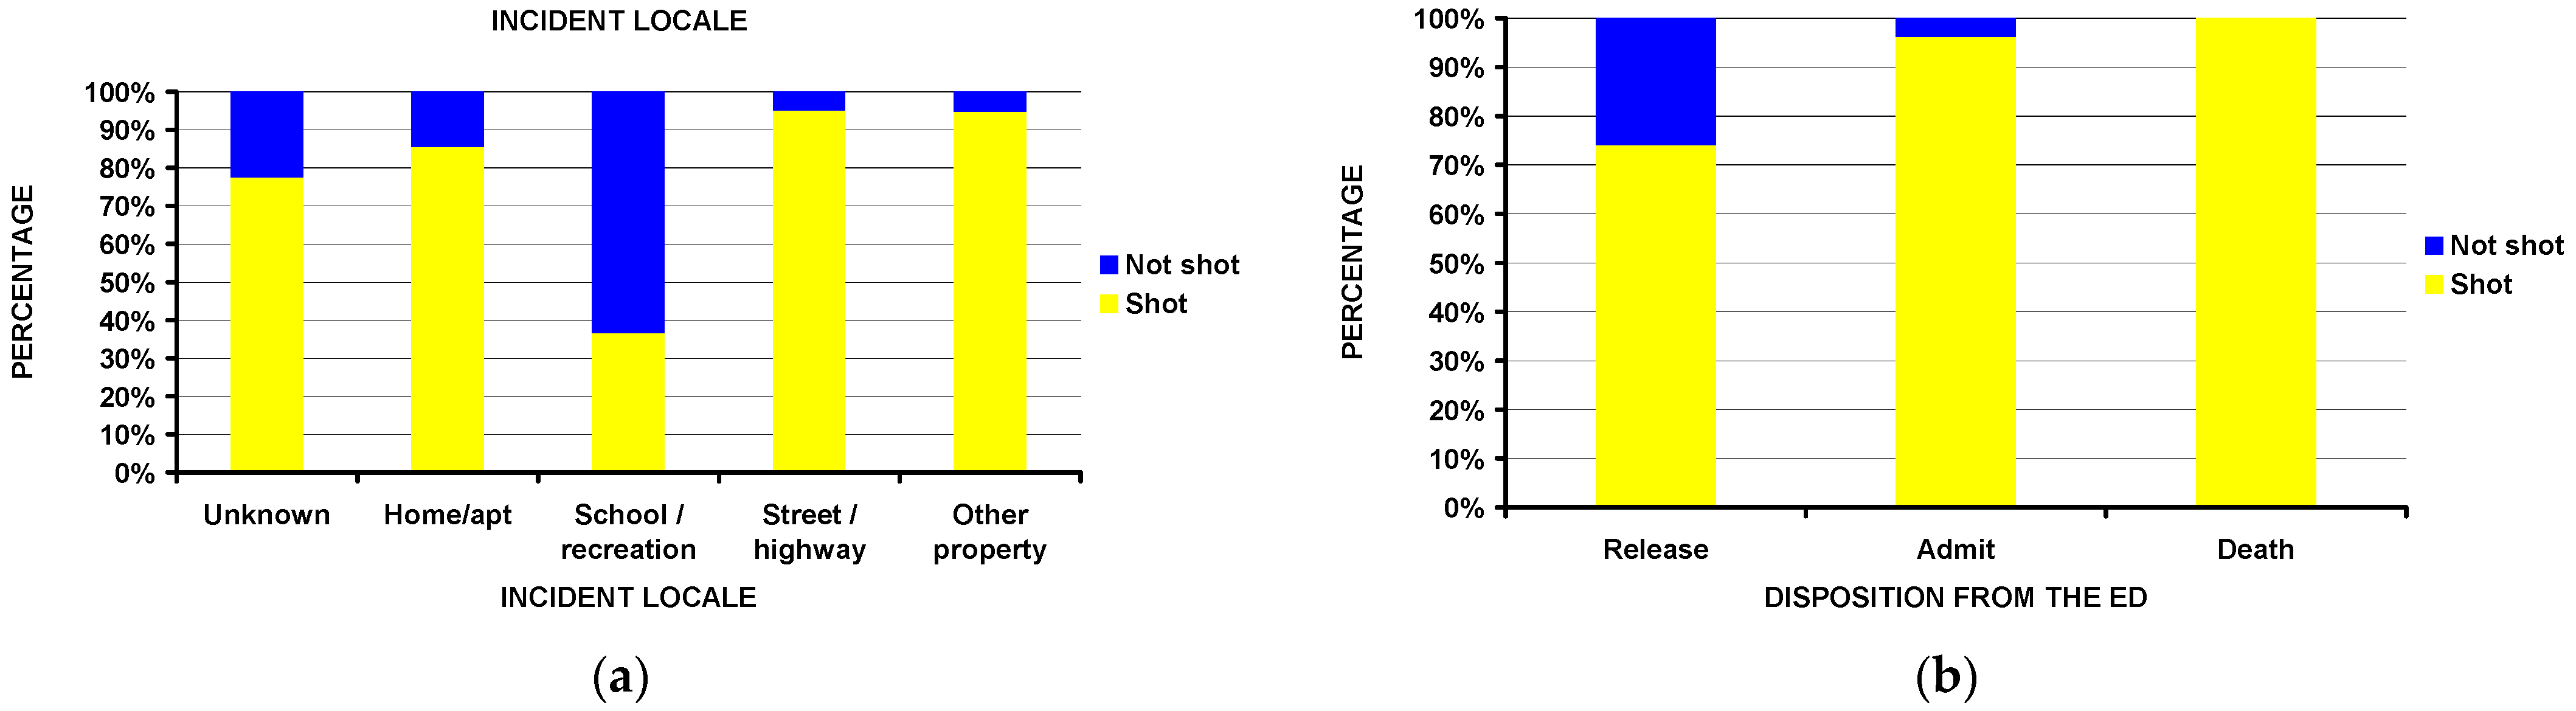
Children who sustained injuries at schools and recreational facilities were less likely to be shot compared to other places (Figure 4a). Examples would be a clavicle fracture sustained from a rifle recoil while doing target practice, or a nasal fracture to a participant in marching band/color guard activities. All deaths and nearly all of those admitted to the hospital had been shot (Figure 4b), while 26% of those released from the ED were not shot (p < 10−4) and experienced injury from the firearm in a different way. There were no differences between those shot or not shot by firearm type or perpetrator of the injury; however, there were differences by race and injury intent. White children comprised 71.7% of those not shot and 51.2% of those shot (p = 0.036); the injury was unintentional in 76.1% of the shot group and 56.2% of the shot group (p = 0.0005).
3.4. Analyses by Disposition from the ED
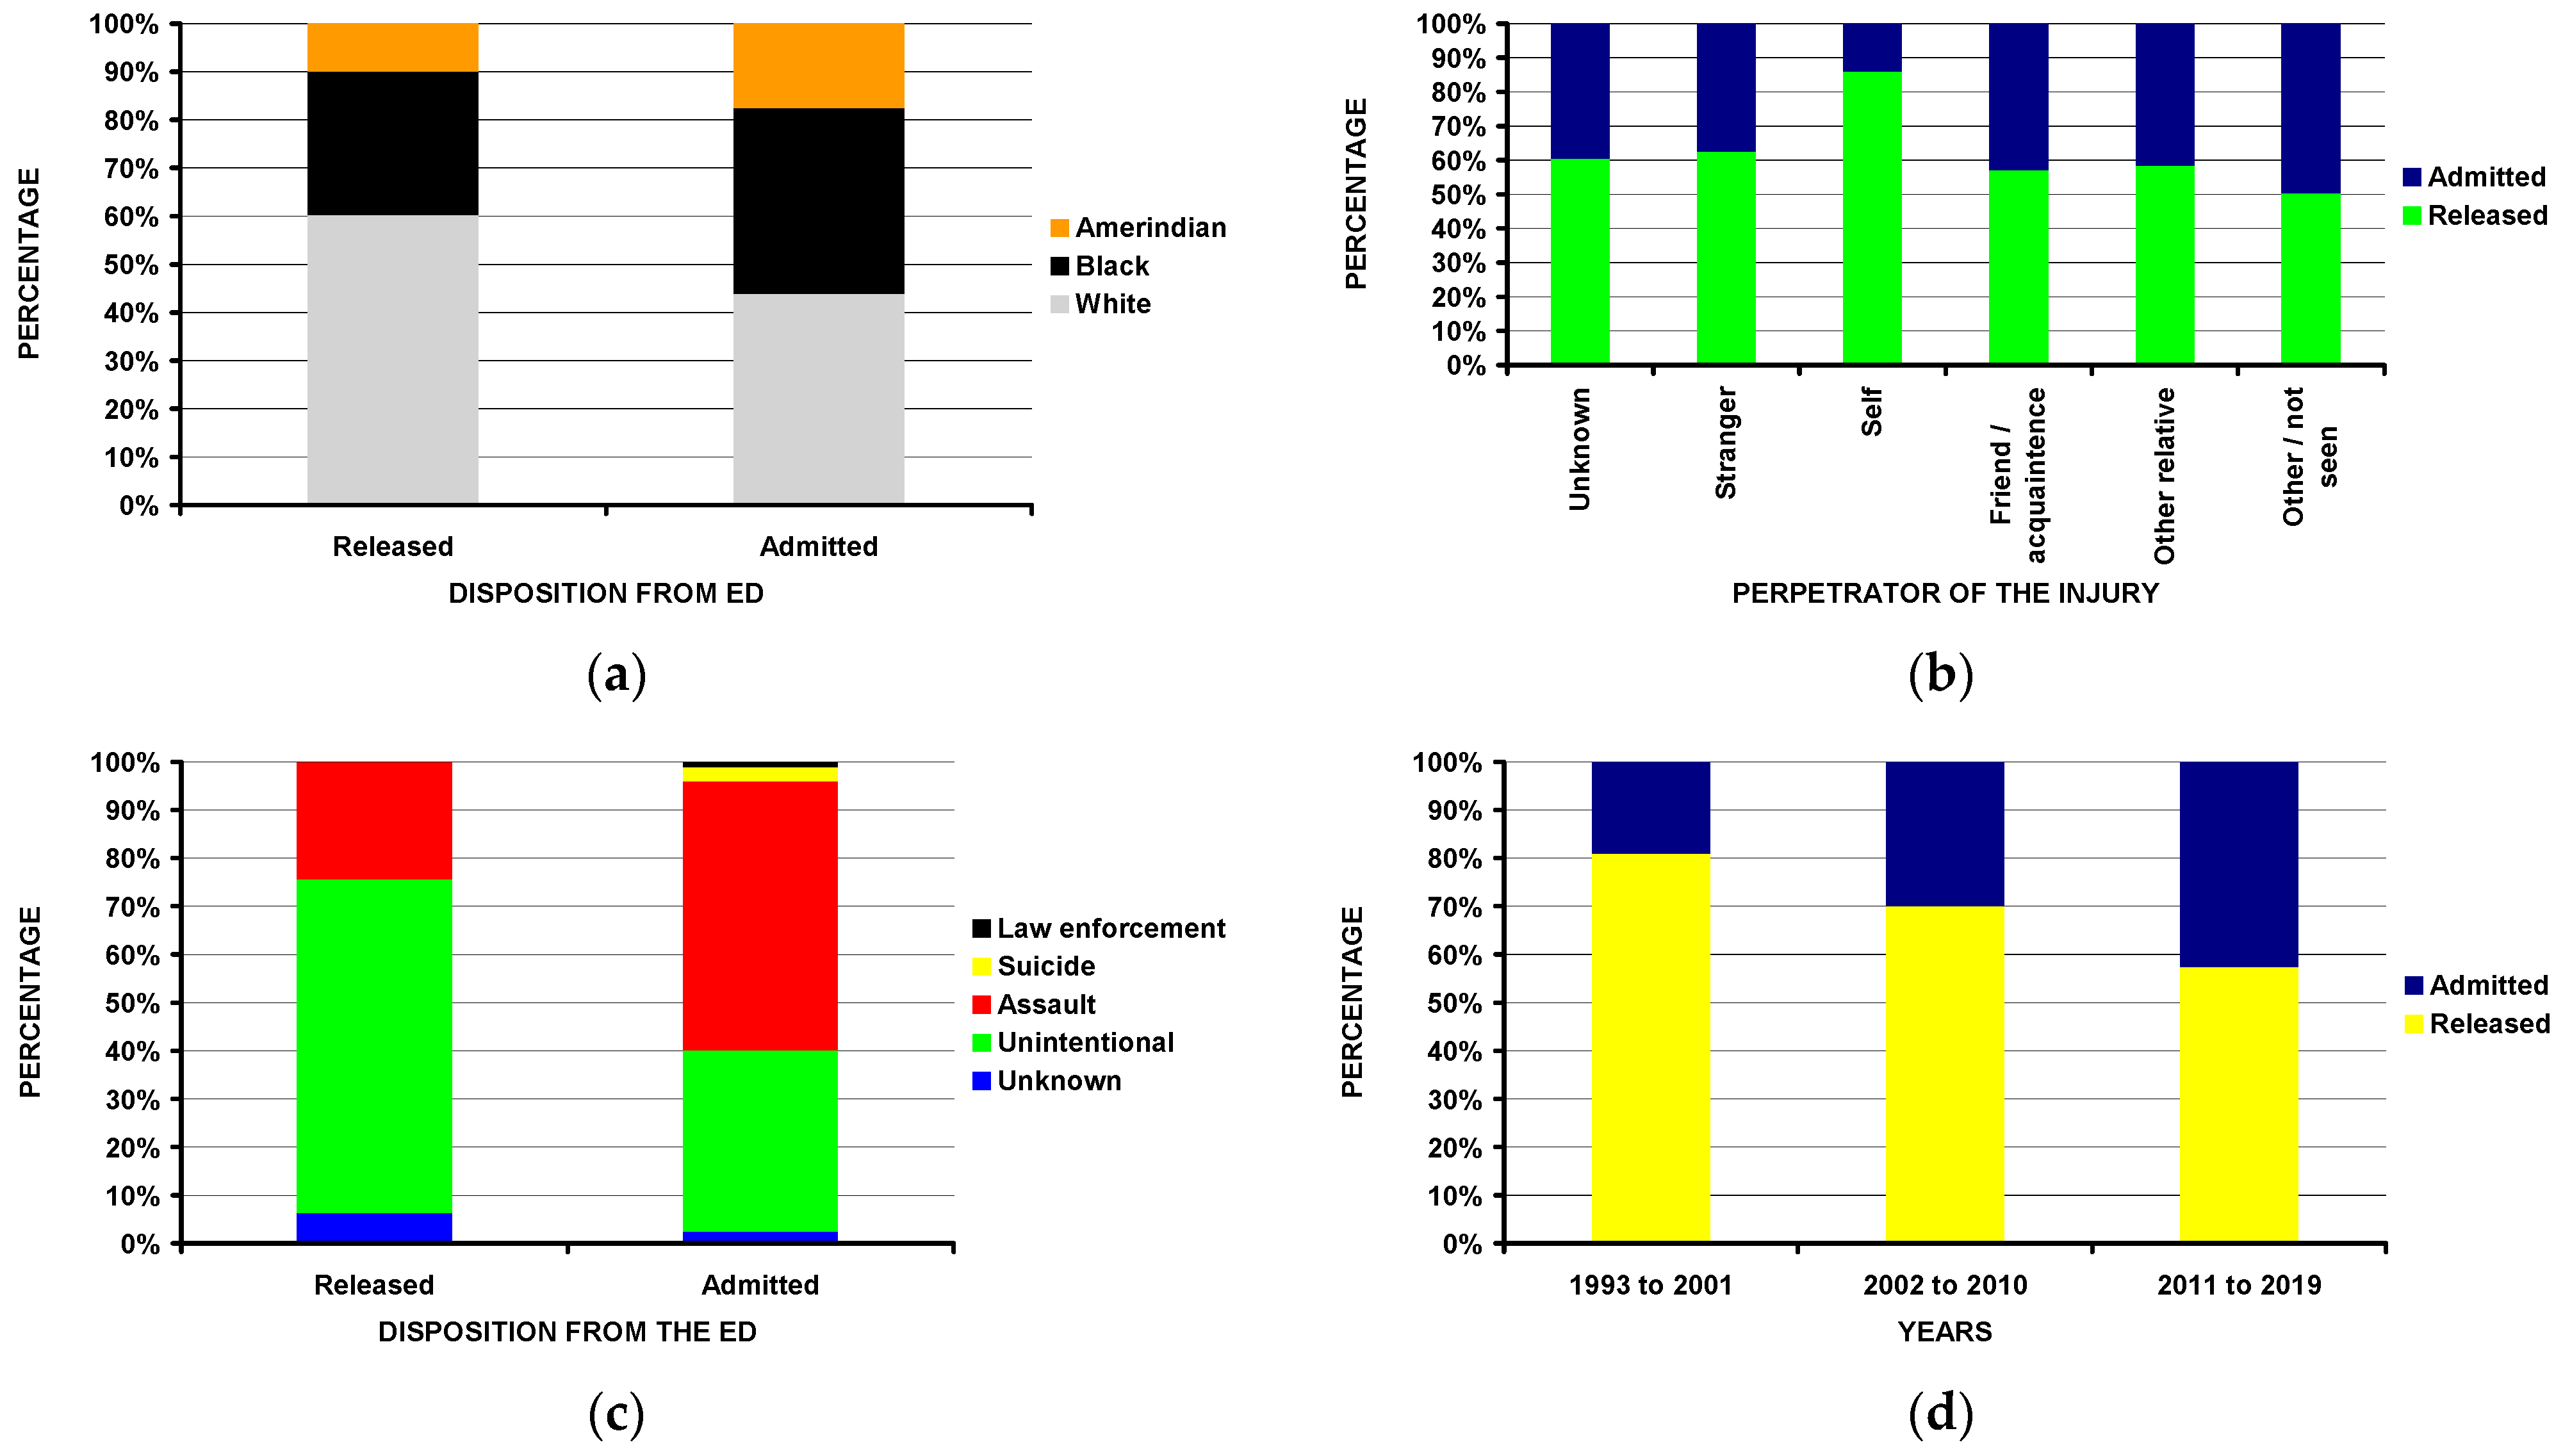
In addition to the differences by fracture location, firearm type, and being shot or injured in another way, those admitted to the hospital from the ED (Table 6) were less commonly White (Figure 5a), less frequently injured themselves (Figure 5b), and more commonly injured due to an assault (Figure 5c). The rate of hospital admissions increased over time (p = 0.004) (Figure 5d).
3.5. Analyses by Age Groups and Drive-by Shootings
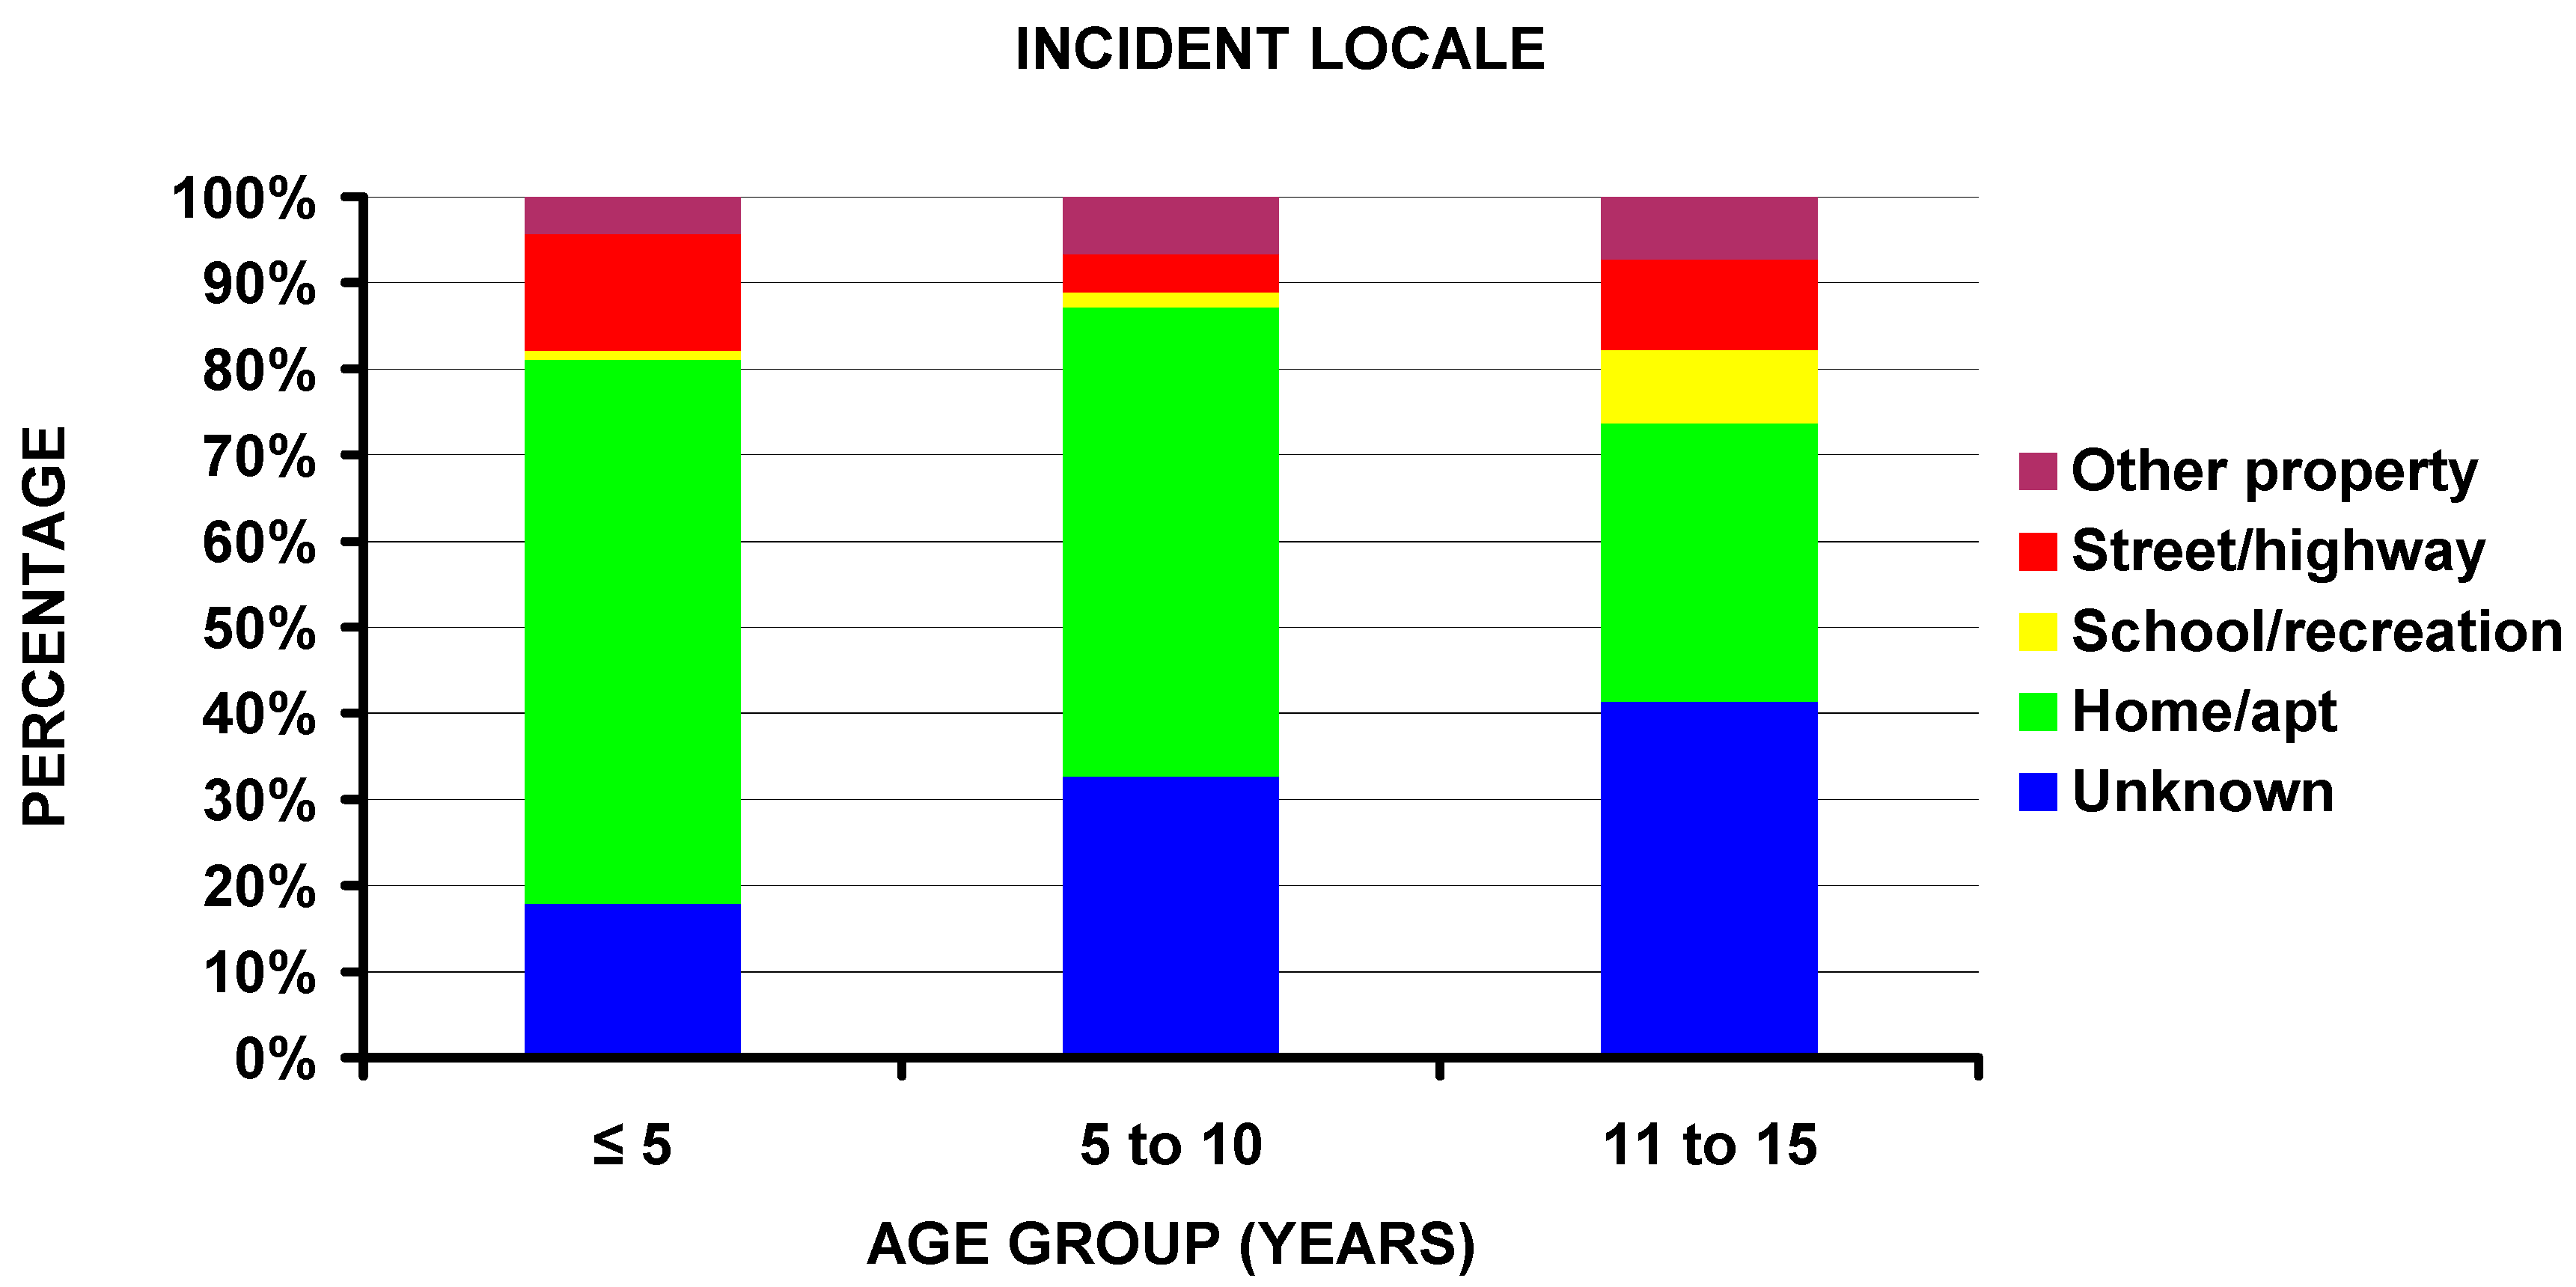
In addition to the difference by firearm type previously noted, the percentage of injuries occurring at home decreased with increasing age (63.3% < 5 years, 54.5% 6 to 10 years, and 32.4% 11 to 15 years of age) (Figure 6). No other significant differences existed between the different age groups. Regarding those injured in drive-by shootings, differences existed by race, firearm type, and perpetrator of the injury. Drive-by shooting patients were 11.2% White, 62.5% Black, and 26.3% Amerindian; non-drive-by shooting patients were 57.0% White, 31.5% Black, and 11.5% Amerindian (p = 0.008). The involved firearm was a powder firearm in 88.9% of the drive-by and 63.8% of the non-drive-by patients (p = 0.022). The perpetrator was unknown in 55.8%, a stranger in 21.3%, and not seen in 23.1% of the drive-by shootings; the perpetrator in the non-drive-by shootings was unknown in 23.1%, a stranger in 7.2%, themselves in 44.6%, a friend/acquaintance in 8.6%, another relative in 7.1%, and not seen in 9.3% (p = 0.008).
3.6. Variations by Time
4. Discussion
The findings in this study are both similar and different to other studies in the literature. As most of the studies regarding fractures in children due to firearms are due to powder firearms, we have compared our findings to the other studies (Table 7). The percentage of boys was strikingly similar for all studies; it ranged from 78 to 91% and was 81% in this series. Most of the series demonstrated more lower extremity fractures than upper extremity fractures. Of the three studies that included spine fractures, the 5.5% in this study and the 2% in that of Naranje et al. [19] are similar, in contrast to the 18.9% in the study of Blumberg et al. [14]. We have no explanation for this finding, except that only inpatients were included in the Blumberg series [14] and they included those 16 through 20 years of age. It has been shown in a previous study that those with firearm-associated spine injuries are much more common in the 15-to-34 year-old age group [42]. Carillo et al. [43] studied 19 patients with spinal cord injury secondary to gunshot wounds. The average age was 17 years with a range of 14–19 years. The fact that we excluded those over 15 years of age likely explains some of the differences between this study and that of Blumberg et al. [14].
The most fractured bone in this study was the finger, likely due to the inclusion of both those patients released from the ED and non-powder firearms. When looking at only those admitted to the hospital (Table 2), the most common fracture involved the tibia/fibula (17.1%) followed by the femur (14.2%). In the only other large study, that of [14], the most common fractured bone was the femur (21.2%), followed by the spine as discussed above at 18.9%, and then the tibia/fibula at 15.0%. Again, these differences are likely due to the inclusion of those children from 16 through 21 years of age in the Blumberg study [14]. Nevertheless, the numbers in this study respectively for the tibia/fibula (17.1%) and femur (14.2%) are similar to the 15.0% and 21.2% respectively for the Blumberg study [14]. In the much smaller series of 58 gunshot fractures by Naranje et al. [19] both the femur and tibia/fibula each accounted for 19% of the fractures, again very similar to the numbers in this study.
We noted that powder firearms were responsible for the majority of the fractures in the ≤5 and 11–16-year-old groups (78.7% and 67.1%) but only 44.1% for the non-powder firearm group (Figure 3e) and that the majority (63.3%) of those in the ≤5-year-old group occurred at home (Figure 6). This confirms and supports the need for firearms in the home to be safely stored and locked and away from children [44,45,46]. It has been estimated that even in 2020 that 4.6 million US children live in homes with at least one loaded and unlocked firearm [47]. The issue of gun ownership is very emotional in the US population, and in a recent study [48] gun owners with children were more likely than those without children to feel that guns make them feel more valuable to their families. Thus, acknowledging parental motivations for gun ownership is a pivotal educational component toward firearm injury prevention. However, the initial analyses did not uncover if this particular group in this study was injured unintentionally by the child or others. We, therefore, performed detailed analyses of the perpetrator and incident locale by the three age groups. In the ≤5-year-old age group, 90.8% of the fractures were self-inflicted and occurred at home; this number was 29.6% for the 6–10 and 18.4% for the 11–15 year old age groups (p < 10−4). Therefore, it can be concluded that young children are exceptionally vulnerable to accidental dislodging of an unlocked and loaded gun left at home, furthermore, emphasizing the importance of gun safety around young children.
Another interesting finding was that those injured in schools or recreational facilities had the second highest prevalence of fractures due to powder firearms (92.9%) (Figure 3d) but the least likely (36.7% compared to the overall study 80.8%) to be shot (Figure 4a). This is most likely due to the fact that, in schools, powder-type firearms are often used in color guard or other sanctioned activities. In a recent study, 43.9% of injuries due to firearms in schools occurred in the sanctioned guard or drill activities [49]. While there is understandably significant concern regarding school mass shootings in the US, only ~37% of the patients with fractures due to school-related firearm encounters were shot. Of the 1298 patients injured at schools or recreational facilities, 696 were at schools and 602 at recreational facilities. There was no difference in the number of those injured by powder and non-powder firearms between the school and recreational facilities.
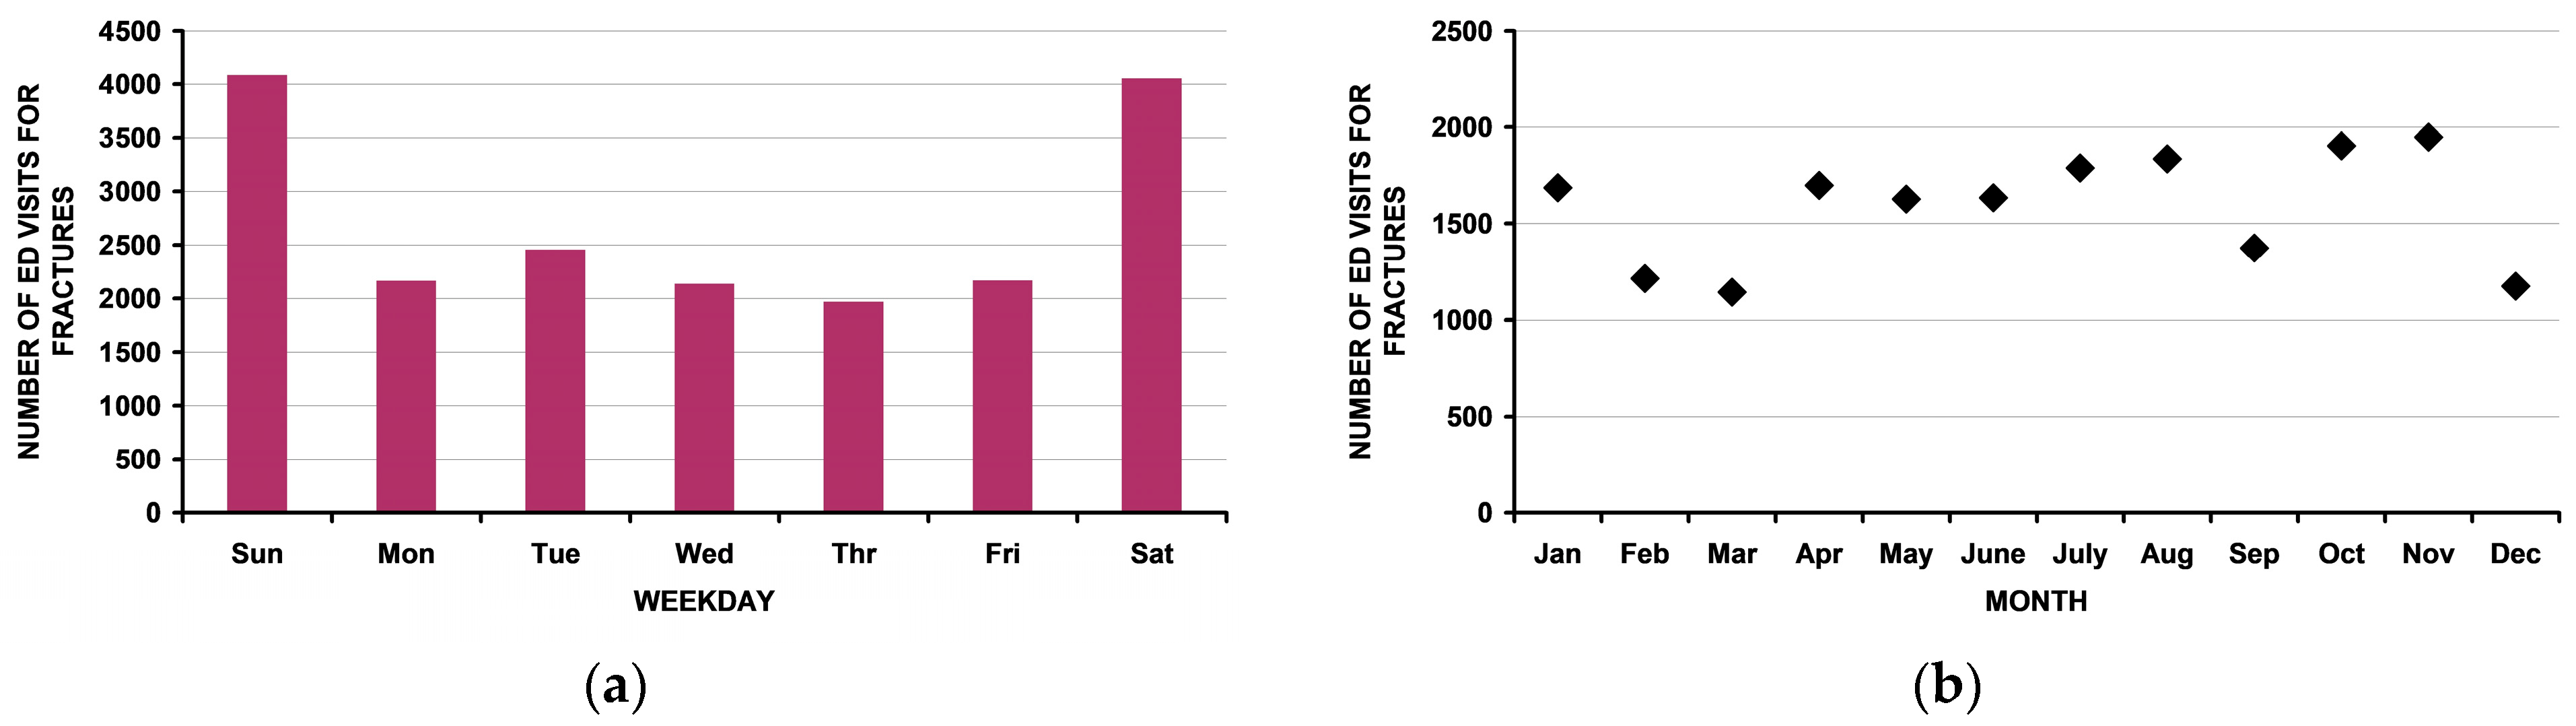
Regarding temporal factors, the patients with fractures were more likely to be injured on the weekend than on the weekday. This is understandable as school-aged children are occupied during the weekdays, reducing access to firearm activities. Tatebe et al. [50] noted that there was an increase in pediatric firearm injuries overall in Chicago. However, we noted no variation by month in this select group of children with fractures due to firearm injuries. A previous US study of temporal variation in firearm injuries [51] using an earlier version of the Research Firearm Injury Surveillance Study 1993–2008 noted a peak in September, but with many exceptions. Thus, fractures due to firearm injuries in children are likely another one of these exceptions.
The United States has the highest rate of pediatric firearm-related injuries, specifically 10–35 times higher than other high-income countries [50]. With pediatric firearm-related fractures increasing from 1993–2019, it is important that national prevention strategies are implemented to prevent further increases in childhood morbidity and mortality relating to firearms. Tatebe et al. [50] found that 43.6% of all firearm-associated injuries occurred outside of school hours, thus providing family support, early childhood education and scheduled after-school activities could minimize the time that children are exposed to firearms. Additionally, it has been proposed [50] that access to unsecured loaded weapons needs to be minimized with increased emphasis on education regarding firearm handling.
A more interesting finding was that over time, the percentage of children admitted to the hospital for firearm-associated fractures increased (Figure 5d), in spite of the very well-known emphasis to not admit patients to the hospital in the US, where hospital admission is typically reserved for very serious injuries and/or those needing immediate surgical treatment. If hospital admission is used as an indication of injury severity, then this is a very concerning trend. If, however, it reflects perhaps more aggressive fracture fixation, then perhaps this trend could be explained. However, the vast majority of the upper extremity and many of the lower extremity fractures in children due to firearms can be treated non-operatively, with the major exception perhaps being the femur and less so the tibia/fibula. There has certainly been an increase in operative pediatric femur fracture treatment from 1993 to 2019 and, to a lesser extent, other long bone fractures [52,53,54,55]. This may explain the trend seen here.
We compared the patterns of fractures in those associated with powder and non-powder firearms. The literature regarding non-powder firearms (i.e., BB guns, air-powered rifles) primarily focuses on overall injury patterns and does not specifically study fracture patterns. A recent study [18] used the NEISS database and excluded powder firearm injuries, while we used the Firearm Injury Surveillance Study, which is also a NEISS database, but incorporates all firearms, both powder and non-powder. In the study by Jones et al. [18] from 1990–2016, the rate of non-powder firearm injuries decreased by 47.8%, boys accounted for 87.1% of the children; BB guns accounted for 80.8% of the injuries, followed by pellet guns (15.5%), paintball guns (3.0%), and airsoft guns (0.6%). However, there was little mention of fractures with most of the focus on ocular injuries; nonetheless, fractures were most commonly associated with hospital admission. Details of fracture anatomic location were not given. In this study, 73.5% of the fractures due to non-powder firearms occurred in the upper extremity (Table 4). Of these 4934 upper extremity fractures due to non-powder firearms, 4485 (90.9%) involved the finger, 362 (7.3%) the hand, with the remaining 87 from the wrist proximal. A similar pattern was seen in the lower extremity; of the 1313 lower extremity fractures due to non-powder firearms, 820 (62.5%) involved the toes and 311 (23.7%) the foot, with the remaining 10 (0.8%) the tibia/fibula.
There are certain limitations of the study. First is the accuracy of the NEISS data. However, previous studies [56,57], including those involving firearms, have demonstrated over 90% accuracy of NEISS data. Second, it studies only patients seen in EDs and thus those visiting urgent care centers or other outpatient clinics are not captured in this data. However, we suspect that any serious firearm injury would be seen in an ED. Third, regional-specific analyses could not be carried out due to the de-identified nature of each hospital in the NEISS sample. It would be very interesting to study differences by region [58], especially those having stricter gun control laws compared to others, but unfortunately, that is not possible due to the de-identified status of each NEISS hospital. Fourth, the number of fractures reported is likely less than the actual number for several reasons. Potential error could stem from the clerks entering the data into the comments section and inadvertently forgetting to mention a fracture when in actuality there was a fracture. In addition, a very seriously injured person coming into the ED with a major trauma likely had fractures that were overlooked and not mentioned, especially if the patient was in extremis and/or died in the ED. An additional reason is that many of the serious head injuries with brain damage from the gunshot wound would have had an open skull fracture, but it was not so coded, it was missed. The same would be for a patient with a hemo/pneumothorax, likely having a rib(s) fracture. As this is an ED-focused database, we have no information on the length of stay for those admitted to the hospital. Finally, we can not differentiate between the injuries sustained during routine recreational use (e.g., hunting, target practice) or self defense during a perceived or actual assault due to how this database is catalogued.
A major strength of this study is that it is a national picture of pediatric fracture patterns due to firearms over a quarter of a century. It encompasses both rural and urban areas, all races, both boys and girls, and especially studies the outcome of the ED visit—treated and released, admitted, or expired while in the hospital. While these are national estimates and may not be locally applicable, they can give healthcare providers, especially ED providers, orthopaedic surgeons, and health facility administrators important information about these events. This data will also be helpful in analyzing any changes in prevalence or demographics with any future firearm legislation, for or against gun control.
Finally, what are the financial costs of this particular group of patients? The average cost of an ED visit in the US in 2020 was $1150 (https://consumerhealthratings.com/how-much-does-er-visit-cost/, accessed on 18 December 2022). The average cost for a pediatric inpatient hospital admission in US$ 2016 was $7800 (https://consumerhealthratings.com/healthcare_category/inpatient-average-cost-typical-prices-ballpark/, accessed on 18 December 2022), or $8493 for 2020 dollars using the US Consumer Price Index inflation index calculator (https://www.bls.gov/data/inflation_calculator.html, accessed on 18 December 2022). The cost for a fatality in a US ED is unknown but assuming it is equal to a hospital admission, in this study there were 13,272 children seen in US EDs for fractures due to firearm activity and released after treatment; 5671 admitted to the hospital; and 100 fatalities. This gives an estimated cost of (13,272 × $1150) + (8493 × $5631) + (100 × $5631), or $63.9 million. This is a conservative estimate, as it does not include costs for follow-up visits from an ED (which is crucial for fracture care), associated charges for imaging (cost of the radiographs, interpretation fees from the radiologist),prophylactic antibiotics, nor costs to the parents/family/society for time lost regarding employment, childcare and other issues. Finally, the estimate for pediatric hospital admission of $7800 ($8493 in 2020$) is likely very low for this particular scenario, as admissions to the hospital for pediatric orthopaedic surgical care are likely much higher than this $7800. What these actual numbers are is difficult to know. The important point is that pediatric fractures arising from firearm activity are a significant financial burden to everyone.
5. Conclusions
Many of the findings in this study are sobering. The increase in hospital admissions over time for firearm-associated fractures, especially in view of hospital admissions becoming more difficult to justify in the US, is concerning. If a hospital admission is a proxy of injury severity, then firearm associated fracture injuries are becoming more severe. Growing acuity of firearm-associated injuries is detrimental to the child, but also greatly impacts familial wellbeing, societal functioning, and the US-health care system financial state.
Author Contributions
Conceptualization, R.T.L.; Methodology, R.T.L.; Investigation, R.T.L. and T.L.; Data curation, T.L.; Writing—original draft, R.T.L. and T.L.; Writing—review & editing, R.T.L. and T.L. All authors have read and agreed to the published version of the manuscript.
Funding
This research received no external funding.
Institutional Review Board Statement
This study of publicly available de-identified data was considered exempt by our local Institutional Review Board.
Informed Consent Statement
Not applicable as noted above.
Data Availability Statement
This data is freely to anyone online at the Inter-University Consortium for Political and Social Research Firearm Injury Surveillance Study 1993–2020 (ICPSR 38574) (https://www.icpsr.umich.edu/web/NACJD/studies/38574, accessed on 18 December 2022).
Conflicts of Interest
The authors declare no conflict of interest.
References
- Choron, R.L.; Spitzer, S.; Sakran, J.V. Firearm Violence in America. Adv. Surg. 2019, 53, 195–208. [Google Scholar] [CrossRef] [PubMed]
- Bulger, E.M.; Kuhls, D.A.; Campbell, B.T.; Bonne, S.; Cunningham, R.M.; Betz, M.; Dicker, R.; Ranney, M.L.; Barsotti, C.; Hargarten, S.; et al. Proceedings from the Medical Summit on Firearm Injury Prevention: A Public Health Approach to Reduce Death and Disability in the US. J. Am. Coll. Surg. 2019, 229, 415–430e12. [Google Scholar] [CrossRef] [PubMed] [Green Version]
- Tasigiorgos, S.; Economopoulos, K.P.; Winfield, R.D.; Sakran, J.V. Firearm Injury in the United States: An Overview of an Evolving Public Health Problem. J. Am. Coll. Surg. 2015, 221, 1005–1014. [Google Scholar] [CrossRef] [PubMed]
- Ranney, M.L.; Herges, B.C.; Metcalfe, L.; Schuur, J.D.; Hain, P.; Rowhani-Rahbar, A. Increases in Actual Health Care Costs and Claims After Firearm Injury. Ann. Intern. Med. 2020, 173, 949–955. [Google Scholar] [CrossRef]
- Richmond, T.S.; Lemaire, J. Years of Life Lost Because of Gunshot Injury to the Brain and Spinal Cord. Am. J. Phys. Med. Rehabil. 2008, 87, 609–618. [Google Scholar] [CrossRef] [Green Version]
- Wolf, A.E.; Garrison, M.M.; Mills, B.; Chan, T.; Rowhani-Rahbar, A. Evaluation of Injury Severity and Resource Utilization in Pediatric Firearm and Sharp Force Injuries. JAMA Netw. Open 2019, 2, e1912850. [Google Scholar] [CrossRef]
- Trinidad, S.; Vancil, A.M.; Brokamp, C.; Moody, S.M.; Gardner, D.M.; Parsons, A.A.; Riley, C.M.; Sahay, R.M.; Sofer, N.B.; Beck, A.F.M.; et al. Relationships between socioeconomic deprivation and pediatric firearm-related injury at the neighborhood level. J. Trauma Inj. Infect. Crit. Care 2022, 93, 283–290. [Google Scholar] [CrossRef]
- Saunders, N.R.; Hepburn, C.M.; Huang, A.; de Oliveira, C.; Strauss, R.; Fiksenbaum, L.; Pageau, P.; Liu, N.; Gomez, D.; Macpherson, A. Firearm injury epidemiology in children and youth in Ontario, Canada: A population-based study. BMJ Open 2021, 11, e053859. [Google Scholar] [CrossRef]
- Gilna, G.P.; Saberi, R.A.; Ramsey, W.; Huerta, C.T.; O’Neil, C.F.; Perez, E.A.; Sola, J.E.; Thorson, C.M. Outcomes of Abdominal Firearm Injury and Damage Control Laparotomy in the Pediatric Population. J. Surg. Res. 2022, 279, 733–738. [Google Scholar] [CrossRef]
- Evans, P.T.; Pennings, J.S.; Samade, R.; Lovvorn, H.N.; Martus, J.E. The financial burden of musculoskeletal firearm injuries in children with and without concomitant intra-cavitary injuries. J. Pediatr. Surg. 2020, 55, 1754–1760. [Google Scholar] [CrossRef]
- Pulcini, C.D.; Goyal, M.K.; Hall, M.; Gruhler De Souza, H.; Chaudhary, S.; Alpern, E.R.; Fein, J.A.; Fleegler, E.W. Nonfatal firearm injuries: Utilization and expenditures for children pre-and postinjury. Acad. Emerg. Med. 2021, 28, 840–847. [Google Scholar] [CrossRef] [PubMed]
- Taylor, J.S.; Madhavan, S.; Han, R.W.; Chandler, J.M.; Tenakoon, L.; Chao, S. Financial burden of pediatric firearm-related injury admissions in the United States. PLoS ONE 2021, 16, e0252821. [Google Scholar] [CrossRef] [PubMed]
- Lee, J.; Moriarty, K.P.; Tashjian, D.B.; Patterson, L.A. Guns and states: Pediatric firearm injury. J. Trauma Acute Care Surg. 2013, 75, 50–53. [Google Scholar] [CrossRef] [PubMed]
- Blumberg, T.J.; DeFrancesco, C.; Miller, D.; Pandya, N.K.; Flynn, J.M.; Baldwin, K.D. Firearm-associated Fractures in Children and Adolescents: Trends in the United States 2003–2012. J. Pediatr. Orthop. 2018, 38, e387–e392. [Google Scholar] [CrossRef] [PubMed]
- Arslan, H.; Subasi, M.; Kesemenli, C.; Kapukaya, A.; Necmioğlu, S.; Kayıkçı, C. Problem fractures associated with gunshot wounds in children. Injury 2002, 33, 743–749. [Google Scholar] [CrossRef] [PubMed]
- Dowd, M.D.; Knapp, J.F.; Fitzmaurice, L.S. Pediatric firearm injuries, Kansas City, 1992: A population-based study. Pediatrics 1994, 94, 867–873. [Google Scholar] [CrossRef]
- Dundas, S.E.; Abel, C.; Duncan, N.D.; Pinnock-Ramsaran, C.; Sawh, D. Pre-adolescent gunshot injuries: Anatomy of a Jamaican problem. West Indian Med. J. 2007, 56, 508. [Google Scholar]
- Jones, M.; Kistamgari, S.; Smith, G.A. Nonpowder Firearm Injuries to Children Treated in Emergency Departments. Pediatrics 2019, 144, e20192739. [Google Scholar] [CrossRef] [Green Version]
- Naranje, S.M.; Gilbert, S.R.; Stewart, M.G.; Rush, J.K.; Bleakney, C.A.; McKay, J.E.; Warner, W.C.; Kelly, D.M.; Sawyer, J.R. Gunshot-associated Fractures in Children and Adolescents Treated at Two Level 1 Pediatric Trauma Centers. J. Pediatr. Orthop. 2016, 36, 1–5. [Google Scholar] [CrossRef]
- Perkins, C.; Scannell, B.; Brighton, B.; Seymour, R.; Vanderhave, K. Orthopaedic firearm injuries in children and adolescents: An eight-year experience at a major urban trauma center. Injury 2015, 47, 173–177. [Google Scholar] [CrossRef]
- Ordog, G.; Prakash, A.; Wasserberger, J.; Balasubramaniam, S. Pediatric Gunshot Wounds. J. Trauma Inj. Infect. Crit. Care 1987, 21, 1272–1278. [Google Scholar] [CrossRef] [PubMed]
- Ordog, G.J.; Wasserberger, J.; Schatz, I.; Owens-Collins, D.; English, K.; Balasubramanian, S.; Schlater, T. Gunshot wounds in children under 10 years of age. A new epidemic. Am. J. Dis. Child. 1988, 142, 618–622. [Google Scholar] [CrossRef] [PubMed]
- Victoroff, B.M.; Robertson, W.W.; Eichelberger, M.R.; Wright, C. Extremity gunshot injuries treated in an urban children’s hospital. Pediatr. Emerg. Care 1994, 10, 1–5. [Google Scholar] [CrossRef] [PubMed]
- Stucky, W.; Loder, R.T. Extremity Gunshot Wounds in Children. J. Pediatr. Orthop. 1991, 11, 64–71. [Google Scholar] [CrossRef] [PubMed]
- Washington, E.R.; Lee, W.E.; Ross, W.A., Jr. Gunshot wounds to the extremities in children and adolescents. Orthop. Clin. N. Am. 1995, 26, 19–28. [Google Scholar] [CrossRef]
- Nicholas, R.M.; Boston, V.E.; Small, J.; Kerr Graham, H. Limb salvage after bony and vascular gunshot injuries in a five-week-old infant. J. Bone Jt. Surg. Br. Vol. 1995, 77, 439–441. [Google Scholar] [CrossRef] [Green Version]
- Massar, S.A.; Ng, A.S.C.; Soon, C.S.; Ong, J.L.; Chua, X.Y.; Chee, N.I.Y.N.; Lee, T.S.; Chee, M.W.L. Reopening after lockdown: The influence of working-from home and digital device use on sleep, physical activity, and wellbeing following COVID-19 lockdown and reopening. Sleep 2022, 45, 1–10. [Google Scholar] [CrossRef] [PubMed]
- Bram, J.T.B.; Johnson, M.A.B.; Magee, L.C.B.; Mehta, N.N.B.; Fazal, F.Z.B.; Baldwin, K.D.M.; Riley, J.B.; Shah, A.S.M. Where have all the fractures gone? The epidemiology of pediatric fractures during the COVID-19 pandemic. J. Pediatr. Orthop. 2020, 40, 373–379. [Google Scholar] [CrossRef]
- Markiewitz, N.D.M.; Garcia-Munoz, J.M.; Lilley, B.M.B.; Oduwole, S.; Shah, A.S.M.; Williams, B.A. Epidemiologic Changes in Pediatric Fractures Presenting to Emergency Departments During the COVID-19 Pandemic. J. Pediatr. Orthop. 2022, 42, e815–e820. [Google Scholar] [CrossRef]
- Shaw, K.G.; Salton, R.L.; Carry, P.; Hadley-Miller, N.; Georgopoulos, G. Multi-day delay to care identified in pediatric trauma cases during COVID-19. J. Pediatr. Orthop. B 2021, 31, e56–e64. [Google Scholar] [CrossRef]
- Turgut, A.; Arlý, H.; Altundağ, Ü.; Hancioìğlu, S.; Egeli, E.; Kalenderer, Ö. Effect of COVID-19 pandemic on the fracture demographics: Data from a tertiary care hospital in Turkey. Acta Orthop. Traumatol. Turc. 2020, 54, 355–363. [Google Scholar] [CrossRef] [PubMed]
- Schultz, J.D.; Windmueller, R.; Rees, A.B.; Wollenman, L.C.; Lempert, N.L.; Schoenecker, J.G.M.; Moore-Lotridge, S.N. Impact of the COVID-19 pandemic on pediatric elbow fractures: Marked change in management and resource utilization, without a change in incidence. J. Pediatr. Orthop. 2022, 42, 401–407. [Google Scholar] [CrossRef] [PubMed]
- Magee, L.A.; Lucas, B.; Fortenberry, J.D. Changing epidemiology of firearm injury: A cohort study of non-fatal firearm victimisation before and during the COVID-19 pandemic, Indianapolis, Indiana. BMJ Open 2022, 12, e059315. [Google Scholar] [CrossRef] [PubMed]
- Collings, A.T.; Farazi, M.; Van Arendonk, K.J.; Fallat, M.E.; Minneci, P.C.; Sato, T.T.; Speck, K.E.; Deans, K.J.; Jr, R.A.F.; Foley, D.S.; et al. The COVID-19 pandemic and associated rise in pediatric firearm injuries: A multi-institutional study. J. Pediatr. Surg. 2022, 57, 1370–1376. [Google Scholar] [CrossRef]
- Stevens, J.; Pickett, K.; Kaar, J.; Nolan, M.M.; Reppucci, M.L.; Corkum, K.; Hills-Dunlap, J.; Haasz, M.; Acker, S. The impact of the COVID-19 pandemic on pediatric firearm injuries in Colorado. J. Pediatr. Surg. 2022, 58, 344–349. [Google Scholar] [CrossRef]
- Eveleth, P.B.; Tanner, J.M. Worldwide Variation in Human Growth, 2nd ed.; Cambridge University Press: Cambridge, UK, 1990. [Google Scholar]
- Faure, A.; Nemoz, C.; Claustrat, B. A graphical and statistical method for investigation of time series in chronobiology according to the cosinor procedure. Comput. Biol. Med. 1990, 20, 319–329. [Google Scholar] [CrossRef]
- Nelson, W.; Tong, Y.L.; Lee, J.-K.; Halberg, F. Methods for cosinor-rhythymometry. Chronobiologia 1979, 6, 305–323. [Google Scholar]
- Gudeman, A.; Loder, R.T.; Figueras, J.; Osterbur, T.; Fitzgerald, R. Seasonal differences in emergency department visits for scooter associated injuries. Chrono Int. 2021, 39, 241–248. [Google Scholar] [CrossRef]
- Loder, R.T.; Abrams, S. Temporal variation in childhood injury from common recreational activities. Injury 2011, 42, 945–957. [Google Scholar] [CrossRef] [PubMed]
- Loder, R.T.; Krodel, E.; D’Amico, K. Temporal variation in pediatric supracondylar humerus fractures requiring surgical intervention. J. Child. Orthop. 2012, 6, 419–425. [Google Scholar] [CrossRef] [Green Version]
- Loder, R.T.; Mishra, A.; Atoa, B.; Young, A. Spinal Injury Associated With Firearm Use. Cureus 2021, 13, e13918. [Google Scholar] [CrossRef] [PubMed]
- Carrillo, E.H.; Gonzalez, J.K.; Carrillo, L.E.; Chacon, P.M.; Namias, N.; Kirton, O.C.; Byers, P.M. Spinal cord injuries in adolescents after gunshot wounds: An increasing phenomenon in urban North America. Injury 1998, 29, 503–507. [Google Scholar] [CrossRef] [PubMed]
- Dowd, M.D.; Sege, R.D.; Committe, The Council on Injury, Violence, and Poison Prevention. Firearm-related injuries affecting the pediatric population. Pediatrics 2012, 130, e1416–e1423. [Google Scholar] [CrossRef] [PubMed] [Green Version]
- Lee, L.K.; Fleegler, E.W.; Goyal, M.K.; Doh, K.F.; Laraque-Arena, D.; Hoffman, B.D.; Culyba, A.; Dodington, J.; Johnston, B.; Kendi, S.; et al. Firearm-related injuries and deaths in children and youth. Pediatrics 2022, 150, e2022060071. [Google Scholar] [CrossRef] [PubMed]
- Price, J.H.; Khubchandani, J. Firearm Mortality Among Pre-school Age Children, 2010–2020. J. Community Health 2022, 47, 1–6. [Google Scholar] [CrossRef]
- Hoskins, K.; Paladhi, U.R.; McDonald, C.; Buttenheim, A. Applying Behavioral Economics to Enhance Safe Firearm Storage. Pediatrics 2020, 145, e20192268. [Google Scholar] [CrossRef]
- Ye, G.F.; Thatipamala, P.; Siegel, M. Assessment of reasons for ownership and attitudes about policies among firearm owners with and without children. JAMA Netw. Open 2022, 5, e2142995. [Google Scholar] [CrossRef]
- Loder, R.; Sabatino, M. Firearm Injuries Occurring at School: Differences by Educational Level. Eur. J. Forensic Sci. 2016, 3, 1–6. [Google Scholar] [CrossRef]
- Tatebe, L.C.; Sanchez, J.; Pekarek, S.; Koo, N.; Mis, J.; Schlanser, V.; Bokhari, F.; Dennis, A.J. Pediatric Firearm-Related Injuries: Taking Kids Out of Harm’s Way Begins with Targeted Prevention. J. Surg. Res. 2021, 267, 719–725. [Google Scholar] [CrossRef]
- Loder, R.T. Temporal variation in United States firearm injuries 1993-2008: Results from a national data base. J. Inj. Violence Res. 2014, 6, 1–15. [Google Scholar] [CrossRef] [Green Version]
- Roaten, J.D.; Kelly, D.M.; Yellin, J.L.; Flynn, J.M.; Cyr, M.; Garg, S.; Broom, A.; Andras, L.M.; Sawyer, J.R. Pediatric Femoral Shaft Fractures: A Multicenter Review of the AAOS Clinical Practice Guidelines Before and After 2009. J. Pediatr. Orthop. 2019, 39, 394–399. [Google Scholar] [CrossRef]
- Kleiner, J.E.; Raducha, J.E.; Cruz, J.A.I. Increasing rates of surgical treatment for paediatric tibial shaft fractures: A national database study from between 2000 and 2012. J. Child. Orthop. 2019, 13, 213–219. [Google Scholar] [CrossRef] [PubMed]
- Sassi, E.; Hannonen, J.; Serlo, W.; Sinikumpu, J.-J. Increase in surgical fixation of pediatric midshaft clavicle fractures since 2008. BMC Musculoskelet. Disord. 2022, 23, 1–10. [Google Scholar] [CrossRef] [PubMed]
- Sinikumpu, J.-J.; Lautamo, A.; Pokka, T.; Serlo, W. The increasing incidence of paediatric diaphyseal both-bone forearm fractures and their internal fixation during the last decade. Injury 2012, 43, 362–366. [Google Scholar] [CrossRef] [PubMed]
- Annest, J.L.; Mercy, J.A.; Gibson, D.R.; Ryan, G.W. National Estimates of Nonfatal Firearm-Related Injuries: Beyond the tip of the iceberg. JAMA 1995, 273, 1749–1754. [Google Scholar]
- Hopkins, R.S. Consumer product-related injuries in Athens, Ohio, 1980-1985: Assessment of emergency room-based surveillance. Am. J. Prev. Med. 1989, 5104–5112. [Google Scholar]
- Patel, S.J.; Badolato, G.M.; Parikh, K.; Iqbal, S.F.; Goyal, M.K. Regional Differences in Pediatric Firearm-Related Emergency Department Visits and the Association With Firearm Legislation. Ped. Emerg. Care 2021, 37, e692–e695. [Google Scholar] [CrossRef] [PubMed]
Figure 1.
Fracture distribution by major anatomic location: (a) for those patients treated and released from the ED; (b) for those patients admitted to the hospital from the ED.
Figure 1.
Fracture distribution by major anatomic location: (a) for those patients treated and released from the ED; (b) for those patients admitted to the hospital from the ED.

Figure 2.
Differences between the four major fracture locations (spine, upper extremity, lower extremity, and skull/face: (a) by age group (p = 0.041); (b) by firearm type (p < 10−4); (c) by ED disposition (p = 0.0001); (d) by being shot or not (p < 10−4).
Figure 2.
Differences between the four major fracture locations (spine, upper extremity, lower extremity, and skull/face: (a) by age group (p = 0.041); (b) by firearm type (p < 10−4); (c) by ED disposition (p = 0.0001); (d) by being shot or not (p < 10−4).

Figure 3.
Differences between powder and non-powder firearms: (a) by race (p = 0.0005); (b) by perpetrator of the injury (p < 10−4); (c) by injury intent (p < 10−4); (d) by incident locale (p < 10−4); (e) by age group (p = 0.006).
Figure 3.
Differences between powder and non-powder firearms: (a) by race (p = 0.0005); (b) by perpetrator of the injury (p < 10−4); (c) by injury intent (p < 10−4); (d) by incident locale (p < 10−4); (e) by age group (p = 0.006).

Figure 4.
Differences between being shot or not. (a) By incident locale (p < 10−4); (b) by disposition from the ED (p < 10−4).
Figure 4.
Differences between being shot or not. (a) By incident locale (p < 10−4); (b) by disposition from the ED (p < 10−4).

Figure 5.
Differences by disposition from the ED: (a) by race (p = 0.011); (b) by perpetrator of the injury (p = 0.0006); (c) by intent of the injury (p < 10−4); (d) by year time span (p = 0.004).
Figure 5.
Differences by disposition from the ED: (a) by race (p = 0.011); (b) by perpetrator of the injury (p = 0.0006); (c) by intent of the injury (p < 10−4); (d) by year time span (p = 0.004).

Figure 6.
Differences in age group by incident locale (p = 0.037). Note the decreasing number of cases occurring at home with increasing age.
Figure 6.
Differences in age group by incident locale (p = 0.037). Note the decreasing number of cases occurring at home with increasing age.

Figure 7.
Temporal variability in the number of ED visits for fractures in children < 16 years old: (a) by day of the week. Note the increased number of ED visits on the weekend); (b) by month. Note that there is no apparent pattern. There was no change by month upon linear regression analysis: r2 = 0.057, p = 0.45. Additionally, cosinor analysis [37,38] demonstrated no rhythmic pattern as seen in many other pediatric non-firearm injuries [39,40,41]; (c) by year from 1993 through 2019. There was no change over time upon linear regression analysis: r2 = 0.05, p = 0.26.


Table 1.
Demographics of the 19,033 patients.
| n | N | L95%CI | U95%CI | % | |
|---|---|---|---|---|---|
| All | 711 | 19,033 | 14,321 | 25,200 | - |
| Age (average in years) | 12.2 [11.7, 12.6] | ||||
| Fracture location | |||||
| Spine | 39 | 717 | 416 | 1221 | 3.8 |
| Upper extremity | 292 | 9209 | 7612 | 10,823 | 48.4 |
| Lower extremity | 251 | 5982 | 4952 | 7118 | 31.5 |
| Skull/face | 114 | 2894 | 2137 | 3857 | 15.2 |
| Rib | 13 | 209 | 110 | 397 | 1.1 |
| Number of fractures per patient | |||||
| 1 | 695 | 18,640 | 18,245 | 18,834 | 98.0 |
| 2 | 13 | 365 | 173 | 760 | 1.9 |
| 3 | 1 | 6 | 0 | 42 | 0.0 |
| Sex | |||||
| Male | 586 | 16,203 | 15,578 | 16,731 | 85.2 |
| Female | 124 | 2825 | 2297 | 3450 | 14.8 |
| Race | |||||
| White | 214 | 8215 | 7032 | 9364 | 54.9 |
| Black | 270 | 4883 | 3584 | 6389 | 32.6 |
| Amerindian | 60 | 1809 | 933 | 3314 | 12.1 |
| Asian | 2 | 70 | 9 | 502 | 0.5 |
| Firearm type | |||||
| Powder | 536 | 12,314 | 10,662 | 13,801 | 64.7 |
| Non-powder | 175 | 6719 | 5232 | 8371 | 35.3 |
| Shot | |||||
| Yes | 617 | 15,376 | 14,378 | 16,203 | 80.8 |
| No | 94 | 3657 | 2830 | 4655 | 19.2 |
| Drive by shooting | 0 | 0 | 0.0 | ||
| Yes | 43 | 705 | 447 | 1100 | 3.7 |
| No | 668 | 18,328 | 17,933 | 18,586 | 96.3 |
| Disposition from ED | |||||
| Release | 385 | 13,272 | 11,267 | 15,334 | 68.7 |
| Admit | 321 | 5631 | 3889 | 7987 | 29.1 |
| Death | 3 | 100 | 21 | 485 | 0.5 |
| Who caused the injury | |||||
| Unknown | 207 | 4533 | 3624 | 5586 | 23.8 |
| Stranger | 91 | 1494 | 967 | 2273 | 7.8 |
| Self | 214 | 8148 | 6926 | 9419 | 42.8 |
| Friend/acquaintance | 58 | 1577 | 1146 | 2149 | 8.3 |
| Other relative | 54 | 1299 | 876 | 1907 | 6.8 |
| Other/not seen | 86 | 1906 | 1338 | 2678 | 10.0 |
| Injury intent | |||||
| Unknown | 37 | 985 | 560 | 1707 | 5.2 |
| Unintentional | 328 | 11,417 | 9977 | 12,771 | 60.0 |
| Assault | 336 | 6401 | 5097 | 7851 | 33.6 |
| Suicide | 4 | 157 | 34 | 689 | 0.8 |
| Law enforcement | 6 | 73 | 27 | 194 | 0.4 |
| Incident locale | |||||
| Unknown | 242 | 7190 | 5959 | 8502 | 37.8 |
| Home/apt | 272 | 7256 | 6001 | 8599 | 38.1 |
| School/recreation | 43 | 1298 | 862 | 1930 | 6.8 |
| Street/highway | 96 | 1867 | 1256 | 2727 | 9.8 |
| Other property | 57 | 1310 | 847 | 1997 | 6.9 |
| Farm | 1 | 112 | 15 | 797 | 0.6 |
| Year span | |||||
| 1993–2001 | 180 | 7027 | 5383 | 8848 | 36.9 |
| 2002–2010 | 252 | 6108 | 4762 | 7630 | 32.1 |
| 2011–2019 | 279 | 5898 | 4604 | 7370 | 31.0 |
| Hospital size | |||||
| Small | 64 | 5154 | 3493 | 7238 | 27.1 |
| Medium | 56 | 3485 | 2033 | 5632 | 18.3 |
| Large | 98 | 5226 | 2630 | 8982 | 27.5 |
| Very large | 227 | 3671 | 2282 | 5620 | 19.3 |
| Children | 266 | 1497 | 744 | 2893 | 7.9 |
| Argument | |||||
| Unknown | 306 | 7408 | 204,300 | 7321 | 69.5 |
| Yes | 29 | 691 | 405 | 1165 | 3.6 |
| No | 376 | 10,934 | 9606 | 12,208 | 57.4 |
| Crime | |||||
| Unknown | 290 | 6993 | 5836 | 8237 | 36.7 |
| Yes | 83 | 1208 | 700 | 2044 | 6.3 |
| No | 338 | 10,832 | 9505 | 12,109 | 56.9 |
| Drugs | |||||
| Unknown | 319 | 7665 | 6344 | 9064 | 40.3 |
| Yes | 17 | 398 | 188 | 830 | 2.1 |
| No | 375 | 10,970 | 9610 | 12,272 | 57.6 |
| Fight | |||||
| Unknown | 283 | 6606 | 5055 | 8350 | 34.7 |
| Yes | 34 | 705 | 390 | 1260 | 3.7 |
| No | 394 | 11,722 | 10,217 | 13,118 | 61.6 |
n = actual number, N = estimated number, L95%CI is the lower 95% confidence limit for N, U95%CI is the upper confidence limit for N.
Table 2.
Anatomic distribution of 19,370 fractures in 19,033 patients.
| All Patients | Released from ED | Admitted to Hospital | |||||
|---|---|---|---|---|---|---|---|
| Bone | n | N | %N | N | N% | N | N% |
| Finger | 157 | 6043 | 31.4% | 5875 | 43.6% | 168 | 2.9% |
| Face | 70 | 2127 | 11.1% | 1291 | 9.6% | 836 | 14.5% |
| Foot | 51 | 1394 | 7.2% | 1186 | 8.8% | 208 | 3.6% |
| Toe | 33 | 1348 | 7.0% | 1253 | 9.3% | 95 | 1.6% |
| Tibia/fibula | 75 | 1301 | 6.8% | 316 | 2.3% | 985 | 17.1% |
| Hand | 46 | 1208 | 6.3% | 1013 | 7.5% | 195 | 3.4% |
| Femur | 57 | 1036 | 5.4% | 215 | 1.6% | 821 | 14.2% |
| Forearm | 37 | 844 | 4.4% | 432 | 3.2% | 412 | 7.1% |
| Skull | 45 | 741 | 3.9% | 217 | 1.6% | 524 | 9.1% |
| Humerus | 30 | 658 | 3.4% | 476 | 3.5% | 182 | 3.2% |
| Ankle | 15 | 479 | 2.5% | 374 | 2.8% | 105 | 1.8% |
| Knee | 12 | 399 | 2.1% | 230 | 1.7% | 169 | 2.9% |
| Scapula/shoulder | 15 | 386 | 2.0% | 168 | 1.2% | 218 | 3.8% |
| Cervical spine | 7 | 246 | 1.3% | 120 | 0.9% | 126 | 2.2% |
| Thoracic spine | 15 | 219 | 1.1% | 6 | 0.0% | 213 | 3.7% |
| Rib | 14 | 215 | 1.1% | 65 | 0.5% | 150 | 2.6% |
| Lumbar spine | 12 | 168 | 0.9% | 18 | 0.1% | 150 | 2.6% |
| Clavicle | 5 | 159 | 0.8% | 143 | 1.1% | 16 | 0.3% |
| Sacrococcygeal spine | 5 | 84 | 0.4% | 18 | 0.1% | 66 | 1.1% |
| Wrist | 7 | 81 | 0.4% | 37 | 0.3% | 44 | 0.8% |
| Pelvis | 7 | 59 | 0.3% | 6 | 0.0% | 53 | 0.9% |
| Elbow | 4 | 23 | 0.1% | 11 | 0.1% | 12 | 0.2% |
| Hip | 2 | 22 | 0.1% | 0 | 0.0% | 22 | 0.4% |
n = actual number, N = estimated number of ED visits.
Table 3.
Analyses by fracture location.
| Spine | Upper Extremity | Lower Extremity | Skull/Face | Rib | p Value | p Value ^ | |||||||||||||||||||||
|---|---|---|---|---|---|---|---|---|---|---|---|---|---|---|---|---|---|---|---|---|---|---|---|---|---|---|---|
| Variable | n | N | L95%CI | U95%CI | % | n | N | L95%CI | U95%CI | % | n | N | L95%CI | U95%CI | % | n | N | L95%CI | U95%CI | % | n | N | L95%CI | U95%CI | % | ||
| All | 39 | 717 | 416 | 1221 | 4.0 | 292 | 9209 | 7612 | 10,823 | 12.8 | 251 | 5982 | 4952 | 7118 | 31.5 | 114 | 2894 | 2137 | 3857 | 15.2 | 13 | 209 | 110 | 397 | 1.1 | - | - |
| Age (average in years) | 11.6 [10.7, 12.5] | 13.8 [12.2, 15.4] | 12.7 [11.8, 13.6] | 11.6 [10.7, 12.5] | 13.8 [12.2, 15.4] | 0.005 | |||||||||||||||||||||
| Age group (years) | |||||||||||||||||||||||||||
| ≤5 | 2 | 21 | 4 | 97 | 3 | 26 | 743 | 445 | 1212 | 8.1 | 16 | 429 | 141 | 1187 | 7.2 | 19 | 438 | 211 | 834 | 15.1 | 1 | 15 | 2 | 86 | 7 | 0.041 | 0.12 |
| 6 to 10 | 3 | 46 | 10 | 182 | 6 | 50 | 1802 | 1260 | 2504 | 19.6 | 27 | 633 | 398 | 982 | 10.6 | 17 | 336 | 178 | 603 | 11.6 | 0 | 0 | 0 | 0 | 0 | ||
| 11 to 15 | 34 | 650 | 518 | 698 | 91 | 216 | 6664 | 5980 | 7250 | 72.4 | 208 | 4920 | 4318 | 5337 | 82.2 | 78 | 2120 | 1827 | 2357 | 73.3 | 12 | 194 | 123 | 207 | 93 | ||
| Sex | |||||||||||||||||||||||||||
| Male | 33 | 596 | 481 | 660 | 84 | 250 | 8149 | 7609 | 8523 | 88.5 | 203 | 5142 | 4762 | 5418 | 86.0 | 87 | 2118 | 1714 | 2422 | 73.2 | 12 | 193 | 120 | 207 | 92 | 0.51 | 0.39 |
| Female | 5 | 116 | 52 | 231 | 16 | 42 | 1060 | 686 | 1600 | 11.5 | 48 | 840 | 564 | 1220 | 14.0 | 27 | 776 | 472 | 1180 | 26.8 | 1 | 16 | 2 | 89 | 8 | ||
| Race | |||||||||||||||||||||||||||
| White | 5 | 133 | 37 | 330 | 23 | 114 | 4896 | 4134 | 5551 | 67.3 | 51 | 1808 | 1414 | 2236 | 39.1 | 40 | 1283 | 958 | 1584 | 56.9 | 4 | 95 | 38 | 131 | 66 | 0.003 | 0.0007 |
| Black | 19 | 277 | 90 | 479 | 47 | 97 | 1901 | 1335 | 2602 | 26.1 | 116 | 2131 | 1460 | 2834 | 46.1 | 31 | 504 | 291 | 810 | 22.3 | 5 | 48 | 12 | 105 | 34 | ||
| Amerindian | 5 | 179 | 79 | 325 | 30 | 22 | 474 | 240 | 908 | 6.5 | 19 | 687 | 294 | 1432 | 14.9 | 14 | 469 | 190 | 968 | 20.8 | 0 | 0 | 0 | 0 | 0 | ||
| Firearm Type | |||||||||||||||||||||||||||
| Powder | 37 | 705 | 666 | 714 | 98 | 168 | 4275 | 3460 | 5112 | 46.4 | 225 | 4841 | 4058 | 5354 | 80.9 | 92 | 2267 | 1841 | 2553 | 78.3 | 12 | 204 | 174 | 208 | 98 | <10−4 | 0.0004 |
| Non-powder | 2 | 12 | 3 | 51 | 2 | 124 | 4934 | 4097 | 5749 | 53.6 | 26 | 1141 | 628 | 1924 | 19.1 | 22 | 627 | 341 | 1053 | 21.7 | 1 | 5 | 1 | 35 | 2 | ||
| Shot | |||||||||||||||||||||||||||
| Yes | 38 | 701 | 602 | 715 | 98 | 238 | 6954 | 6238 | 7543 | 75.5 | 243 | 5720 | 5316 | 5883 | 95.6 | 83 | 1770 | 1376 | 2119 | 61.2 | 13 | 209 | 2 | 5 | 100 | 0.0001 | <10−4 |
| No | 1 | 16 | 2 | 115 | 2 | 54 | 2255 | 1666 | 2971 | 24.5 | 8 | 262 | 99 | 666 | 4.4 | 31 | 1124 | 775 | 1518 | 38.8 | 0 | 0 | 0 | 0 | 0 | ||
| Drive by shooting | |||||||||||||||||||||||||||
| Yes | 7 | 63 | 22 | 162 | 9 | 14 | 272 | 110 | 659 | 3.0 | 20 | 295 | 137 | 617 | 4.9 | 1 | 60 | 12 | 281 | 2.1 | 1 | 15 | 2 | 86 | 7 | 0.67 | 0.53 |
| No | 32 | 654 | 555 | 695 | 91 | 278 | 8937 | 8551 | 9099 | 97.0 | 231 | 5687 | 5365 | 5845 | 95.1 | 113 | 2834 | 2613 | 2882 | 97.9 | 12 | 194 | 123 | 207 | 93 | ||
| Disposition from ED | |||||||||||||||||||||||||||
| Release | 6 | 162 | 44 | 405 | 23 | 220 | 8007 | 7347 | 8457 | 86.9 | 112 | 3525 | 2887 | 4116 | 59.1 | 42 | 1508 | 995 | 2004 | 52.4 | 4 | 65 | 23 | 130 | 31 | 0.0001 | 0.0001 |
| Admit | 33 | 555 | 312 | 673 | 77 | 72 | 1202 | 752 | 1862 | 13.1 | 138 | 2442 | 1851 | 3080 | 40.9 | 68 | 1271 | 755 | 1834 | 44.1 | 9 | 144 | 79 | 186 | 69 | ||
| Death | 0 | 0 | 0 | 0 | 0 | 0 | 0 | 0 | 0 | 0.0 | 0 | 0 | 0.0 | 3 | 100 | 20 | 444 | 3.5 | 0 | 0 | 0 | ||||||
| Who caused the injury | |||||||||||||||||||||||||||
| Unknown | 16 | 361 | 207 | 514 | 50 | 62 | 1658 | 1213 | 2221 | 18.0 | 79 | 1452 | 1004 | 2018 | 24.3 | 40 | 877 | 584 | 1238 | 30.3 | 9 | 168 | 110 | 196 | 80 | <10−4 | <10−4 |
| Stranger | 7 | 50 | 14 | 155 | 7 | 30 | 392 | 227 | 666 | 4.3 | 44 | 910 | 505 | 1548 | 15.2 | 8 | 132 | 41 | 402 | 4.6 | 1 | 5 | 1 | 35 | 2 | ||
| Self | 2 | 21 | 4 | 98 | 3 | 128 | 5184 | 4338 | 5991 | 56.3 | 63 | 2259 | 1667 | 2919 | 37.8 | 21 | 684 | 479 | 943 | 23.6 | 0 | 0 | 0 | 0 | 0 | ||
| Friend/acquaintance | 4 | 90 | 33 | 214 | 13 | 16 | 525 | 280 | 961 | 5.7 | 20 | 634 | 363 | 1069 | 10.6 | 17 | 323 | 127 | 739 | 11.2 | 1 | 5 | 1 | 35 | 2 | ||
| Other relative | 3 | 58 | 14 | 202 | 8 | 19 | 475 | 222 | 984 | 5.2 | 11 | 244 | 100 | 574 | 4.1 | 20 | 506 | 308 | 792 | 17.5 | 1 | 16 | 3 | 72 | 8 | ||
| Other/not seen | 7 | 137 | 72 | 240 | 19 | 36 | 899 | 541 | 1456 | 9.8 | 34 | 483 | 246 | 912 | 8.1 | 8 | 372 | 133 | 902 | 12.9 | 1 | 15 | 2 | 86 | 7 | ||
| Injury intent | |||||||||||||||||||||||||||
| Unknown | 2 | 12 | 3 | 48 | 2 | 19 | 588 | 314 | 1072 | 6.4 | 13 | 264 | 112 | 599 | 4.4 | 3 | 121 | 31 | 432 | 4.2 | 0 | 0 | 0 | 0 | 0 | <10− | <10−4 |
| Unintentional | 6 | 111 | 48 | 228 | 15 | 177 | 6747 | 5994 | 7377 | 73.3 | 93 | 3168 | 2408 | 3905 | 53.0 | 50 | 1370 | 899 | 1858 | 47.3 | 2 | 21 | 5 | 69 | 10 | ||
| Assault | 30 | 578 | 474 | 645 | 81 | 93 | 1839 | 1244 | 2625 | 20.0 | 143 | 2528 | 1845 | 3264 | 42.3 | 57 | 1246 | 901 | 1615 | 43.1 | 11 | 188 | 140 | 204 | 90 | ||
| Suicide | 0 | 0 | 0 | 0 | 0 | 0 | 0 | 0 | 0 | 0.0 | 0 | 0 | 0 | 0 | 0.0 | 4 | 157 | 41 | 542 | 5.4 | 0 | 0 | 0 | 0 | 0 | ||
| Law enforcement | 1 | 16 | 2 | 105 | 2 | 3 | 35 | 10 | 116 | 0.4 | 2 | 22 | 5 | 102 | 0.4 | 0 | 0 | 0 | 0 | 0.0 | 0 | 0 | 0 | 0 | 0 | ||
| Incident locale | |||||||||||||||||||||||||||
| Unknown | 15 | 254 | 136 | 404 | 35 | 99 | 3603 | 2789 | 4488 | 39.1 | 78 | 1879 | 1345 | 2511 | 31.4 | 44 | 1324 | 945 | 1720 | 45.7 | 5 | 113 | 53 | 168 | 54 | 0.003 | 0.002 |
| Home/apt | 11 | 218 | 153 | 297 | 30 | 127 | 3802 | 3020 | 4636 | 41.3 | 83 | 2162 | 1415 | 3040 | 36.1 | 46 | 1014 | 764 | 1296 | 35.0 | 4 | 55 | 22 | 109 | 26 | ||
| School/recreation | 1 | 6 | 1 | 46 | 1 | 18 | 712 | 387 | 1270 | 7.7 | 14 | 302 | 166 | 540 | 5.0 | 8 | 258 | 88 | 677 | 8.9 | 2 | 20 | 4 | 83 | 10 | ||
| Street/highway | 5 | 140 | 51 | 312 | 20 | 32 | 468 | 271 | 797 | 5.1 | 49 | 1080 | 720 | 1567 | 18.1 | 10 | 179 | 69 | 438 | 6.2 | 0 | 0 | 0 | 0 | 0 | ||
| Other property | 7 | 99 | 44 | 203 | 14 | 16 | 624 | 288 | 1294 | 6.8 | 27 | 559 | 328 | 925 | 9.3 | 6 | 119 | 49 | 276 | 4.1 | 2 | 21 | 5 | 69 | 10 | ||
n = actual number, N = estimated number, L95%CI is the lower 95% confidence limit for N, U95%CI is the upper confidence limit for N. ^ p value excluding the rib group.
Table 4.
Analyses by firearm type.
| Powder | Non-Powder | ||||||||||
|---|---|---|---|---|---|---|---|---|---|---|---|
| Variable | n | N | L95%CI | U95%CI | % | n | N | L95%CI | U95%CI | % | p Value |
| All | 536 | 12,314 | 10,662 | 13,801 | 64.7 | 175 | 6719 | 5242 | 8382 | 35.3 | - |
| Age (average in years) | 12.5 [11.9, 13.1] | 11.7 [11.1, 12.2] | 0.58 | ||||||||
| Age group (years) | |||||||||||
| ≤5 years | 53 | 1299 | 803 | 2047 | 10.5 | 12 | 352 | 76 | 335 | 5.2 | 0.012 |
| 6 to 10 | 56 | 1241 | 896 | 1698 | 10.1 | 41 | 1576 | 408 | 815 | 23.5 | |
| 11 to 15 | 427 | 9774 | 9006 | 10,402 | 79.4 | 122 | 4791 | 703 | 892 | 71.3 | |
| Sex | |||||||||||
| Male | 425 | 10,012 | 9410 | 10,512 | 81.3 | 161 | 6191 | 5702 | 6456 | 92.1 | 0.0024 |
| Female | 110 | 2297 | 1797 | 2899 | 67.0 | 14 | 528 | 263 | 1017 | 7.9 | |
| Race | |||||||||||
| White | 124 | 4336 | 3510 | 5195 | 45.7 | 90 | 3879 | 3166 | 4436 | 71.6 | 0.0005 |
| Black | 288 | 3740 | 2593 | 5032 | 39.4 | 32 | 1143 | 665 | 1832 | 21.1 | |
| Amerindian | 44 | 1413 | 803 | 2366 | 14.9 | 16 | 396 | 145 | 998 | 7.3 | |
| Fracture location | |||||||||||
| Spine | 37 | 705 | 429 | 1140 | 5.8 | 2 | 12 | 3 | 45 | 0.2 | <10−4 |
| Upper extremity | 168 | 4275 | 3327 | 5330 | 35.4 | 124 | 4934 | 4179 | 5528 | 73.5 | |
| Lower extremity | 225 | 4841 | 4070 | 5655 | 40.0 | 26 | 1141 | 648 | 1891 | 17.0 | |
| Head/face | 92 | 2267 | 1677 | 3005 | 18.8 | 22 | 627 | 330 | 1142 | 9.3 | |
| Shot | |||||||||||
| Yes | 476 | 10,070 | 9244 | 10,712 | 81.8 | 141 | 5306 | 2830 | 4655 | 79.0 | 0.59 |
| No | 60 | 2244 | 1603 | 3070 | 18.2 | 34 | 1413 | 2830 | 4655 | 21.0 | |
| Drive by shooting | 0 | 0 | 0.0 | 0 | 0 | 0.0 | |||||
| Yes | 42 | 627 | 399 | 975 | 5.1 | 1 | 78 | 11 | 538 | 1.2 | 0.022 |
| No | 494 | 11,687 | 11,339 | 11,915 | 94.9 | 174 | 6641 | 6181 | 6708 | 98.8 | |
| Disposition from the ED | |||||||||||
| Released | 233 | 6953 | 5669 | 8200 | 56.5 | 152 | 6319 | 2830 | 4655 | 94.0 | <10−4 |
| Admitted | 298 | 5231 | 3987 | 6583 | 42.5 | 23 | 400 | 2830 | 4655 | 6.0 | |
| Died | 3 | 100 | 14 | 309 | 0.8 | 0 | 0 | 2830 | 4655 | 0.0 | |
| Who caused the injury | |||||||||||
| Unknown | 181 | 3602 | 2890 | 4408 | 29.3 | 26 | 931 | 556 | 1498 | 13.9 | <10−4 |
| Stranger | 90 | 1416 | 909 | 2154 | 11.5 | 1 | 78 | 11 | 538 | 1.2 | |
| Self | 106 | 3765 | 3045 | 4571 | 30.6 | 108 | 4383 | 3758 | 4938 | 65.2 | |
| Friend/acquaintance | 42 | 1176 | 815 | 1672 | 5.0 | 16 | 401 | 186 | 834 | 6.0 | |
| Other relative | 38 | 857 | 549 | 1319 | 7.0 | 16 | 442 | 237 | 802 | 6.6 | |
| Other/not seen | 79 | 1498 | 1058 | 2088 | 12.2 | 7 | 408 | 183 | 873 | 6.1 | |
| Injury intent | |||||||||||
| Unknown | 26 | 504 | 249 | 1001 | 4.1 | 11 | 481 | 225 | 983 | 7.2 | <10−4 |
| Unintentional | 173 | 5436 | 4536 | 6368 | 44.1 | 155 | 5981 | 5476 | 6297 | 89.0 | |
| Assault | 328 | 6151 | 5269 | 7034 | 50.0 | 8 | 250 | 101 | 600 | 3.7 | |
| Suicide | 3 | 150 | 33 | 659 | 1.2 | 1 | 7 | 1 | 51 | 0.1 | |
| Law enforcement | 6 | 73 | 28 | 191 | 0.6 | 0 | 0 | 0 | 0 | 0.0 | |
| Incident locale | |||||||||||
| Unknown | 173 | 4422 | 5371 | 3553 | 36.2 | 69 | 2768 | 2057 | 3538 | 41.2 | <10−4 |
| Home/apt | 177 | 3788 | 3010 | 4665 | 31.0 | 95 | 3468 | 2755 | 4171 | 51.6 | |
| School/recreation | 40 | 1206 | 772 | 1844 | 9.9 | 3 | 92 | 19 | 421 | 1.4 | |
| Street/highway | 93 | 1812 | 1300 | 2481 | 14.9 | 3 | 55 | 14 | 216 | 0.8 | |
| Other property | 52 | 974 | 638 | 1464 | 8.0 | 5 | 3336 | 123 | 868 | 49.7 | |
| Year group | |||||||||||
| 1993 to 2001 | 109 | 3942 | 2756 | 5352 | 32.0 | 71 | 3085 | 2377 | 3819 | 45.9 | 0.006 |
| 2002 to 2010 | 187 | 3604 | 2601 | 4804 | 29.3 | 65 | 2504 | 1835 | 3255 | 37.3 | |
| 2011 to 2019 | 240 | 4768 | 3670 | 5969 | 38.7 | 39 | 1130 | 707 | 1734 | 16.8 | |
n = actual number, N = estimated number, L95%CI is the lower 95% confidence limit for N, U95%CI is the upper confidence limit for N.
Table 5.
Analyses by being shot or not.
| Shot | Not Shot | p Value | |||||||||
|---|---|---|---|---|---|---|---|---|---|---|---|
| Variable | n | N | L95%CI | U95%CI | % | n | N | L95%CI | U95%CI | % | |
| All | 617 | 15,376 | 14,378 | 16,203 | 80.8 | 94 | 3657 | 2830 | 4655 | 19.2 | - |
| Age (average in years) | 11.5 [11.3, 11.6] | 10.5 [10.1, 10.8] | <10−4 | ||||||||
| Sex | |||||||||||
| Male | 516 | 13,278 | 12,676 | 13,762 | 86.4 | 70 | 2925 | 2480 | 3231 | 80.0 | 0.27 |
| Female | 100 | 2093 | 1609 | 2695 | 13.6 | 24 | 732 | 426 | 1177 | 20.0 | |
| Race | |||||||||||
| White | 168 | 6164 | 5167 | 7154 | 51.2 | 46 | 2051 | 1587 | 2396 | 71.7 | 0.036 |
| Black | 255 | 4389 | 3108 | 5851 | 36.4 | 15 | 494 | 266 | 853 | 17.3 | |
| Amerindian | 48 | 1494 | 772 | 2726 | 12.4 | 12 | 315 | 132 | 687 | 11.0 | |
| Firearm type | |||||||||||
| Powder | 476 | 10,070 | 8534 | 11,421 | 65.5 | 60 | 2244 | 1769 | 2667 | 61.4 | 0.59 |
| Non-powder | 141 | 5306 | 3955 | 6842 | 34.5 | 34 | 1413 | 990 | 1888 | 38.6 | |
| Drive by shooting | |||||||||||
| Yes | 43 | 705 | 452 | 1090 | 4.6 | 0 | 0 | 0 | 0 | 0.0 | <10−4 |
| No | 574 | 14,671 | 14,286 | 14,924 | 95.4 | 94 | 3657 | 2830 | 4655 | 100.0 | |
| Disposition from ED | |||||||||||
| Release | 298 | 9830 | 8049 | 11,390 | 64.1 | 87 | 3442 | 2988 | 3594 | 94.1 | <10−4 |
| Admit | 314 | 5416 | 3846 | 7239 | 35.3 | 7 | 215 | 63 | 669 | 5.9 | |
| Death | 3 | 100 | 20 | 477 | 0.7 | 0 | 0 | 0 | 0 | 0.0 | |
| Fracture location | |||||||||||
| Spine | 38 | 701 | 406 | 1195 | 4.6 | 1 | 16 | 2 | 116 | 0.4 | <10−4 |
| Upper extremity | 238 | 6954 | 5658 | 8287 | 45.9 | 54 | 2255 | 1721 | 2722 | 61.7 | |
| Lower extremity | 243 | 5720 | 4798 | 6705 | 37.8 | 8 | 262 | 102 | 628 | 7.2 | |
| Skull/face | 83 | 1770 | 1213 | 2537 | 11.7 | 31 | 1124 | 721 | 1627 | 30.7 | |
| Who caused | 617 | 15,376 | 0 | 0 | 100.0 | 94 | 3657 | 0 | 0 | 100.0 | |
| Unknown | 185 | 3866 | 3089 | 4763 | 25.1 | 22 | 667 | 397 | 1062 | 18.2 | 0.18 |
| Stranger | 84 | 1366 | 864 | 2117 | 8.9 | 7 | 128 | 41 | 381 | 3.5 | |
| Self | 170 | 6151 | 5139 | 7222 | 40.0 | 44 | 1997 | 1526 | 2446 | 54.6 | |
| Friend/acquaintance | 53 | 1292 | 906 | 1822 | 5.0 | 5 | 285 | 106 | 707 | 7.8 | |
| Other relative | 44 | 1076 | 689 | 1656 | 7.0 | 10 | 223 | 88 | 535 | 6.1 | |
| Other/not seen | 81 | 1625 | 1147 | 2271 | 10.6 | 5 | 281 | 112 | 658 | 7.7 | |
| Injury intent | |||||||||||
| Unknown | 36 | 951 | 533 | 1655 | 6.2 | 1 | 34 | 5 | 225 | 0.9 | 0.0005 |
| Unintentional | 268 | 8635 | 7417 | 9802 | 56.2 | 60 | 2782 | 2320 | 3121 | 76.1 | |
| Assault | 304 | 5565 | 4427 | 6809 | 36.2 | 32 | 836 | 507 | 1290 | 22.9 | |
| Suicide | 4 | 157 | 35 | 675 | 1.0 | 0 | 0 | 0 | 0 | 0.0 | |
| Law enforcement | 5 | 68 | 0 | 191 | 0.4 | 1 | 5 | 1 | 37 | 0.1 | |
| Incident locale | |||||||||||
| Unknown | 203 | 5572 | 4573 | 6741 | 36.2 | 39 | 1618 | 1168 | 2095 | 44.2 | <10−4 |
| Home/apt | 242 | 6200 | 5086 | 7477 | 40.3 | 30 | 1056 | 660 | 1566 | 28.9 | |
| School/recreation | 24 | 476 | 277 | 824 | 3.1 | 19 | 822 | 472 | 1323 | 22.5 | |
| Street/highway | 91 | 1775 | 1244 | 2526 | 11.5 | 5 | 92 | 26 | 312 | 2.5 | |
| Other property | 56 | 1241 | 823 | 1871 | 8.1 | 1 | 69 | 11 | 418 | 1.9 | |
| Age group (years) | |||||||||||
| ≤5 | 56 | 1337 | 836 | 2093 | 8.7 | 9 | 314 | 138 | 674 | 8.6 | 0.95 |
| 6 to 10 | 87 | 2215 | 1691 | 2866 | 14.4 | 10 | 602 | 277 | 1175 | 16.5 | |
| 11 to 15 | 474 | 11,824 | 10,969 | 12,556 | 76.9 | 75 | 2741 | 2191 | 3134 | 75.0 | |
n = actual number, N = estimated number, L95%CI is the lower 95% confidence limit for N, U95%CI is the upper confidence limit for N.
Table 6.
Analyses by disposition from the ED.
| Variable | Released | Admitted | p Value | ||||||||
|---|---|---|---|---|---|---|---|---|---|---|---|
| n | N | L95%CI | U95%CI | % | n | N | L95%CI | U95%CI | % | ||
| All | 385 | 13,272 | 11,060 | 15,077 | 70.2 | 321 | 5631 | 3826 | 7843 | 29.8 | - |
| Age (average in years) | 12.1 [11.8, 12.7] | 12.6 [11.9, 13.2] | 0.29 | ||||||||
| Age group (years) | |||||||||||
| ≤5 | 33 | 1145 | 691 | 1851 | 8.6 | 29 | 406 | 53 | 170 | 7.2 | 0.74 |
| 6 to 10 | 51 | 2067 | 1449 | 2884 | 15.6 | 46 | 750 | 171 | 340 | 13.3 | |
| 11 to 15 | 301 | 10,060 | 9131 | 10,837 | 75.8 | 246 | 4475 | 1791 | 2100 | 79.5 | |
| Sex | |||||||||||
| Male | 329 | 11,490 | 10,874 | 11,967 | 86.6 | 253 | 4598 | 4346 | 4810 | 81.7 | 0.12 |
| Female | 56 | 1782 | 1305 | 2398 | 67.0 | 1028 | 23 | 655 | 816 | 0.4 | |
| Race | |||||||||||
| White | 141 | 6254 | 5183 | 7239 | 60.2 | 72 | 1945 | 1274 | 2670 | 43.9 | 0.011 |
| Black | 127 | 3091 | 2358 | 3941 | 29.8 | 141 | 1708 | 766 | 2893 | 38.6 | |
| Amerindian | 30 | 1036 | 530 | 1930 | 10.0 | 30 | 773 | 398 | 1380 | 17.5 | |
| Firearm Type | |||||||||||
| Powder | 233 | 6953 | 5853 | 8035 | 52.4 | 298 | 5231 | 4936 | 5407 | 92.9 | <10−4 |
| Non-powder | 152 | 6319 | 5237 | 7419 | 47.6 | 23 | 400 | 224 | 695 | 7.1 | |
| Shot | |||||||||||
| Yes | 298 | 9830 | 8992 | 10,554 | 74.1 | 314 | 5416 | 2830 | 4655 | 96.3 | <10−4 |
| No | 87 | 3442 | 2718 | 4280 | 25.9 | 7 | 215 | 2830 | 4655 | 3.8 | |
| Drive by shooting | |||||||||||
| Yes | 17 | 399 | 186 | 841 | 3.0 | 26 | 396 | 199 | 465 | 7.0 | 0.15 |
| No | 368 | 12,873 | 12,431 | 13,086 | 97.0 | 295 | 5325 | 5166 | 5432 | 94.6 | |
| Fracture location | |||||||||||
| Spine | 6 | 162 | 44 | 591 | 1.2 | 33 | 555 | 391 | 777 | 10.1 | 0.0001 |
| Upper extremity | 220 | 8007 | 7017 | 8935 | 60.6 | 72 | 1202 | 906 | 1562 | 22.0 | |
| Lower extremity | 112 | 3525 | 2660 | 4549 | 26.7 | 138 | 2442 | 2029 | 2869 | 44.6 | |
| Skull/face | 42 | 1508 | 1051 | 2128 | 11.4 | 68 | 1271 | 889 | 1754 | 23.2 | |
| Who caused the injury | |||||||||||
| Unknown | 97 | 2723 | 2037 | 3568 | 20.5 | 108 | 1780 | 1391 | 2220 | 31.6 | 0.0006 |
| Stranger | 40 | 934 | 518 | 1644 | 7.0 | 51 | 560 | 264 | 1119 | 9.9 | |
| Self | 161 | 6922 | 5903 | 7927 | 52.2 | 50 | 1126 | 746 | 1636 | 20.0 | |
| Friend/acquaintance | 26 | 901 | 549 | 1453 | 5.0 | 32 | 676 | 427 | 1041 | 12.0 | |
| Other relative | 25 | 758 | 435 | 1297 | 5.7 | 29 | 541 | 361 | 798 | 9.6 | |
| Other/not seen | 35 | 958 | 617 | 1465 | 7.2 | 51 | 948 | 677 | 1299 | 16.8 | |
| Injury intent | |||||||||||
| Unknown | 25 | 844 | 466 | 1492 | 6.4 | 12 | 141 | 52 | 368 | 2.5 | <10−4 |
| Unintentional | 222 | 9195 | 8148 | 10,111 | 69.3 | 103 | 2122 | 1636 | 2657 | 37.7 | |
| Assault | 137 | 3228 | 2357 | 4293 | 24.3 | 197 | 3143 | 2593 | 3669 | 55.8 | |
| Suicide | 0 | 0 | 0 | 0 | 0.0 | 4 | 157 | 47 | 499 | 2.8 | |
| Law enforcement | 1 | 5 | 1 | 37 | 0.0 | 5 | 68 | 23 | 199 | 1.2 | |
| Incident locale | |||||||||||
| Unknown | 142 | 5256 | 4210 | 6376 | 39.9 | 98 | 1904 | 1473 | 2389 | 33.8 | 0.02 |
| Home/apt | 148 | 5189 | 4177 | 6275 | 39.4 | 121 | 1967 | 1519 | 2468 | 34.9 | |
| School/recreation | 31 | 1104 | 697 | 1715 | 8.4 | 12 | 194 | 111 | 334 | 3.4 | |
| Street/highway | 40 | 762 | 455 | 1255 | 5.8 | 56 | 1105 | 849 | 1415 | 19.6 | |
| Other property | 23 | 849 | 458 | 1532 | 6.5 | 34 | 461 | 338 | 622 | 8.2 | |
| Year group | |||||||||||
| 1993 to 2001 | 132 | 5692 | 1597 | 6891 | 42.9 | 48 | 1335 | 856 | 1971 | 23.7 | 0.004 |
| 2002 to 2010 | 132 | 4251 | 3331 | 5290 | 32.0 | 118 | 1826 | 1265 | 2493 | 32.4 | |
| 2011 to 2019 | 121 | 3329 | 2483 | 4348 | 25.1 | 155 | 2470 | 1879 | 3094 | 43.9 | |
n = actual number, N = estimated number, L95%CI is the lower 95% confidence limit for N, U95%CI is the upper confidence limit for N.
Table 7.
Compilation of the literature regarding firearm-associated fractures in children.
| Study | Year | Location | Number of Patients with Fractures | Inpatient or Outpatient | % Male | Age Limit (years) | % UE | % LE | % Spine |
|---|---|---|---|---|---|---|---|---|---|
| Present | 2023 | Entire USA | 12,314 | Both | 81 | <16 | 42.5 | 52.0 | 5.5 |
| Blumberg et al. [14] | 2018 | Entire USA | 2814 | IP | 91 | <21 | 30.3 | 59.1 | 18.9 |
| Naranje et al. [19] | 2016 | Birmingham, AL and Memphis, TN | 49 | IP | 84 | <19 | 22 | 76 | 2 |
| Perkins [20] | 2016 | Charlotte, NC | 44 | IP | 78 | <18 | 41 | 59 | - |
| Washington et al. [25] | 1995 | Los Angeles, CA | 29 | IP | 81 | <18 | 55 | 44 | - |
| Victoroff et al. [23] | 1994 | Washington, DC | 23 | IP | 83 | <19 | 48 | 52 | - |
| Stucky et al. [24] | 1991 | Detroit, MI | 44 | IP | 83 | <18 | 50 | 50 | - |
UE = upper extremity, LE = lower extremity.
Disclaimer/Publisher’s Note: The statements, opinions and data contained in all publications are solely those of the individual author(s) and contributor(s) and not of MDPI and/or the editor(s). MDPI and/or the editor(s) disclaim responsibility for any injury to people or property resulting from any ideas, methods, instructions or products referred to in the content. |
© 2023 by the authors. Licensee MDPI, Basel, Switzerland. This article is an open access article distributed under the terms and conditions of the Creative Commons Attribution (CC BY) license (https://creativecommons.org/licenses/by/4.0/).
Share and Cite
MDPI and ACS Style
Loder, R.T.; Luster, T. Fractures in Children Due to Firearm Activity. Children 2023, 10, 651. https://doi.org/10.3390/children10040651
AMA Style
Loder RT, Luster T. Fractures in Children Due to Firearm Activity. Children. 2023; 10(4):651. https://doi.org/10.3390/children10040651
Chicago/Turabian StyleLoder, Randall T., and Taylor Luster. 2023. "Fractures in Children Due to Firearm Activity" Children 10, no. 4: 651. https://doi.org/10.3390/children10040651
Note that from the first issue of 2016, this journal uses article numbers instead of page numbers. See further details here.