
The Glycemic Curve during the Oral Glucose Tolerance Test: Is It Only Indicative of Glycoregulation?
 , , , ,
Abstract
:1. Introduction
1.1. Pathogenesis of Impaired Glucose Homeostasis and Diabetes Mellitus
1.2. Individual Response to OGTT
1.3. Study Aims
2. Materials and Methods
2.1. Study Subjects
2.2. Metabolic and Anthropometric Characterization of the Subjects
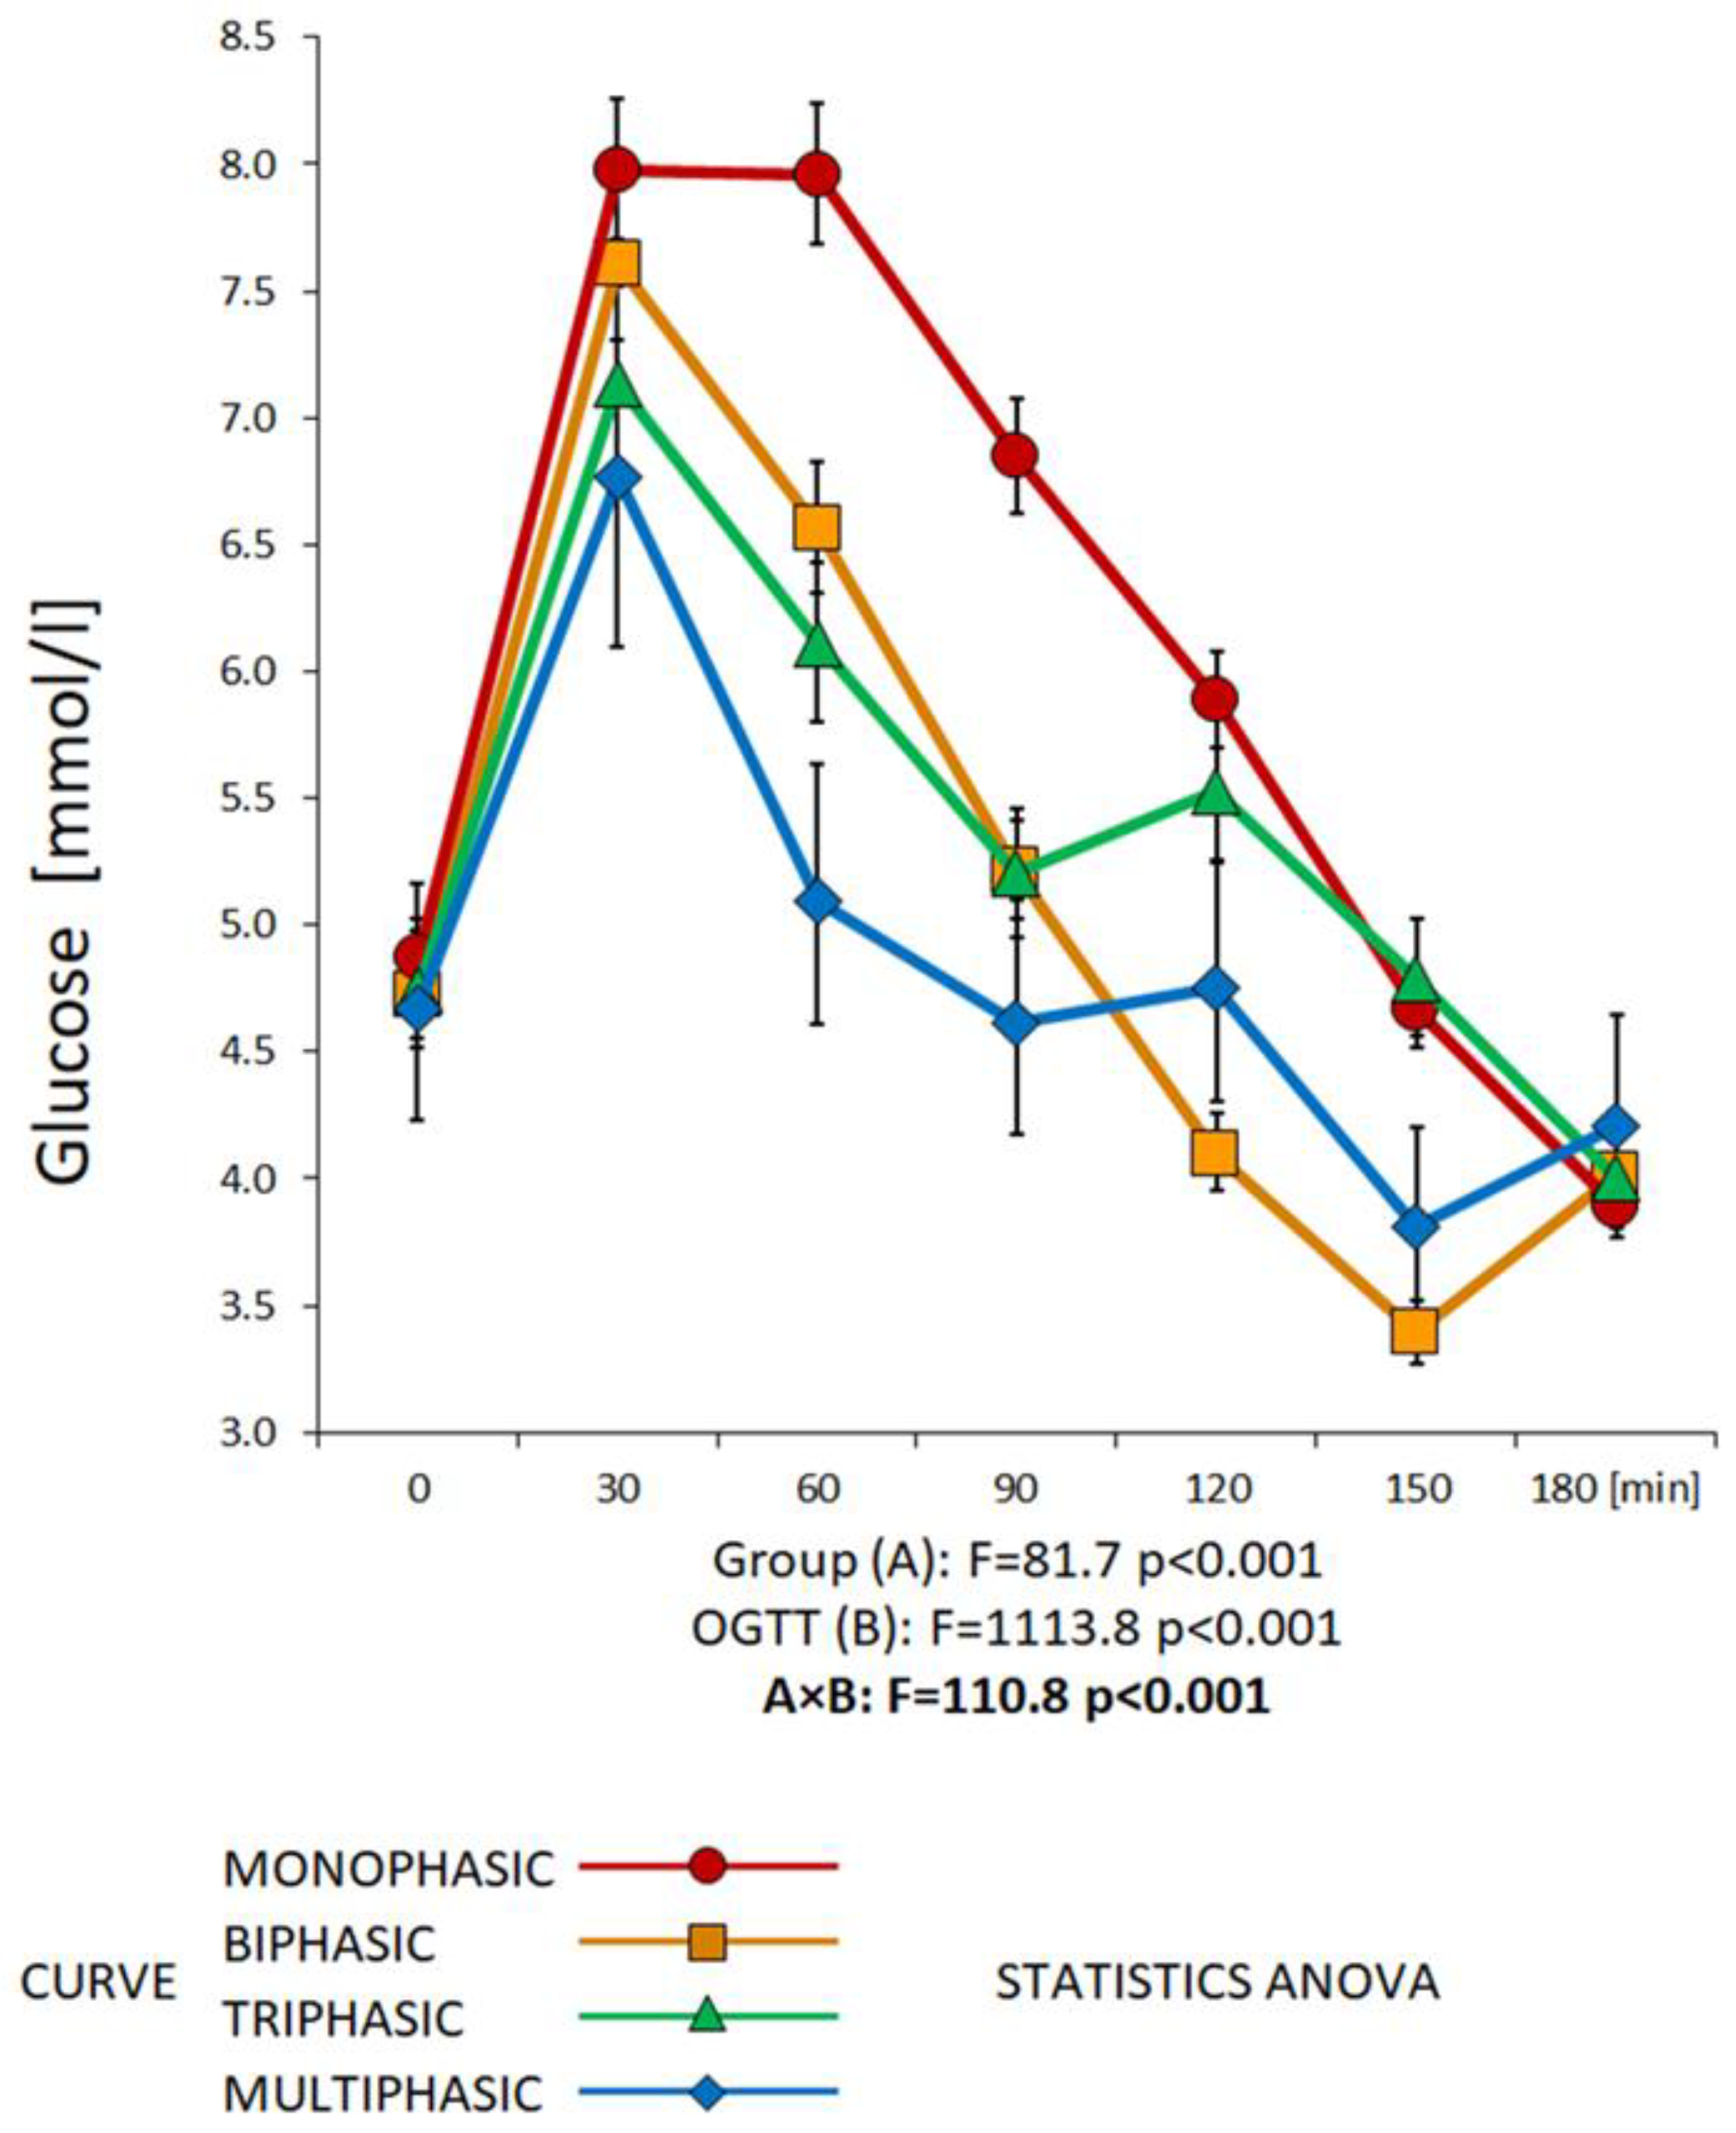
2.3. Classification of the OGTT Curves
2.4. Statistical Evaluation
3. Results
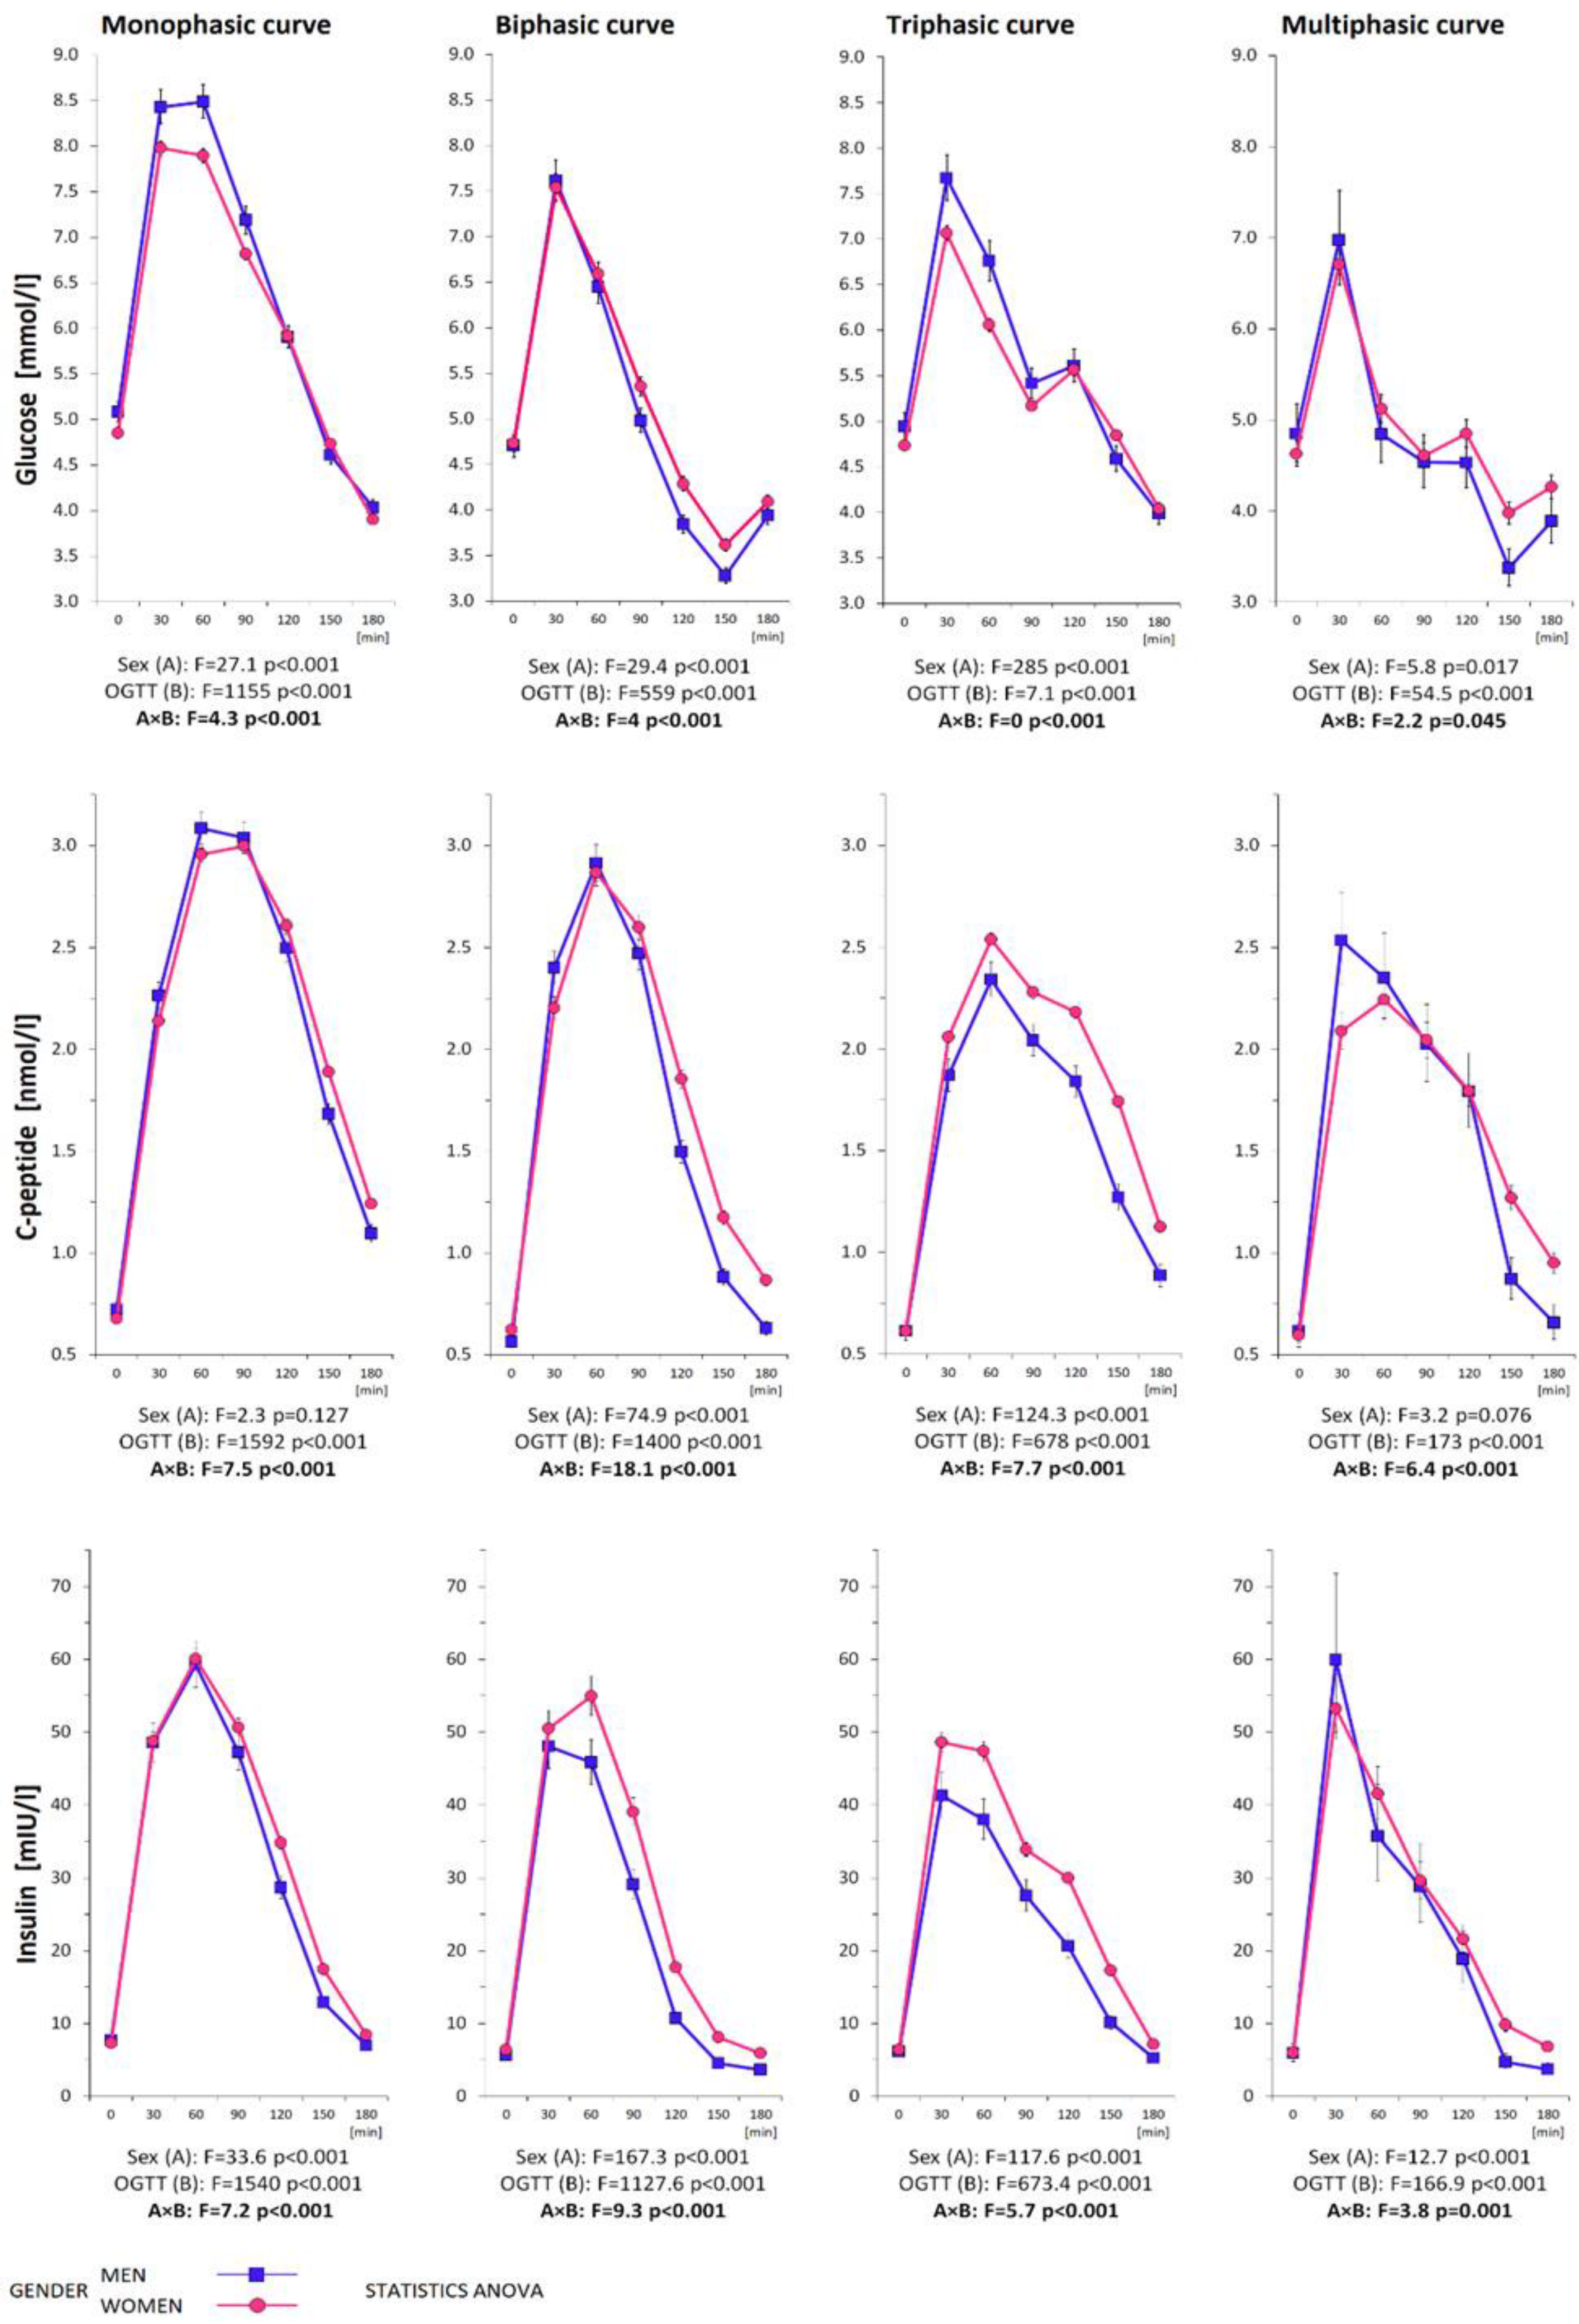
3.1. Metabolic Characterization of the Subjects Divided by Gender
3.2. Metabolic Characterization of the Subjects Divided by the Shape of the Glycemic Curve

| Total | Monophasic Curve | Biphasic Curve | Triphasic Curve | Multiphasic Curve | ||||||
|---|---|---|---|---|---|---|---|---|---|---|
| 1262 | % | 633 | % | 221 | % | 351 | % | 57 | % | |
| WOMEN/MEN | 1035/227 | 82.0/18.0 | 533/100 | 51.5/44.1 | 147/74 | 14.2/32.6 | 308/43 | 29.8/18.9 | 47/10 | 4.5/4.4 |
| T2DM | 17 | 1.3 | 15 | 88.2 | 1 | 5.9 | 1 | 5.9 | 0 | 0 |
| GDM history | 454 | 43.9 | 242 | 53.3 | 62 | 13.7 | 134 | 29.5 | 16 | 3.5 |
| PCOS | 189 | 18.3 | 87 | 46.0 | 24 | 12.7 | 64 | 33.9 | 14 | 7.4 |
| IFG | 100 | 8.0 | 70 | 70.0 | 8 | 8.0 | 21 | 21.0 | 1 | 1.0 |
| IGT | 83 | 6.6 | 65 | 78.3 | 2 | 2.4 | 15 | 18.1 | 1 | 1.2 |
| IGR | 167 | 13.2 | 126 | 75.4 | 11 | 6.6 | 29 | 17.4 | 1 | 0.6 |
| NGT | 1095 | 86.8 | 507 | 46.3 | 210 | 19.2 | 322 | 29.4 | 56 | 5.1 |
| MS | 139 | 11.0 | 104 | 74.8 | 10 | 7.2 | 24 | 17.3 | 1 | 0.7 |
| PEAK in 30 min_GLUC | 887 | 70.3 | 369 | 41.6 | 184 | 20.7 | 280 | 31.6 | 54 | 6.1 |
| PEAK in 30 min_INS | 534 | 42.3 | 195 | 36.5 | 105 | 19.7 | 192 | 36.0 | 42 | 7.9 |
| PEAK in 30 min_CP | 197 | 15.6 | 52 | 26.4 | 47 | 23.9 | 73 | 37.1 | 25 | 12.7 |
| (a) | |||||||||||
| Women n = 1035 (100%) | Monophasic Curve n = 533 (51.5%) | Biphasic Curve n = 147 (14.2%) | Triphasic Curve n = 308 (29.8%) | Multiphasic Curve n = 47 (4.5%) | p-Level | Mono × Bi | Mono × Tri | Mono × Multi | Bi × Tri | Bi × Multi | Tri × Multi |
| Anthropometric Parameters | |||||||||||
| Age [years] | 33.8 (28, 41) | 32.1 (25.7, 38.9) | 33.6 (28.1, 38.6) | 29.3 (25.2, 34) | <0.001 | * | * | * | * | ||
| BMI [kg/m2] | 24.4 (21, 28.8) | 22.8 (20.3, 27.6) | 23 (20.7, 26) | 23 (20.8, 25.4) | <0.001 | * | * | * | |||
| BAI [%] | 28.8 (25.6, 32.6) | 26.8 (24.7, 30.7) | 27.6 (25.4, 30.8) | 27.5 (25.6, 29.5) | <0.001 | * | * | * | |||
| Systolic blood pressure [mmHg] | 115 (106, 124) | 111 (103, 122) | 111 (103, 120) | 110 (103, 122) | 0.005 | * | * | ||||
| Diastolic blood pressure [mmHg] | 72.5 (66, 80) | 70 (64.5, 77.5) | 71 (65, 78) | 71 (65.3, 76) | 0.05 | * | * | ||||
| Abdominal circumference [cm] | 87.5 (79.1, 97.3) | 83 (77, 95.8) | 84 (78.1, 91.7) | 82.8 (79.3, 87.6) | 0.001 | * | * | * | |||
| Hip circumference [cm] | 101 (95, 109) | 99.7 (94.5, 105) | 99.4 (94, 106) | 99.5 (94.9, 104) | 0.004 | * | |||||
| Waist circumference [cm] | 78 (70.3, 88) | 73.2 (69.5, 84.9) | 74 (69.5, 80.8) | 73.8 (70.5, 81.3) | <0.001 | * | * | * | |||
| WHR | 0.775 (0.731, 0.821) | 0.756 (0.718, 0.8) | 0.754 (0.722, 0.794) | 0.744 (0.714, 0.795) | <0.001 | * | * | * | |||
| Biochemical Parameters | |||||||||||
| Total cholesterol [mmol/L] | 4.64 (4.09, 5.26) | 4.49 (4.05, 5.08) | 4.55 (3.98, 5.12) | 4.33 (3.92, 4.98) | 0.069 | * | |||||
| HDL cholesterol [mmol/L] | 1.54 (1.32, 1.79) | 1.58 (1.34, 1.88) | 1.6 (1.35, 1.86) | 1.61 (1.35, 1.89) | 0.348 | ||||||
| LDL cholesterol [mmol/L] | 2.62 (2.1, 3.12) | 2.44 (2.07, 2.93) | 2.45 (2.07, 3) | 2.42 (2.02, 2.77) | 0.175 | ||||||
| Triacylglycerols [mmol/L] | 0.9 (0.65, 1.27) | 0.75 (0.582, 1.15) | 0.78 (0.56, 1.06) | 0.73 (0.54, 1.05) | <0.001 | * | * | * | |||
| Urea [mmol/L] | 4.2 (3.6, 5) | 4.21 (3.6, 4.9) | 4.26 (3.61, 5.01) | 4.1 (3.6, 4.9) | 0.666 | ||||||
| Uric acid [umol/L] | 258 (226, 293) | 259 (212, 292) | 248 (215, 290) | 237 (216, 271) | 0.047 | * | * | ||||
| Creatinine [umol/L] | 65 (59, 72.7) | 65 (59, 71) | 64 (58, 70.1) | 65 (57.6, 72.3) | 0.439 | ||||||
| TSH [mIU/L] | 2.25 (1.56, 3.29) | 2.36 (1.72, 3.28) | 2.39 (1.63, 3.09) | 2.29 (1.71, 3.25) | 0.798 | ||||||
| Free T4 [pmol/L] | 15.1 (13.8, 16.5) | 15 (13.6, 16.5) | 14.9 (13.5, 16.6) | 14.9 (13.8, 16.7) | 0.922 | ||||||
| Free T3 [pmol/L] | 4.84 (4.4, 5.33) | 4.77 (4.48, 5.48) | 4.75 (4.32, 5.22) | 4.91 (4.51, 5.41) | 0.368 | ||||||
| ALT [ukat/L] | 0.3 (0.23, 0.395) | 0.27 (0.23, 0.34) | 0.28 (0.225, 0.35) | 0.29 (0.23, 0.35) | 0.098 | * | |||||
| AST [ukat/L] | 0.34 (0.29, 0.42) | 0.33 (0.29, 0.4) | 0.33 (0.28, 0.39) | 0.34 (0.31, 0.422) | 0.18 | ||||||
| GGT [ukat/L] | 0.23 (0.17, 0.34) | 0.21 (0.17, 0.287) | 0.21 (0.16, 0.27) | 0.19 (0.15, 0.298) | 0.012 | * | |||||
| (b) | |||||||||||
| Women n = 1035 (100%) | Monophasic Curve n = 533 (51.5%) | Biphasic Curve n = 147 (14.2%) | Triphasic Curve n = 308 (29.8%) | Multiphasic Curve n = 47 (4.5%) | p-Level | Mono × Bi | Mono × Tri | Mono × Multi | Bi × Tri | Bi × Multi | Tri × Multi |
| Ogtt Descriptions | |||||||||||
| Glucose 0 min [mmol/L] | 4.8 (4.5, 5.1) | 4.7 (4.5, 5) | 4.7 (4.4, 5) | 4.5 (4.35, 5) | 0.002 | * | * | ||||
| Glucose 30 min | 8 (7.1, 8.9) | 7.6 (6.9, 8.5) | 7.2 (6.3, 8) | 6.7 (6.05, 7.35) | <0.001 | * | * | * | * | * | |
| Glucose 60 min | 7.9 (6.7, 9.4) | 6.6 (5.65, 7.85) | 6.2 (5.1, 7.1) | 4.9 (4.4, 5.85) | <0.001 | * | * | * | * | * | * |
| Glucose 90 min | 6.7 (5.7, 8.2) | 5.5 (4.5, 6.1) | 5.1 (4.5, 5.9) | 4.6 (4.05, 5.25) | <0.001 | * | * | * | * | * | |
| Glucose 120 min | 5.8 (5, 6.9) | 4.3 (3.6, 5.15) | 5.6 (4.9, 6.4) | 5 (4.25, 5.45) | <0.001 | * | * | * | * | * | * |
| Glucose 150 min | 4.6 (3.9, 5.6) | 3.3 (2.8, 4.35) | 4.9 (4.2, 5.6) | 4 (3.3, 4.55) | <0.001 | * | * | * | * | * | * |
| Glucose 180 min | 3.8 (3.3, 4.4) | 3.9 (3.6, 4.5) | 4 (3.4, 4.6) | 4.1 (3.6, 4.95) | <0.001 | * | * | * | |||
| C-peptide 0 min [nmol/L] | 0.61 (0.49, 0.81) | 0.58 (0.475, 0.74) | 0.58 (0.47, 0.72) | 0.56 (0.465, 0.685) | 0.013 | * | * | * | |||
| C-peptide 30 min | 2.05 (1.64, 2.59) | 2.1 (1.76, 2.71) | 2.03 (1.68, 2.46) | 2.07 (1.59, 2.72) | 0.236 | * | |||||
| C-peptide 60 min | 2.86 (2.29, 3.6) | 2.81 (2.44, 3.38) | 2.44 (2.06, 2.99) | 2.1 (1.69, 2.84) | <0.001 | * | * | * | * | * | |
| C-peptide 90 min | 2.87 (2.3, 3.6) | 2.57 (2.16, 3.1) | 2.24 (1.82, 2.63) | 2 (1.55, 2.58) | <0.001 | * | * | * | * | * | * |
| C-peptide 120 min | 2.49 (1.96, 3.28) | 1.82 (1.44, 2.26) | 2.13 (1.75, 2.6) | 1.81 (1.41, 2.21) | <0.001 | * | * | * | * | * | |
| C-peptide 150 min | 1.79 (1.35, 2.4) | 1.11 (0.83, 1.58) | 1.68 (1.36, 2.12) | 1.16 (0.89, 1.59) | <0.001 | * | * | * | * | * | |
| C-peptide 180 min | 1.13 (0.87, 1.58) | 0.79 (0.605, 1.19) | 1.08 (0.84, 1.37) | 0.9 (0.59, 1.29) | <0.001 | * | * | * | * | * | |
| Insulin 0 min [mIU/L] | 6.4 (4.5, 10) | 6 (4.25, 8.8) | 5.9 (4.3, 8.33) | 5.4 (4.3, 7.5) | 0.031 | * | * | ||||
| Insulin 30 min | 45.8 (31.8, 70.9) | 50.2 (35.3, 67.7) | 49 (33.9, 67.1) | 54.7 (35.6, 77.3) | 0.6 | ||||||
| Insulin 60 min | 56.6 (38.4, 84.2) | 55.2 (39.6, 73.9) | 44.9 (32.2, 62.2) | 34 (26.7, 52.6) | <0.001 | * | * | * | * | * | |
| Insulin 90 min | 47.7 (31.4, 74.2) | 38.1 (27.6, 53.8) | 33 (22.6, 46.4) | 32.5 (19.5, 40.7) | <0.001 | * | * | * | * | * | |
| Insulin 120 min | 31.4 (20.3, 53.6) | 19.1 (10.8, 28.1) | 29.4 (21.2, 42) | 20.6 (14, 35.3) | <0.001 | * | * | * | * | * | |
| Insulin 150 min | 15.5 (8.4, 30) | 6.9 (4.05, 14) | 17.2 (10.6, 27.6) | 8.7 (4.7, 18.4) | <0.001 | * | * | * | * | ||
| Insulin 180 min | 6.8 (4.4, 14.6) | 5.1 (3.1, 10.7) | 6.4 (4.1, 10.7) | 5.9 (3.35, 10.4) | <0.001 | * | * | * | |||
| AUC gluc 30 min | 191 (176, 209) | 186 (171, 202) | 179 (162, 194) | 170 (158, 182) | <0.001 | * | * | * | * | * | |
| AUC gluc | 1130 (1010, 1290) | 965 (869, 1060) | 999 (898, 1110) | 902 (801, 972) | <0.001 | * | * | * | * | * | * |
| ΔAUC gluc | 270 (156, 398) | 158 (55.5, 239) | 156 (84.4, 261) | 81.8 (42, 155) | <0.001 | * | * | * | * | * | |
| AUC ins 30 min | 4810 (3320, 7310) | 5210 (3780, 6890) | 4920 (3580, 6750) | 5590 (3640, 7900) | 0.731 | ||||||
| AUC ins | 38,100 (27,100, 57,300) | 34,100 (25,900, 43,100) | 32,900 (24,900, 44,600) | 27,200 (20,400, 41,600) | <0.001 | * | * | * | |||
| ΔAUC ins | 30,200 (21,500, 47,300) | 27,000 (19,800, 33,500) | 25,900 (19,600, 36,200) | 22,000 (15,700, 34,000) | <0.001 | * | * | * | |||
| AUC cp 30 min | 40,200 (32,600, 50,900) | 41,100 (34,400, 51,500) | 39,200 (32,800, 48,000) | 39,500 (31,300, 50,500) | 0.234 | ||||||
| AUC cp | 393 × 103 (323, 487) × 103 | 343 × 103 (300, 401) × 103 | 344 × 103 (293, 411) × 103 | 305 × 103 (244, 403) × 103 | <0.001 | * | * | * | * | * | |
| ΔAUC cp | 275 × 103 (228, 346) × 103 | 237 × 103 (195, 275) × 103 | 237 × 103 (198, 287) × 103 | 194 × 103 (156, 266) × 103 | <0.001 | * | * | * | * | * | |
| (c) | |||||||||||
| Women n = 1035 (100%) | Monophasic Curve n = 533 (51.5%) | Biphasic Curve n = 147 (14.2%) | Triphasic Curve n = 308 (29.8%) | Multiphasic Curve n = 47 (4.5%) | p-Level | Mono × Bi | Mono × Tri | Mono × Multi | Bi × Tri | Bi × Multi | Tri × Multi |
| Insulin Sensitivity/Resistance | |||||||||||
| HOMA-R | 1.36 (0.915, 2.22) | 1.27 (0.905, 1.88) | 1.24 (0.837, 1.8) | 1.09 (0.86, 1.52) | 0.005 | * | * | ||||
| QUICKI | 0.365 (0.338, 0.389) | 0.369 (0.347, 0.39) | 0.37 (0.349, 0.395) | 0.378 (0.358, 0.393) | 0.01 | * | * | ||||
| OGIS 2h | 449 (397, 490) | 481 (451, 514) | 461 (426, 495) | 477 (439, 517) | <0.001 | * | * | * | * | ||
| OGIS 3h | 502 (443, 549) | 516 (451, 556) | 504 (465, 548) | 490 (454, 561) | 0.138 | * | |||||
| ISIcomp | 7.5 (4.56, 10.9) | 8.89 (6.49, 11.3) | 8.71 (6.15, 11.7) | 10.5 (7.24, 13.3) | <0.001 | * | * | * | |||
| MCRest | 9.42 (7.55, 10.6) | 10.5 (9.37, 11.3) | 10.1 (9.01, 11) | 10.6 (9.13, 11.4) | <0.001 | * | * | * | |||
| Si(oral) | 0.127 (0.059, 0.202) | 0.197 (0.127, 0.301) | 0.175 (0.109, 0.282) | 0.268 (0.129, 0.401) | <0.001 | * | * | * | * | ||
| PREDIM | 6.63 (4.84, 8.51) | 7.87 (6.4, 9.91) | 6.93 (5.73, 8.68) | 7.58 (6.11, 9.09) | <0.001 | * | * | * | * | ||
| Beta cell function | |||||||||||
| HOMA-beta | 104 (72, 165) | 100 (73, 159) | 105 (76.4, 146) | 101 (70.9, 147) | 0.995 | ||||||
| Ins0/Gluc0 | 7.87 (5.76, 12.2) | 7.58 (5.51, 11.3) | 7.55 (5.84, 10.2) | 7.36 (5.6, 10.4) | 0.124 | * | |||||
| Cp0/Gluc0 | 434 (318, 675) | 418 (304, 624) | 417 (322, 563) | 406 (309, 575) | 0.125 | ||||||
| IGI | 76.5 (50.2, 129) | 94 (59.4, 157) | 114 (74.7, 164) | 131 (84.4, 222) | <0.001 | * | * | * | * | * | |
| IGI simplified | 34.7 (24.1, 52.9) | 40.2 (28.4, 56.5) | 41.2 (30.8, 55.4) | 46.4 (32.5, 69.4) | <0.001 | * | * | * | |||
| IGI cp | 453 (324, 657) | 559 (373, 815) | 605 (445, 822) | 700 (539, 1110) | <0.001 | * | * | * | * | * | |
| IGI simplified cp | 1910 (1330, 2920) | 2220 (1570, 3110) | 2270 (1700, 3060) | 2560 (1790, 3830) | <0.001 | * | * | * | |||
| AUC ins/AUC gluc | 33.4 (24.8, 50) | 35.6 (26.4, 44.6) | 33.3 (26.4, 43.9) | 32.1 (23.1, 46.2) | 0.62 | ||||||
| ΔAUC ins/ΔAUC gluc | 129 (78.4, 235) | 193 (113, 505) | 186 (113, 299) | 319 (159, 544) | <0.001 | * | * | * | * | ||
| AUC cp/AUC gluc | 353 (283, 434) | 349 (304, 448) | 351 (293, 403) | 337 (273, 418) | 0.419 | ||||||
| ΔAUC cp/ΔAUC gluc | 1060 (723, 1790) | 1690 (1090, 3740) | 1580 (996, 2620) | 2360 (1560, 4180) | <0.001 | * | * | * | * | ||
| Disposition Indices | |||||||||||
| IGI × ISIcomp | 244 (194, 304) | 297 (239, 377) | 286 (234, 354) | 317 (258, 401) | <0.001 | * | * | * | * | * | |
| OGIS 3h × AUCins | 19.0 × 10⁶ (14.2, 27.2) × 106 | 17.2 × 10⁶ (13.4, 21.1) × 106 | 16.7 × 10⁶ (13.3, 22.5) × 106 | 14.0 × 10⁶ (10.7, 22.1) × 106 | <0.001 | * | * | * | |||
| Adaptation Index | |||||||||||
| OGIS 3h × AUCcp | 19.2 × 10⁷ (16.6, 23.0) × 107 | 17.5 × 10⁷ (14.5, 20.7) × 107 | 17.5 × 10⁷ (14.9, 20.5) × 107 | 15.8 × 10⁷ (11.9, 18.9) × 107 | <0.001 | * | * | * | * | * | |
| Hepatic Extraction | |||||||||||
| HE | 67.5 (59.6, 73.4) | 67.7 (61.8, 73.7) | 68 (61.9, 72.6) | 68.4 (59, 73.6) | 0.307 | ||||||
| (a) | |||||||||||
| Men n = 227 (100%) | Monophasic Curve n = 100 (44.1%) | Biphasic Curve n = 74 (32.6%) | Triphasic Curve n = 43 (18.9%) | Multiphasic Curve n = 10 (4.4%) | p-Level | Mono × Bi | Mono × Tri | Mono × Multi | Bi × Tri | Bi × Multi | Tri × Multi |
| NGT/IFG + IGT/T2DM | 73/22/5 | 72/2/0 | 36/7/0 | 10/0/0 | |||||||
| Anthropometric Parameters | |||||||||||
| Age [years] | 38.4 (26.7, 49.3) | 27.2 (23.7, 37.6) | 38 (30.8, 47.2) | 26.7 (25.9, 29.1) | <0.001 | * | * | * | * | ||
| BMI [kg/m2] | 25.6 (23.2, 29.8) | 24.1 (21.8, 26.4) | 25.2 (23.4, 27.5) | 25.6 (23.2, 28.6) | 0.004 | * | |||||
| BAI [%] | 24 (21.9, 26.3) | 22.3 (20.7, 23.8) | 23.2 (21.1, 24.6) | 23.6 (20.8, 25.4) | 0.001 | * | |||||
| Systolic blood pressure [mmHg] | 128 (116, 140) | 120 (113, 129) | 122 (113, 132) | 131 (119, 138) | 0.008 | * | * | ||||
| Diastolic blood pressure [mmHg] | 77 (70, 86.3) | 73 (67.8, 77.3) | 72 (64.5, 80) | 71.5 (61.3, 82) | 0.001 | * | * | * | |||
| Abdominal circumference [cm] | 91.7 (85.3, 105) | 85.8 (79.4, 93) | 91 (85.7, 96.3) | 93.3 (87.6, 96.8) | 0.001 | * | * | ||||
| Hip circumference [cm] | 100 (96.1, 107) | 98.3 (95, 102) | 100 (95.5, 105) | 103 (96.5, 106) | 0.049 | * | |||||
| Waist circumference [cm] | 88 (80.7, 102) | 82.2 (76.9, 89) | 88 (82, 93.6) | 90.3 (82, 95.6) | <0.001 | * | * | ||||
| WHR | 0.873 (0.832, 0.952) | 0.841 (0.802, 0.887) | 0.88 (0.84, 0.926) | 0.867 (0.804, 0.919) | <0.001 | * | * | ||||
| Biochemical Parameters | |||||||||||
| Total cholesterol [mmol/L] | 4.82 (4.31, 5.41) | 4.49 (3.66, 5.01) | 4.85 (4.15, 5.38) | 4.02 (3.67, 4.58) | 0.013 | * | * | ||||
| HDL cholesterol [mmol/L] | 1.26 (1.03, 1.51) | 1.26 (1.04, 1.49) | 1.23 (1.09, 1.51) | 1.31 (1.05, 1.58) | 0.799 | ||||||
| LDL cholesterol [mmol/L] | 2.92 (2.31, 3.42) | 2.61 (2.05, 3.02) | 2.88 (2.35, 3.45) | 2.15 (1.74, 2.62) | 0.037 | * | * | ||||
| Triacylglycerols [mmol/L] | 1.12 (0.767, 1.7) | 1.01 (0.715, 1.42) | 0.98 (0.765, 1.62) | 0.83 (0.672, 1.11) | 0.362 | ||||||
| Urea [mmol/L] | 4.95 (4.1, 5.8) | 4.9 (4.2, 6) | 5.2 (4.51, 5.85) | 4.63 (3.65, 4.85) | 0.304 | ||||||
| Uric acid [umol/L] | 341 (294, 400) | 329 (297, 362) | 308 (282, 359) | 362 (322, 388) | 0.024 | * | |||||
| Creatinine [umol/L] | 80 (73.9, 89) | 81.9 (74.2, 88.4) | 79 (71, 89) | 81.9 (73.5, 96.5) | 0.889 | ||||||
| TSH [mIU/L] | 2.17 (1.46, 2.75) | 2.07 (1.53, 2.96) | 1.82 (1.31, 2.62) | 2.46 (2.11, 2.83) | 0.343 | ||||||
| Free T4 [pmol/L] | 15.8 (14.3, 17.2) | 15.8 (14.4, 17.3) | 15.6 (14.6, 17.6) | 16.9 (16, 18) | 0.358 | ||||||
| Free T3 [pmol/L] | 5.15 (4.7, 5.67) | 5.41 (4.97, 5.94) | 5.19 (4.92, 5.57) | 5.11 (4.93, 5.66) | 0.014 | * | |||||
| ALT [ukat/L] | 0.435 (0.34, 0.55) | 0.41 (0.313, 0.605) | 0.37 (0.29, 0.51) | 0.345 (0.31, 0.447) | 0.852 | ||||||
| AST [ukat/L] | 0.405 (0.363, 0.48) | 0.435 (0.358, 0.512) | 0.385 (0.358, 0.502) | 0.385 (0.357, 0.412) | 0.979 | ||||||
| GGT [ukat/L] | 0.4 (0.285, 0.57) | 0.33 (0.22, 0.44) | 0.37 (0.23, 0.585) | 0.23 (0.21, 0.315) | 0.035 | * | |||||
| (b) | |||||||||||
| Men n = 227 (100%) | Monophasic Curve n = 100 (44.1%) | Biphasic Curve n = 74 (32.6%) | Triphasic Curve n = 43 (18.9%) | Multiphasic Curve n = 10 (4.4%) | p-Level | Mono × Bi | Mono × Tri | Mono × Multi | Bi × Tri | Bi × Multi | Tri × Multi |
| Ogtt Descriptions | |||||||||||
| Glucose 0 min [mmol/L] | 5 (4.7, 5.43) | 4.7 (4.43, 5.07) | 4.9 (4.7, 5.3) | 5 (4.55, 5.17) | <0.001 | * | * | ||||
| Glucose 30 min | 8.5 (7.5, 9.4) | 7.85 (6.88, 8.7) | 7.8 (7, 8.5) | 6.9 (6.72, 7.3) | <0.001 | * | * | * | |||
| Glucose 60 min | 8.45 (7.4, 9.97) | 6.65 (5.3, 8) | 6.8 (5.9, 7.65) | 4.75 (4.43, 5.3) | <0.001 | * | * | * | * | * | |
| Glucose 90 min | 7.15 (6, 8.63) | 4.85 (4.2, 5.98) | 5.3 (4.8, 6.3) | 4.6 (3.72, 5.23) | <0.001 | * | * | * | * | ||
| Glucose 120 min | 5.8 (5, 6.9) | 3.8 (3.4, 4.5) | 5.5 (4.75, 6.25) | 4.55 (4.15, 4.9) | <0.001 | * | * | * | * | * | |
| Glucose 150 min | 4.4 (3.9, 5.2) | 3.3 (3, 3.57) | 4.5 (4, 5.15) | 3.3 (3.23, 3.55) | <0.001 | * | * | * | * | ||
| Glucose 180 min | 3.85 (3.5, 4.6) | 4 (3.6, 4.2) | 4 (3.6, 4.45) | 3.8 (3.62, 4.1) | 0.992 | ||||||
| C-peptide 0 min [nmol/L] | 0.64 (0.48, 0.995) | 0.52 (0.403, 0.663) | 0.57 (0.465, 0.725) | 0.63 (0.522, 0.708) | 0.007 | * | |||||
| C-peptide 30 min | 2.14 (1.74, 2.76) | 2.41 (1.9, 2.83) | 1.91 (1.47, 2.48) | 2.07 (1.86, 3.56) | 0.001 | * | * | * | |||
| C-peptide 60 min | 3.04 (2.48, 3.87) | 2.78 (2.38, 3.65) | 2.25 (1.7, 2.91) | 2.45 (2.13, 2.66) | <0.001 | * | * | * | |||
| C-peptide 90 min | 3.05 (2.35, 3.94) | 2.44 (1.83, 3.2) | 2.01 (1.61, 2.6) | 1.89 (1.72, 2.61) | <0.001 | * | * | * | * | ||
| C-peptide 120 min | 2.51 (1.75, 3.34) | 1.5 (1.04, 2.01) | 1.81 (1.29, 2.56) | 1.75 (1.64, 1.91) | <0.001 | * | * | * | |||
| C-peptide 150 min | 1.54 (1.15, 2.33) | 0.835 (0.692, 1.1) | 1.26 (0.805, 1.76) | 0.93 (0.823, 0.95) | <0.001 | * | * | * | * | * | |
| C-peptide 180 min | 0.975 (0.72, 1.51) | 0.59 (0.49, 0.738) | 0.79 (0.59, 1.11) | 0.675 (0.603, 0.733) | <0.001 | * | * | * | * | ||
| Insulin 0 min [mIU/L] | 6.95 (5, 10.8) | 5.55 (3.9, 7.75) | 5.6 (4.25, 8.15) | 6.8 (3.77, 7.07) | 0.024 | * | * | ||||
| Insulin 30 min | 47 (33.2, 64.2) | 47 (36.9, 62.8) | 39.6 (27, 69.8) | 49 (37.7, 87.2) | 0.148 | * | |||||
| Insulin 60 min | 58.4 (40.4, 89.3) | 44.6 (29, 65.1) | 38 (23.4, 62.8) | 32 (28.3, 51.3) | <0.001 | * | * | * | |||
| Insulin 90 min | 48.4 (28.4, 72.4) | 25.6 (17.3, 43.7) | 25.7 (17.1, 43) | 26.6 (17.5, 35.5) | <0.001 | * | * | * | |||
| Insulin 120 min | 27 (14.2, 52.6) | 12.3 (6.43, 17.2) | 19.9 (10.5, 39.8) | 17.7 (15.7, 21.9) | <0.001 | * | * | * | |||
| Insulin 150 min | 10.8 (5.83, 25.9) | 4.55 (2.93, 7.15) | 8.5 (5.05, 19.9) | 4.55 (3.95, 6.38) | <0.001 | * | * | * | * | ||
| Insulin 180 min | 6.1 (3.2, 12.3) | 3.35 (2.62, 5) | 4.1 (2.4, 6.5) | 3.8 (2.65, 5.6) | <0.001 | * | * | * | |||
| AUC gluc 30 min | 203 (185, 224) | 185 (174, 206) | 192 (179, 202) | 179 (170, 181) | <0.001 | * | * | * | |||
| AUC gluc | 1160 (1050, 1310) | 929 (838, 1040) | 1030 (948, 1110) | 849 (809, 921) | <0.001 | * | * | * | * | * | |
| ΔAUC gluc | 273 (167, 372) | 116 (54, 179) | 170 (93, 245) | 40.5 (33, 52.5) | <0.001 | * | * | * | * | * | |
| AUC ins 30 min | 5050 (3490, 6770) | 4670 (3680, 6410) | 4120 (2720, 6930) | 4930 (4030, 8320) | 0.147 | * | |||||
| AUC ins | 36,300 (25,700, 56,900) | 25,800 (18,800, 35,000) | 29,300 (17,700, 43,200) | 27,500 (21,300, 32,800) | <0.001 | * | * | ||||
| ΔAUC ins | 29,100 (19,400, 43,200) | 19,400 (13,500, 26,700) | 20,500 (12,300, 33,700) | 21,400 (16,300, 26,900) | <0.001 | * | * | ||||
| AUC cp 30 min | 43,100 (34,400, 56,400) | 45,000 (35,600, 52,400) | 36,500 (29,000, 47,600) | 41,000 (36,300, 66,000) | 0.034 | * | * | ||||
| AUC cp | 405 × 103 (303, 517) × 103 | 314 × 103 (264, 403) × 103 | 305 × 103 (237, 402) × 103 | 289 × 103(275, 372) × 103 | <0.001 | * | * | * | |||
| ΔAUC cp | 269 × 103 (208, 351) × 103 | 219 × 103 (172, 277) × 103 | 203 × 103 (148, 261) × 103 | 183 × 103 (169, 235) × 103 | <0.001 | * | * | * | |||
| (c) | |||||||||||
| Men n = 227 (100%) | Monophasic Curve n = 100 (44.1%) | Biphasic Curve n = 74 (32.6%) | Triphasic Curve n = 43 (18.9%) | Multiphasic Curve n = 10 (4.4%) | p-Level | Mono × Bi | Mono × Tri | Mono × Multi | Bi × Tri | Bi × Multi | Tri × Multi |
| Insulin Sensitivity/Resistance | |||||||||||
| HOMA-R | 1.52 (1.02, 2.66) | 1.15 (0.77, 1.7) | 1.3 (0.894, 1.74) | 1.44 (0.786, 1.6) | 0.002 | * | * | ||||
| QUICKI | 0.359 (0.33, 0.382) | 0.375 (0.352, 0.401) | 0.368 (0.351, 0.391) | 0.361 (0.356, 0.4) | 0.004 | * | * | ||||
| OGIS 2h | 433 (382, 477) | 496 (461, 525) | 442 (410, 471) | 455 (416, 484) | <0.001 | * | * | * | |||
| OGIS 3h | 477 (407, 529) | 497 (475, 532) | 472 (444, 515) | 484 (459, 511) | 0.056 | * | |||||
| ISIcomp | 7.7 (4.13, 10.7) | 10.5 (8.2, 14.3) | 9.22 (6.31, 14.2) | 9.7 (8.04, 13.3) | <0.001 | * | * | ||||
| MCRest | 9.24 (7.25, 10.2) | 10.6 (9.89, 11.2) | 9.84 (9.02, 10.6) | 9.98 (8.75, 10.8) | <0.001 | * | * | * | * | ||
| Si(oral) | 0.098 (0.046, 0.168) | 0.206 (0.134, 0.365) | 0.179 (0.094, 0.327) | 0.189 (0.159, 0.295) | <0.001 | * | * | * | |||
| PREDIM | 6.14 (4.36, 7.56) | 8.16 (6.95, 10.2) | 6.9 (5.81, 8.1) | 6.46 (5.62, 8.62) | <0.001 | * | * | ||||
| Beta Cell Function | |||||||||||
| HOMA-beta | 105 (69.4, 142) | 103 (62.7, 146) | 85 (57.6, 133) | 101 (74.5, 128) | 0.635 | ||||||
| Ins0/Gluc0 | 8.39 (6.13, 13.3) | 7.3 (4.98, 9.83) | 7.38 (4.85, 10.1) | 7.78 (5.39, 9.27) | 0.076 | * | |||||
| Cp0/Gluc0 | 463 (338, 735) | 403 (275, 542) | 407 (267, 557) | 429 (298, 511) | 0.076 | * | |||||
| IGI | 72.7 (49.1, 108) | 84 (56.3, 128) | 80.9 (49.3, 142) | 139 (83, 201) | 0.008 | * | * | ||||
| IGI simplified | 34 (23.2, 48.8) | 37.3 (26, 48.9) | 28.6 (21.6, 51.2) | 46.5 (31.4, 76.8) | 0.117 | * | * | ||||
| IGI cp | 471 (326, 650) | 600 (420, 903) | 459 (328, 631) | 784 (654, 1400) | <0.001 | * | * | * | * | ||
| IGI simplified cp | 1880 (1280, 2690) | 2060 (1430, 2700) | 1580 (1190, 2820) | 2560 (1730, 4240) | 0.117 | * | * | ||||
| AUC ins/AUC gluc | 32 (21.4, 46.6) | 27.3 (22.1, 36) | 27.6 (16.9, 37.4) | 33.4 (25.3, 39.8) | 0.125 | * | |||||
| ΔAUC ins/ΔAUC gluc | 129 (72.1, 212) | 183 (112, 399) | 154 (82.6, 256) | 466 (310, 538) | <0.001 | * | * | * | * | ||
| AUC cp/AUC gluc | 343 (276, 418) | 347 (290, 413) | 296 (242, 345) | 339 (324, 407) | 0.011 | * | * | ||||
| ΔAUC cp/ΔAUC gluc | 1050 (744, 1680) | 2010 (1420, 4240) | 1310 (890, 1910) | 4110 (2760, 6990) | <0.001 | * | * | * | * | ||
| Disposition Indices | |||||||||||
| IGI × ISIcomp | 213 (167, 260) | 302 (258, 351) | 247 (206, 298) | 346 (264, 422) | <0.001 | * | * | * | * | * | |
| OGIS 3h × AUCins | 17.1 × 10⁶ (12.4, 24.5) × 106 | 13.0 × 10⁶ (9.7, 16.0) × 106 | 14.0 × 10⁶ (8.2, 19.6) × 106 | 13.0 × 10⁶ (10.8, 16.4) × 106 | <0.001 | * | * | ||||
| Adaptation Index | |||||||||||
| OGIS 3h × AUCcp | 18.8 × 10⁷ (15.6, 22.0) × 107 | 15.8 × 10⁷ (13.1, 19.4) × 107 | 15.0 × 10⁷ (12.5, 17.9) × 107 | 13.9 × 10⁷ (13.4, 15.8) × 107 | <0.001 | * | * | * | |||
| Hepatic Extraction | |||||||||||
| HE | 68.3 (60.9, 75.9) | 71.3 (66.6, 78.4) | 69.7 (63.3, 77.3) | 68.9 (62.4, 75) | 0.074 | * | |||||
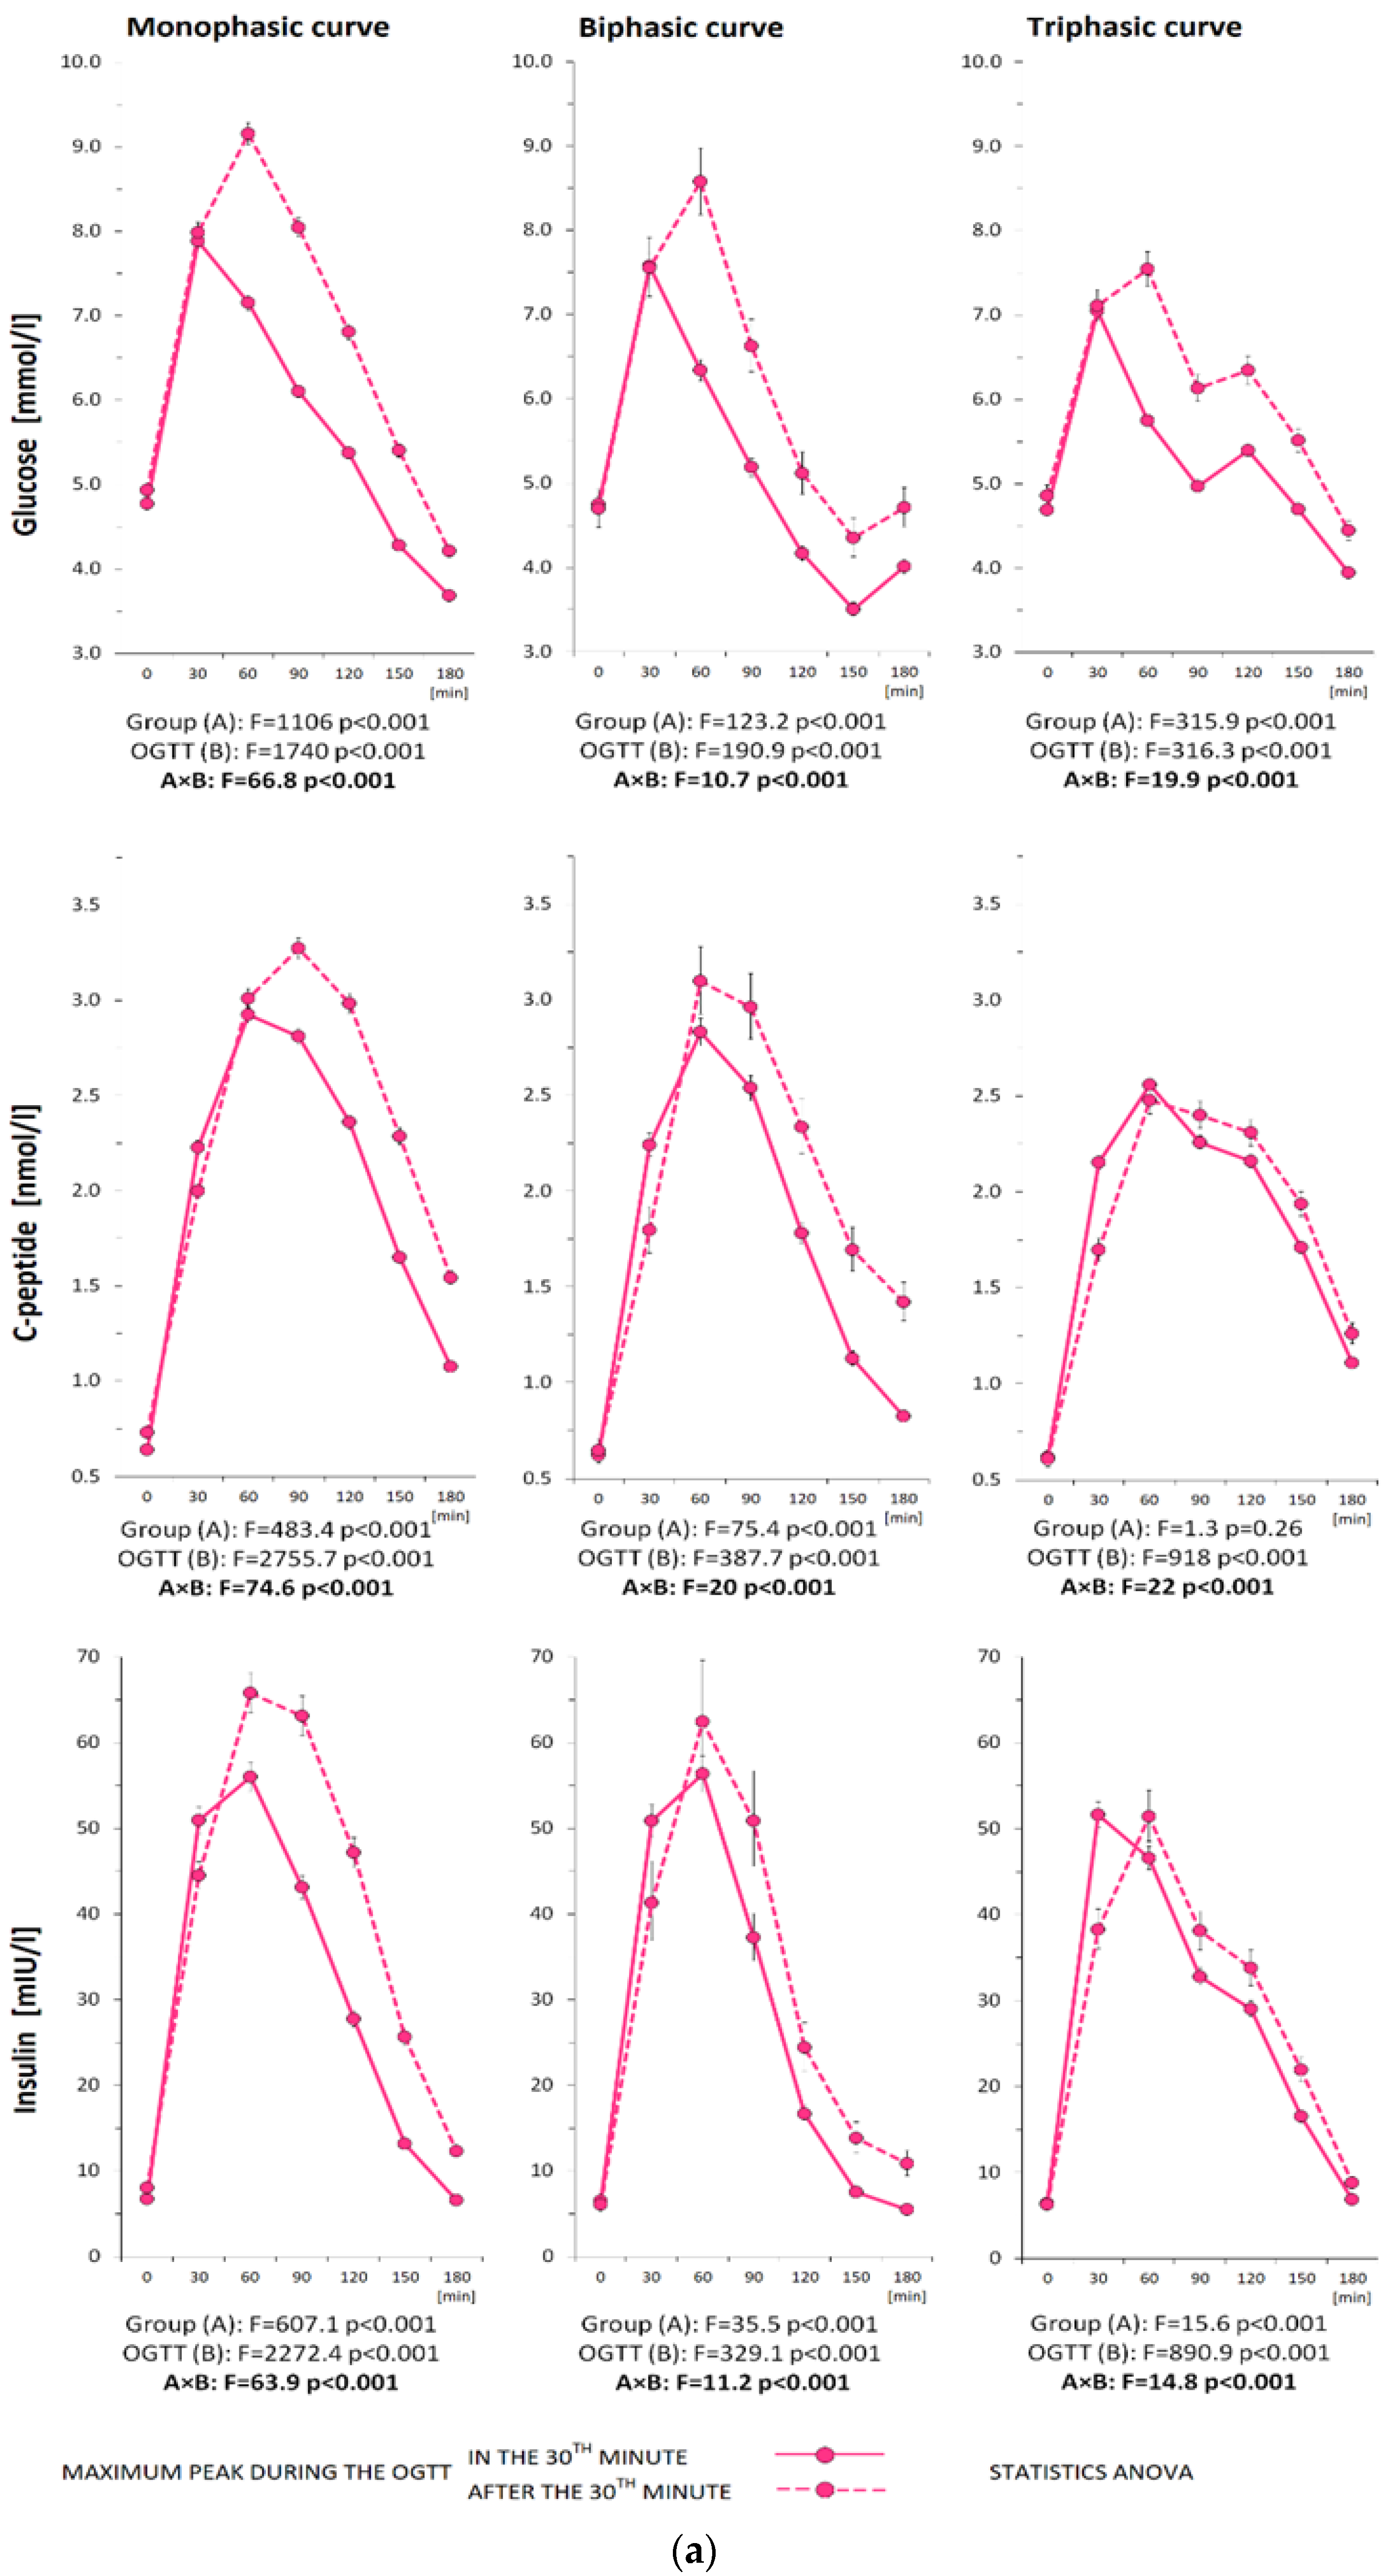
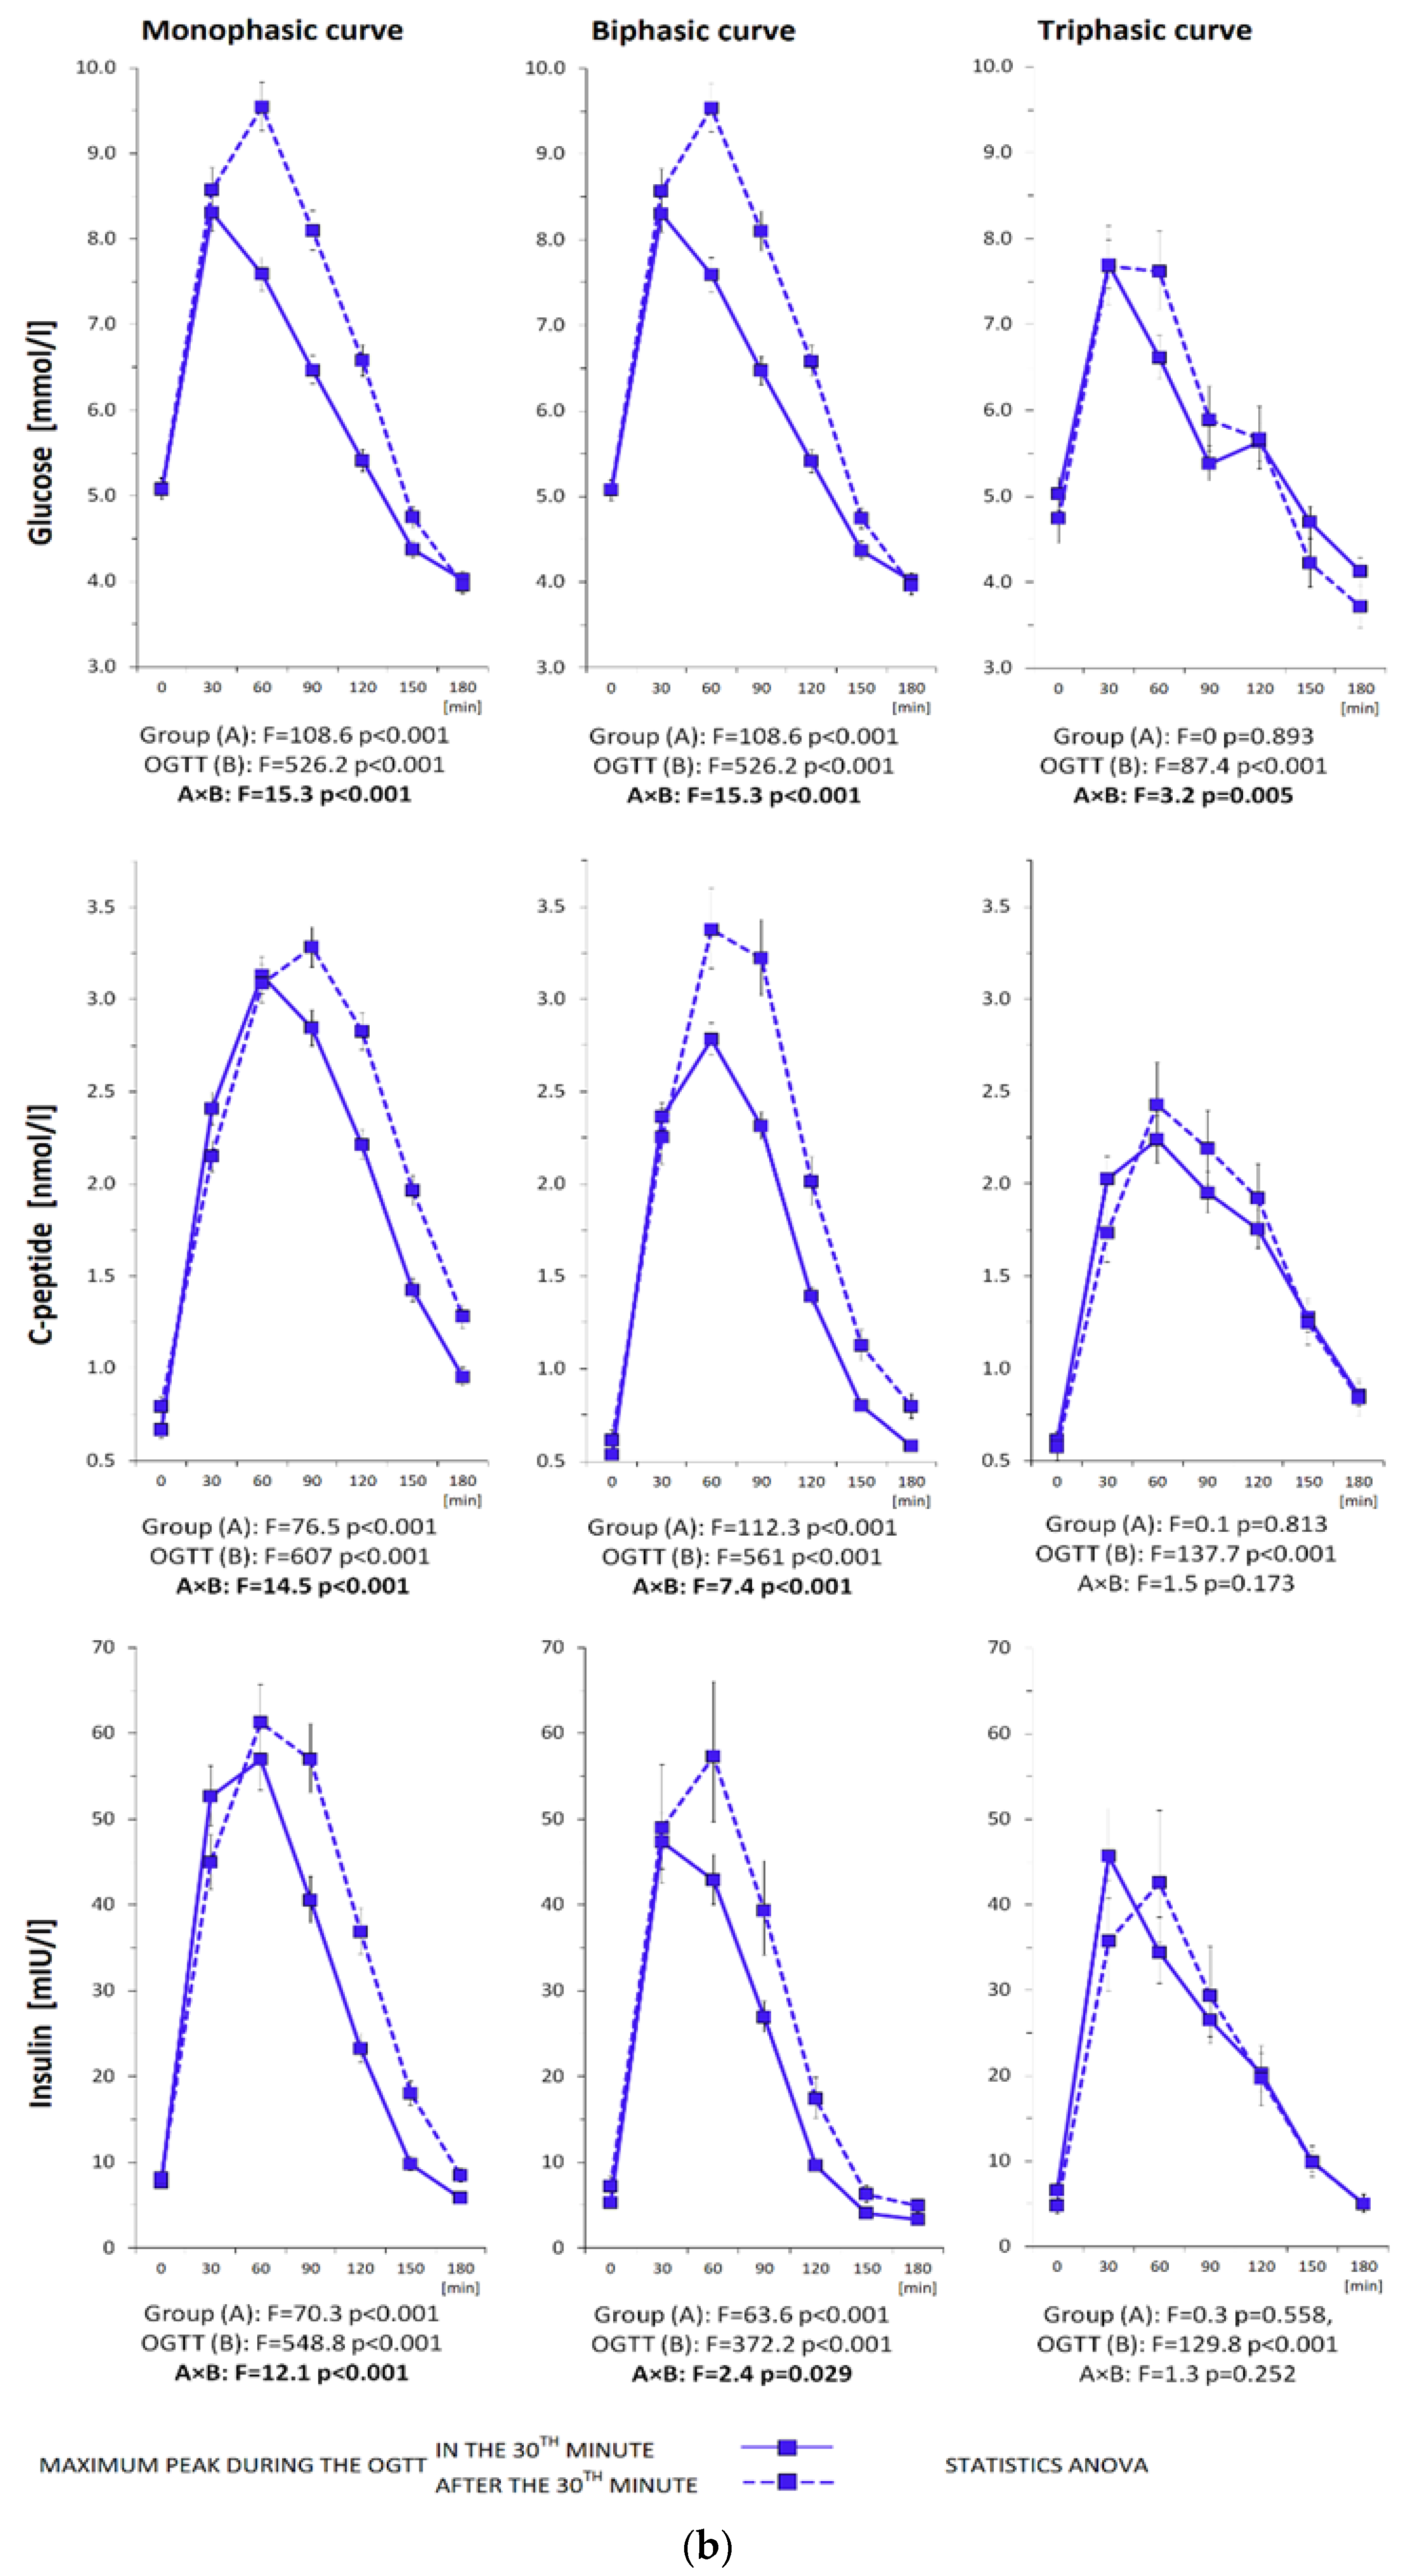
3.3. Metabolic Characterization of the Subjects Divided by the Location of the Glycemic Peak
3.3.1. Monophasic Curves
3.3.2. Biphasic Curves
3.3.3. Triphasic Curves
3.3.4. Multiphasic Curves


| (a) | |||||||||
| Women | Monophasic Curve n = 533 | Biphasic Curve n = 147 | Triphasic Curve n = 308 | ||||||
| Maximum Peak during the OGTT | Maximum Peak during the OGTT | Maximum Peak during the OGTT | |||||||
| at 30 min n = 316 | after 30 min n = 217 | p-Level | at 30 min n = 124 | after 30 min n = 23 | p-Level | at 30 min n = 249 | after 30 min n = 59 | p-Level | |
| NGT/IFG + IGT/T2DM | 286/30/0 | 148/59/10 | 118/5/1 | 20/3/0 | 237/12/0 | 49/9/1 | |||
| Anthropometric Parameters | |||||||||
| Age [years] | 33.5 (26.8, 40.9) | 34.6 (29.4, 41.1) | 0.103 | 31.8 (25.2, 36.9) | 39.2 (30.3, 41) | 0.011 | 32.6 (27.1, 38.1) | 34.6 (30.7, 39.7) | 0.021 |
| BMI [kg/m2] | 23.7 (21, 27.5) | 25.6 (21.1, 30.2) | 0.007 | 22.7 (20.3, 27) | 24.3 (20, 28.1) | 0.819 | 22.8 (20.7, 25.8) | 23.5 (21, 27.3) | 0.271 |
| BAI [%] | 28.1 (25.4, 32.1) | 29.9 (26.1, 34.1) | 0.006 | 26.7 (24.7, 31) | 27.9 (25.3, 30) | 0.806 | 27.4 (25.3, 30.6) | 28.1 (25.7, 31.9) | 0.605 |
| Systolic blood pressure [mmHg] | 114 (105, 124) | 115 (108, 126) | 0.179 | 111 (102, 120) | 120 (107, 127) | 0.031 | 111 (103, 119) | 112 (105, 122) | 0.661 |
| Diastolic blood pressure [mmHg] | 72 (65.5, 79.5) | 73 (67, 81) | 0.078 | 70 (64, 77) | 74 (65.5, 82) | 0.034 | 70 (64.8, 79) | 73 (67, 77) | 0.289 |
| Abdominal circumference [cm] | 86 (78.3, 95.2) | 90.3 (79.9, 99.1) | 0.007 | 83 (77.1, 95.6) | 88.1 (76.3, 95.5) | 0.787 | 83.6 (77.6, 90.9) | 85.5 (80.9, 93.5) | 0.016 |
| Hip circumference [cm] | 101 (95, 108) | 103 (96, 111) | 0.053 | 99.5 (94.5, 106) | 100 (94.8, 103) | 0.535 | 99 (93.9, 105) | 101 (95.8, 107) | 0.326 |
| Waist circumference [cm] | 76 (69.7, 86) | 80.8 (71.9, 92.1) | 0.002 | 73 (69.3, 84.5) | 75.5 (70.3, 85.5) | 0.744 | 74 (68.8, 80) | 75.1 (71, 85.3) | 0.049 |
| WHR | 0.766 (0.728, 0.812) | 0.792 (0.743, 0.836) | 0.002 | 0.756 (0.718, 0.794) | 0.756 (0.719, 0.859) | 0.143 | 0.75 (0.721, 0.791) | 0.767 (0.727, 0.816) | 0.022 |
| Biochemical Parameters | |||||||||
| Total cholesterol [mmol/L] | 4.57 (4.08, 5.2) | 4.74 (4.09, 5.28) | 0.343 | 4.48 (4.07, 5.03) | 4.58 (3.91, 5.25) | 0.828 | 4.52 (3.97, 5.03) | 4.66 (4.05, 5.26) | 0.167 |
| HDL cholesterol [mmol/L] | 1.57 (1.36, 1.79) | 1.5 (1.24, 1.8) | 0.091 | 1.59 (1.38, 1.88) | 1.5 (1.22, 1.81) | 0.217 | 1.61 (1.37, 1.87) | 1.55 (1.29, 1.82) | 0.292 |
| LDL cholesterol [mmol/L] | 2.6 (2.12, 3.11) | 2.63 (2.06, 3.14) | 0.873 | 2.41 (2.07, 2.94) | 2.56 (2.16, 2.88) | 0.432 | 2.4 (2.05, 2.94) | 2.64 (2.09, 3.3) | 0.102 |
| Triacylglycerols [mmol/L] | 0.86 (0.64, 1.16) | 1.03 (0.66, 1.48) | 0.001 | 0.75 (0.595, 1.11) | 0.76 (0.56, 1.2) | 0.579 | 0.785 (0.57, 1.06) | 0.705 (0.543, 1.06) | 0.696 |
| Urea [mmol/L] | 4.1 (3.6, 5) | 4.38 (3.7, 5.1) | 0.262 | 4.2 (3.5, 4.8) | 4.7 (3.8, 5.08) | 0.159 | 4.2 (3.59, 5.06) | 4.37 (4, 5) | 0.187 |
| Uric acid [umol/L] | 248 (223, 286) | 272 (233, 305) | <0.001 | 255 (207, 290) | 274 (237, 305) | 0.213 | 246 (214, 292) | 251 (218, 284) | 0.945 |
| Creatinine [umol/L] | 65 (59, 72.4) | 65.9 (58.6, 73) | 0.777 | 64.4 (57.1, 71) | 65.5 (62.9, 71.8) | 0.169 | 65 (58, 71) | 62 (57, 67) | 0.035 |
| TSH [mIU/L] | 2.25 (1.52, 3.28) | 2.25 (1.68, 3.3) | 0.383 | 2.4 (1.72, 3.27) | 2.19 (1.69, 3.29) | 0.925 | 2.41 (1.68, 3.12) | 2.19 (1.48, 3.01) | 0.038 |
| Free T4 [pmol/L] | 15.1 (13.9, 16.5) | 15.1 (13.7, 16.3) | 0.863 | 15 (13.6, 16.5) | 15 (13.6, 16.2) | 0.899 | 15.1 (13.4, 16.7) | 14.6 (13.8, 16) | 0.9 |
| Free T3 [pmol/L] | 4.81 (4.37, 5.31) | 4.89 (4.47, 5.41) | 0.267 | 4.79 (4.49, 5.49) | 4.71 (4.31, 5.11) | 0.074 | 4.74 (4.32, 5.24) | 4.76 (4.34, 5.03) | 0.167 |
| ALT [ukat/L] | 0.28 (0.22, 0.36) | 0.32 (0.25, 0.44) | <0.001 | 0.27 (0.23, 0.34) | 0.27 (0.21, 0.337) | 0.337 | 0.28 (0.228, 0.35) | 0.31 (0.225, 0.365) | 0.736 |
| AST [ukat/L] | 0.34 (0.29, 0.4) | 0.37 (0.3, 0.44) | 0.003 | 0.33 (0.29, 0.4) | 0.33 (0.285, 0.358) | 0.913 | 0.33 (0.28, 0.38) | 0.34 (0.28, 0.43) | 0.786 |
| GGT [ukat/L] | 0.21 (0.15, 0.31) | 0.25 (0.19, 0.405) | <0.001 | 0.21 (0.17, 0.28) | 0.21 (0.14, 0.3) | 0.471 | 0.2 (0.16, 0.27) | 0.21 (0.15, 0.27) | 0.84 |
| (b) | |||||||||
| Women | Monophasic Curve n = 533 | Biphasic Curve n = 147 | Triphasic Curve n = 308 | ||||||
| Maximum peak during the OGTT | Maximum peak during the OGTT | Maximum peak during the OGTT | |||||||
| at 30 min n = 316 | after 30 min n = 217 | p-level | at 30 min n = 124 | after 30 min n = 23 | p-level | at 30 min n = 249 | after 30 min n = 59 | p-level | |
| Ogtt Descriptions | |||||||||
| Glucose 0 min [mmol/L] | 4.8 (4.5, 5.1) | 4.8 (4.5, 5.4) | 0.023 | 4.75 (4.5, 5) | 4.7 (4.35, 5) | 0.462 | 4.7 (4.4, 4.9) | 4.9 (4.6, 5.1) | 0.012 |
| Glucose 30 min | 7.9 (7.1, 8.8) | 8.2 (7.1, 9.1) | 0.352 | 7.6 (6.9, 8.53) | 8.2 (6.75, 8.5) | 0.566 | 7.2 (6.3, 8) | 7.3 (6.25, 8.1) | 0.708 |
| Glucose 60 min | 7.2 (6.38, 8.2) | 9.2 (8.1, 10.6) | <0.001 | 6.35 (5.38, 7.4) | 8.7 (7.85, 9.5) | <0.001 | 5.8 (5, 6.7) | 7.6 (6.45, 8.85) | <0.001 |
| Glucose 90 min | 6 (5.3, 7.02) | 8.1 (7, 9.5) | <0.001 | 5.4 (4.4, 5.93) | 6.1 (5.9, 7.65) | <0.001 | 4.9 (4.3, 5.7) | 6 (5.25, 7.1) | <0.001 |
| Glucose 120 min | 5.45 (4.7, 6.02) | 6.7 (5.7, 7.7) | <0.001 | 4.2 (3.6, 4.93) | 5.3 (4.3, 6.3) | <0.001 | 5.4 (4.8, 6.2) | 6.3 (5.8, 7.3) | <0.001 |
| Glucose 150 min | 4.3 (3.6, 5) | 5.3 (4.4, 6.6) | <0.001 | 3.3 (2.8, 4) | 4.8 (2.8, 5.7) | 0.04 | 4.8 (4.1, 5.4) | 5.5 (4.9, 6.2) | <0.001 |
| Glucose 180 min | 3.6 (3.2, 4.1) | 4 (3.3, 5.1) | <0.001 | 3.9 (3.6, 4.4) | 5 (3.45, 5.75) | 0.012 | 3.9 (3.4, 4.6) | 4.4 (4.05, 4.9) | <0.001 |
| C-peptide 0 min [nmol/L] | 0.58 (0.48, 0.74) | 0.67 (0.52, 0.91) | 0.001 | 0.58 (0.48, 0.74) | 0.57 (0.455, 0.775) | 0.841 | 0.58 (0.49, 0.73) | 0.56 (0.45, 0.685) | 0.388 |
| C-peptide 30 min | 2.13 (1.71, 2.66) | 1.91 (1.46, 2.55) | <0.001 | 2.15 (1.82, 2.79) | 1.83 (1.43, 2.29) | 0.005 | 2.14 (1.74, 2.56) | 1.67 (1.35, 2.01) | <0.001 |
| C-peptide 60 min | 2.83 (2.29, 3.49) | 2.9 (2.31, 3.71) | 0.444 | 2.8 (2.38, 3.33) | 3.14 (2.62, 3.7) | 0.103 | 2.46 (2.09, 3.02) | 2.35 (1.94, 2.9) | 0.34 |
| C-peptide 90 min | 2.71 (2.2, 3.39) | 3.11 (2.58, 4.01) | <0.001 | 2.52 (2.15, 2.99) | 2.75 (2.4, 3.65) | 0.033 | 2.23 (1.81, 2.61) | 2.32 (1.92, 2.77) | 0.197 |
| C-peptide 120 min | 2.25 (1.82, 2.9) | 2.88 (2.28, 3.74) | <0.001 | 1.71 (1.4, 2.22) | 2.04 (1.73, 2.82) | <0.001 | 2.11 (1.72, 2.59) | 2.25 (1.85, 2.96) | 0.112 |
| C-peptide 150 min | 1.55 (1.22, 2.08) | 2.11 (1.69, 2.85) | <0.001 | 1.1 (0.8, 1.42) | 1.43 (1.02, 2.4) | <0.001 | 1.65 (1.35, 2.06) | 1.81 (1.55, 2.4) | 0.019 |
| C-peptide 180 min | 0.995 (0.78, 1.32) | 1.42 (1.05, 1.99) | <0.001 | 0.75 (0.587, 1.08) | 1.19 (0.715, 1.99) | <0.001 | 1.04 (0.83, 1.33) | 1.21 (0.93, 1.58) | 0.006 |
| Insulin 0 min [mIU/L] | 6.15 (4.5, 9.22) | 7 (4.5, 12.9) | 0.004 | 6.05 (4.4, 8.88) | 5.6 (3.75, 8.6) | 0.774 | 5.9 (4.4, 8.4) | 5.7 (4.05, 8.2) | 0.571 |
| Insulin 30 min | 48.7 (34.6, 72.3) | 43.7 (28.3, 66.6) | 0.006 | 51.9 (39.5, 71.3) | 40.7 (23.2, 57.7) | 0.002 | 52.1 (36.5, 69.5) | 37.9 (25.6, 49.6) | <0.001 |
| Insulin 60 min | 53 (35.9, 79.6) | 60.9 (40.7, 98.7) | 0.002 | 53.9 (39.7, 72.8) | 58 (41.4, 76.8) | 0.389 | 44.4 (31.4, 63.3) | 48.2 (36.4, 61.9) | 0.096 |
| Insulin 90 min | 40.5 (28.1, 62.9) | 57.9 (39.1, 91.6) | <0.001 | 37.4 (26.6, 53) | 49 (29.6, 72.9) | 0.089 | 32.4 (22.1, 45.4) | 37.5 (26, 50.6) | 0.06 |
| Insulin 120 min | 26.3 (17.4, 41.6) | 43 (27.5, 81.6) | <0.001 | 18.6 (10.4, 26.9) | 20.8 (13.3, 40.3) | 0.018 | 28.8 (20.9, 40.9) | 33 (22.9, 46.9) | 0.05 |
| Insulin 150 min | 11.3 (7.28, 21.3) | 24.6 (13.2, 45.3) | <0.001 | 6.55 (3.8, 12.5) | 13.5 (4.85, 24.4) | 0.002 | 16.7 (9.8, 25.6) | 18.7 (13.4, 35.4) | 0.002 |
| Insulin 180 min | 5.7 (3.9, 8.63) | 9.5 (5.9, 21.1) | <0.001 | 4.6 (3, 9.13) | 10.5 (4.35, 18.1) | 0.004 | 6.1 (3.8, 10.3) | 7.4 (4.95, 13.3) | 0.002 |
| AUC gluc 30 min | 189 (176, 207) | 195 (177, 215) | 0.087 | 185 (171, 201) | 188 (172, 205) | 0.678 | 179 (162, 192) | 180 (164, 197) | 0.141 |
| AUC gluc | 1050 (958, 1170) | 1260 (1140, 1420) | <0.001 | 939 (847, 1030) | 1090 (968, 1240) | <0.001 | 972 (881, 1080) | 1110 (1010, 1220) | <0.001 |
| ΔAUC gluc | 201 (116, 297) | 378 (275, 513) | <0.001 | 123 (52.5, 215) | 260 (207, 383) | <0.001 | 141 (79.5, 219) | 264 (137, 381) | <0.001 |
| AUC ins 30 min | 5050 (3550, 7400) | 4670 (3030, 6970) | 0.041 | 5390 (3950, 7240) | 4170 (2300, 6110) | 0.002 | 5270 (3800, 7050) | 3750 (2850, 4960) | <0.001 |
| AUC ins | 34,600 (25,100, 50,400) | 44,000 (29,600, 72,400) | <0.001 | 34,200 (25,900, 42,100) | 31,200 (25,700, 47,900) | 0.489 | 32,700 (25,200, 43,800) | 33,100 (24,700, 47,900) | 0.633 |
| ΔAUC ins | 27,500 (19,700, 41,600) | 36,800 (24,600, 57,900) | <0.001 | 27,100 (19,400, 33,200) | 25,300 (21,400, 36,000) | 0.216 | 25,700 (19,600, 36,000) | 26,700 (19,700, 40,100) | 0.388 |
| AUC cp 30 min | 41,300 (33,200, 50,600) | 38,700 (30,500, 50,900) | 0.05 | 41,900 (35,500, 51,900) | 34,500 (29,000, 46,600) | 0.02 | 41,600 (34,500, 48,800) | 33,000 (27,900, 39,000) | <0.001 |
| AUC cp | 374 × 103 (317, 453) × 103 | 425 × 103 (338, 546) × 103 | <0.001 | 343 × 103 (291, 393) × 103 | 344 × 103 (310, 471) × 103 | 0.043 | 346 × 103 (295, 410) × 103 | 333 × 103 (286, 416) × 103 | 0.593 |
| ΔAUC cp | 265 × 103 (215, 325) × 103 | 300 × 103 (244, 387) × 103 | <0.001 | 233 × 103 (192, 271) × 103 | 262 × 103 (217, 343) × 103 | 0.006 | 236 × 103 (198, 285) × 103 | 241 × 103 (190, 305) × 103 | 0.863 |
| (c) | |||||||||
| Women | Monophasic curve n = 533 | Biphasic curve n = 147 | Triphasic curve n = 308 | ||||||
| Maximum peak during the OGTT | Maximum peak during the OGTT | Maximum peak during the OGTT | |||||||
| at 30 min n = 316 | after 30 min n = 217 | p-level | at 30 min n = 124 | after 30 min n = 23 | p-level | at 30 min n = 249 | after 30 min n = 59 | p-level | |
| Insulin Sensitivity/Resistance | |||||||||
| HOMA-R | 1.3 (0.905, 1.98) | 1.52 (0.919, 2.9) | 0.002 | 1.28 (0.917, 1.88) | 1.1 (0.749, 1.84) | 0.698 | 1.24 (0.841, 1.8) | 1.22 (0.808, 1.74) | 0.966 |
| QUICKI | 0.367 (0.344, 0.39) | 0.358 (0.326, 0.389) | 0.002 | 0.368 (0.347, 0.389) | 0.377 (0.349, 0.403) | 0.663 | 0.37 (0.349, 0.395) | 0.371 (0.351, 0.398) | 0.758 |
| OGIS 2h | 459 (418, 498) | 429 (368, 470) | <0.001 | 482 (455, 519) | 467 (441, 511) | 0.3 | 466 (433, 505) | 438 (404, 478) | <0.001 |
| OGIS 3h | 522 (473, 562) | 471 (407, 526) | <0.001 | 522 (463, 560) | 498 (431, 545) | 0.104 | 508 (472, 556) | 489 (443, 513) | <0.001 |
| ISIcomp | 8.3 (5.58, 11.3) | 6.11 (3.26, 9.75) | <0.001 | 8.89 (6.72, 11.3) | 9.28 (5.65, 11.3) | 0.413 | 8.59 (6.3, 11.8) | 9.17 (5.75, 11) | 0.242 |
| MCRest | 9.86 (8.34, 10.8) | 8.39 (6.06, 9.86) | <0.001 | 10.6 (9.5, 11.3) | 10.2 (8.44, 10.7) | 0.107 | 10.3 (9.19, 11) | 9.63 (8.49, 10.8) | 0.005 |
| Si(oral) | 0.152 (0.085, 0.241) | 0.081 (0.039, 0.147) | <0.001 | 0.205 (0.137, 0.303) | 0.163 (0.086, 0.224) | 0.023 | 0.183 (0.117, 0.291) | 0.141 (0.089, 0.233) | 0.001 |
| PREDIM | 7.07 (5.53, 8.9) | 5.64 (3.79, 7.64) | <0.001 | 7.87 (6.52, 10) | 7.77 (5.73, 9.42) | 0.196 | 7.24 (5.82, 8.84) | 6.37 (5.53, 8.09) | 0.013 |
| Beta Cell Function | |||||||||
| HOMA-beta | 103 (71.3, 158) | 105 (72.3, 171) | 0.416 | 100 (73.2, 154) | 102 (69.7, 216) | 0.659 | 108 (78.2, 148) | 90.9 (64.4, 124) | 0.004 |
| Ins0/Gluc0 | 7.62 (5.74, 11) | 8.53 (5.87, 13.9) | 0.018 | 7.54 (5.72, 11.3) | 8.04 (5.12, 11.1) | 0.899 | 7.7 (6, 10.4) | 6.76 (5.23, 9.84) | 0.227 |
| Cp0/Gluc0 | 420 (317, 607) | 470 (324, 767) | 0.019 | 416 (315, 624) | 444 (282, 615) | 0.898 | 425 (331, 572) | 373 (289, 543) | 0.226 |
| IGI | 82.6 (54.5, 132) | 69.2 (44.4, 117) | 0.033 | 104 (67, 169) | 55.9 (37.7, 93) | <0.001 | 117 (81.2, 166) | 80.4 (59.3, 139) | <0.001 |
| IGI simplified | 38.3 (26.4, 54.4) | 31 (21.7, 51.4) | 0.001 | 42.2 (29.1, 57.7) | 29.4 (18.5, 41.4) | 0.002 | 43.2 (33.3, 57.5) | 32.1 (21.9, 43) | <0.001 |
| IGI cp | 505 (357, 697) | 388 (281, 581) | <0.001 | 584 (416, 902) | 368 (307, 591) | 0.001 | 625 (468, 861) | 450 (349, 675) | <0.001 |
| IGI simplified cp | 2110 (1450, 3000) | 1710 (1200, 2840) | 0.001 | 2330 (1600, 3180) | 1620 (1020, 2290) | 0.002 | 2380 (1840, 3170) | 1770 (1210, 2370) | <0.001 |
| AUC ins/AUC gluc | 33.2 (24.5, 48.3) | 34.1 (25.3, 53.3) | 0.102 | 35.9 (27.5, 44.5) | 32 (24.4, 45.7) | 0.507 | 34.3 (27.5, 44.7) | 30.8 (23, 38.3) | 0.027 |
| ΔAUC ins/ΔAUC gluc | 158 (92.1, 291) | 106 (66.5, 176) | <0.001 | 227 (143, 555) | 121 (68.6, 148) | <0.001 | 209 (127, 318) | 118 (86, 202) | <0.001 |
| AUC cp/AUC gluc | 362 (292, 431) | 336 (273, 435) | 0.05 | 354 (306, 440) | 336 (291, 456) | 0.635 | 367 (300, 411) | 310 (256, 363) | <0.001 |
| ΔAUC cp/ΔAUC gluc | 1410 (888, 2190) | 841 (602, 1150) | <0.001 | 1840 (1280, 4220) | 1070 (657, 1360) | <0.001 | 1700 (1120, 2890) | 1030 (727, 1770) | <0.001 |
| Disposition Indices | |||||||||
| IGI × ISIcomp | 265 (213, 328) | 214 (171, 271) | <0.001 | 300 (247, 383) | 287 (199, 346) | 0.057 | 296 (248, 358) | 246 (201, 304) | <0.001 |
| OGIS 3h × AUCins | 17.9 × 10⁶ (13.6, 25.6) × 106 | 20.7 × 10⁶ (15.3, 28.6) × 106 | <0.001 | 17.4 × 10⁶ (13.6, 20.9) × 106 | 16.4 × 10⁶ (12.7, 22.9) × 107 | 0.705 | 16.8 × 10⁷ (13.6, 22.7) × 106 | 16.0 × 10⁷ (12.8, 21.0) × 107 | 0.613 |
| Adaptation Index | |||||||||
| OGIS 3h × AUCcp | 19.2 × 10⁷ (16.5, 22.9) × 107 | 19.0 × 10⁷ (16.8, 23.3) × 107 | 0.424 | 17.3 × 10⁷ (14.4, 20.6) × 107 | 19.3 × 10⁷ (16.1, 22.3) × 107 | 0.254 | 17.7 × 10⁷ (15.2, 20.5) × 107 | 15.9 × 10⁷ (14.4, 19.2) × 107 | 0.025 |
| Hepatic Extraction | |||||||||
| HE | 68.3 (61.4, 74.4) | 64.9 (54.7, 71.5) | <0.001 | 67.2 (61.7, 73.4) | 71.7 (63.4, 74.5) | 0.548 | 68.1 (62.4, 72.6) | 67.2 (60.2, 72.8) | 0.535 |
| (a) | |||||||||
| Men | Monophasic Curve n = 100 | Biphasic Curve n = 74 | Triphasic Curve n = 43 | ||||||
| Maximum Peak during the OGTT | Maximum Peak during the OGTT | Maximum Peak during the OGTT | |||||||
| at 30 min n = 53 | after 30 min n = 47 | p-Level | at 30 min n = 60 | after 30 min n = 14 | p-Level | at 30 min n = 31 | after 30 min n = 12 | p-Level | |
| NGT/IFG + IGT/T2DM | 41/10/2 | 32/12/3 | 59/1/0 | 13/1/0 | 26/ 5/0 | 10/2/0 | |||
| Anthropometric Parameters | |||||||||
| Age [years] | 35.6 (27, 44.5) | 40.3 (25.8, 52.2) | 0.373 | 26.8 (23.7, 36.8) | 31.4 (24, 40.4) | 0.388 | 38.4 (30.8, 45.9) | 34.6 (31.5, 49.5) | 0.995 |
| BMI [kg/m2] | 24.8 (23, 28.1) | 26.5 (23.5, 31.6) | 0.149 | 23.4 (21.7, 26.3) | 24.6 (23.8, 27.8) | 0.149 | 25.3 (23.7, 27.6) | 24.6 (22, 26.1) | 0.118 |
| BAI [%] | 23.7 (22.1, 25.5) | 24.4 (21.8, 27.2) | 0.556 | 22.3 (20.3, 23.4) | 22.7 (21.6, 25.2) | 0.07 | 23.4 (21.3, 25.2) | 23 (20.2, 23.9) | 0.21 |
| Systolic blood pressure [mmHg] | 128 (115, 139) | 129 (117, 140) | 0.963 | 120 (114, 129) | 115 (110, 120) | 0.067 | 121 (112, 133) | 122 (116, 126) | 0.925 |
| Diastolic blood pressure [mmHg] | 77 (70, 87) | 77 (70, 85.5) | 0.775 | 73 (69.5, 78.5) | 69 (67, 75) | 0.483 | 75 (67, 81) | 66.5 (63.3, 78.3) | 0.348 |
| Abdominal circumference [cm] | 89.3 (85.4, 100) | 96 (84.7, 108) | 0.201 | 85.4 (79.2, 92) | 88.6 (85.5, 95.3) | 0.138 | 92.1 (86.7, 97.1) | 89.2 (82.5, 95.1) | 0.22 |
| Hip circumference [cm] | 99.9 (96.6, 104) | 102 (95, 109) | 0.35 | 97.3 (94.3, 102) | 100 (98.2, 102) | 0.228 | 100 (96.6, 107) | 98.3 (90.4, 101) | 0.105 |
| Waist circumference [cm] | 86.9 (80.2, 95.1) | 93.5 (82.1, 106) | 0.153 | 81 (76.4, 88.4) | 84.2 (80, 91.6) | 0.186 | 88.2 (83.1, 93.6) | 87.1 (80.3, 93.4) | 0.443 |
| WHR | 0.865 (0.821, 0.919) | 0.901 (0.852, 0.979) | 0.072 | 0.836 (0.802, 0.883) | 0.848 (0.814, 0.909) | 0.309 | 0.876 (0.839, 0.926) | 0.888 (0.844, 0.92) | 0.47 |
| Biochemical parameters | |||||||||
| Total cholesterol [mmol/L] | 4.95 (4.34, 5.41) | 4.75 (4.17, 5.43) | 0.574 | 4.54 (3.82, 5.03) | 4.3 (3.51, 4.56) | 0.459 | 4.84 (4.47, 5.32) | 4.98 (3.87, 5.65) | 0.777 |
| HDL cholesterol [mmol/L] | 1.3 (1.11, 1.47) | 1.21 (1.02, 1.51) | 0.503 | 1.26 (1.07, 1.49) | 1.26 (0.943, 1.39) | 0.294 | 1.24 (1.11, 1.54) | 1.15 (1.01, 1.51) | 0.491 |
| LDL cholesterol [mmol/L] | 3 (2.43, 3.4) | 2.8 (2.18, 3.36) | 0.25 | 2.62 (2.04, 3.17) | 2.46 (2.2, 2.83) | 0.421 | 2.99 (2.4, 3.34) | 2.79 (2.28, 3.5) | 0.888 |
| Triacylglycerols [mmol/L] | 1 (0.74, 1.65) | 1.16 (0.825, 2.15) | 0.103 | 1 (0.672, 1.44) | 1.05 (0.845, 1.31) | 0.365 | 0.94 (0.765, 1.63) | 1.18 (0.89, 1.47) | 0.415 |
| Urea [mmol/L] | 4.8 (4, 5.7) | 5 (4.6, 5.97) | 0.1 | 4.9 (4.12, 6.1) | 4.85 (4.4, 5.15) | 0.888 | 5.3 (4.6, 5.95) | 4.69 (4.03, 5.33) | 0.079 |
| Uric acid [umol/L] | 345 (297, 404) | 337 (289, 397) | 0.466 | 329 (296, 361) | 324 (298, 363) | 0.394 | 305 (291, 353) | 331 (261, 358) | 0.829 |
| Creatinine [umol/L] | 79.6 (72.8, 89) | 80.5 (75.8, 89.5) | 0.414 | 82.2 (74.8, 89.4) | 80.4 (69.6, 84.8) | 0.205 | 79 (74, 92) | 74.9 (70.2, 82.5) | 0.25 |
| TSH [mIU/L] | 2.16 (1.38, 2.73) | 2.24 (1.52, 2.75) | 0.854 | 2.01 (1.52, 3.01) | 2.22 (1.93, 2.77) | 0.492 | 1.82 (1.39, 2.31) | 1.92 (1.34, 2.88) | 0.72 |
| Free T4 [pmol/L] | 15.9 (14.7, 17) | 15.4 (13.9, 17.7) | 0.942 | 15.8 (14.4, 17.6) | 15.9 (14.9, 16.8) | 0.636 | 15.5 (14.3, 17.4) | 17.1 (15.5, 19.6) | 0.039 |
| Free T3 [pmol/L] | 5.17 (4.77, 5.66) | 5.13 (4.6, 5.67) | 0.551 | 5.38 (4.96, 6.01) | 5.59 (5.07, 5.88) | 0.767 | 5.19 (4.91, 5.57) | 5.27 (5.03, 5.47) | 0.536 |
| ALT [ukat/L] | 0.45 (0.35, 0.55) | 0.43 (0.32, 0.54) | 0.930 | 0.39 (0.308, 0.623) | 0.485 (0.36, 0.538) | 0.546 | 0.39 (0.315, 0.51) | 0.325 (0.21, 0.512) | 0.175 |
| AST [ukat/L] | 0.41 (0.37, 0.47) | 0.4 (0.355, 0.52) | 0.826 | 0.44 (0.373, 0.517) | 0.38 (0.325, 0.51) | 0.139 | 0.41 (0.36, 0.49) | 0.36 (0.32, 0.585) | 0.511 |
| GGT [ukat/L] | 0.36 (0.28, 0.53) | 0.465 (0.292, 0.6) | 0.202 | 0.31 (0.21, 0.425) | 0.375 (0.263, 0.53) | 0.093 | 0.38 (0.245, 0.555) | 0.24 (0.215, 0.648) | 0.623 |
| (b) | |||||||||
| Men | Monophasic curve n = 100 | Biphasic curve n = 74 | Triphasic curve n = 43 | ||||||
| Maximum peak during the OGTT | Maximum peak during the OGTT | Maximum peak during the OGTT | |||||||
| at 30 min n = 53 | after 30 min n = 47 | p-level | at 30 min n = 60 | after 30 min n = 14 | p-level | at 30 min n = 31 | after 30 min n = 12 | p-level | |
| Ogtt descriptions | |||||||||
| Glucose 0 min [mmol/L] | 5 (4.7, 5.5) | 5 (4.7, 5.4) | 0.976 | 4.7 (4.4, 4.93) | 4.85 (4.6, 5.28) | 0.11 | 5 (4.8, 5.3) | 4.7 (4.5, 5.08) | 0.565 |
| Glucose 30 min | 8.5 (7.5, 9.1) | 8.5 (7.5, 9.85) | 0.444 | 7.75 (6.8, 8.7) | 7.95 (7.48, 8.68) | 0.476 | 7.8 (7.05, 8.45) | 7.65 (6.65, 8.5) | 0.987 |
| Glucose 60 min | 7.6 (6.4, 9.1) | 9.7 (8.25, 11) | <0.001 | 6 (5.2, 7.4) | 8.45 (8.03, 9.45) | <0.001 | 6.5 (5.85, 7.45) | 7.85 (6.42, 9.42) | 0.03 |
| Glucose 90 min | 6.4 (5.9, 7.4) | 7.8 (7.15, 9.9) | <0.001 | 4.65 (4.1, 5.4) | 6.25 (5.25, 7) | <0.001 | 5.1 (4.65, 6) | 5.8 (5.05, 6.43) | 0.205 |
| Glucose 120 min | 5.4 (4.8, 6.1) | 6.5 (5.3, 7.5) | <0.001 | 3.7 (3.3, 4.12) | 4.5 (3.93, 4.85) | 0.001 | 5.5 (4.85, 6.4) | 5.75 (4.28, 6.1) | 0.734 |
| Glucose 150 min | 4.4 (3.8, 5) | 4.6 (4.1, 5.4) | 0.034 | 3.3 (2.98, 3.52) | 3.4 (3.02, 3.57) | 0.533 | 4.6 (4.2, 5.15) | 4.25 (3.63, 4.9) | 0.279 |
| Glucose 180 min | 3.9 (3.6, 4.5) | 3.8 (3.4, 4.6) | 0.941 | 4 (3.6, 4.2) | 4.1 (3.6, 4.42) | 0.161 | 4.1 (3.6, 4.6) | 3.65 (3.15, 4.03) | 0.212 |
| C-peptide 0 min [nmol/L] | 0.61 (0.48, 0.86) | 0.71 (0.485, 1.06) | 0.188 | 0.515 (0.4, 0.632) | 0.555 (0.465, 0.777) | 0.115 | 0.57 (0.445, 0.75) | 0.565 (0.492, 0.638) | 0.752 |
| C-peptide 30 min | 2.17 (1.85, 2.75) | 2.1 (1.68, 2.73) | 0.137 | 2.43 (1.98, 2.8) | 2.28 (1.7, 3.29) | 0.946 | 2.05 (1.42, 2.62) | 1.7 (1.52, 1.91) | 0.391 |
| C-peptide 60 min | 3.01 (2.51, 3.94) | 3.29 (2.44, 3.71) | 0.97 | 2.71 (2.23, 3.52) | 3.44 (2.75, 3.99) | 0.054 | 2.13 (1.55, 3.1) | 2.62 (2.16, 2.76) | 0.425 |
| C-peptide 90 min | 2.8 (2.12, 3.63) | 3.26 (2.68, 4.18) | 0.028 | 2.23 (1.78, 2.84) | 3.38 (2.75, 3.85) | 0.001 | 1.93 (1.5, 2.7) | 2.2 (1.84, 2.5) | 0.427 |
| C-peptide 120 min | 2.19 (1.51, 2.88) | 2.83 (2.08, 3.5) | 0.006 | 1.47 (0.978, 1.76) | 2.12 (1.58, 2.75) | 0.001 | 1.68 (1.26, 2.56) | 1.86 (1.41, 2.46) | 0.604 |
| C-peptide 150 min | 1.3 (1.03, 1.86) | 1.85 (1.34, 2.77) | <0.001 | 0.78 (0.6, 0.955) | 1.19 (0.835, 1.58) | 0.001 | 1.25 (0.835, 1.78) | 1.35 (0.793, 1.66) | 0.94 |
| C-peptide 180 min | 0.87 (0.64, 1.39) | 1.15 (0.91, 1.73) | 0.001 | 0.55 (0.465, 0.692) | 0.77 (0.62, 1.22) | <0.001 | 0.79 (0.59, 1.11) | 0.835 (0.61, 1.09) | 0.855 |
| Insulin 0 min [mIU/L] | 6.7 (5.3, 10.5) | 7.1 (4.65, 11) | 0.945 | 5.55 (3.9, 7.43) | 6.25 (4.43, 12.1) | 0.078 | 6.2 (4.6, 9.35) | 4.7 (3.2, 6.47) | 0.178 |
| Insulin 30 min | 52.9 (37, 69.6) | 42.4 (28.4, 61) | 0.197 | 47.1 (37.6, 63.3) | 40 (32.1, 61.2) | 0.846 | 40.7 (27.1, 72.9) | 30.5 (24.6, 61.3) | 0.412 |
| Insulin 60 min | 55.2 (40.5, 81.9) | 60.2 (41.1, 98.4) | 0.417 | 38.3 (27.8, 63.7) | 53.9 (46.3, 65.1) | 0.119 | 35.7 (19.7, 60.6) | 45 (33.8, 62.4) | 0.393 |
| Insulin 90 min | 38.8 (25.2, 59) | 53.6 (35.8, 92.2) | 0.008 | 23.6 (17.2, 39.5) | 43 (24.5, 62.3) | 0.028 | 25 (15.6, 43) | 26.6 (19.8, 42.8) | 0.698 |
| Insulin 120 min | 21.3 (11.4, 38.1) | 35.4 (18.8, 69.3) | 0.003 | 11.4 (6.17, 14.2) | 18.5 (12.5, 29.6) | 0.002 | 17.9 (10.5, 36.6) | 23.8 (10.4, 40.2) | 0.948 |
| Insulin 150 min | 7.9 (4.4, 18.9) | 14.7 (9.85, 37.9) | 0.001 | 3.95 (2.9, 6.85) | 5.95 (4.43, 11.2) | 0.021 | 9.4 (5.1, 21.6) | 7.8 (4.98, 17.5) | 0.931 |
| Insulin 180 min | 4.7 (3.1, 8.9) | 8 (3.9, 16.2) | 0.011 | 3.24 (2.48, 4.85) | 4.45 (3.15, 9.95) | 0.097 | 4.1 (2.35, 6.6) | 4.2 (3.15, 4.62) | 0.973 |
| AUC gluc 30 min | 203 (185, 224) | 203 (185, 223) | 0.746 | 182 (171, 206) | 193 (183, 204) | 0.285 | 192 (179, 206) | 186 (174, 198) | 0.139 |
| AUC gluc | 1110 (1000, 1210) | 1230 (1130, 1430) | <0.001 | 896 (820, 974) | 1050 (1000, 1130) | <0.001 | 1030 (943, 1090) | 1020 (957, 1200) | 0.642 |
| ΔAUC gluc | 197 (128, 281) | 356 (257, 459) | <0.001 | 101 (45, 171) | 176 (102, 259) | 0.012 | 155 (76.5, 236) | 213 (137, 311) | 0.066 |
| AUC ins 30 min | 5230 (3930, 7070) | 4500 (3020, 6560) | 0.22 | 4670 (3740, 6370) | 4550 (3380, 6540) | 0.709 | 4240 (2830, 7300) | 3150 (2590, 5990) | 0.351 |
| AUC ins | 32,000 (24,000, 51,700) | 42,400 (26,500, 64,300) | 0.143 | 25,300 (18,500, 32,400) | 27,800 (25,200, 46,600) | 0.07 | 29,300 (17,700, 43,200) | 29,900 (19,400, 35,000) | 0.905 |
| ΔAUC ins | 26,400 (17,900, 40,300) | 30,000 (20,400, 52,200) | 0.054 | 18,800 (13,100, 26,500) | 22,900 (20,200, 30,300) | 0.079 | 19,000 (12,000, 33,700) | 22,000 (15,600, 30,000) | 0.731 |
| AUC cp 30 min | 43,200 (35,600, 57,500) | 41,000 (33,600, 55,700) | 0.494 | 45,200 (36,300, 51,900) | 42,200 (33,200, 63,300) | 0.688 | 41,100 (28,100, 51,500) | 35,400 (30,900, 38,300) | 0.415 |
| AUC cp | 379 × 103 (291, 483) × 103 | 440 × 103 (331, 535) × 103 | 0.067 | 308 × 103 (254, 379) × 103 | 441 × 103 (308, 457) × 103 | 0.008 | 294 × 103 (234, 406) × 103 | 312 × 103 (246, 380) × 103 | 0.789 |
| ΔAUC cp | 260 × 103 (202, 321) × 103 | 284 × 103 (232, 362) × 103 | 0.200 | 202 × 103 (167, 261) × 103 | 295 × 103 (216, 355) × 103 | <0.001 | 203 × 103 (144, 257) × 103 | 202 × 103 (172, 268) × 103 | 0.641 |
| (c) | |||||||||
| Men | Monophasic curve n = 100 | Biphasic curve n = 74 | Triphasic curve n = 43 | ||||||
| Maximum peak during the OGTT | Maximum peak during the OGTT | Maximum peak during the OGTT | |||||||
| at 30 min n = 53 | after 30 min n = 47 | p-level | at 30 min n = 60 | after 30 min n = 14 | p-level | at 30 min n = 31 | after 30 min n = 12 | p-level | |
| Insulin Sensitivity/Resistance | |||||||||
| HOMA-R | 1.51 (1.11, 2.7) | 1.53 (0.977, 2.61) | 0.893 | 1.15 (0.761, 1.54) | 1.38 (0.91, 2.38) | 0.048 | 1.42 (1.01, 2) | 1.09 (0.683, 1.4) | 0.113 |
| QUICKI | 0.359 (0.329, 0.377) | 0.358 (0.331, 0.385) | 0.948 | 0.375 (0.358, 0.402) | 0.365 (0.336, 0.39) | 0.053 | 0.362 (0.344, 0.383) | 0.379 (0.364, 0.41) | 0.129 |
| OGIS 2h | 441 (393, 483) | 425 (377, 468) | 0.14 | 500 (465, 527) | 482 (429, 494) | 0.016 | 440 (406, 468) | 448 (437, 489) | 0.101 |
| OGIS 3h | 482 (426, 529) | 465 (392, 529) | 0.445 | 500 (476, 532) | 494 (424, 508) | 0.056 | 471 (441, 512) | 496 (449, 541) | 0.086 |
| ISIcomp | 8.21 (4.57, 10.8) | 5.59 (4.09, 9.83) | 0.425 | 10.7 (8.49, 15.1) | 9.23 (5.05, 12) | 0.014 | 9.18 (6.23, 12.7) | 9.94 (7.88, 15.9) | 0.518 |
| MCRest | 9.72 (8.19, 10.5) | 8.34 (5.58, 9.44) | 0.005 | 10.8 (10, 11.3) | 10.2 (8.95, 10.5) | 0.001 | 9.7 (8.87, 10.6) | 10.1 (9.12, 10.5) | 0.404 |
| Si(oral) | 0.117 (0.0616, 0.186) | 0.076 (0.026, 0.123) | 0.003 | 0.24 (0.146, 0.4) | 0.145 (0.11, 0.186) | 0.02 | 0.194 (0.101, 0.329) | 0.175 (0.092, 0.239) | 0.742 |
| PREDIM | 6.66 (4.72, 7.64) | 5.57 (3.79, 7.39) | 0.3 | 8.2 (7.14, 10.3) | 7.22 (5.81, 9.34) | 0.075 | 6.53 (5.49, 7.44) | 7.24 (6.53, 8.31) | 0.14 |
| Beta Cell Function | |||||||||
| HOMA-beta | 105 (72.5, 143) | 106 (66.4, 133) | 0.868 | 104 (63.1, 141) | 84 (58.7, 178) | 0.542 | 88.2 (58.1, 133) | 79 (55.5, 116) | 0.843 |
| Ins0/Gluc0 | 8.09 (6.52, 13.3) | 8.63 (5.75, 13.2) | 0.945 | 6.91 (4.99, 9.77) | 7.99 (5.05, 15.6) | 0.11 | 7.58 (5.53, 11.6) | 6.27 (4.46, 7.96) | 0.232 |
| Cp0/Gluc0 | 446 (360, 734) | 476 (317, 727) | 0.944 | 381 (276, 539) | 441 (279, 863) | 0.11 | 418 (305, 638) | 346 (246, 439) | 0.232 |
| IGI | 80.4 (62.7, 108) | 59.9 (43.8, 112) | 0.14 | 84.5 (63.8, 122) | 73.6 (44.4, 186) | 0.676 | 83.3 (53.5, 157) | 61 (47.4, 103) | 0.033 |
| IGI simplified | 35.7 (28.5, 52.7) | 28.7 (20.2, 47.5) | 0.147 | 37.3 (27.5, 48.8) | 33.6 (23.6, 59.3) | 0.924 | 35.8 (21.6, 58.3) | 24.2 (21.7, 45) | 0.392 |
| IGI cp | 560 (391, 693) | 410 (295, 552) | 0.001 | 603 (442, 899) | 509 (326, 983) | 0.397 | 496 (335, 713) | 401 (325, 559) | 0.289 |
| IGI simplified cp | 1970 (1570, 2910) | 1580 (1110, 2620) | 0.147 | 2060 (1510, 2690) | 1850 (1300, 3270) | 0.924 | 1970 (1190, 3210) | 1340 (1200, 2480) | 0.392 |
| AUC ins/AUC gluc | 32 (21.3, 41.6) | 32 (21.7, 49.5) | 0.699 | 27.3 (22, 35.6) | 27.4 (22.9, 43.1) | 0.435 | 27.6 (16, 40.7) | 27.9 (20.9, 31.1) | 0.933 |
| ΔAUC ins/ΔAUC gluc | 144 (95.6, 228) | 107 (67.3, 159) | 0.005 | 220 (138, 457) | 131 (88.2, 287) | 0.056 | 172 (99.1, 286) | 109 (79.5, 150) | 0.181 |
| AUC cp/AUC gluc | 339 (287, 417) | 343 (275, 422) | 0.759 | 344 (290, 404) | 378 (282, 480) | 0.298 | 282 (234, 368) | 303 (259, 327) | 0.958 |
| ΔAUC cp/ΔAUC gluc | 1320 (951, 2200) | 886 (634, 1070) | <0.001 | 2490 (1560, 4780) | 1620 (944, 3210) | 0.072 | 1600 (987, 2210) | 988 (803, 1350) | 0.135 |
| Disposition Indices | |||||||||
| IGI × ISIcomp | 214 (182, 263) | 211 (146, 257) | 0.177 | 313 (271, 374) | 259 (200, 286) | 0.002 | 238 (198, 279) | 263 (238, 333) | 0.154 |
| OGIS 3h × AUCins | 17.1 × 10⁶ (11.4, 21.5) × 106 | 19.6 × 10⁶ (12.7, 26.9) × 106 | 0.134 | 13.0 × 10⁶ (93.2, 15.9) × 106 | 14.7 × 10⁶ (1.3, 16.0) × 106 | 0.457 | 13.8 × 10⁶ (8.2, 19.6) × 106 | 14.1 × 10⁶ (11.4, 17.8) × 106 | 0.682 |
| Adaptation Index | |||||||||
| OGIS 3h × AUCcp | 17.9 × 10⁷ (15.0, 21.4) × 107 | 20.5 × 10⁷ (16.3, 23.3) × 107 | 0.125 | 15.3 × 10⁷ (12.9, 18.7) × 107 | 17.5 × 10⁷ (14.8, 22.2) × 107 | 0.158 | 13.9 × 10⁷ (12.5, 16.4) × 107 | 16.5 × 10⁷ (12.7, 19.0) × 107 | 0.301 |
| Hepatic Extraction | |||||||||
| HE | 68.7 (62, 75.4) | 67.3 (60, 76) | 0.361 | 72.1 (68.1, 77.5) | 69 (66.1, 79.4) | 0.721 | 70.2 (62.8, 77.5) | 69.5 (65.8, 75.7) | 0.691 |
4. Discussion
5. Conclusions
Author Contributions
Funding
Institutional Review Board Statement
Informed Consent Statement
Data Availability Statement
Acknowledgments
Conflicts of Interest
Appendix A
| Parameter | Details | Units |
|---|---|---|
| NGT | normal gulucose tolerance | n/a |
| IFG + IGT | impaired fasting glucose and/or impaired glucose tolerance | n/a |
| T2DM | type 2 diabetes mellitus | n/a |
| IGR | impaired glucose regulation (IFG and/or IGT or T2DM) | n/a |
| PCOS | women diagnosed with polycystic ovary syndrome | n/a |
| GDM history | women with positive history of gestational diabetes mellitus | n/a |
| BMI | body mass index | kg/m2 |
| BAI | body adiposity index; BAI = ((hip circumference)/((height)1.5) − 18) | % |
| WHR | waist to hip ratio | dimensionless |
| TSH | thyroid-stimulating hormone | mIU/L |
| Free T4 | free triiodothyronine | pmol/L |
| Free T3 | free thyroxine | pmol/L |
| ALT | alanine aminotransferaase | ukat/L |
| AST | aspartate transferase | ukat/L |
| GGT | gamma-glutamyltransferase | ukat/L |
| OGTT Description | ||
| Glucose | Glucose concentration in individual minutes of OGTT | mmol/L |
| Insulin | Insulin concentration in individual minutes of OGTT | mIU/L |
| C-peptide | C-peptide concentration in individual minutes of OGTT | nmol/L |
| AUC gluc 30 min | AUC of glucose in the first 30 min | mmol/L × min |
| AUC gluc | AUC of glucose (total) | mmol/L × min |
| ΔAUC gluc | Incremental (suprabasal) AUC of glucose | mmol/L × min |
| AUC ins 30 min | AUC of insulin in the first 30 min | pmol/L × min |
| AUC ins | AUC of insulin (total) | pmol/L × min |
| ΔAUC ins | Incremental (suprabasal) AUC of insulin | pmol/L × min |
| AUC cp 30 min | AUC of C-peptide in the first 30 min | pmol/L × min |
| AUC cp | AUC of C-peptide (total) | pmol/L × min |
| ΔAUC cp | Incremental (suprabasal) AUC of C-peptide | pmol/L × min |
| Insulin Sensitivity/Resistance | ||
| HOMA-R | HOMA-insulin resistance | dimensionless |
| QUICKI | QUICKI index of insulin sensitivity | dimensionless |
| OGIS 2h | OGIS index of insulin sensitivity calculated from 2-h OGTT | mL/min/m2 |
| OGIS 3h | OGIS index of insulin sensitivity calculated from 3-h OGTT | mL/min/m2 |
| ISIcomp | Index of insulin sensitivity also known as Matsuda’s index | [(mg/dL)2∙(μU/mL)2] −1/2 |
| MCRest | Index of insulin sensitivity also known as Stumvoll’s index | mL/min/kg |
| Si(oral) | Index of insulin sensitivity also known as Caumo’s index | (mL/min/kg)/(μU/mL) |
| PREDIM | PREDIM (predictor of clamp-based insulin sensitivity) | mg/min/kg |
| Beta Cell Function | ||
| HOMA-beta | HOMA-beta cell function | % |
| Ins0/Gluc0 | Ratio of basal insulin and glucose | pmol/mmol |
| Cp0/Gluc0 | Ratio of basal C-peptide and glucose | pmol/mmol |
| IGI | Insulinogenic index ((Ins30-Ins0)/(Gluc30-Gluc0)) | pmol/mmol |
| IGI simplified | Ins30min/Gluc30min | pmol/mmol |
| IGI cp | Insulinogenic index with C-peptide ((Cp30-Cp0)/(Gluc30-Gluc0)) | pmol/mmol |
| IGI simplified cp | Cp30min/Gluc30min | pmol/mmol |
| AUC ins/AUC gluc | Ratio of AUC ins and AUC gluc | pmol/mmol |
| ΔAUC ins/ΔAUC gluc | Ratio of ΔAUC ins and ΔAUC gluc | pmol/mmol |
| AUC cp/AUC gluc | Ratio of AUC cp and AUC gluc | pmol/mmol |
| ΔAUC cp/ΔAUC gluc | Ratio of ΔAUC cp and ΔAUC gluc | pmol/mmol |
| Disposition Indices | ||
| IGI × ISIcomp | Oral disposition index (one possible formulation) | (see corresponding units) |
| OGIS 3h × AUCins | Oral disposition index (one possible formulation) | (see corresponding units) |
| Adaptation Index | ||
| OGIS 3h × AUCcp | Oral adaptation index (one possible formulation) | (see corresponding units) |
| He | Hepatic insulin extraction | % |
References
- Hroboň, P.; Škodová, M.; Kučová, P.; Votápková, J. Comparison of different approaches for estimation of prevalence of type 2 diabetes mellitus in the Czech Republic. Vnitr. Lek. 2020, 66, e33–e37. [Google Scholar] [CrossRef]
- International Association for the Study of Obesity Website. Available online: www.iaso.org (accessed on 1 January 2021).
- Hameed, I.; Masoodi, S.R.; Mir, S.A.; Nabi, M.; Ghazanfar, K.; Ganai, B.A. Type 2 diabetes mellitus: From a metabolic disorder to an inflammatory condition. World J. Diabetes 2015, 6, 598–612. [Google Scholar] [CrossRef]
- Hartstra, A.V.; Bouter, K.E.; Bäckhed, F.; Nieuwdorp, M. Insights into the role of the microbiome in obesity and type 2 diabetes. Diabetes Care 2015, 38, 159–165. [Google Scholar] [CrossRef]
- Palatianou, M.E.; Simos, Y.V.; Andronikou, S.K.; Kiortsis, D.N. Long-term metabolic effects of high birth weight: A critical review of the literature. Horm. Metab. Res. 2014, 46, 911–920. [Google Scholar] [CrossRef]
- Kajantie, E.; Strang-Karlsson, S.; Hovi, P.; Wehkalampi, K.; Lahti, J.; Kaseva, N.; Järvenpää, A.L.; Räikkönen, K.; Eriksson, J.G.; Andersson, S. Insulin sensitivity and secretory response in adults born preterm: The Helsinki Study of Very Low Birth Weight Adults. J. Clin. Endocrinol. Metab. 2015, 100, 244–250. [Google Scholar] [CrossRef]
- Harder, T.; Rodekamp, E.; Schellong, K.; Dudenhausen, J.W.; Plagemann, A. Birth weight and subsequent risk of type 2 diabetes: A meta-analysis. Am. J. Epidemiol. 2007, 165, 849–857. [Google Scholar] [CrossRef]
- Vaag, A.; Brøns, C.; Gillberg, L.; Hansen, N.S.; Hjort, L.; Arora, G.P.; Thomas, N.; Broholm, C.; Ribel-Madsen, R.; Grunnet, L.G. Genetic, nongenetic and epigenetic risk determinants in developmental programming of type 2 diabetes. Acta Obstet. Gynecol. Scand. 2014, 93, 1099–1108. [Google Scholar] [CrossRef] [PubMed]
- Vejrazkova, D.; Lukasova, P.; Vankova, M.; Bradnova, O.; Vacinova, G.; Vcelak, J.; Cirmanova, V.; Andelova, K.; Krejci, H.; Bendlova, B. Gestational diabetes-metabolic risks of adult women with respect to birth weight. Physiol. Res. 2015, 64, S135–S145. [Google Scholar] [CrossRef] [PubMed]
- Stein, S.A.; Maloney, K.L.; Pollin, T.I. Genetic Counseling for Diabetes Mellitus. Curr. Genet. Med. Rep. 2014, 2, 56–67. [Google Scholar] [CrossRef] [PubMed]
- Brunetti, A.; Chiefari, E.; Foti, D. Recent advances in the molecular genetics of type 2 diabetes mellitus. World J. Diabetes 2014, 5, 128–140. [Google Scholar] [CrossRef]
- Bouret, S.; Levin, B.E.; Ozanne, S.E. Gene-environment interactions controlling energy and glucose homeostasis and the developmental origins of obesity. Physiol. Rev. 2015, 95, 47–82. [Google Scholar] [CrossRef]
- Franks, P.W.; Mesa, J.L.; Harding, A.H.; Wareham, N.J. Gene-lifestyle interaction on risk of type 2 diabetes. Nutr. Metab. Cardiovasc. Dis. 2007, 17, 104–124. [Google Scholar] [CrossRef]
- O’Rahilly, S. Human genetics illuminates the paths to metabolic disease. Nature 2009, 462, 307–314. [Google Scholar] [CrossRef]
- Morris, A.P.; Voight, B.F.; Teslovich, T.M.; Ferreira, T.; Segrè, A.V.; Steinthorsdottir, V.; Strawbridge, R.J.; Khan, H.; Grallert, H.; Mahajan, A.; et al. Large-scale association analysis provides insights into the genetic architecture and pathophysiology of type 2 diabetes. Nat. Genet. 2012, 44, 981–990. [Google Scholar] [CrossRef]
- Scott, R.A.; Lagou, V.; Welch, R.P.; Wheeler, E.; Montasser, M.E.; Luan, J.; Mägi, R.; Strawbridge, R.J.; Rehnberg, E.; Gustafsson, S.; et al. Large-scale association analyses identify new loci influencing glycemic traits and provide insight into the underlying biological pathways. Nat. Genet. 2012, 44, 991–1005. [Google Scholar] [CrossRef]
- Vassy, J.L.; Meigs, J.B. Is genetic testing useful to predict type 2 diabetes? Best Pract. Res. Clin. Endocrinol. Metab. 2012, 26, 189–201. [Google Scholar] [CrossRef]
- Muniyappa, R.; Lee, S.; Chen, H.; Quon, M.J. Current approaches for assessing insulin sensitivity and resistance in vivo: Advantages, limitations, and appropriate usage. Am. J. Physiol. Endocrinol. Metab. 2008, 294, E15–E26. [Google Scholar] [CrossRef]
- Stumvoll, M.; Mitrakou, A.; Pimenta, W.; Jenssen, T.; Yki-Järvinen, H.; Van Haeften, T.; Renn, W.; Gerich, J. Use of the oral glucose tolerance test to assess insulin release and insulin sensitivity. Diabetes Care 2000, 23, 295–301. [Google Scholar] [CrossRef]
- Kim, J.Y.; Michaliszyn, S.F.; Nasr, A.; Lee, S.; Tfayli, H.; Hannon, T.; Hughan, K.S.; Bacha, F.; Arslanian, S. The Shape of the Glucose Response Curve during an Oral Glucose Tolerance Test Heralds Biomarkers of Type 2 Diabetes Risk in Obese Youth. Diabetes Care 2016, 39, 1431–1439. [Google Scholar] [CrossRef]
- Bervoets, L.; Mewis, A.; Massa, G. The shape of the plasma glucose curve during an oral glucose tolerance test as an indicator of Beta cell function and insulin sensitivity in end-pubertal obese girls. Horm. Metab. Res. 2015, 47, 445–451. [Google Scholar] [CrossRef]
- Chung, S.T.; Ha, J.; Onuzuruike, A.U.; Kasturi, K.; Galvan-De La Cruz, M.; Bingham, B.A.; Baker, R.L.; Utumatwishima, J.N.; Mabundo, L.S.; Ricks, M.; et al. Time to glucose peak during an oral glucose tolerance test identifies prediabetes risk. Clin. Endocrinol. 2017, 87, 484–491. [Google Scholar] [CrossRef]
- Tura, A.; Ludvik, B.; Nolan, J.J.; Pacini, G.; Thomaseth, K. Insulin and C-peptide secretion and kinetics in humans: Direct and model-based measurements during OGTT. Am. J. Physiol. Endocrinol. Metab. 2001, 281, E966–E974. [Google Scholar] [CrossRef] [PubMed]
- Pacini, G.; Mari, A. Methods for clinical assessment of insulin sensitivity and beta-cell function. Best Pract. Res. Clin. Endocrinol. Metab. 2003, 17, 305–322. [Google Scholar] [CrossRef] [PubMed]
- Tura, A.; Chemello, G.; Szendroedi, J.; Göbl, C.; Færch, K.; Vrbíková, J.; Pacini, G.; Ferrannini, E.; Roden, M. Prediction of clamp-derived insulin sensitivity from the oral glucose insulin sensitivity index. Diabetologia 2018, 61, 1135–1141. [Google Scholar] [CrossRef] [PubMed]
- Tura, A.; Morbiducci, U.; Sbrignadello, S.; Winhofer, Y.; Pacini, G.; Kautzky-Willer, A. Shape of glucose, insulin, C-peptide curves during a 3-h oral glucose tolerance test: Any relationship with the degree of glucose tolerance? Am. J. Physiol. Regul. Integr. Comp. Physiol. 2011, 300, R941–R948. [Google Scholar] [CrossRef]
- Retnakaran, R.; Qi, Y.; Goran, M.I.; Hamilton, J.K. Evaluation of proposed oral disposition index measures in relation to the actual disposition index. Diabet. Med. 2009, 26, 1198–1203. [Google Scholar] [CrossRef]
- Tura, A.; Kautzky-Willer, A.; Pacini, G. Insulinogenic indices from insulin and C-peptide: Comparison of beta-cell function from OGTT and IVGTT. Diabetes Res. Clin. Pract. 2006, 72, 298–301. [Google Scholar] [CrossRef]
- Bergman, R.N.; Stefanovski, D.; Buchanan, T.A.; Sumner, A.E.; Reynolds, J.C.; Sebring, N.G.; Xiang, A.H.; Watanabe, R.M. A better index of body adiposity. Obesity 2011, 19, 1083–1089. [Google Scholar] [CrossRef]
- Expert Panel on Detection, Evaluation, and Treatment of High Blood Cholesterol in Adults. Executive Summary of the Third Report of the National Cholesterol Education Program (NCEP) Expert Panel on Detection, Evaluation, and Treatment of High Blood Cholesterol In Adults (Adult Treatment Panel III). JAMA 2001, 285, 2486–2497. [Google Scholar] [CrossRef]
- Rotterdam ESHRE/ASRM-Sponsored PCOS Consensus Workshop Group. Revised 2003 consensus on diagnostic criteria and long-term health risks related to polycystic ovary syndrome. Fertil. Steril. 2004, 81, 19–25. [Google Scholar] [CrossRef]
- Ahrén, B.; Pacini, G. Islet adaptation to insulin resistance: Mechanisms and implications for intervention. Diabetes Obes. Metab. 2005, 7, 2–8. [Google Scholar] [CrossRef]
- Ahrén, B.; Pacini, G. Impaired adaptation of first-phase insulin secretion in postmenopausal women with glucose intolerance. Am. J. Physiol. 1997, 273, E701–E707. [Google Scholar] [CrossRef]
- Meloun, M.; Hill, M.; Militký, J.; Kupka, K. Transformation in the PC-aided biochemical data analysis. Clin. Chem. Lab. Med. 2000, 38, 553–559. [Google Scholar] [CrossRef]
- Meloun, M.; Militký, J.; Hill, M.; Brereton, R.G. Crucial problems in regression modelling and their solutions. Analyst 2002, 127, 433–450. [Google Scholar] [CrossRef]
- Abdul-Ghani, M.A.; Lyssenko, V.; Tuomi, T.; Defronzo, R.A.; Groop, L. The shape of plasma glucose concentration curve during OGTT predicts future risk of type 2 diabetes. Diabetes Metab. Res. Rev. 2010, 26, 280–286. [Google Scholar] [CrossRef]
- Manco, M.; Nolfe, G.; Pataky, Z.; Monti, L.; Porcellati, F.; Gabriel, R.; Mitrakou, A.; Mingrone, G. Shape of the OGTT glucose curve and risk of impaired glucose metabolism in the EGIR-RISC cohort. Metabolism 2017, 70, 42–50. [Google Scholar] [CrossRef]
- Utzschneider, K.M.; Younes, N.; Rasouli, N.; Barzilay, J.I.; Banerji, M.A.; Cohen, R.M.; Gonzalez, E.V.; Ismail-Beigi, F.; Mather, K.J.; Raskin, P.; et al. Shape of the OGTT glucose response curve: Relationship with β-cell function and differences by sex, race, and BMI in adults with early type 2 diabetes treated with metformin. BMJ Open Diabetes Res. Care 2021, 9, e002264. [Google Scholar] [CrossRef]
- Kanauchi, M.; Kimura, K.; Kanauchi, K.; Saito, Y. Beta-cell function and insulin sensitivity contribute to the shape of plasma glucose curve during an oral glucose tolerance test in non-diabetic individuals. Int. J. Clin. Pract. 2005, 59, 427–432. [Google Scholar] [CrossRef]
- Vejrazkova, D.; Vankova, M.; Vcelak, J.; Krejci, H.; Anderlova, K.; Tura, A.; Pacini, G.; Sumova, A.; Sladek, M.; Bendlova, B. The rs10830963 Polymorphism of the MTNR1B Gene: Association with Abnormal Glucose, Insulin and C-peptide Kinetics. Front. Endocrinol. 2022, 13, 868364. [Google Scholar] [CrossRef]
- Kaga, H.; Tamura, Y.; Takeno, K.; Kakehi, S.; Someya, Y.; Funayama, T.; Furukawa, Y.; Suzuki, R.; Sugimoto, D.; Kadowaki, S.; et al. Shape of the glucose response curve during an oral glucose tolerance test is associated with insulin clearance and muscle insulin sensitivity in healthy non-obese men. J. Diabetes Investig. 2020, 11, 874–877. [Google Scholar] [CrossRef]
- Kramer, C.K.; Ye, C.; Hanley, A.J.; Connelly, P.W.; Sermer, M.; Zinman, B.; Retnakaran, R. Delayed timing of post-challenge peak blood glucose predicts declining beta cell function and worsening glucose tolerance over time: Insight from the first year postpartum. Diabetologia 2015, 58, 1354–1362. [Google Scholar] [CrossRef] [PubMed]
- Wang, X.; Zhao, X.; Zhou, R.; Gu, Y.; Zhu, X.; Tang, Z.; Yuan, X.; Chen, W.; Zhang, R.; Qian, C.; et al. Delay in glucose peak time during the oral glucose tolerance test as an indicator of insulin resistance and insulin secretion in type 2 diabetes patients. J. Diabetes Investig. 2018, 9, 1288–1295. [Google Scholar] [CrossRef]
- Bonhoure, A.; Potter, K.J.; Colomba, J.; Boudreau, V.; Bergeron, C.; Desjardins, K.; Carricart, M.; Tremblay, F.; Lavoie, A.; Rabasa-Lhoret, R. Peak glucose during an oral glucose tolerance test is associated with future diabetes risk in adults with cystic fibrosis. Diabetologia 2021, 64, 1332–1341. [Google Scholar] [CrossRef] [PubMed]
- La Grasta Sabolić, L.; Požgaj Šepec, M.; Cigrovski Berković, M.; Stipančić, G. Time to the Peak, Shape of the Curve and Combination of These Glucose Response Characteristics During Oral Glucose Tolerance Test as Indicators of Early Beta-cell Dysfunction in Obese Adolescents. J. Clin. Res. Pediatr. Endocrinol. 2021, 13, 160–169. [Google Scholar] [CrossRef] [PubMed]
- Xie, J.H.; Liu, Q.; Yang, Y.; Liu, Z.L.; Hu, S.H.; Zhou, X.R.; Yuan, G.; Zhang, M.X.; Tao, J.; Yu, X.F. Correlation of liver enzymes with diabetes and pre-diabetes in middle-aged rural population in China. J. Huazhong Univ. Sci. Technolog. Med. Sci. 2016, 36, 53–58. [Google Scholar] [CrossRef]
- Vozarova, B.; Stefan, N.; Lindsay, R.S.; Saremi, A.; Pratley, R.E.; Bogardus, C.; Tataranni, P.A. High alanine aminotransferase is associated with decreased hepatic insulin sensitivity and predicts the development of type 2 diabetes. Diabetes 2002, 51, 1889–1895. [Google Scholar] [CrossRef]
- Kunutsor, S.K.; Apekey, T.A.; Walley, J. Liver aminotransferases and risk of incident type 2 diabetes: A systematic review and meta-analysis. Am. J. Epidemiol. 2013, 178, 159–171. [Google Scholar] [CrossRef]


| (a) | |||
| Women n = 1035 | Men n = 227 | p-Level | |
| NGT/IFG + IGT/T2DM | 904/119/12 | 191/31/5 | |
| Anthropometric Parameters | |||
| Age [years] | 33.3 (27.4, 39.4) | 34 (25.8, 45.5) | 0.298 |
| BMI [kg/m2] | 23.5 (20.8, 27.7) | 24.8 (22.7, 27.5) | <0.001 |
| BAI [%] | 28 (25.4, 31.7) | 23.2 (21.1, 25.2) | <0.001 |
| Systolic blood pressure [mmHg] | 113 (104, 123) | 124 (114, 133) | <0.001 |
| Diastolic blood pressure [mmHg] | 71 (65, 79) | 75 (68, 83) | <0.001 |
| Abdominal circumference [cm] | 85 (78.5, 95.2) | 89.3 (82.6, 98.9) | <0.001 |
| Hip circumference [cm] | 100 (94.5, 107) | 99.9 (95.2, 105) | 0.571 |
| Waist circumference [cm] | 75.5 (69.9, 85.1) | 86.3 (79.3, 95.1) | <0.001 |
| WHR | 0.764 (0.724, 0.808) | 0.864 (0.821, 0.919) | <0.001 |
| Biochemical Parameters | |||
| Total cholesterol [mmol/L] | 4.58 (4.03, 5.18) | 4.7 (4, 5.23) | 0.613 |
| HDL cholesterol [mmol/L] | 1.57 (1.33, 1.83) | 1.26 (1.04, 1.51) | <0.001 |
| LDL cholesterol [mmol/L] | 2.53 (2.07, 3.05) | 2.79 (2.2, 3.3) | 0.001 |
| Triacylglycerols [mmol/L] | 0.83 (0.6, 1.18) | 1.01 (0.74, 1.59) | <0.001 |
| Urea [mmol/L] | 4.2 (3.6, 5) | 5 (4.3, 5.8) | <0.001 |
| Uric acid [umol/L] | 254 (220, 292) | 330 (293, 384) | <0.001 |
| Creatinine [umol/L] | 65 (58.9, 72) | 80.5 (73.1, 89) | <0.001 |
| TSH [mIU/L] | 2.3 (1.6, 3.2) | 2.06 (1.51, 2.82) | 0.001 |
| Free T4 [pmol/L] | 15 (13.6, 16.5) | 15.9 (14.4, 17.4) | <0.001 |
| Free T3 [pmol/L] | 4.81 (4.39, 5.32) | 5.24 (4.83, 5.74) | <0.001 |
| ALT [ukat/L] | 0.29 (0.23, 0.37) | 0.42 (0.32, 0.56) | <0.001 |
| AST [ukat/L] | 0.34 (0.29, 0.41) | 0.41 (0.36, 0.5) | <0.001 |
| GGT [ukat/L] | 0.21 (0.16, 0.3) | 0.36 (0.24, 0.53) | <0.001 |
| (b) | |||
| Women n = 1035 | Men n = 227 | p-Level | |
| Ogtt Descriptions | |||
| Glucose 0 min [mmol/L] | 4.7 (4.5, 5.1) | 4.8 (4.6, 5.3) | 0.001 |
| Glucose 30 min | 7.6 (6.7, 8.6) | 8 (7.15, 8.9) | <0.001 |
| Glucose 60 min | 7 (5.8, 8.4) | 7.4 (5.9, 9) | 0.042 |
| Glucose 90 min | 5.9 (4.9, 7.25) | 5.9 (4.8, 7.2) | 0.599 |
| Glucose 120 min | 5.5 (4.7, 6.5) | 5 (4, 6) | <0.001 |
| Glucose 150 min | 4.6 (3.7, 5.5) | 4 (3.4, 4.75) | <0.001 |
| Glucose 180 min | 3.9 (3.4, 4.5) | 3.9 (3.6, 4.3) | 0.705 |
| C-peptide 0 min [nmol/L] | 0.59 (0.48, 0.76) | 0.58 (0.45, 0.79) | 0.249 |
| C-peptide 30 min | 2.05 (1.67, 2.58) | 2.18 (1.74, 2.74) | 0.015 |
| C-peptide 60 min | 2.69 (2.21, 3.36) | 2.74 (2.23, 3.51) | 0.327 |
| C-peptide 90 min | 2.57 (2.11, 3.25) | 2.58 (1.91, 3.42) | 0.476 |
| C-peptide 120 min | 2.23 (1.76, 2.9) | 1.89 (1.38, 2.71) | <0.001 |
| C-peptide 150 min | 1.64 (1.23, 2.18) | 1.16 (0.81, 1.71) | <0.001 |
| C-peptide 180 min | 1.06 (0.8, 1.47) | 0.75 (0.575, 1.13) | <0.001 |
| Insulin 0 min [mIU/L] | 6.1 (4.4, 9.25) | 6.2 (4.3, 9.55) | 0.443 |
| Insulin 30 min | 47.6 (33, 69.8) | 45.9 (32.8, 65.1) | 0.359 |
| Insulin 60 min | 51.5 (35.6, 75) | 48.4 (30.2, 74.1) | 0.018 |
| Insulin 90 min | 39.5 (27.8, 59.9) | 35.7 (21.4, 57) | 0.001 |
| Insulin 120 min | 28.9 (18.4, 44.9) | 17.5 (10.2, 32.3) | <0.001 |
| Insulin 150 min | 14.3 (7.64, 26.7) | 7 (3.9, 15.4) | <0.001 |
| Insulin 180 min | 6.4 (4, 11.8) | 4.2 (2.76, 7.05) | <0.001 |
| AUC gluc 30 min | 185 (170, 203) | 192 (179, 212) | <0.001 |
| AUC gluc | 1050 (926, 1200) | 1040 (914, 1190) | 0.733 |
| ΔAUC gluc | 207 (110, 341) | 184 (88.9, 298) | 0.036 |
| AUC ins 30 min | 4960 (3420, 7070) | 4660 (3470, 6820) | 0.367 |
| AUC ins | 34,800 (25,900, 50,400) | 29,500 (20,000, 47,000) | <0.001 |
| ΔAUC ins | 28,000 (20,200, 41,400) | 22,400 (15,900, 38,400) | <0.001 |
| AUC cp 30 min | 40,200 (32,900, 50,000) | 42,900 (34,200, 52,400) | 0.055 |
| AUC cp | 362 × 103 (307, 447) × 103 | 338 × 103 (281, 445) × 103 | 0.011 |
| ΔAUC cp | 255 × 103 (207, 318) × 103 | 235 × 103 (181, 316) × 103 | <0.001 |
| (c) | |||
| Women n = 1035 | Men n = 227 | p-Level | |
| Insulin Sensitivity/Resistance | |||
| HOMA-R | 1.3 (0.89, 2.04) | 1.33 (0.9, 2.1) | 0.915 |
| QUICKI | 0.368 (0.343, 0.391) | 0.366 (0.341, 0.39) | 0.944 |
| OGIS 2h | 458 (418, 497) | 457 (410, 500) | 0.578 |
| OGIS 3h | 505 (453, 550) | 486 (440, 527) | <0.001 |
| ISIcomp | 8.37 (5.42, 11.2) | 8.96 (5.28, 12.5) | 0.024 |
| MCRest | 9.86 (8.31, 10.9) | 9.91 (8.77, 10.7) | 0.988 |
| Si(oral) | 0.154 (0.0845, 0.254) | 0.148 (0.0753, 0.261) | 0.925 |
| PREDIM | 6.92 (5.35, 8.78) | 7.01 (5.46, 8.69) | 0.908 |
| Beta Cell Function | |||
| HOMA-beta | 104 (73.3, 157) | 101 (65.6, 140) | <0.001 |
| Ins0/Gluc0 | 7.65 (5.73, 11.5) | 7.83 (5.44, 11.3) | 0.195 |
| Cp0/Gluc0 | 422 (316, 634) | 432 (300, 623) | 0.195 |
| IGI | 91.6 (58.9, 152) | 80.5 (53, 128) | 0.005 |
| IGI simplified | 38.5 (26.2, 55.2) | 34.8 (24.1, 50.4) | 0.039 |
| IGI cp | 522 (367, 751) | 530 (372, 717) | 0.935 |
| IGI simplified cp | 2120 (1450, 3050) | 1920 (1330, 2780) | 0.034 |
| AUC ins/AUC gluc | 33.4 (25.4, 47) | 29 (21.2, 41.8) | <0.001 |
| ΔAUC ins/ΔAUC gluc | 159 (93.3, 287) | 149 (85, 271) | 0.972 |
| AUC cp/AUC gluc | 351 (290, 421) | 334 (274, 412) | 0.014 |
| ΔAUC cp/ΔAUC gluc | 1320 (846, 2220) | 1380 (885, 2410) | 0.214 |
| Disposition Indices | |||
| IGI × ISIcomp | 268 (213, 338) | 254 (194, 316) | 0.016 |
| OGIS 3h × AUCins | 17.5 × 10⁶ (13.6, 24.5) × 106 | 14.4 × 10⁶ (10.1, 21.4) × 106 | <0.001 |
| Adaptation Index | |||
| OGIS 3h × AUCcp | 18.4 × 10⁷ (15.6, 21.9) × 107 | 16.3 × 10⁷ (13.9, 20.9) × 107 | <0.001 |
| Hepatic Extraction | |||
| HE | 67.7 (60.6, 73.2) | 70.2 (63.1, 76.8) | <0.001 |
Disclaimer/Publisher’s Note: The statements, opinions and data contained in all publications are solely those of the individual author(s) and contributor(s) and not of MDPI and/or the editor(s). MDPI and/or the editor(s) disclaim responsibility for any injury to people or property resulting from any ideas, methods, instructions or products referred to in the content. |
© 2023 by the authors. Licensee MDPI, Basel, Switzerland. This article is an open access article distributed under the terms and conditions of the Creative Commons Attribution (CC BY) license (https://creativecommons.org/licenses/by/4.0/).
Share and Cite
Vejrazkova, D.; Vankova, M.; Lukasova, P.; Hill, M.; Vcelak, J.; Tura, A.; Chocholova, D.; Bendlova, B. The Glycemic Curve during the Oral Glucose Tolerance Test: Is It Only Indicative of Glycoregulation? Biomedicines 2023, 11, 1278. https://doi.org/10.3390/biomedicines11051278
Vejrazkova D, Vankova M, Lukasova P, Hill M, Vcelak J, Tura A, Chocholova D, Bendlova B. The Glycemic Curve during the Oral Glucose Tolerance Test: Is It Only Indicative of Glycoregulation? Biomedicines. 2023; 11(5):1278. https://doi.org/10.3390/biomedicines11051278
Chicago/Turabian StyleVejrazkova, Daniela, Marketa Vankova, Petra Lukasova, Martin Hill, Josef Vcelak, Andrea Tura, Denisa Chocholova, and Bela Bendlova. 2023. "The Glycemic Curve during the Oral Glucose Tolerance Test: Is It Only Indicative of Glycoregulation?" Biomedicines 11, no. 5: 1278. https://doi.org/10.3390/biomedicines11051278