
Therapeutic Drug Monitoring in Oncohematological Patients: A Fast and Accurate HPLC-UV Method for the Quantification of Nilotinib in Human Plasma and Its Clinical Application
 , , , ,
Abstract
:1. Introduction
2. Materials and Methods
2.1. Chemicals and Reagents
2.2. Equipment and Chromatographic Conditions
2.3. Solutions
2.3.1. Preparation of Stock and Working Solutions
2.3.2. Preparation of Calibrators and Quality Control Samples
2.4. Sample Preparation
2.5. Validation Study
2.5.1. Linearity and Sensitivity
2.5.2. Selectivity and Specificity
2.5.3. Accuracy and Precision
2.5.4. Recovery
2.5.5. Stability
2.6. Clinical Application of Validate Method
3. Results
3.1. Method Development
3.2. Method Validation
3.2.1. Linearity and Sensitivity
3.2.2. Accuracy and Precision
3.2.3. Recovery
3.2.4. Stability
3.3. Clinical Application of Validate Method
4. Discussion
5. Conclusions
Author Contributions
Funding
Institutional Review Board Statement
Informed Consent Statement
Data Availability Statement
Acknowledgments
Conflicts of Interest
References
- Goldman, J.M.; Melo, J.V. Chronic myeloid leukemia-advances in biology and new approaches to treatment. N. Engl. J. Med. 2003, 349, 1451–1464. [Google Scholar] [CrossRef] [Green Version]
- Druker, B.J.; Talpaz, M.; Resta, D.J.; Peng, B.; Buchdunger, E.; Ford, J.M.; Lydon, N.B.; Kantarjian, H.; Capdeville, R.; Ohno-Jones, S.; et al. Efficacy and safety of a specific inhibitor of the BCR-ABL tyrosine kinase in chronic myeloid leukemia. N. Engl. J. Med. 2001, 344, 1031–1037. [Google Scholar] [CrossRef] [Green Version]
- Glivec (imatinib). Product Information Glivec-EMEA/H/C/000406-IA/0114/G; European Medicines Agency: London, UK, 2019; Available online: https://www.ema.europa.eu/en/documents/product-information/glivec-epar-product-information_en.pdf (accessed on 20 January 2021).
- Sprycel (dasatinib). Product Information Sprycel-EMEA/H/C/000709-II/0064; European Medicines Agency: London, UK, 2019; Available online: https://www.ema.europa.eu/en/documents/product-information/sprycel-epar-product-information_en.pdf (accessed on 20 January 2021).
- Tasigna (nilotinib). Product Information Tasigna-EMEA/H/C/00798-T/0094; European Medicines Agency: London, UK, 2019; Available online: https://www.ema.europa.eu/en/documents/product-information/tasigna-epar-product-information_en.pdf (accessed on 20 January 2021).
- De Francia, S.; D’Avolio, A.; De Martino, F.; Pirro, E.; Baietto, L.; Siccardi, M.; Simiele, M.; Racca, S.A.; Saglio, G.; Di Carlo, F.; et al. New HPLC–MS method for the simultaneous quantification of the antileukemia drugs imatinib, dasatinib, and nilotinib in human plasma. J. Chromatogr. B 2009, 877, 1721–1726. [Google Scholar] [CrossRef]
- Di Gion, P.; Kanefendt, F.; Lindauer, A.; Scheffler, M.; Doroshyenko, O.; Fuhr, U.; Wolf, J.; Jaehde, U. Clinical pharmacokinetics of tyrosine kinase inhibitors: Focus on pyrimidines, pyridines and pyrroles. Clin. Pharmacokinet. 2011, 50, 551–603. [Google Scholar] [CrossRef]
- Tojo, A.; Usuki, K.; Urabe, A.; Maeda, Y.; Kobayashi, Y.; Jinnai, I.; Ohyashiki, K.; Nishimura, M.; Kawaguchi, T.; Tanaka, H.; et al. A Phase I/II study of nilotinib in Japanese patients with imatinib-resistant or -intolerant Ph+ CML or relapsed/refractory Ph+ ALL. Int. J. Hematol. 2009, 89, 679–688. [Google Scholar] [CrossRef] [PubMed]
- Tanaka, C.; Yin, O.Q.P.; Sethuraman, V.; Smith, T.; Wang, X.; Grouss, K.; Kantarjian, H.; Giles, F.; Ottmann, O.; Galitz, L.; et al. Clinical Pharmacokinetics of the BCR–ABL Tyrosine Kinase Inhibitor Nilotinib. Clin. Pharmacol. Ther. 2010, 87, 197–203. [Google Scholar] [CrossRef] [PubMed]
- Yin, O.Q.P.; Gallagher, N.; Li, A.; Zhou, W.; Harrell, R.; Schran, H. Effect of Grapefruit Juice on the Pharmacokinetics of Nilotinib in Healthy Participants. J. Clin. Pharmacol. 2010, 50, 188–194. [Google Scholar] [CrossRef]
- Widmer, N.; Bardin, C.; Chatelut, E.; Paci, A.; Beijnen, J.; Levêque, D.; Veal, G.; Astier, A. Review of therapeutic drug monitoring of anticancer drugs part two—Targeted therapies. Eur. J. Cancer 2014, 50, 2020–2036. [Google Scholar] [CrossRef] [PubMed]
- Giles, F.J.; Yin, O.Q.P.; Sallas, W.M.; Le Coutre, P.D.; Woodman, R.C.; Ottmann, O.; Baccarani, M.; Kantarjian, H.M. Nilotinib population pharmacokinetics and exposure-response analysis in patients with imatinib-resistant or -intolerant chronic myeloid leukemia. Eur. J. Clin. Pharmacol. 2012, 69, 813–823. [Google Scholar] [CrossRef] [PubMed]
- Larson, R.; Yin, O.Q.P.; Hochhaus, A.; Saglio, G.; Clark, R.E.; Nakamae, H.; Gallagher, N.J.; Demirhan, E.; Hughes, T.; Kantarjian, H.M.; et al. Population pharmacokinetic and exposure-response analysis of nilotinib in patients with newly diagnosed Ph+ chronic myeloid leukemia in chronic phase. Eur. J. Clin. Pharmacol. 2012, 68, 723–733. [Google Scholar] [CrossRef] [PubMed] [Green Version]
- Miura, M.; Takahashi, N. Routine therapeutic drug monitoring of tyrosine kinase inhibitors by HPLC-UV or LC-MS/MS methods. Drug Metab. Pharmacokinet. 2016, 31, 12–20. [Google Scholar] [CrossRef]
- Pursche, S.; Ottmann, O.G.; Ehninger, G.; Schleyer, E. High-performance liquid chromatography method with ultraviolet detection for the quantification of the BCR-ABL inhibitor nilotinib (AMN107) in plasma, urine, culture medium and cell preparations. J. Chromatogr. B 2007, 852, 208–216. [Google Scholar] [CrossRef]
- Davies, A.; Hayes, A.K.; Knight, K.; Watmough, S.J.; Pirmohamed, M.; Clark, R.E. Simultaneous determination of nilotinib, imatinib and its main metabolite (CGP-74588) in human plasma by ultra-violet high performance liquid chromatography. Leuk. Res. 2010, 34, 702–707. [Google Scholar] [CrossRef]
- Miura, M.; Takahashi, N.; Sawada, K. High-performance liquid chromatography with solid-phase extraction for the quantitative determination of nilotinib in human plasma. Biomed. Chromatogr. 2010, 24, 789–793. [Google Scholar] [CrossRef] [PubMed]
- Yuki, M.; Yamakawa, Y.; Uchida, T.; Nambu, T.; Kawaguchi, T.; Hamada, A.; Saito, H. High-Performance Liquid Chromatographic Assay for the Determination of Nilotinib in Human Plasma. Biol. Pharm. Bull. 2011, 34, 1126–1128. [Google Scholar] [CrossRef] [Green Version]
- Pirro, E.; De Francia, S.; De Martino, F.; Racca, S.A.; Di Carlo, F.; Fava, C.; Ulisciani, S.; Cambrin, G.R.; Saglio, G. A New HPLC-UV Validated Method for Therapeutic Drug Monitoring of Tyrosine Kinase Inhibitors in Leukemic Patients. J. Chromatogr. Sci. 2011, 49, 753–757. [Google Scholar] [CrossRef] [PubMed] [Green Version]
- Nakahara, R.; Satho, Y.; Itoh, H. High-performance Liquid Chromatographic Ultraviolet Detection of Nilotinib in Human Plasma from Patients with Chronic Myelogenous Leukemia, and Comparison with Liquid Chromatography-Tandem Mass Spectrometry. J. Clin. Lab. Anal. 2016, 30, 1028–1030. [Google Scholar] [CrossRef] [PubMed] [Green Version]
- US Department of Health and Human Services. Food and Drug Administration Center for Drug Evaluation and Research (CDER). Analytical Procedures and Methods Validation for Drugs and Biologics. Available online: https://www.fda.gov/downloads/drugs/guidances/ucm386366.pdf (accessed on 20 January 2021).
- Validation of Analytical Procedures: Text and Methodology. ICH Topic Q2 (R1). CMP/ICH/381/95-ICH Q2 (R1). Available online: http://www.ema.europa.eu/docs/en_GB/document_library/Scientific_guideline/2009/09/WC500002662.pdf (accessed on 20 January 2021).
- Klümpen, H.-J.; Samer, C.F.; Mathijssen, R.H.; Schellens, J.H.; Gurney, H. Moving towards dose individualization of tyrosine kinase inhibitors. Cancer Treat. Rev. 2011, 37, 251–260. [Google Scholar] [CrossRef] [Green Version]
- Yu, H.; Steeghs, N.; Nijenhuis, C.M.; Schellens, J.H.M.; Beijnen, J.H.; Huitema, A.D.R. Practical Guidelines for Therapeutic Drug Monitoring of Anticancer Tyrosine Kinase Inhibitors: Focus on the Pharmacokinetic Targets. Clin. Pharm. 2014, 53, 305–325. [Google Scholar] [CrossRef] [PubMed]
- Verheijen, R.B.; Yu, H.; Schellens, J.H.; Beijnen, J.H.; Steeghs, N.; Huitema, A.D. Practical Recommendations for Therapeutic Drug Monitoring of Kinase Inhibitors in Oncology. Clin. Pharmacol. Ther. 2017, 102, 765–776. [Google Scholar] [CrossRef]
- Escudero-Ortiz, V.; Pérez-Ruixo, J.J.; Valenzuela, B. Development and validation of an HPLC-UV method for pazopanib quantification in human plasma and application to patients with cancer in routine clinical practice. Ther. Drug Monit. 2015, 37, 172–179. [Google Scholar] [CrossRef] [PubMed]
- Blanchet, B.; Billemont, B.; Cramard, J.; Benichou, A.; Chhun, S.; Harcouet, L.; Ropert, S.; Dauphin, A.; Goldwasser, F.; Tod, M. Validation of an HPLC-UV method for sorafenib determination in human plasma and application to cancer patients in routine clinical practice. J. Pharm. Biomed. Anal. 2009, 49, 1109–1114. [Google Scholar] [CrossRef]
- Haouala, A.; Zanolari, B.; Rochat, B.; Montemurro, M.; Zaman, K.; Duchosal, M.; Ris, H.; Leyvraz, S.; Widmer, N.; Decosterd, L. Therapeutic Drug Monitoring of the new targeted anticancer agents imatinib, nilotinib, dasatinib, sunitinib, sorafenib and lapatinib by LC tandem mass spectrometry. J. Chromatogr. B 2009, 877, 1982–1996. [Google Scholar] [CrossRef] [PubMed]
- Götze, L.; Hegele, A.; Metzelder, S.K.; Renz, H.; Nockher, W.A. Development and clinical application of a LC-MS/MS method for simultaneous determination of various tyrosine kinase inhibitors in human plasma. Clin. Chim. Acta 2012, 413, 143–149. [Google Scholar] [CrossRef] [PubMed]


| Linearity Equation, y = a + b · C | |||
|---|---|---|---|
| Day | a (×10−3) | b (×10−3) | r |
| 1 | −6.7 | 0.7 | 0.996 |
| 2 | −8.3 | 0.7 | 0.997 |
| 3 | −5.3 | 0.7 | 0.998 |
| Theoretical Concentration, (ng/mL) | Intraday * | Interday * | ||||
|---|---|---|---|---|---|---|
| Mean Observed Concentration (SD), (ng/mL) | Accuracy (MRE, %) | Precision (RSD, %) | Mean Observed Concentration (SD), (ng/mL) | Accuracy (MRE, %) | Precision (RSD, %) | |
| 125 | 120.3 (4.1) | 3.7 | 3.4 | 121.6 (3.2) | 2.7 | 2.6 |
| 250 | 275.6 (11.1) | 10.2 | 4.0 | 267.5 (10.5) | 7.0 | 3.9 |
| 900 | 866.9 (12.3) | 3.7 | 1.4 | 883.3 (18.4) | 1.8 | 2.1 |
| 5000 | 4705.8 (96.7) | 5.9 | 2.1 | 4791.4 (147.6) | 4.2 | 3.1 |
| Theoretical Concentration, (ng/mL) | Freeze–Thaw Stability * | Short-Term Stability with Light * | Short-Term Stability without Light * | |
|---|---|---|---|---|
| Cycle 1 | Cycle 2 | 8 h | 8 h | |
| 250 | −11.6 (1.2) | −9.3 (1.0) | 0.3 (13.2) | 14.1 (1.2) |
| 900 | −14.7 (3.8) | −116. (3.1) | 15.0 (1.6) | 2.8 (4.2) |
| 5000 | −14.2 (2.0) | −13.5 (2.5) | −2.6 (3.3) | −15.0 (6.2) |
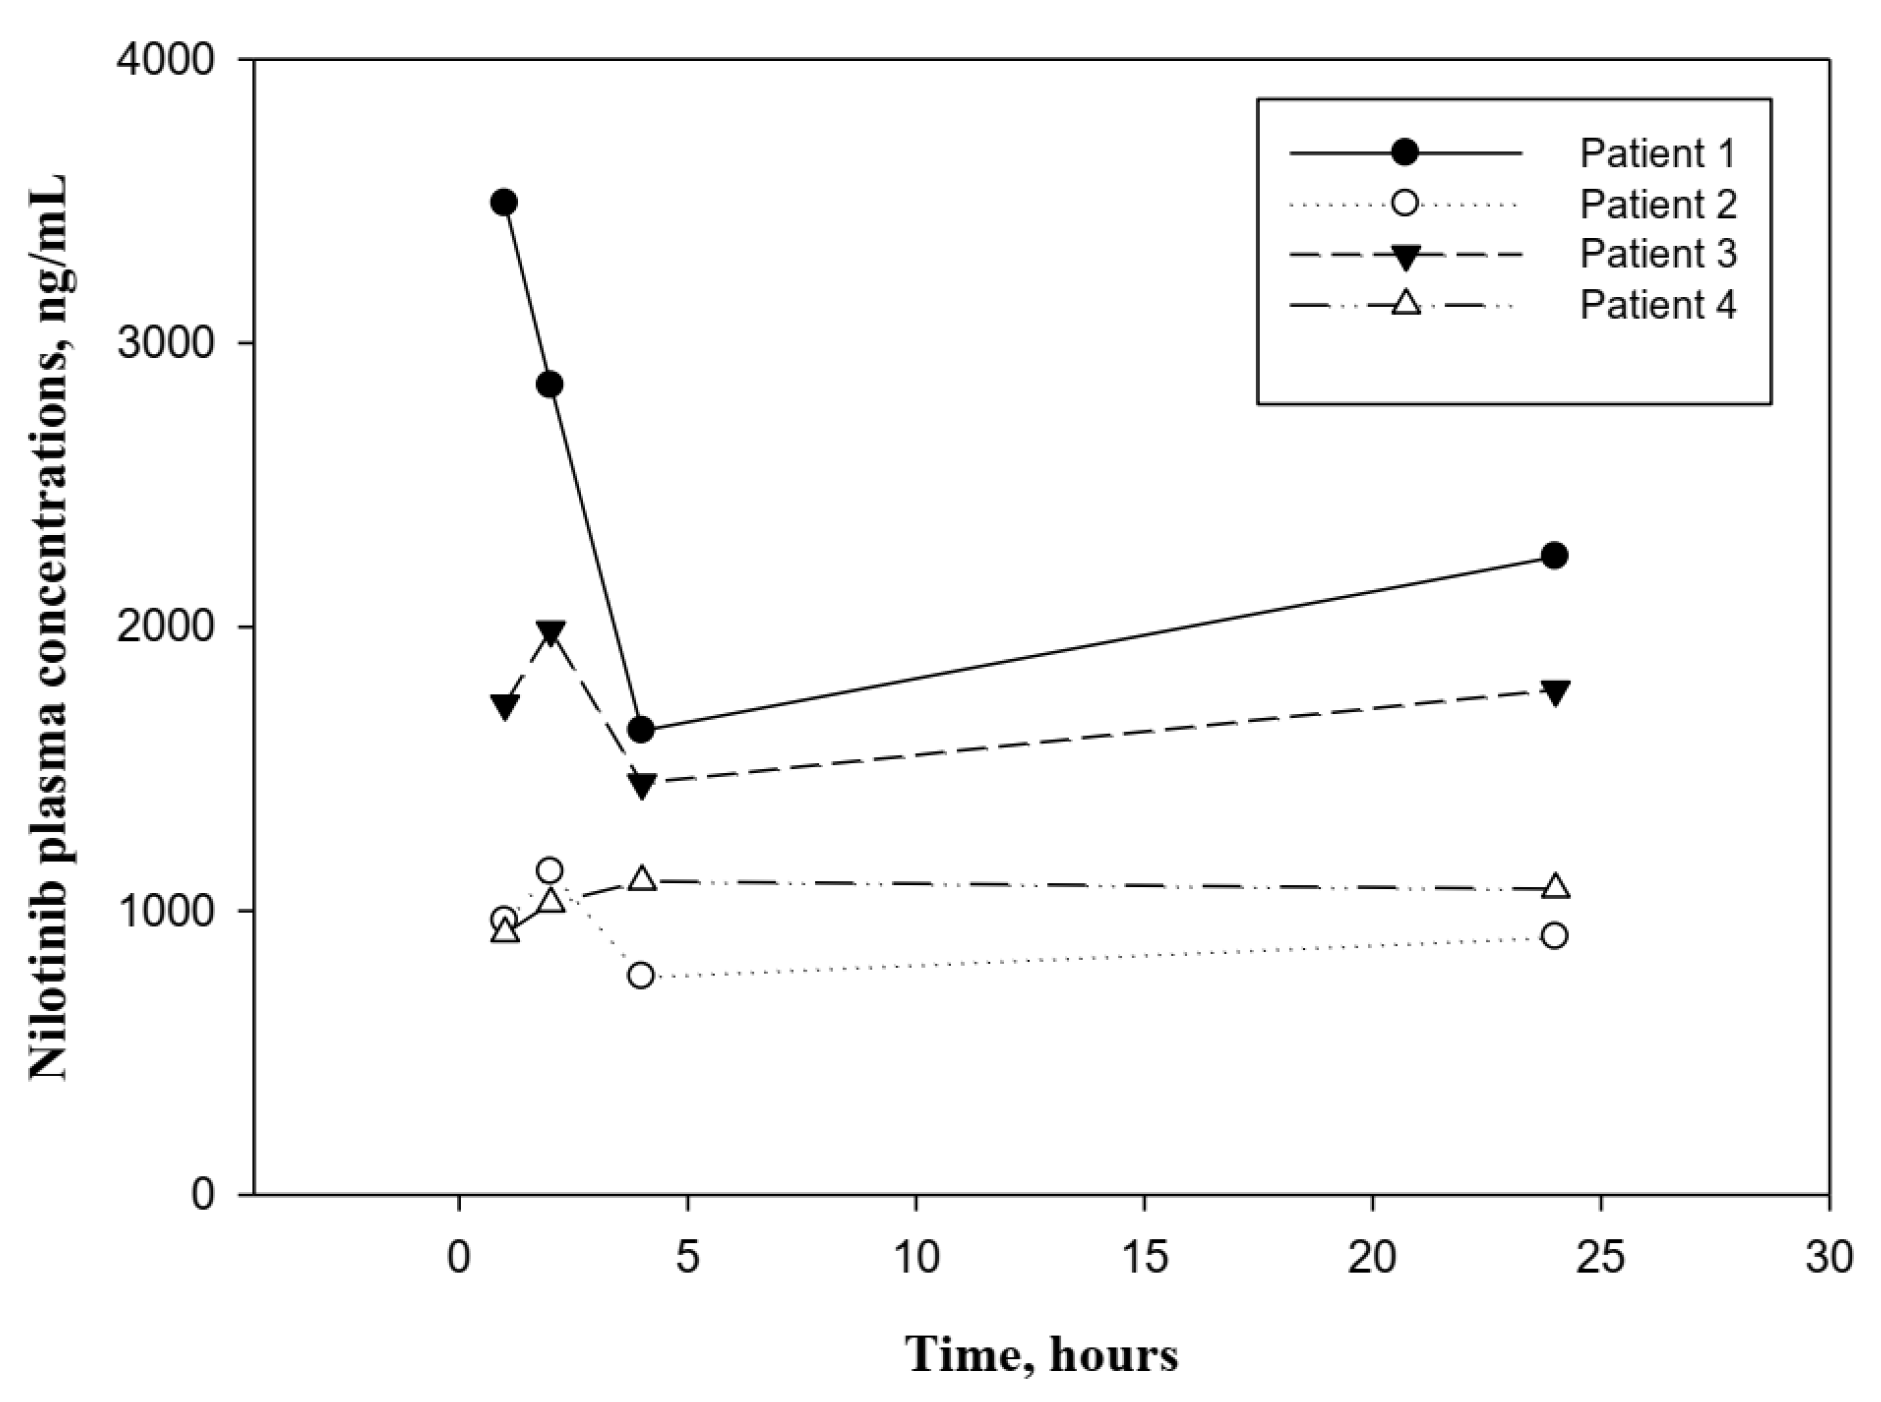
| Pharmacokinetics Parameters | Patient 1 | Patient 2 | Patient 3 | Patient 4 | Mean (SD) | CV (%) |
|---|---|---|---|---|---|---|
| Cmax (ng/mL) | 3491.4 | 1137.2 | 1988.4 | 1103.5 | 1930.1 (1118.5) | 58 |
| Cmin (ng/mL) | 1633.9 | 768.9 | 1450.3 | 920.7 | 1193.5 (414.7) | 35 |
| Tmax (h) | 1 | 2 | 2 | 4 | 2.3 (1.3) | 56 |
| AUC0–12 (ng·h/L) | 24.7 | 10.1 | 18.9 | 11.8 | 16.4 (6.7) | 42 |
| CL/F (L/h) | 2.8 | 1.9 | 0.6 | 5.7 | 2.8 (2.2) | 77 |
| t1/2 (h) | 25.1 | 69.3 | 187.4 | 30.7 | 78.1 (75.4) | 96 |
| Cmin | Cmax | |
|---|---|---|
| Leukocytes (×103/µL) | −0.9194 | −0.8439 |
| Neutrophils (×103/µL) | −0.0280 | 0.1043 |
| Platelet (×103/µL) | −0.6949 | −0.5802 |
| Haematocrit (%) | 0.0870 | 0.0096 |
| Haemaglobin (g/dL) | −0.0319 | −0.0818 |
| Serum bilirrubin (mg/dL) | −0.4013 | −0.3427 |
| Alkaline phosphatase (U/L) | 0.7497 | 0.7101 |
| AST (U/L) | −0.0833 | −0.2038 |
| ALT (U/L) | −0.3552 | −0.4533 |
| Serum creatinine (g/dL) | −0.1897 | −0.3482 |
Disclaimer/Publisher’s Note: The statements, opinions and data contained in all publications are solely those of the individual author(s) and contributor(s) and not of MDPI and/or the editor(s). MDPI and/or the editor(s) disclaim responsibility for any injury to people or property resulting from any ideas, methods, instructions or products referred to in the content. |
© 2023 by the authors. Licensee MDPI, Basel, Switzerland. This article is an open access article distributed under the terms and conditions of the Creative Commons Attribution (CC BY) license (https://creativecommons.org/licenses/by/4.0/).
Share and Cite
Escudero-Ortiz, V.; Rodríguez-Lucena, F.J.; Estan-Cerezo, G.; Mancheño-Maciá, E.; Conesa-García, V.; García-Monsalve, A.; Soriano-Irigaray, L.; Navarro-Ruiz, A. Therapeutic Drug Monitoring in Oncohematological Patients: A Fast and Accurate HPLC-UV Method for the Quantification of Nilotinib in Human Plasma and Its Clinical Application. Biomedicines 2023, 11, 947. https://doi.org/10.3390/biomedicines11030947
Escudero-Ortiz V, Rodríguez-Lucena FJ, Estan-Cerezo G, Mancheño-Maciá E, Conesa-García V, García-Monsalve A, Soriano-Irigaray L, Navarro-Ruiz A. Therapeutic Drug Monitoring in Oncohematological Patients: A Fast and Accurate HPLC-UV Method for the Quantification of Nilotinib in Human Plasma and Its Clinical Application. Biomedicines. 2023; 11(3):947. https://doi.org/10.3390/biomedicines11030947
Chicago/Turabian StyleEscudero-Ortiz, Vanesa, Francisco José Rodríguez-Lucena, Gabriel Estan-Cerezo, Esther Mancheño-Maciá, Venancio Conesa-García, Ana García-Monsalve, Leticia Soriano-Irigaray, and Andrés Navarro-Ruiz. 2023. "Therapeutic Drug Monitoring in Oncohematological Patients: A Fast and Accurate HPLC-UV Method for the Quantification of Nilotinib in Human Plasma and Its Clinical Application" Biomedicines 11, no. 3: 947. https://doi.org/10.3390/biomedicines11030947