
Optimal Selection of IFN-α-Inducible Genes to Determine Type I Interferon Signature Improves the Diagnosis of Systemic Lupus Erythematosus


Abstract
: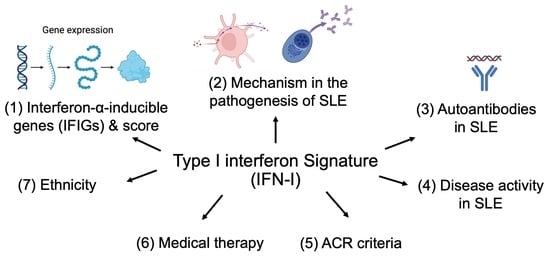
1. Introduction
2. Interferon-α-Inducible Genes (IFIGs) Used to Calculate Type I Interferon Signature
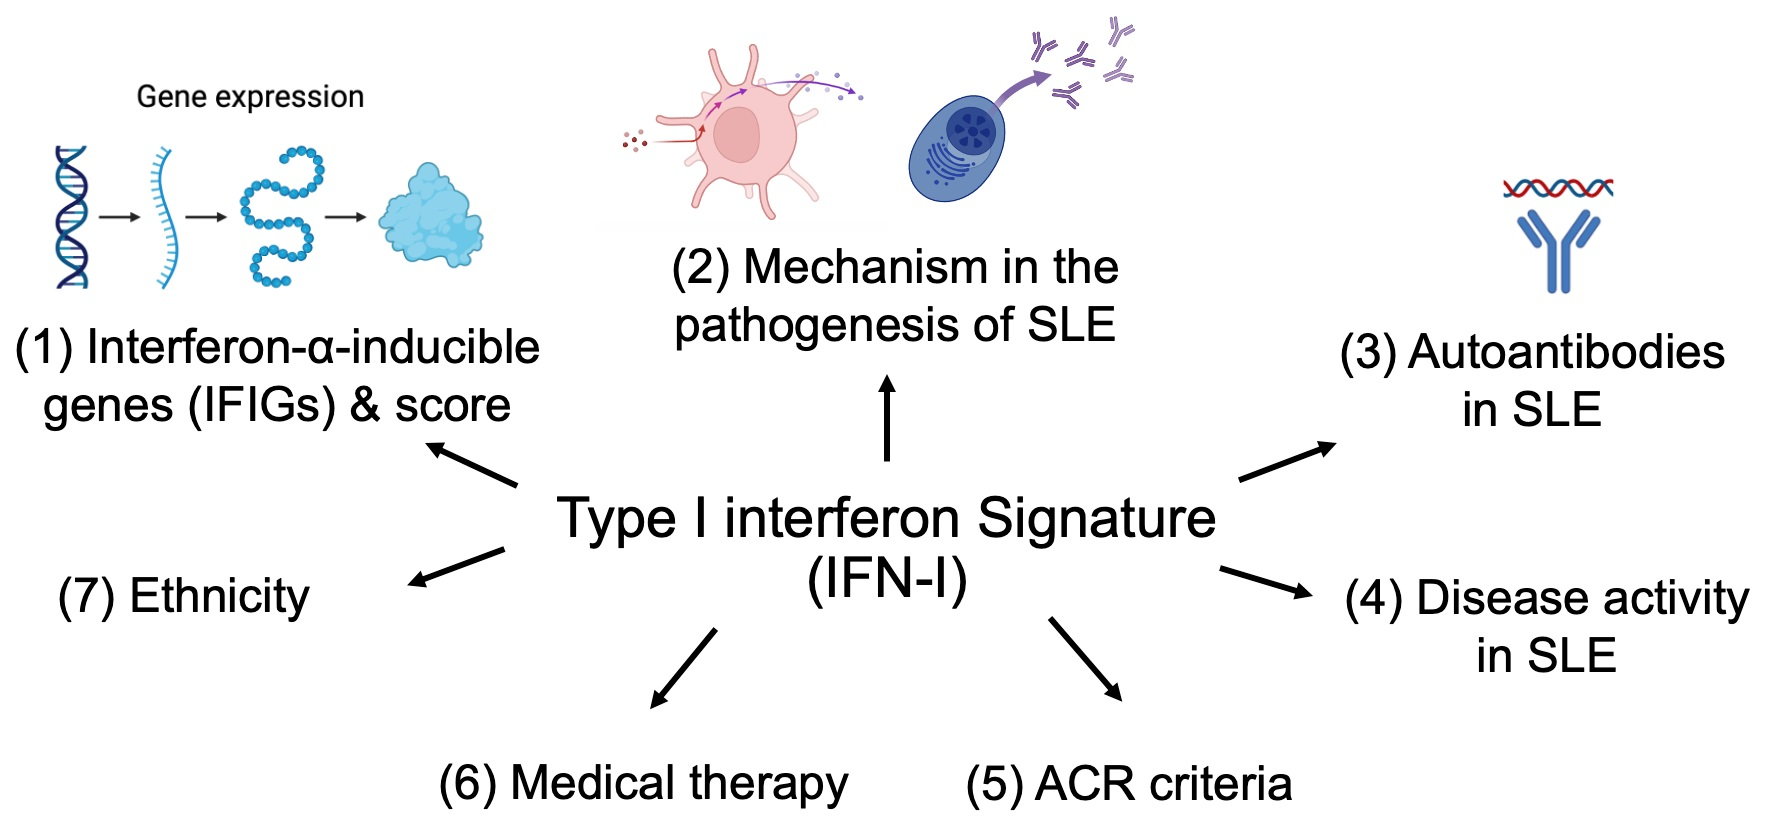
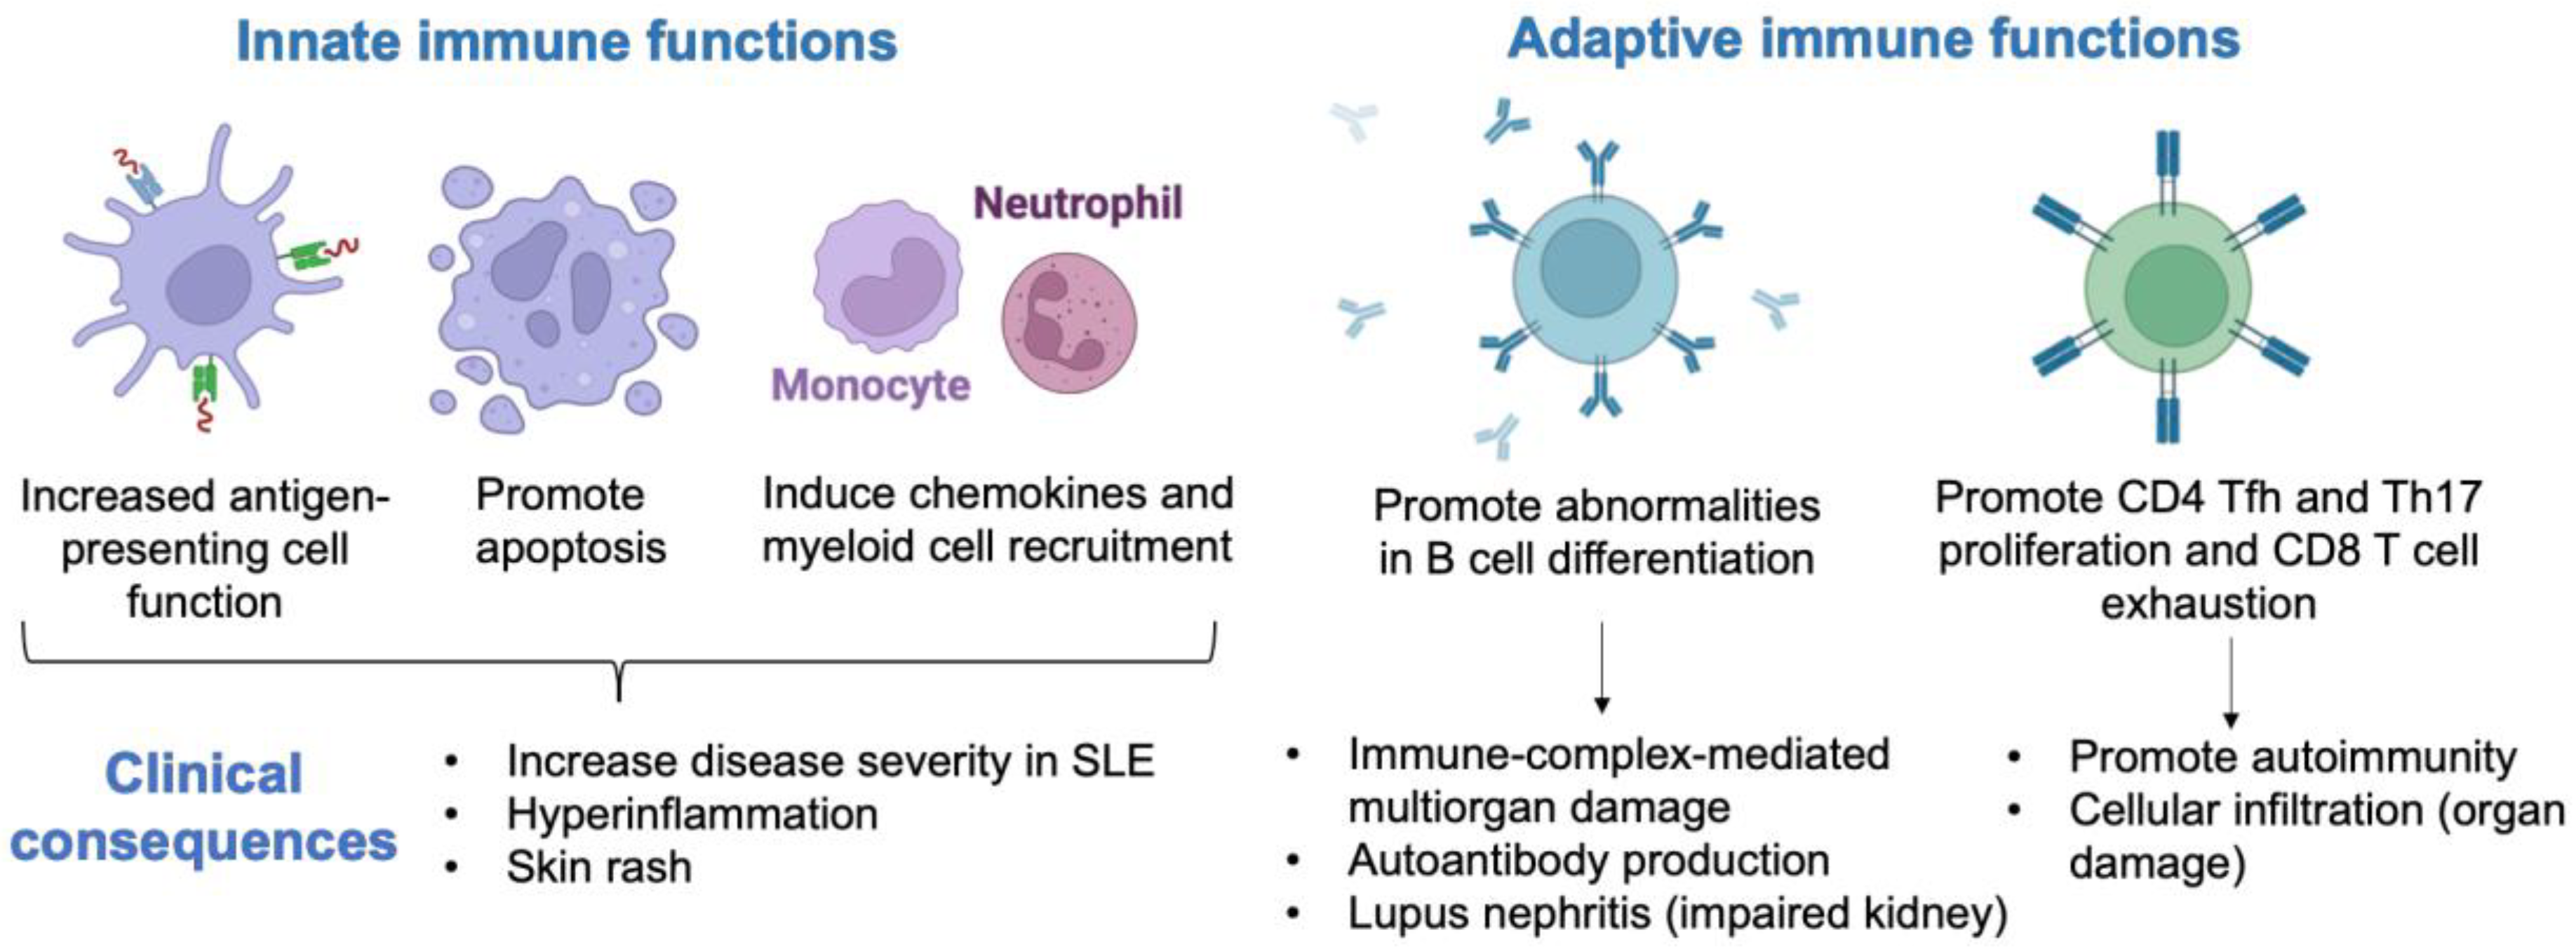
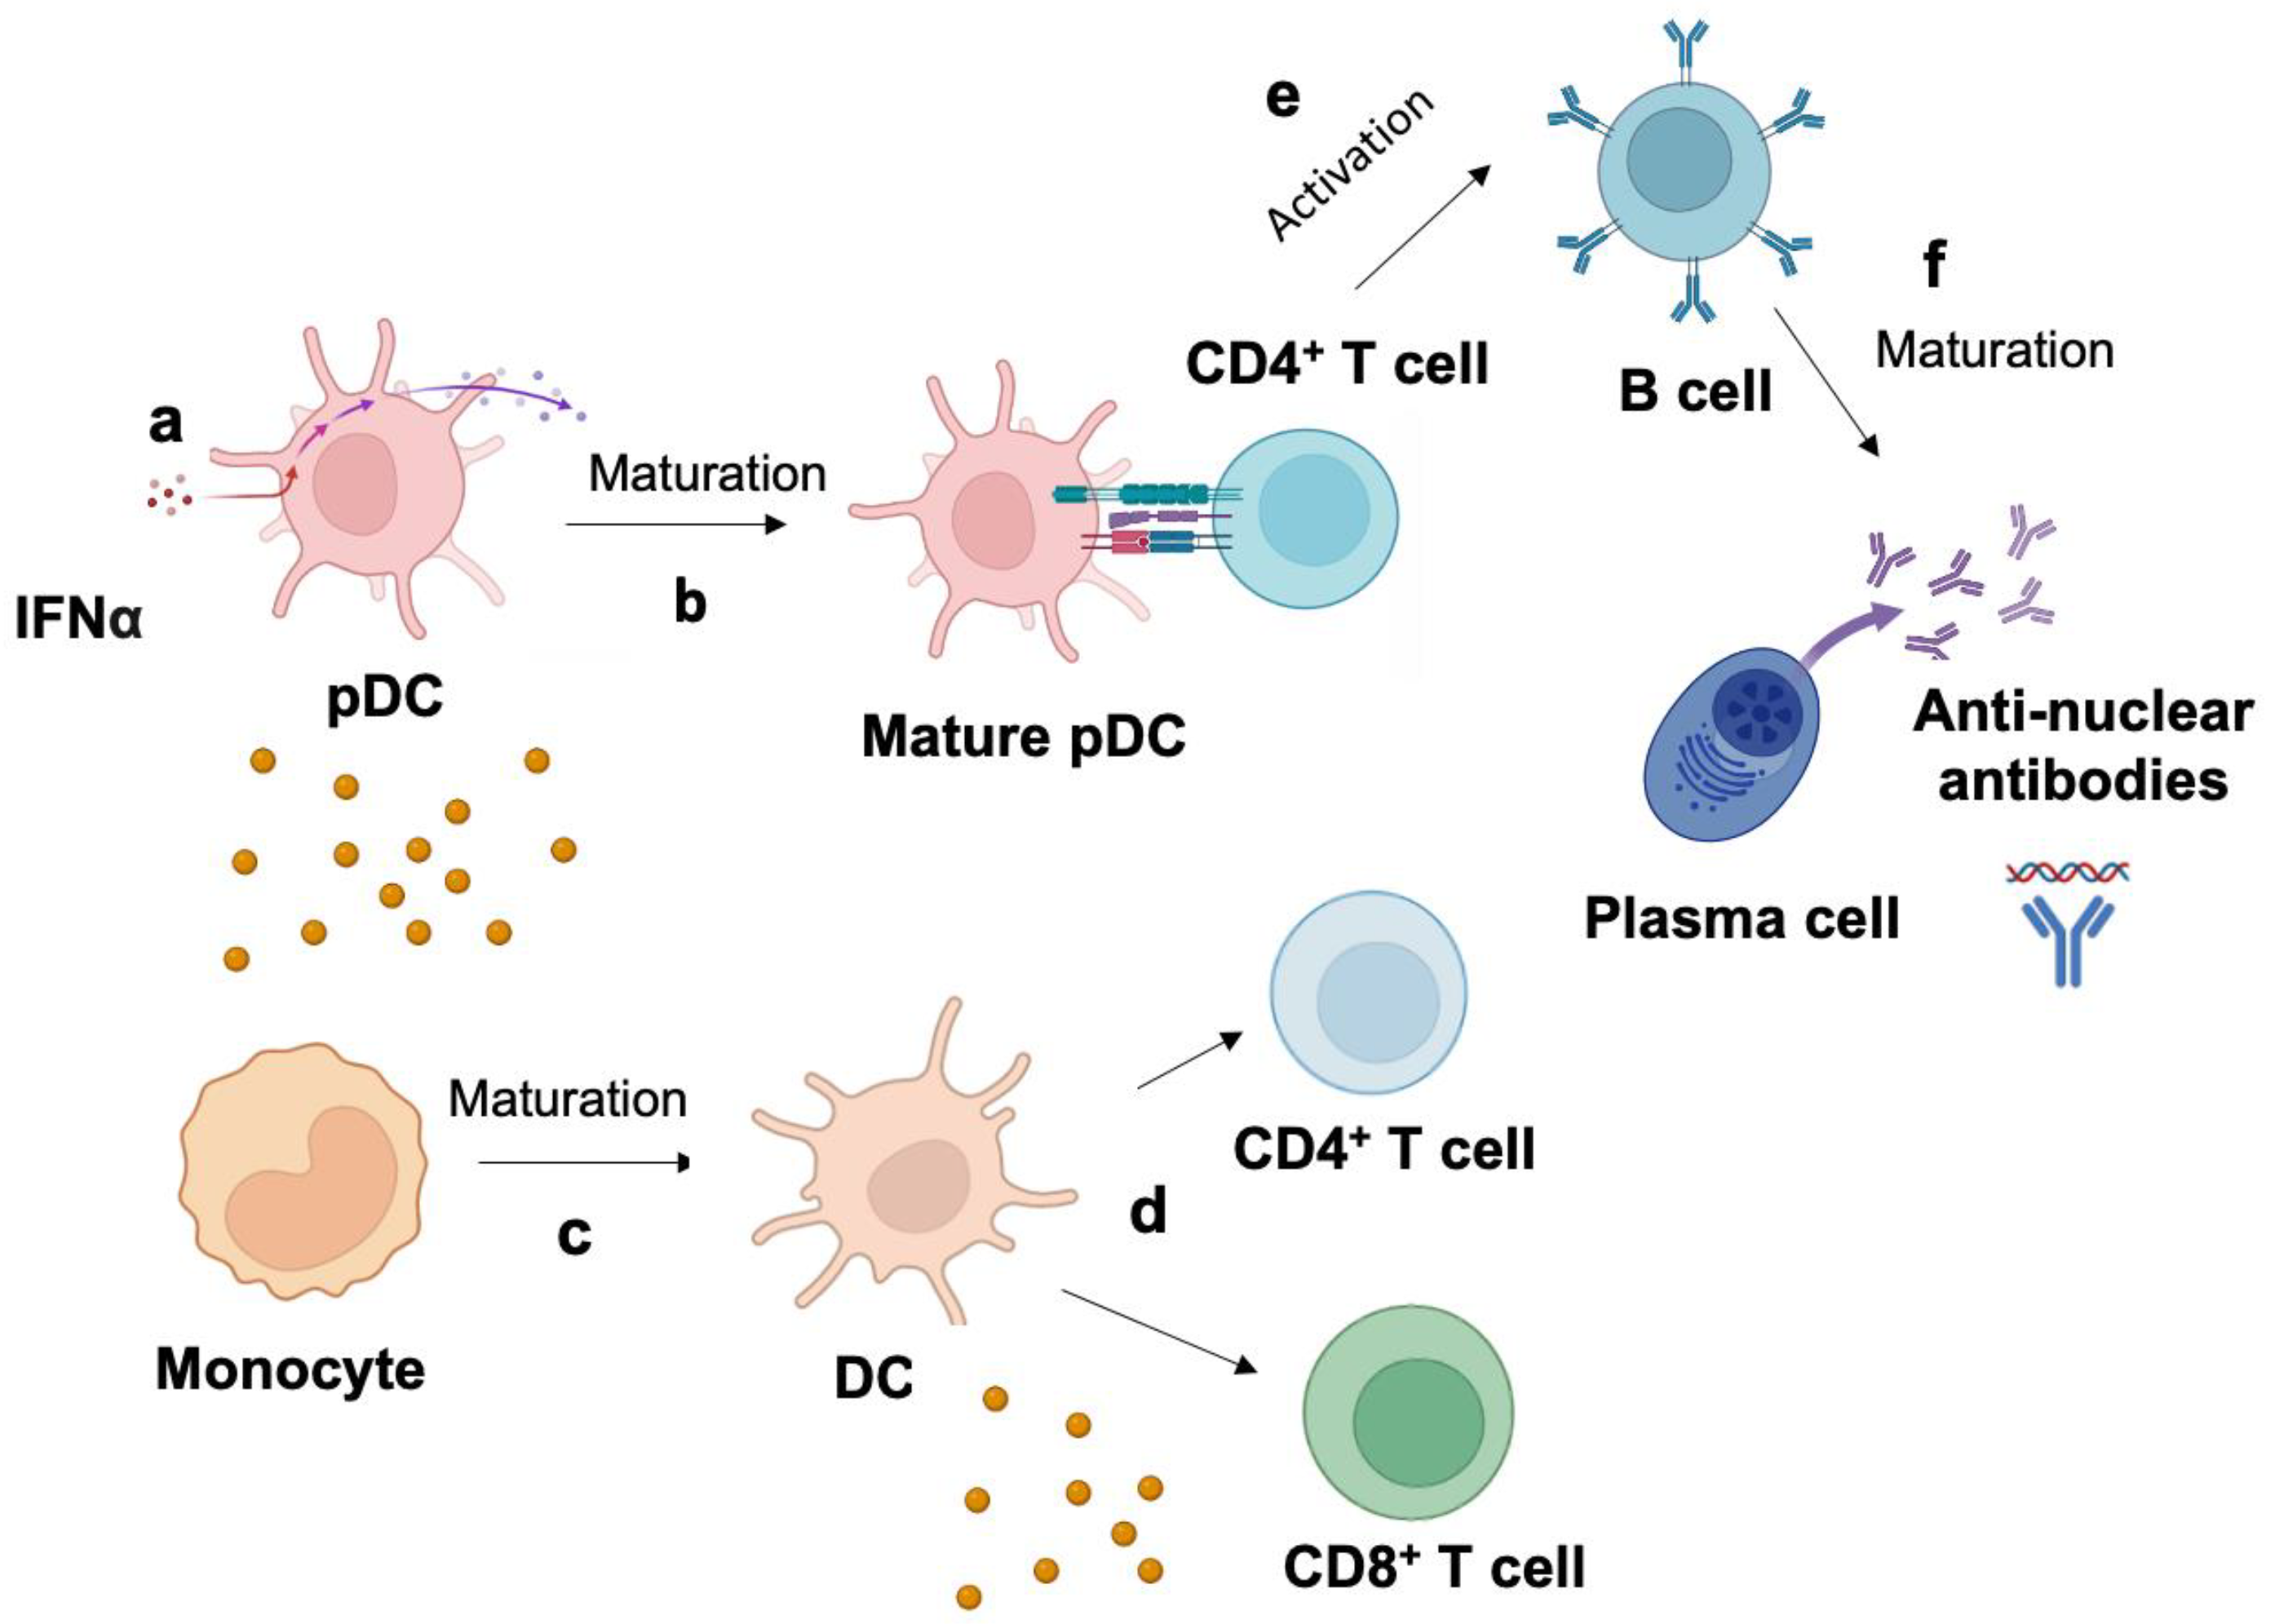
3. Mechanism of Type I Interferon Signature in the Pathogenesis of SLE
4. Higher Production of Autoantibodies in SLE with Elevated IFN-I Signature
5. Controversy between Disease Activity and Type I Interferon Signature in SLE
6. American College of Rheumatology (ACR) Criteria and Type I Interferon Signature
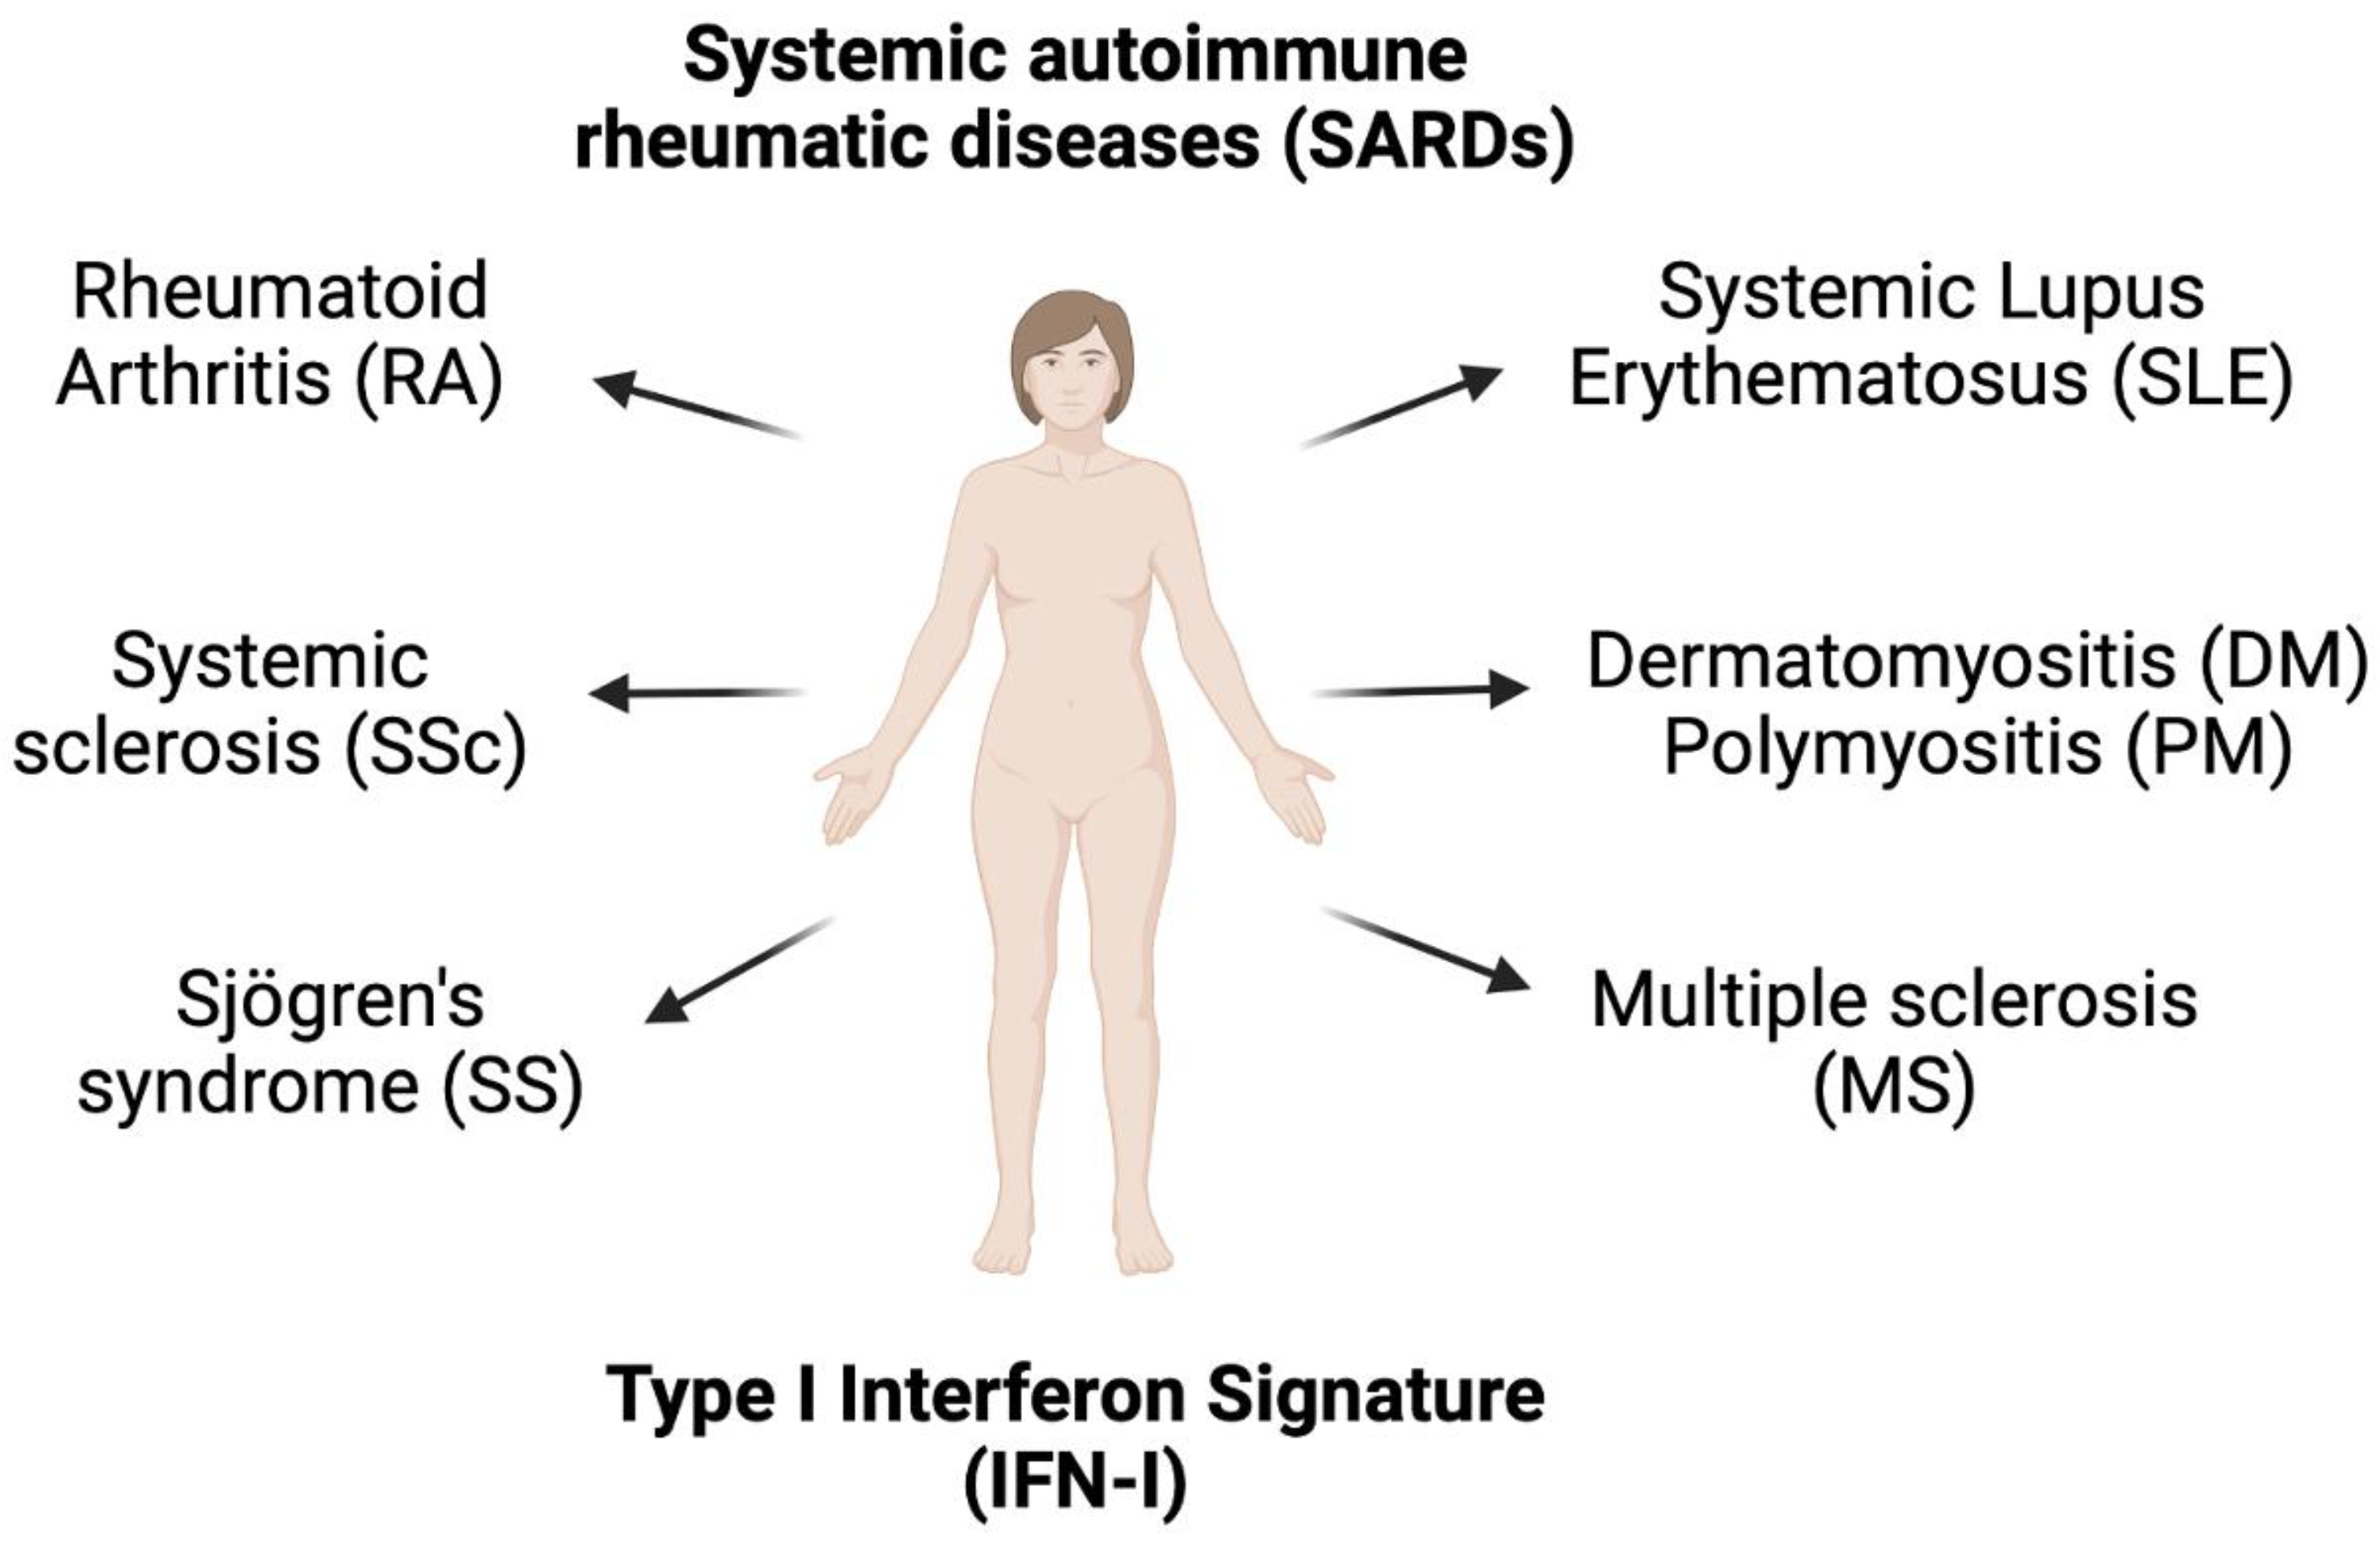
7. Type I Interferon Signature in other Autoimmune Diseases
8. Medical Therapy and Type I Interferon Signature
9. Ethnicity and Type I Interferon Signature
10. Conclusions
Funding
Institutional Review Board Statement
Informed Consent Statement
Data Availability Statement
Conflicts of Interest
References
- Bashal, F. Hematological disorders in patients with systemic lupus erythematosus. Open Rheumatol. J. 2013, 7, 87–95. [Google Scholar] [CrossRef] [PubMed] [Green Version]
- Fanouriakis, A.; Tziolos, N.; Bertsias, G.; Boumpas, D.T. Update οn the diagnosis and management of systemic lupus erythematosus. Ann. Rheum. Dis. 2021, 80, 14–25. [Google Scholar] [CrossRef] [PubMed]
- Crow, M.K. Interferon-alpha in systemic lupus erythematosus. Basis of disease pathogenesis. Elsevier 2011, 18, 307–320. [Google Scholar]
- Kirou, K.A.; Lee, C.; George, S.; Louca, K.; Peterson, M.G.E.; Crow, M.K. Activation of the interferon-α pathway identifies a subgroup of systemic lupus erythematosus patients with distinct serologic features and active disease. Arthritis Rheum. 2005, 52, 1491–1503. [Google Scholar] [CrossRef] [PubMed]
- Crow, M.K.; Olferiev, M.; Kirou, K.A. Type I interferons in autoimmune disease. Annu. Rev. Pathol. 2019, 14, 369–393. [Google Scholar] [CrossRef] [PubMed]
- Furie, R.; Khamashta, M.; Merrill, J.T.; Werth, V.P.; Kalunian, K.; Brohawn, P.; Illei, G.G.; Drappa, J.; Wang, L.; Yoo, S. Anifrolumab, an anti-interferon-α receptor monoclonal antibody, in moderate-to-severe systemic lupus erythematosus. Arthritis Rheum. 2017, 69, 376–386. [Google Scholar] [CrossRef] [PubMed] [Green Version]
- Becker, A.M.; Dao, K.H.; Han, B.K.; Kornu, R.; Lakhanpal, S.; Mobley, A.B.; Li, Q.Z.; Lian, Y.; Wu, T.; Reimold, A.M.; et al. SLE peripheral blood B cell, T cell and myeloid cell transcriptomes display unique profiles and each subset contributes to the interferon signature. PLoS ONE 2013, 8, e67003. [Google Scholar] [CrossRef]
- Ye, S. Protein interaction for an interferon-inducible systemic lupus associated gene, IFIT1. Rheumatology 2003, 42, 1155–1163. [Google Scholar] [CrossRef] [Green Version]
- Geiss, G.K.; Bumgarner, R.E.; Birditt, B.; Dahl, T.; Dowidar, N.; Dunaway, D.L.; Fell, H.P.; Ferree, S.; George, R.D.; Grogan, T.; et al. Direct multiplexed measurement of gene expression with color-coded probe pairs. Nat. Biotechnol. 2008, 26, 317–325. [Google Scholar] [CrossRef]
- Kim, H.; de Jesus, A.A.; Brooks, S.R.; Liu, Y.; Huang, Y.; VanTries, R.; Montealegre Sanchez, G.A.; Rotman, Y.; Gadina, M.; Goldbach-Mansky, R. Development of a Validated Interferon Score Using NanoString Technology. J. Interferon Cytokine Res. 2018, 38, 171–185. [Google Scholar] [CrossRef]
- Petri, M.; Singh, S.; Tesfasyone, H.; Dedrick, R.; Fry, K.; Lal, P.G.; Williams, G.; Bauer, J.W.; Gregersen, P.K.; Behrens, T.W.; et al. Longitudinal expression of type I interferon responsive genes in systemic lupus erythematosus. Lupus 2009, 18, 980–989. [Google Scholar] [CrossRef] [Green Version]
- MAQC Consortium. The MicroArray Quality Control (MAQC) project shows inter- and intraplatform reproducibility of gene expression measurements. Nat. Biotechnol. 2006, 24, 1151–1161. [Google Scholar] [CrossRef] [PubMed] [Green Version]
- Pescarmona, R.; Belot, A.; Villard, M.; Besson, L.; Lopez, J.; Mosnier, I.; Mathieu, A.L.; Lombard, C.; Garnier, L.; Frachette, C.; et al. Comparison of RT-qPCR and Nanostring in the measurement of blood interferon response for the diagnosis of type I interferonopathies. Cytokine 2019, 113, 446–452. [Google Scholar] [CrossRef]
- Mai, L.; Asaduzzaman, A.; Noamani, B.; Fortin, P.R.; Gladman, D.D.; Touma, Z.; Urowitz, M.B.; Wither, J. The baseline interferon signature predicts disease severity over the subsequent 5 years in systemic lupus erythematosus. Arthritis Res. Ther. 2021, 23, 29. [Google Scholar] [CrossRef] [PubMed]
- Kirou, K.A.; Lee, C.; George, S.; Louca, K.; Papagiannis, I.G.; Peterson, M.G.; Ly, N.; Woodward, R.N.; Fry, K.E.; Lau, A.Y.-H.; et al. Coordinate overexpression of interferon-?-induced genes in systemic lupus erythematosus. Arthritis Rheum 2004, 50, 3958–3967. [Google Scholar] [CrossRef] [PubMed]
- Feng, X.; Wu, H.; Grossman, J.M.; Hanvivadhanakul, P.; FitzGerald, J.D.; Park, G.S.; Dong, X.; Chen, W.; Kim, M.H.; Weng, H.H.; et al. Association of increased interferon-inducible gene expression with disease activity and lupus nephritis in patients with systemic lupus erythematosus. Arthritis Rheum. 2006, 54, 2951–2962. [Google Scholar] [CrossRef]
- Blanco, P.; Palucka, A.K.; Gill, M.; Pascual, V.; Banchereau, J. Induction of dendritic cell differentiation by IFN-α in systemic lupus erythematosus. Science 2001, 294, 1540–1543. [Google Scholar] [CrossRef] [PubMed]
- Rönnblom, L. Potential role of IFNα in adult lupus. Arthritis Res. Ther. 2010, 12, S3. [Google Scholar] [CrossRef] [Green Version]
- Hepburn, A.L.; Narat, S.; Mason, J.C. The management of peripheral blood cytopenias in systemic lupus erythematosus. Rheumatology 2010, 49, 2243–2254. [Google Scholar] [CrossRef] [Green Version]
- Bengtsson, A.A.; Sturfelt, G.; Truedsson, L.; Blomberg, J.; Alm, G.; Vallin, H.; Rönnblom, L. Activation of type I interferon system in systemic lupus erythematosus correlates with disease activity but not with antiretroviral antibodies. Lupus 2000, 9, 664–671. [Google Scholar] [CrossRef]
- Landolt-Marticorena, C.; Bonventi, G.; Lubovich, A.; Ferguson, C.; Unnithan, T.; Su, J.; Gladman, D.D.; Urowitz, M.; Fortin, P.R.; Wither, J. Lack of association between the interferon-α signature and longitudinal changes in disease activity in systemic lupus erythematosus. Ann. Rheum. Dis. 2009, 68, 1440–1446. [Google Scholar] [CrossRef] [PubMed]
- Niewold, T.B.; Hua, J.; Lehman, T.J.A.; Harley, J.B.; Crow, M.K. High serum IFN-α activity is a heritable risk factor for systemic lupus erythematosus. Genes Immun. 2007, 8, 492–502. [Google Scholar] [CrossRef] [PubMed]
- Cucak, H.; Yrlid, U.; Reizis, B.; Kalinke, U.; Johansson-Lindbom, B. Type I interferon signaling in dendritic cells stimulates the development of lymph-node-resident T follicular helper cells. Immunity 2009, 31, 491–501. [Google Scholar] [CrossRef] [PubMed] [Green Version]
- Zhang, T.; Du, Y.; Wu, Q.; Li, H.; Nguyen, T.; Gidley, G.; Duran, V.; Goldman, D.; Petri, M.; Mohan, C. Salivary anti-nuclear antibody (ANA) mirrors serum ANA in systemic lupus erythematosus. Arthritis Res. Ther. 2022, 24, 1–9. [Google Scholar] [CrossRef] [PubMed]
- Sawalha, A.H.; Harley, J.B. Antinuclear autoantibodies in systemic lupus erythematosus. Curr. Opin. Rheumatol. 2004, 16, 534–540. [Google Scholar] [CrossRef]
- Migliorini, P.; Baldini, C.; Rocchi, V.; Bombardieri, S. Anti-Sm and anti-RNP antibodies. Autoimmunity 2005, 38, 47–54. [Google Scholar] [CrossRef] [PubMed]
- Dema, B.; Charles, N. Autoantibodies in SLE: Specificities, Isotypes and Receptors. Antibodies 2016, 5, 2. [Google Scholar] [CrossRef] [Green Version]
- Li, Q.Z.; Zhou, J.; Lian, Y.; Zhang, B.; Branch, V.K.; Carr-Johnson, F.; Karp, D.R.; Mohan, C.; Wakeland, E.K.; Olsen, N.J. Interferon signature gene expression is correlated with autoantibody profiles in patients with incomplete lupus syndromes. Clin. Exp. Immunol. 2010, 159, 281–291. [Google Scholar] [CrossRef]
- Higgs, B.W.; Liu, Z.; White, B.; Zhu, W.; White, W.I.; Morehouse, C.; Brohawn, P.; Kiener, P.A.; Richman, L.; Fiorentino, D.; et al. Patients with systemic lupus erythematosus, myositis, rheumatoid arthritis and scleroderma share activation of a common type I interferon pathway. Ann. Rheum. Dis. 2011, 70, 2029–2036. [Google Scholar] [CrossRef]
- Pang, Y.; Yang, X.-W.; Song, Y.; Yu, F.; Zhao, M.-H. Anti-C1q autoantibodies from active lupus nephritis patients could inhibit the clearance of apoptotic cells and complement classical pathway activation mediated by C1q in vitro. Immunobiology 2014, 219, 980–989. [Google Scholar] [CrossRef]
- Izmirly, P.M.; Buyon, J.P.; Saxena, A. Neonatal lupus. Curr. Opin. Rheumatol. 2012, 24, 466–472. [Google Scholar] [CrossRef] [Green Version]
- Banchereau, R.; Hong, S.; Cantarel, B.; Baldwin, N.; Baisch, J.; Edens, M.; Cepika, A.M.; Acs, P.; Turner, J.; Anguiano, E.; et al. Personalized immunomonitoring uncovers molecular networks that stratify lupus patients. Cell 2016, 165, 551–565. [Google Scholar] [CrossRef] [PubMed] [Green Version]
- Chiche, L.; Jourde-Chiche, N.; Whalen, E.; Presnell, S.; Gersuk, V.; Dang, K.; Anguiano, E.; Quinn, C.; Burtey, S.; Berland, Y.; et al. Modular transcriptional repertoire analyses of adults with systemic lupus erythematosus reveal distinct type I and type II interferon signatures. Arthritis Rheumatol. 2014, 66, 1583–1595. [Google Scholar] [CrossRef] [PubMed]
- Bertolaccini, M.L.; Hughes, G.R.V.; Khamashta, M.A. Systemic Lupus Erythematosus. Diagnostic Criteria in Autoimmune Diseases; Humana Press: Totowa, NJ, USA, 2008; pp. 3–8. [Google Scholar]
- Weckerle, C.E.; Franek, B.S.; Kelly, J.A.; Kumabe, M.; Mikolaitis, R.A.; Green, S.L.; Utset, T.O.; Jolly, M.; James, J.A.; Harley, J.B.; et al. Network analysis of associations between serum interferon-α activity, autoantibodies, and clinical features in systemic lupus erythematosus. Arthritis Rheum. 2011, 63, 1044–1053. [Google Scholar] [CrossRef]
- Oke, V.; Gunnarsson, I.; Dorschner, J.; Eketjäll, S.; Zickert, A.; Niewold, T.B.; Svenungsson, E. High levels of circulating interferons type I, type II and type III associate with distinct clinical features of active systemic lupus erythematosus. Arthritis Res. Ther. 2019, 21, 107. [Google Scholar] [CrossRef] [PubMed] [Green Version]
- Reynier, F.; Petit, F.; Paye, M.; Turrel-Davin, F.; Imbert, P.E.; Hot, A.; Mougin, B.; Miossec, P. Importance of correlation between gene expression levels: Application to the type I interferon signature in rheumatoid arthritis. PLoS ONE 2011, 6, e24828. [Google Scholar] [CrossRef] [Green Version]
- Tan, F.K.; Zhou, X.; Mayes, M.D.; Gourh, P.; Guo, X.; Marcum, C.; Jin, L.; Arnett, F.C., Jr. Signatures of differentially regulated interferon gene expression and vasculotrophism in the peripheral blood cells of systemic sclerosis patients. Rheumatology 2006, 45, 694–702. [Google Scholar] [CrossRef] [Green Version]
- Lövgren, T.; Eloranta, M.-L.; Båve, U.; Alm, G.V.; Rönnblom, L. Induction of interferon-α production in plasmacytoid dendritic cells by immune complexes containing nucleic acid released by necrotic or late apoptotic cells and lupus IgG. Arthritis Rheum. 2004, 50, 1861–1872. [Google Scholar] [CrossRef]
- Båve, U.; Nordmark, G.; Lövgren, T.; Rönnelid, J.; Cajander, S.; Eloranta, M.L.; Alm, G.V.; Rönnblom, L. Activation of the type I interferon system in primary Sjögren’s syndrome: A possible etiopathogenic mechanism. Arthritis Rheum. 2005, 52, 1185–1195. [Google Scholar] [CrossRef] [PubMed]
- Greenberg, S.A.; Pinkus, J.L.; Pinkus, G.S.; Burleson, T.; Sanoudou, D.; Tawil, R.; Barohn, R.J.; Saperstein, D.S.; Briemberg, H.R.; Ericsson, M.; et al. Interferon-α/β-mediated innate immune mechanisms in dermatomyositis. Ann. Neurol. 2005, 57, 664–678. [Google Scholar] [CrossRef]
- Van Baarsen, L.G.M.; van der Pouw Kraan, T.C.T.M.; Kragt, J.J.; Baggen, J.M.C.; Rustenburg, F.; Hooper, T.; Meilof, J.F.; Fero, M.J.; Dijkstra, C.D.; Polman, C.H.; et al. A subtype of multiple sclerosis defined by an activated immune defense program. Genes Immun. 2006, 7, 522–531. [Google Scholar] [CrossRef] [Green Version]
- Van Der Pouw Kraan, T.C.T.M.; Wijbrandts, C.A.; Van Baarsen, L.G.M.; Voskuyl, A.E.; Rustenburg, F.; Baggen, J.M.; Ibrahim, S.M.; Fero, M.; Dijkmans, B.A.C.; Tak, P.P.; et al. Rheumatoid arthritis subtypes identified by genomic profiling of peripheral blood cells: Assignment of a type I interferon signature in a subpopulation of patients. Ann. Rheum. Dis. 2007, 66, 1008–1014. [Google Scholar] [CrossRef] [PubMed]
- Zhang, F.; Wei, K.; Slowikowski, K.; Fonseka, C.Y.; Rao, D.A.; Kelly, S.; Goodman, S.M.; Tabechian, D.; Hughes, L.B.; Salomon-Escoto, K.; et al. Defining inflammatory cell states in rheumatoid arthritis joint synovial tissues by integrating single-cell transcriptomics and mass cytometry. Nat. Immunol. 2019, 20, 928–942. [Google Scholar] [CrossRef] [PubMed]
- Lübbers, J.; Brink, M.; van de Stadt, L.A.; Vosslamber, S.; Wesseling, J.G.; van Schaardenburg, D.; Rantapää-Dahlqvist, S.; Verweij, C.L. The type I IFN signature as a biomarker of preclinical rheumatoid arthritis. Ann. Rheum. Dis. 2013, 72, 776–780. [Google Scholar] [CrossRef] [PubMed]
- Sanayama, Y.; Ikeda, K.; Saito, Y.; Kagami, S.I.; Yamagata, M.; Furuta, S.; Kashiwakuma, D.; Iwamoto, I.; Umibe, T.; Nawata, Y.; et al. Prediction of therapeutic responses to tocilizumab in patients with rheumatoid arthritis: Biomarkers identified by analysis of gene expression in peripheral blood mononuclear cells using genome-wide DNA microarray. Arthritis Rheumatol. 2014, 66, 1421–1431. [Google Scholar] [CrossRef] [PubMed] [Green Version]
- Raterman, H.G.; Vosslamber, S.; de Ridder, S.; Nurmohamed, M.T.; Lems, W.F.; Boers, M.; van de Wiel, M.; Dijkmans, B.A.; Verweij, C.L.; Voskuyl, A.E. Interferon type I signature may predict non response upon rituximab in rheumatoid arthritis patients. Arthritis Res. Ther. 2012, 14, R95. [Google Scholar] [CrossRef] [Green Version]
- Assassi, S.; Mayes, M.D.; Arnett, F.C.; Gourh, P.; Agarwal, S.K.; McNearney, T.A.; Chaussabel, D.; Oommen, N.; Fischbach, M.; Shah, K.R.; et al. Systemic sclerosis and lupus: Points in an interferon-mediated continuum. Arthritis Rheum. 2010, 62, 589–598. [Google Scholar] [CrossRef] [Green Version]
- Wither, J.; Johnson, S.R.; Liu, T.; Noamani, B.; Bonilla, D.; Lisnevskaia, L.; Silverman, E.; Bookman, A.; Landolt-Marticorena, C. Presence of an interferon signature in individuals who are anti-nuclear antibody positive lacking a systemic autoimmune rheumatic disease diagnosis. Arthritis Res. Ther. 2017, 19, 41. [Google Scholar] [CrossRef] [Green Version]
- Fox, R.I. Sjögren’s syndrome. Lancet 2005, 366, 321–331. [Google Scholar] [CrossRef]
- Emamian, E.S.; Leon, J.M.; Lessard, C.J.; Grandits, M.; Baechler, E.C.; Gaffney, P.M.; Segal, B.; Rhodus, N.L.; Moser, K.L. Peripheral blood gene expression profiling in Sjögren’s syndrome. Genes Immun. 2009, 10, 285–296. [Google Scholar] [CrossRef]
- Dalakas, M.C.; Hohlfeld, R. Polymyositis and dermatomyositis. Lancet 2003, 362, 971–982. [Google Scholar] [CrossRef] [PubMed]
- Chieux, V.; Chehadeh, W.; Hautecoeur, P.; Harvey, J.; Wattré, P.; Hober, D. Increased levels of antiviral MxA protein in peripheral blood of patients with A chronic disease of unknown etiology. J. Med. Virol. 2001, 65, 301–308. [Google Scholar] [CrossRef]
- Kyogoku, C.; Smiljanovic, B.; Grün, J.R.; Biesen, R.; Schulte-Wrede, U.; Häupl, T.; Hiepe, F.; Alexander, T.; Radbruch, A.; Grützkau, A. Cell-specific type I IFN signatures in autoimmunity and viral infection: What makes the difference? PLoS ONE 2013, 8, e83776. [Google Scholar] [CrossRef] [PubMed] [Green Version]
- Lee, J.; Chuang, T.H.; Redecke, V.; She, L.; Pitha, P.M.; Carson, D.A.; Raz, E.; Cottam, H.B. Molecular basis for the immunostimulatory activity of guanine nucleoside analogs: Activation of Toll-like receptor 7. Proc. Nat. Acad. Sci. USA 2003, 100, 6646–6651. [Google Scholar] [CrossRef] [PubMed] [Green Version]
- Shodell, M.; Shah, K.; Siegal, F.P. Circulating human plasmacytoid dendritic cells are highly sensitive to corticosteroid administration. Lupus 2003, 12, 222–230. [Google Scholar] [CrossRef]
- Northcott, M.; Jones, S.; Koelmeyer, R.; Bonin, J.; Vincent, F.; Kandane-Rathnayake, R.; Hoi, A.; Morand, E. Type 1 interferon status in systemic lupus erythematosus: A longitudinal analysis. Lupus Sci. Med. 2022, 9, e000625. [Google Scholar] [CrossRef]
- Dall’Era, M.C. Type I interferon correlates with serological and clinical manifestations of SLE. Ann. Rheum. Dis. 2005, 64, 1692–1697. [Google Scholar] [CrossRef] [PubMed]


| Gene Symbol | Entrez Gene Name | Subcellular Locations 1 | SLE Subsets |
|---|---|---|---|
| IFI27 | Interferon alpha-inducible protein 27 | Nucleus, mitochondrion | myeloid cell, T cell |
| IFI44L | Interferon-induced protein 44-like | Cytosol, nucleus | myeloid cell, T cell, B cell |
| IFI44 | Interferon-induced protein 44 | Nucleus, mitochondrion | myeloid cell, T cell, B cell |
| RSAD2 | Radical S-adenosyl methionine domain containing 2 | Endoplasmic reticulum, mitochondrion | myeloid cell, T cell, B cell |
| IFIT1 | Interferon-induced protein with tetratricopeptide repeats 3 | Cytosol | myeloid cell, T cell |
| LY6E | Lymphocyte antigen 6 complex, locus E | Extracellular, plasma membrane | T cell |
| EPSTI1 | Epithelial stromal interaction 1 | Cytosol | unknown |
| OAS3 | 2′-5′-oligoadenylate synthetase 3 | Cytosol, nucleus, plasma membrane | myeloid cell, T cell, B cell |
| OAS1 | 2′-5′-oligoadenylate synthetase 1 | Cytosol, nucleus | T cells |
| ISG15 | ISG15 ubiquitin-like modifier | Cytosol, nucleus, extracellular | myeloid cell, T cell, B cell |
| PRKR | Platelet-activating factor receptor | Nucleus, extracellular | unknown |
| SIGLEC1 | Sialic acid binding Ig like lectin 1 | Extracellular, plasma membrane, endosome | myeloid cells |
| MX1 | Myxovirus (influenza virus) resistance 1 | nucleus | myeloid cell, T cell, B cell |
| HERC5 | Hect domain and RLD 5 | cytoplasm | myeloid cells |
| Antibodies 1 | Frequency in SLE (%) | Association with IFN-I | Clinical Outcomes | Association with Disease Activity |
|---|---|---|---|---|
| ANA IgG | 95 | yes | Autoimmune disease | no |
| Anti-dsDNA IgG | 50–60 | yes | LN, skin, cerebral | yes |
| Anti-Smith IgG | 20–40 | yes | Renal, neurologic, vasculitis disorders | no |
| Anti-RNP IgG | 23–40 | yes | Raynaud phenomenon, myositis | yes |
| Anti-Rib-P IgG | 15 | yes | LN, autoimmune hepatitis | no |
| Anti-La/SSB IgG | 30–40 | yes | LN, skin disease | yes |
| Anti-Ro/SSA IgG | 12–20 | yes | Subcutaneous lupus, neonatal lupus | no |
| Anti-C1q IgG | 20–50 | no | LN | yes |
Disclaimer/Publisher’s Note: The statements, opinions and data contained in all publications are solely those of the individual author(s) and contributor(s) and not of MDPI and/or the editor(s). MDPI and/or the editor(s) disclaim responsibility for any injury to people or property resulting from any ideas, methods, instructions or products referred to in the content. |
© 2023 by the author. Licensee MDPI, Basel, Switzerland. This article is an open access article distributed under the terms and conditions of the Creative Commons Attribution (CC BY) license (https://creativecommons.org/licenses/by/4.0/).
Share and Cite
Demers-Mathieu, V. Optimal Selection of IFN-α-Inducible Genes to Determine Type I Interferon Signature Improves the Diagnosis of Systemic Lupus Erythematosus. Biomedicines 2023, 11, 864. https://doi.org/10.3390/biomedicines11030864
Demers-Mathieu V. Optimal Selection of IFN-α-Inducible Genes to Determine Type I Interferon Signature Improves the Diagnosis of Systemic Lupus Erythematosus. Biomedicines. 2023; 11(3):864. https://doi.org/10.3390/biomedicines11030864
Chicago/Turabian StyleDemers-Mathieu, Veronique. 2023. "Optimal Selection of IFN-α-Inducible Genes to Determine Type I Interferon Signature Improves the Diagnosis of Systemic Lupus Erythematosus" Biomedicines 11, no. 3: 864. https://doi.org/10.3390/biomedicines11030864