Article

Developing Models to Predict BRAFV600E and RAS Mutational Status in Papillary Thyroid Carcinoma Using Clinicopathological Features and pERK1/2 Immunohistochemistry Expression

by
Agnes Stephanie Harahap
1,2,3,
Imam Subekti
4,
Sonar Soni Panigoro
5,
Asmarinah
6,
Lisnawati
1,
Retno Asti Werdhani
7,
Hasrayati Agustina
8,
Dina Khoirunnisa
1,
Mutiah Mutmainnah
1,
Fajar Lamhot Gultom
9,10,
Abdillah Hasbi Assadyk
11 and
Maria Francisca Ham
1,2,*
1
Department of Anatomical Pathology, Faculty of Medicine, Universitas Indonesia, Dr. Cipto Mangunkusumo Hospital, Jakarta 10430, Indonesia
2
Human Cancer Research Center-Indonesian Medical Education and Research Institute, Faculty of Medicine, Universitas Indonesia, Jakarta 10430, Indonesia
3
Doctoral Program in Medical Sciences, Faculty of Medicine, Universitas Indonesia, Jakarta 10430, Indonesia
4
Department of Internal Medicine, Faculty of Medicine, Universitas Indonesia, Dr. Cipto Mangunkusumo Hospital, Jakarta 10430, Indonesia
5
Department of Surgery, Faculty of Medicine, Universitas Indonesia, Dr. Cipto Mangunkusumo Hospital, Jakarta 10430, Indonesia
6
Department of Medical Biology, Faculty of Medicine, Universitas Indonesia, Dr. Cipto Mangunkusumo Hospital, Jakarta 10430, Indonesia
7
Department of Community Medicine, Faculty of Medicine, Universitas Indonesia, Jakarta 10310, Indonesia
8
Department of Anatomical Pathology, Faculty of Medicine, Universitas Padjadjaran, Hasan Sadikin General Hospital, Bandung 40161, Indonesia
9
Department of Anatomical Pathology, MRCCC Siloam Hospital, Jakarta 12930, Indonesia
10
Department of Anatomical Pathology, Faculty of Medicine, Universitas Kristen Indonesia, Jakarta 13630, Indonesia
11
Department of Otorhinolaryngology, Head and Neck Surgery, Harapan Kita National Women and Children Health Center, Jakarta 11420, Indonesia
*
Author to whom correspondence should be addressed.
Biomedicines 2023, 11(10), 2803; https://doi.org/10.3390/biomedicines11102803
Submission received: 9 September 2023 / Revised: 10 October 2023 / Accepted: 13 October 2023 / Published: 16 October 2023
(This article belongs to the Special Issue Thyroid Cancer: From Biology to Therapeutic Opportunities)

Abstract

:
The Cancer Genome Atlas (TCGA) has classified papillary thyroid carcinoma (PTC) into indolent RAS-like and aggressive BRAF-like based on its distinct driver gene mutations. This retrospective study aimed to assess clinicopathology and pERK1/2 expression variations between BRAF-like and RAS-like PTCs and establish predictive models for BRAFV600E and RAS-mutated PTCs. A total of 222 PTCs underwent immunohistochemistry staining to assess pERK1/2 expression and Sanger sequencing to analyze the BRAF and RAS genes. Multivariate logistic regression was employed to develop prediction models. Independent predictors of the BRAFV600E mutation include a nuclear score of 3, the absence of capsules, an aggressive histology subtype, and pERK1/2 levels exceeding 10% (X2 = 0.128, p > 0.05, AUC = 0.734, p < 0.001). The RAS mutation predictive model includes follicular histology subtype and pERK1/2 expression > 10% (X2 = 0.174, p > 0.05, AUC = 0.8, p < 0.001). We propose using the prediction model concurrently with four potential combination group outcomes. PTC cases included in a combination of the low-BRAFV600E-scoring group and high-RAS-scoring group are categorized as RAS-like (adjOR = 4.857, p = 0.01, 95% CI = 1.470–16.049). PTCs included in a combination of the high-BRAFV600E-scoring group and low-RAS-scoring group are categorized as BRAF-like PTCs (adjOR = 3.091, p = 0.001, 95% CI = 1.594–5.995). The different prediction models indicate variations in biological behavior between BRAF-like and RAS-like PTCs.

1. Introduction

Thyroid carcinomas are among the most prevalent malignancies of the endocrine system, with a notable rise in incidence over the last few decades [1]. The emergence of well-differentiated thyroid tumors such as papillary thyroid carcinoma (PTC) and follicular thyroid carcinoma (FTC) has been linked to alterations in various genes, including BRAF, RAS, and RET, and recently discovered gene fusions, such as EIFIAX, RET, NTRK1/3, ALK, PAX8-PPARG, RGADA, FGR2, and LTK [2]. PTC, which constitutes 80–85% of overall thyroid carcinoma cases, has particularly received an advanced exploration of its genomic landscape [3]. BRAFV600E and RAS mutations are the two most prevalent gene mutations detected in PTC, with rates of 28–83% [4,5] and 11.5–20% [3,6,7], respectively. Being mutually exclusive, these driver gene mutations ultimately lead to the same incongruous activation of the mitogen-activated protein kinase (MAPK) pathway [8]. This pathway involves the sequential activation and phosphorylation of RAS, RAF, MEK, and ERK, which are important in the regulation of cellular growth and apoptosis (Figure 1). Dysregulation of the gene associated with this pathway can affect cellular function and promote tumorigenesis. Elevated pERK1/2 expression, detected through immunohistochemistry staining or Western blot analysis, has been considered a proxy indicator for heightened MAPK pathway activity in various malignancies [9]. Interestingly, the expression of pERK1/2 has reportedly differed between BRAF-mutated and RAS-mutated tumors, with the former being more elevated [2]. In addition, RAS-mutated PTC demonstrates concurrent activation of P13K/AKT signaling as well as MAPK activation [2]. These signaling differences result in distinct phenotypes of PTCs, which are characterized by varied clinical and histopathological findings.
Among several BRAF mutations that have been identified in PTC, BRAFV600E constitutes the most cases. This T1799A point mutation results in the replacement of valine with glutamate and has emerged as a significant clinical determinant due to its association with heightened disease aggressiveness [10]. PTC tumors typically display an inert behavior, with a considerable proportion of patients attaining a survival rate of ten years [11]. However, tumors harboring BRAFV600E were associated with increased mortality rates, higher rates of recurrence, and resistance to radioiodine treatment [12,13]. Several studies have also linked this mutation to various aggressive pathology features, such as perithyroidal extension, node metastases, and advanced clinical stage [14,15,16]. In contrast to the BRAFV600E mutation, tumors possessing the RAS mutation were associated with less aggressive pathology characteristics, involving a follicular histology subtype [12], encapsulated tumors [17], minimal disease invasion [15,18], and lower risk of recurrence [12]. Among the three isoforms of the RAS gene, NRAS is the most prevalent gene mutation and is closely related to PTC [19]. While it is less common in North American and European populations, the RAS mutation is reported more frequently in the Asian population [20].
A recent discovery by The Cancer Genome Atlas (TCGA) has been able to classify PTC based on its two major driver gene mutations, which are BRAF-like and RAS-like tumors [2]. Identifying PTCs into BRAF-like and RAS-like tumors during diagnostic workup is essential, not only for determining the most precise and targeted treatment but also to comprehend the biological behavior between the two. Hence, this study aimed to explore the differences between BRAF-like and RAS-like tumors concerning clinicopathology and pERK1/2 expression and further establish predictive models for BRAFV600E and RAS mutations in PTC.

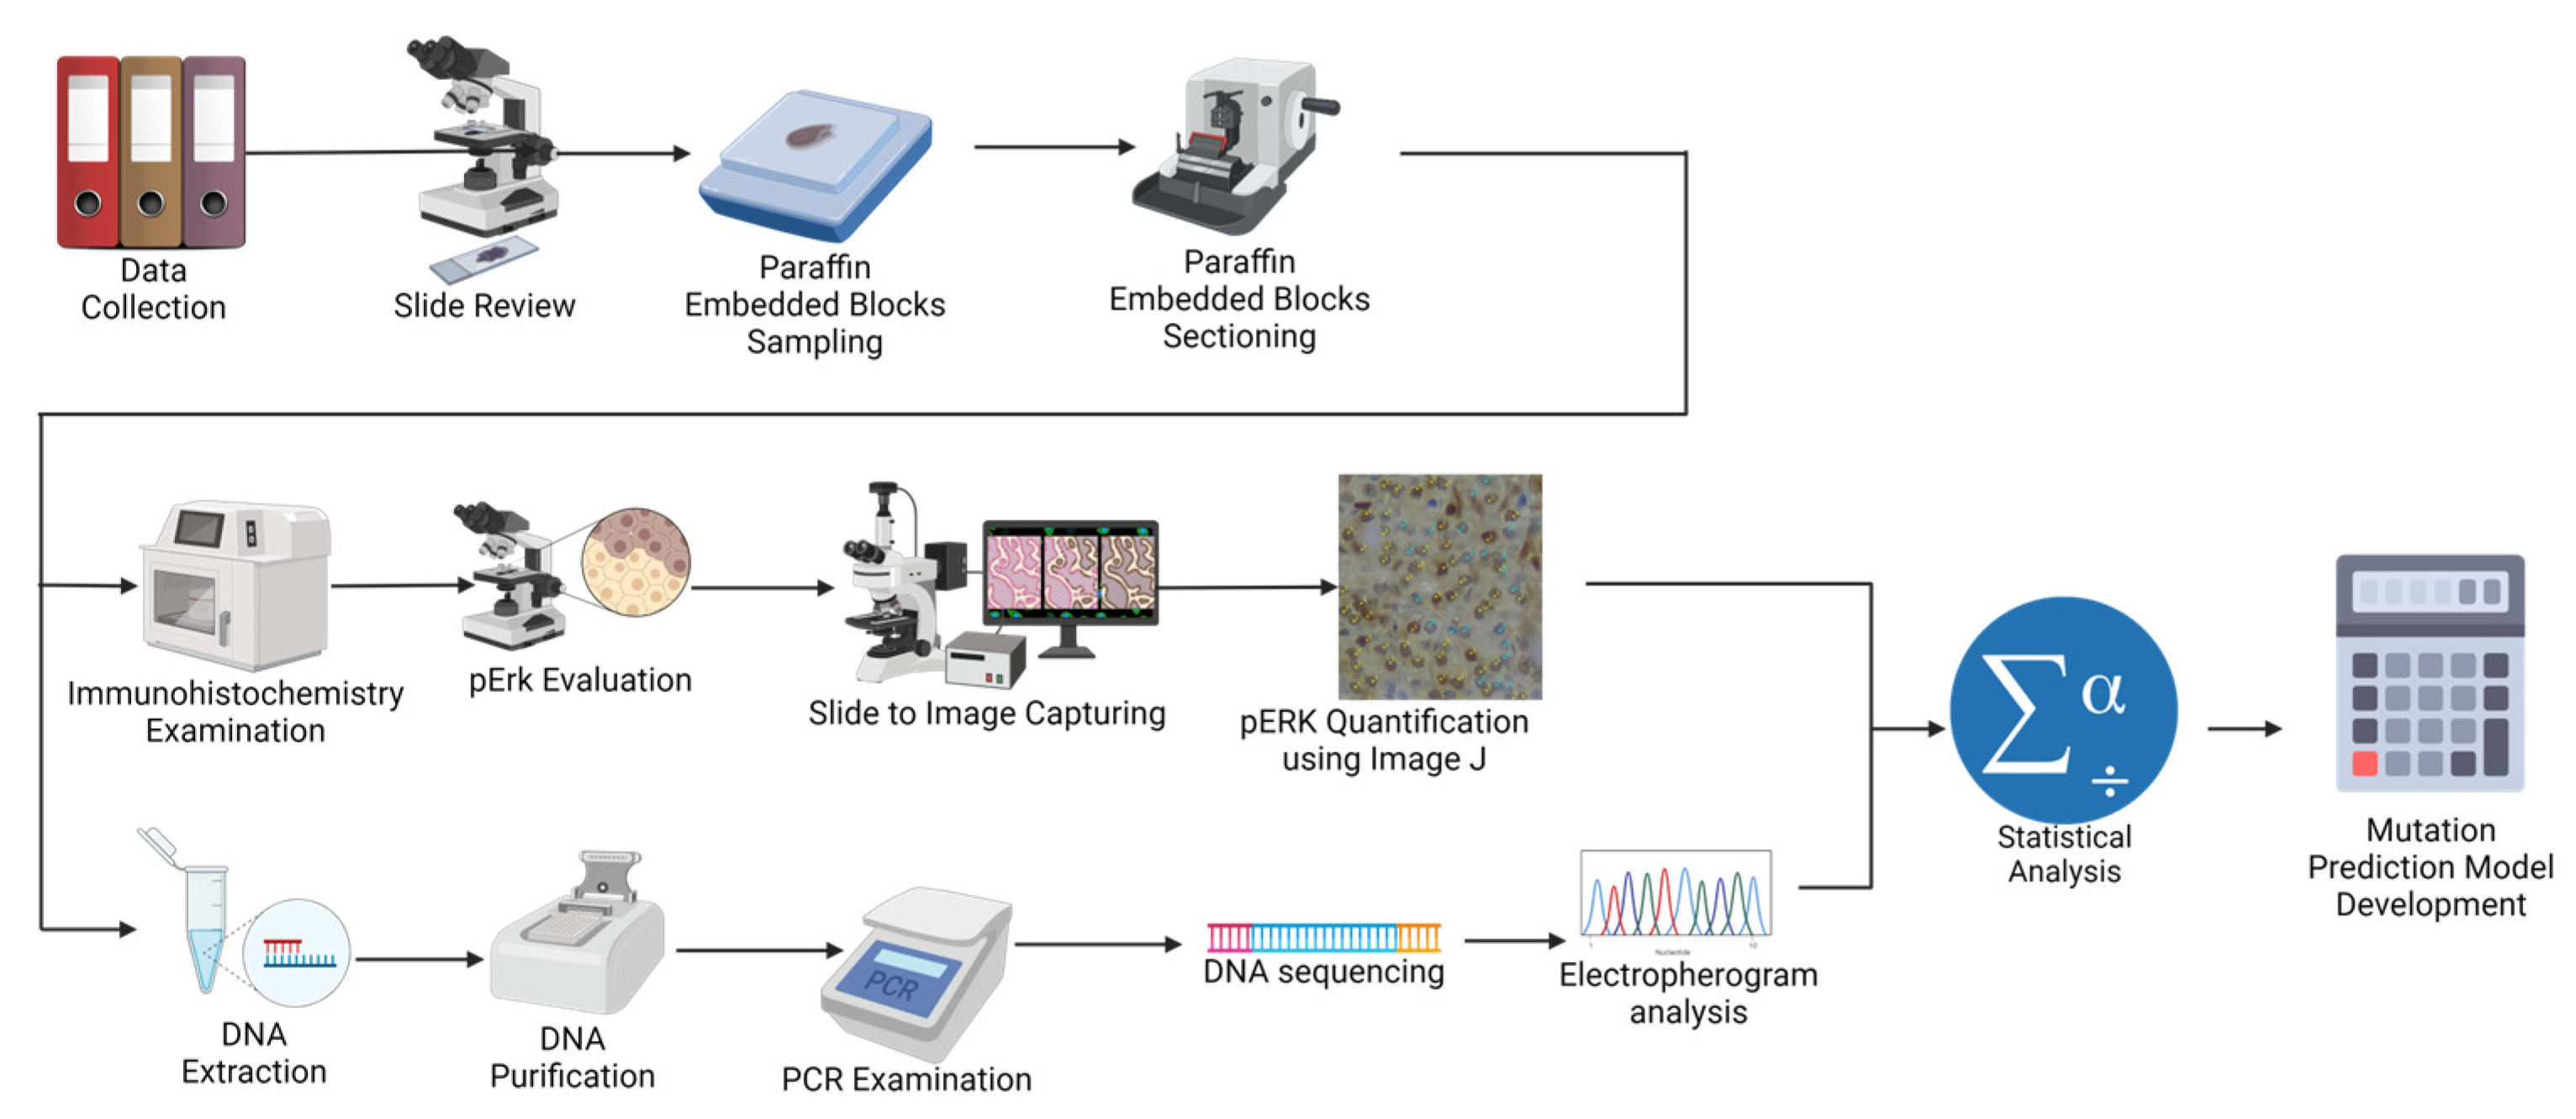
2. Materials and Methods

2.1. Ethical Approval

The study was conducted in accordance with the Helsinki Declaration and was authorized by the Institutional Research Ethics Committee of the Faculty of Medicine, Universitas Indonesia, Dr. Cipto Mangunkusumo Hospital (FMUI-220 CMH) with approval KET-253/UN2.F1/ETIK/PPM.00.02/2022. An ethical waiver of informed consent from the Institutional Review Board was received (permission ND-532/UN2.FI/ETIK/PPM.00.02.2022).

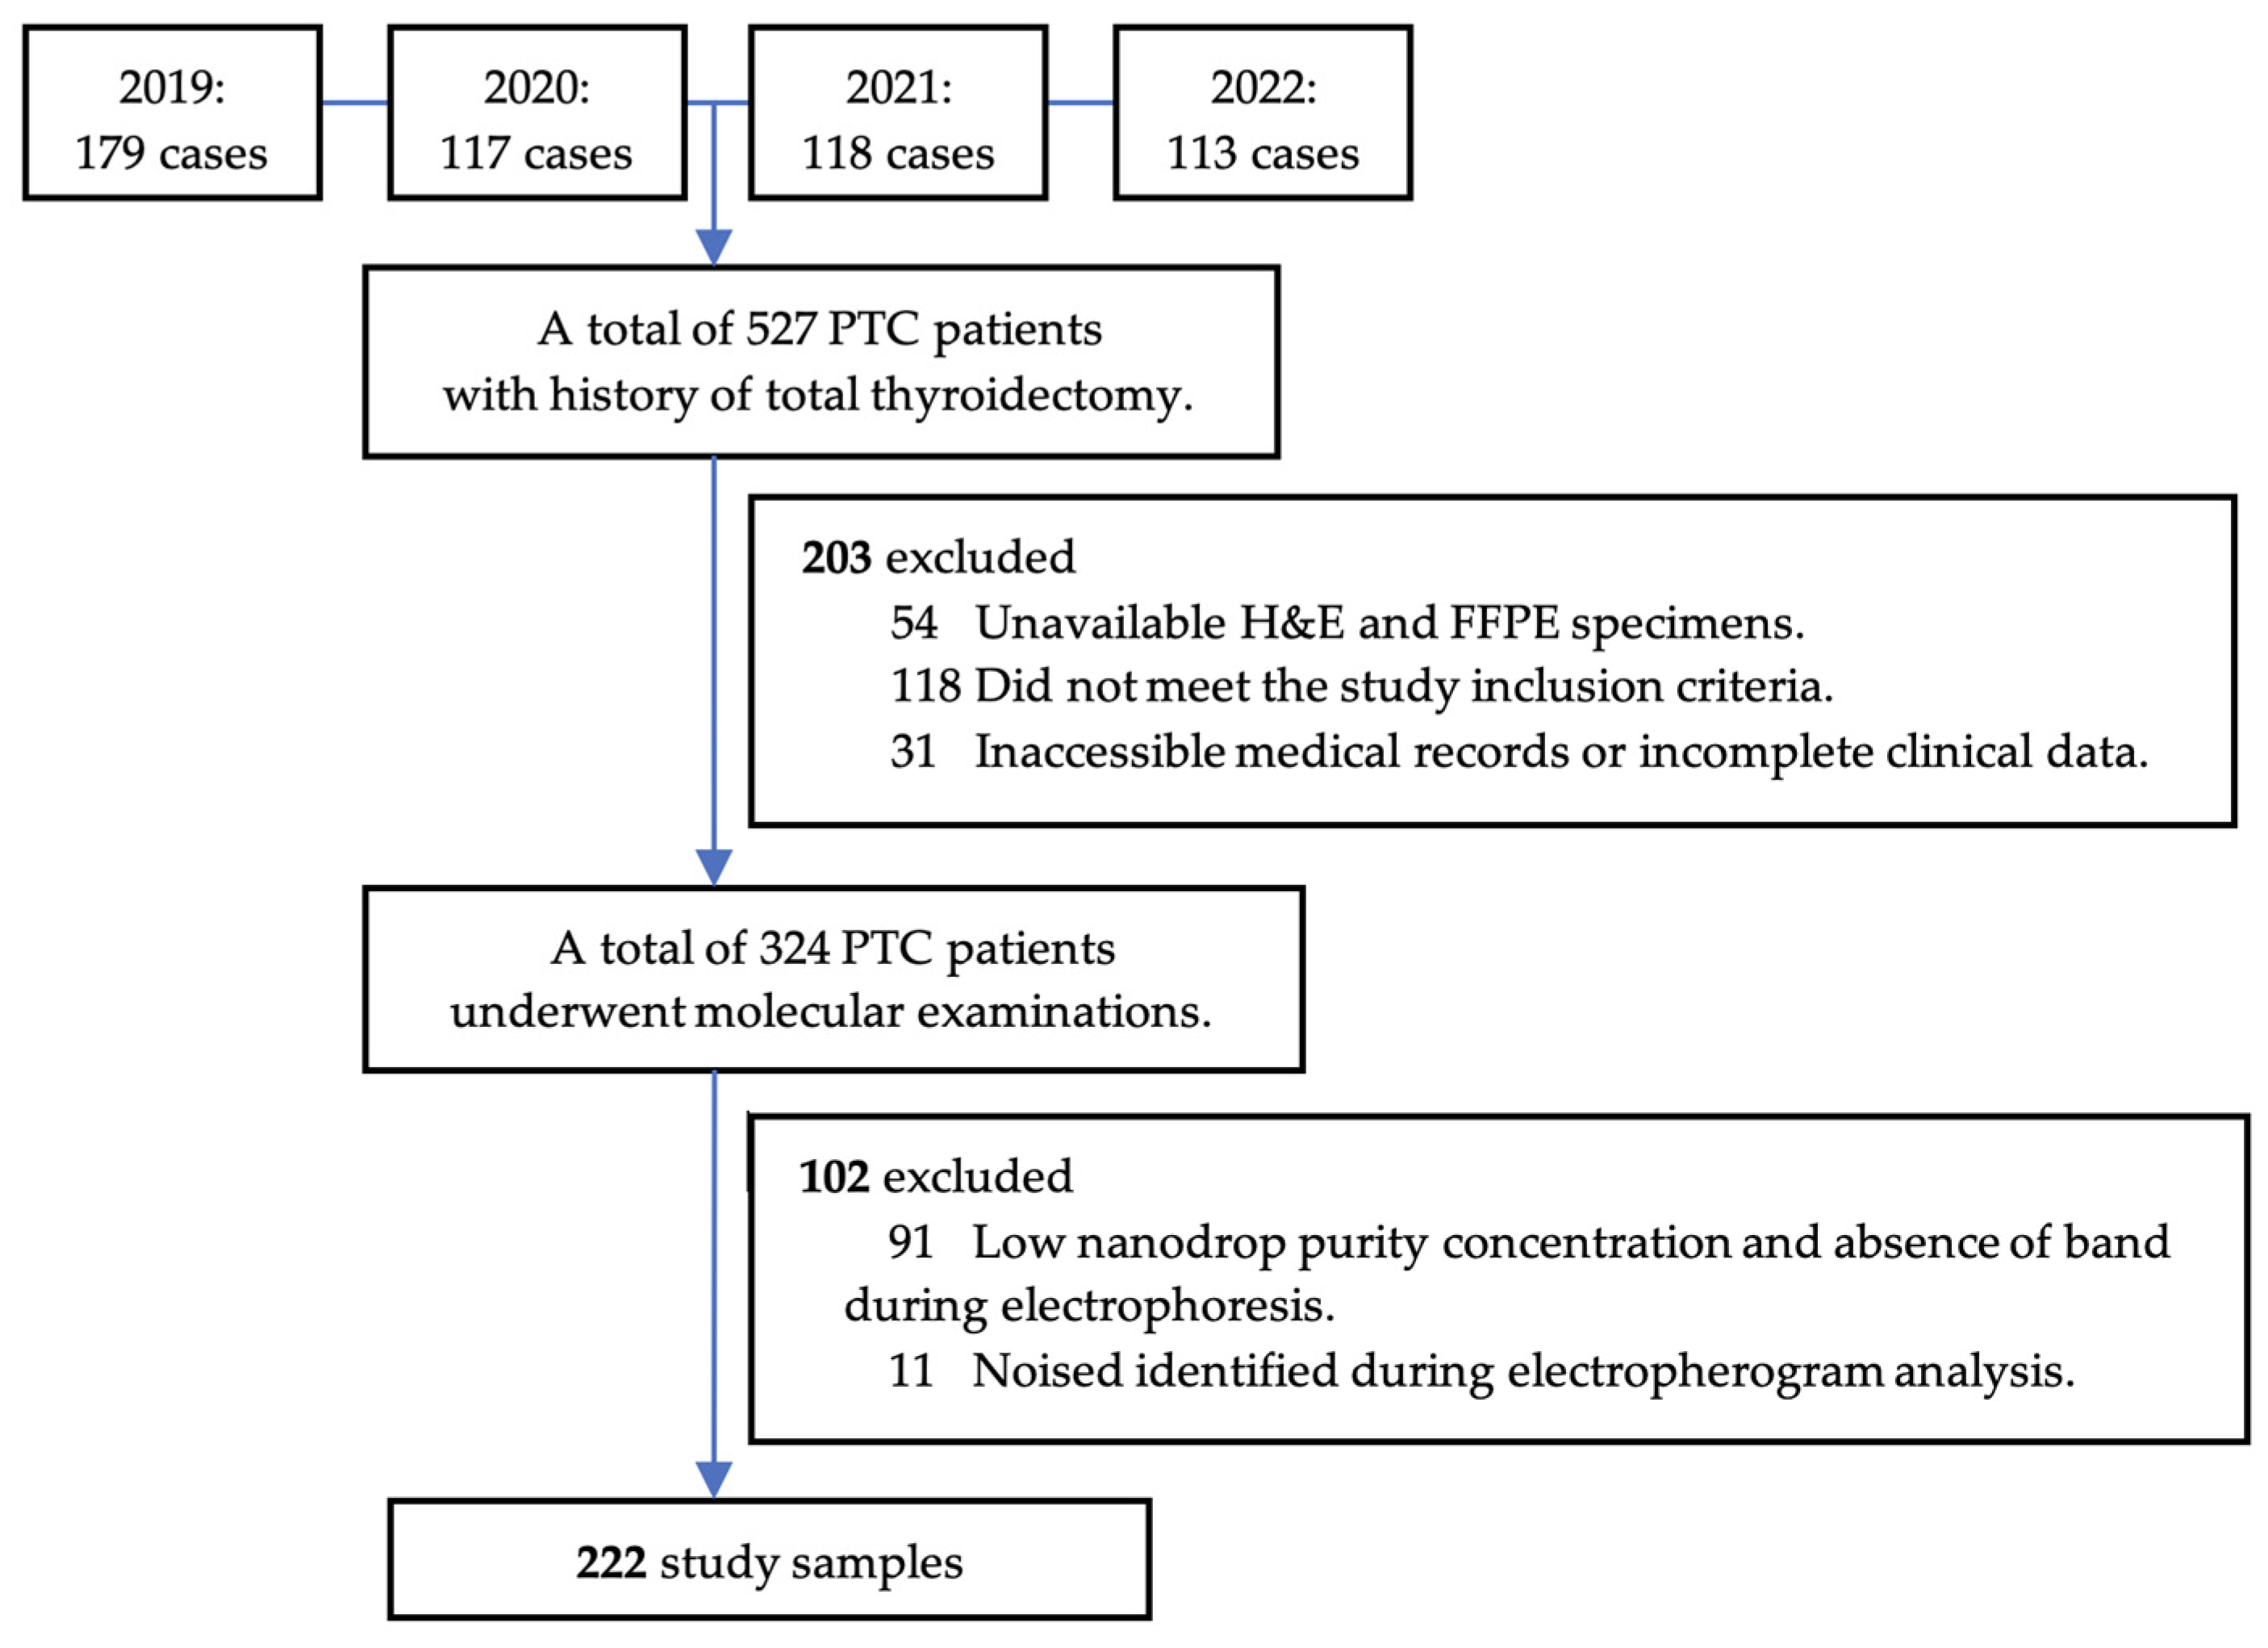
2.2. Study Design and Population

This study retrospectively enrolled PTC patients who had undergone total thyroidectomy at Dr. Cipto Mangunkusumo National Hospital and MRCCC Siloam Hospital between January 2019 and September 2022. We excluded cases with high-grade features, such as a high mitotic index (>3 per 2 mm2) and/or necrosis. The clinical information, including age, gender, and clinical stage, was procured from medical records. Three licensed pathologists blindly gathered the histopathological data: tumor size, PTC nuclear score (Appendix A), capsule, histology subtype, multifocality, lymphovascular invasion (LVI), extrathyroidal extension (ETE), and node metastases. Histology subtypes of PTCs were further classified into non-aggressive (classic and follicular) and aggressive (tall cell, oncocytic, and solid) [13]. The protocol of the present study is illustrated in Figure 2.

2.3. pERK1/2 Immunohistochemistry Examination

The expression of pERK1/2 in this present study was classified into high and low expression based on the cutoff point of 10% established by Gomes et al. [21]. The standard immunohistochemical evaluation procedures were used to assess the expression of pERK1/2. A positive and negative control was included in each specimen. Colon adenocarcinoma paraffin blocks as a positive control were taken from the routine control archives in our institution. The negative controls are tissue samples that did not receive any application of primary antibody reagents. Unstained slides 3 mm thick were cut and rinsed under running water for 2 min following deparaffinization and rehydration. In a de-cloaking chamber at a temperature of 96 °C for 25 min, antigen retrieval was carried out using pH 9 Tris-EDTA buffer. After 3 min of washing in PBS pH 7.4, a blocking solution (Leica Cat. No: RE7102-CE, Thermo Fisher Scientific, Inc., Waltham, MA, USA) was administered for 20 min at room temperature to block non-specific protein. Each slide was incubated with rabbit monoclonal anti-Phospho-p44/42 MAPK (Erk1/2) (20G11; Cell Signaling Technology, Danvers, MA, USA) at a dilution ratio of 1:600. Subsequently, each slide was incubated with the PolyVue Plus Mouse/Rabbit Enhancer (Diagnostic Biosystems, Pleasanton, CA, USA) for 15 min followed by PolyVue Plus Mouse/Rabbit HRP Label for 15 min. The slides were repeatedly washed before being incubated to diluted diaminobenzidine chromogen buffer substrate for 1 min at room temperature. Mayer’s hematoxylin was used for a 10 s counterstaining procedure at room temperature. Each slide was examined under a light microscope (Leica Microsystems GmbH, Wetzlar, Germany) and photographed in five representative fields at ×400 magnification with a minimum of 500 tumor cells for each case. Tumor cells stained brown in the nucleus were counted as positive. The quantitative evaluation of pERK1/2 expression was performed by counting the proportion of cells stained positively using ImageJ software version 1.51 (National Institutes of Health). Kappa interobserver analysis indicated an agreement of 0.879 (p < 0.001), which is near perfect.

2.4. Mutational Analysis

The tumor specimens were subjected to mutational analysis using Sanger sequencing to detect the BRAFV600E mutation as well as N/H/K-RAS codon 12, 13, and 61 mutations [2]. The procedures were performed according to the methodology outlined in a previous study [22]. Non-BRAF/non-RAS mutations are cases with neither BRAFV600E nor RAS mutation, including N/H/K-RAS mutations observed in the respective gene and codon.

2.5. Statistical Analysis

The statistical software package SPSS version 20 was utilized for the purpose of data processing. Bivariate analyses were conducted utilizing Chi-squared and Mann–Whitney U tests. Clinicopathological variables that showed a p value < 0.05 during bivariate analysis were considered as significant variables and were subsequently added to a multivariate analysis. Binary logistic regression testing was employed to conduct the multivariate analysis utilizing a backward conditional method. The model’s goodness of fit was evaluated by conducting the Hosmer–Lemeshow test. A significance level of 0.05 or higher is indicative of a reliable predictive model. The fittest model resulted in selected clinicopathological variables that act as predictors for each BRAFV600E and RAS mutational status. The development of a scoring value for each predictor involved the formulation of the coefficient B and S.E. as displayed in the regression test. Each predictor variable displayed a different B coefficient and S.E. The first step of developing the scoring system would be dividing the B coefficient by S.E. (B/S.E. value) of each variable. After attaining the B/S.E. value for each predictor variable, the lowest B/S.E. value was determined. The final score of each variable was then obtained by dividing each respective B/S.E. value to the lowest B/S.E. value. Following the implementation of the scoring system for the study sample, an analysis of the receiver-operating characteristic (ROC) curve was conducted. An area under the receiver-operating characteristic curve (AUC) exceeding 0.7 indicates a satisfactory level of diagnostic precision. The scoring wizard tool was utilized to evaluate the probability of each total score in every predictive model. To evaluate the applicable combinations of BRAFV600E and RAS model prediction, a multinomial logistic regression test and internal validation was performed.

3. Results

3.1. Baseline Characteristics

The study retrospectively collected PTC patients who had undergone total thyroidectomy from January 2019 to September 2022, with an initial recruitment of 527 patients. A total of 305 patients were excluded from the study for multiple reasons, as illustrated in Figure 3. The study consisted of a total of 222 participants.
Demographic information gathered included female sex (162, 73%), diagnosed under the age of 55 years (163, 73.4%), and at clinical stage 1 (166, 74.8%). Histopathological features were dominated by cases characterized by tumor size less than 4 cm (166, 74.8%), nuclear score of 3 (152, 68.5%), lack of capsules (139, 62.6%), and non-aggressive subtypes (152, 68.5%). The histology subtypes were dominated by follicular subtype (87, 39.2%), followed by classic (65, 29.3%), tall cells (53, 23.9%), oncocytic (10, 4.4%), and solid (7, 3.2%), respectively. The presence of multifocality (168, 75.7%), absence of LVI (135, 60.8%), lack of ETE (158, 71.2%), and lack of node metastases (134, 60.4%) constituted the majority of cases in this study. The expression of pERK 1/2 was quantified to range from 0.2% to 99%, with a median value of 5%. Based on the 10% cutoff point [21], this study was dominated by low pERK1/2 expression (145, 65.3%). Figure 4 displays histological findings of this study sample.

3.2. Bivariate Analysis: Correlation between Clinico-Histopathology Characteristics with BRAFV600E and RAS Mutational Status

One hundred and sixteen cases that did not exhibit the BRAFV600E or RAS mutation were further designated as controls. Two distinct bivariate analyses were performed to compare the BRAFV600E-mutated and controls, as well as the RAS-mutated and controls. The results are outlined in Table 1 and Table 2. The bivariate analysis conducted on the BRAFV600E-mutated group revealed a significant correlation between BRAFV600E mutation and nuclear score 3 (p = 0.001; OR = 4.1; 95% CI = 1.7–9.4), the absence of tumor capsules (p = 0.001; OR = 3.2; 95% CI = 1.5–6.7), tall cell subtype (p = 0.001; OR = 8.9; 95% CI = 3.5–22.6), aggressive histology subtypes (p = 0.001; OR = 2.9; 95% CI = 1.5–5.4), the presence of ETE (p = 0.01; OR = 2.3; 95% CI = 1.2–4.4), the presence of node metastases (p = 0.008; OR = 2.3; 95% CI = 1.2–4.3), and high pERK1/2 expression (p = 0.008; OR = 2.4; 95% CI = 1.2–4.8). There was a significant association between RAS mutation and the follicular histology subtype (p = 0.001; OR = 2.6; 95% CI = 1.1–6.2), the non-aggressive histology subtypes (p = 0.001; OR = 17; 95% CI = 2.2–128.6), and high pERK1/2 expression (p = 0.001; OR = 7.6; 95% CI = 3.5–16.7).

3.3. Multivariate Analysis: Establishing the BRAFV600E Prediction Model

A multivariate analysis using logistic regression was conducted to examine the association between the BRAFV600E mutation and multiple variables. A nuclear score of 3, the absence of tumor capsules, aggressive histology subtypes, and high pERK1/2 expression were identified as predictive factors contributing to the presence of the BRAFV600E mutation. As indicated in Table 3, the predictor variables were assessed individually to determine their respective score for the development of a BRAFV600E prediction model. A nuclear score of 3, the lack of tumor capsules, and aggressive histology subtypes each contribute a score of 1. pERK1/2 expression level exceeding 10% corresponds to a score of 2.
The Hosmer–Lemeshow goodness-of-fit test yielded results indicating that the logistic regression model exhibited a favorable level of calibration (X2 = 0.128, p > 0.05). The receiver-operating characteristic (ROC) curve’s area under the curve (AUC) was determined to be 0.734 with p-value < 0.001 and a 95% CI of 0.661–0.807 (Figure 5). This finding suggests that the logistic regression model exhibits a favorable level of discrimination. Probability, sensitivity, and specificity values for every outcome of the overall score are summarized in Table 4. Based on the results of probability analysis, it was determined that the highest probability, amounting to 82%, is associated with a total score of 5. This indicates that if PTC achieves a score of 5, there is an 82% likelihood of the occurrence of the BRAFV600E mutation.

3.4. Multivariate Analysis: Establishing the RAS Mutation Prediction Model

Based on the multivariate analysis of RAS mutational status, the predictor variables that were included for the development of the RAS prediction model were follicular histology subtype and pERK1/2 expression exceeding 10%. Each corresponding variable gives a score of 1 based on the B/SE value, as summarized in Table 5.
The result of the Hosmer–Lemeshow goodness-of-fit test suggests that the RAS mutation logistic regression model demonstrated a satisfactory level of calibration (X2 = 0.174, p > 0.05). The AUC of the ROC curve was found to be 0.8, with a p-value < 0.001 and a 95% CI of 0.702–0.854 (Figure 6). Probability, sensitivity, and specificity values for every outcome of the overall score generated are summarized in Table 6. According to the findings of the probability analysis, it was ascertained that the highest probability, 70%, is linked to a cumulative score of 2. This suggests that in the case of PTC obtaining a score of 2, there is a probability of 70% of the presence of the RAS mutation.

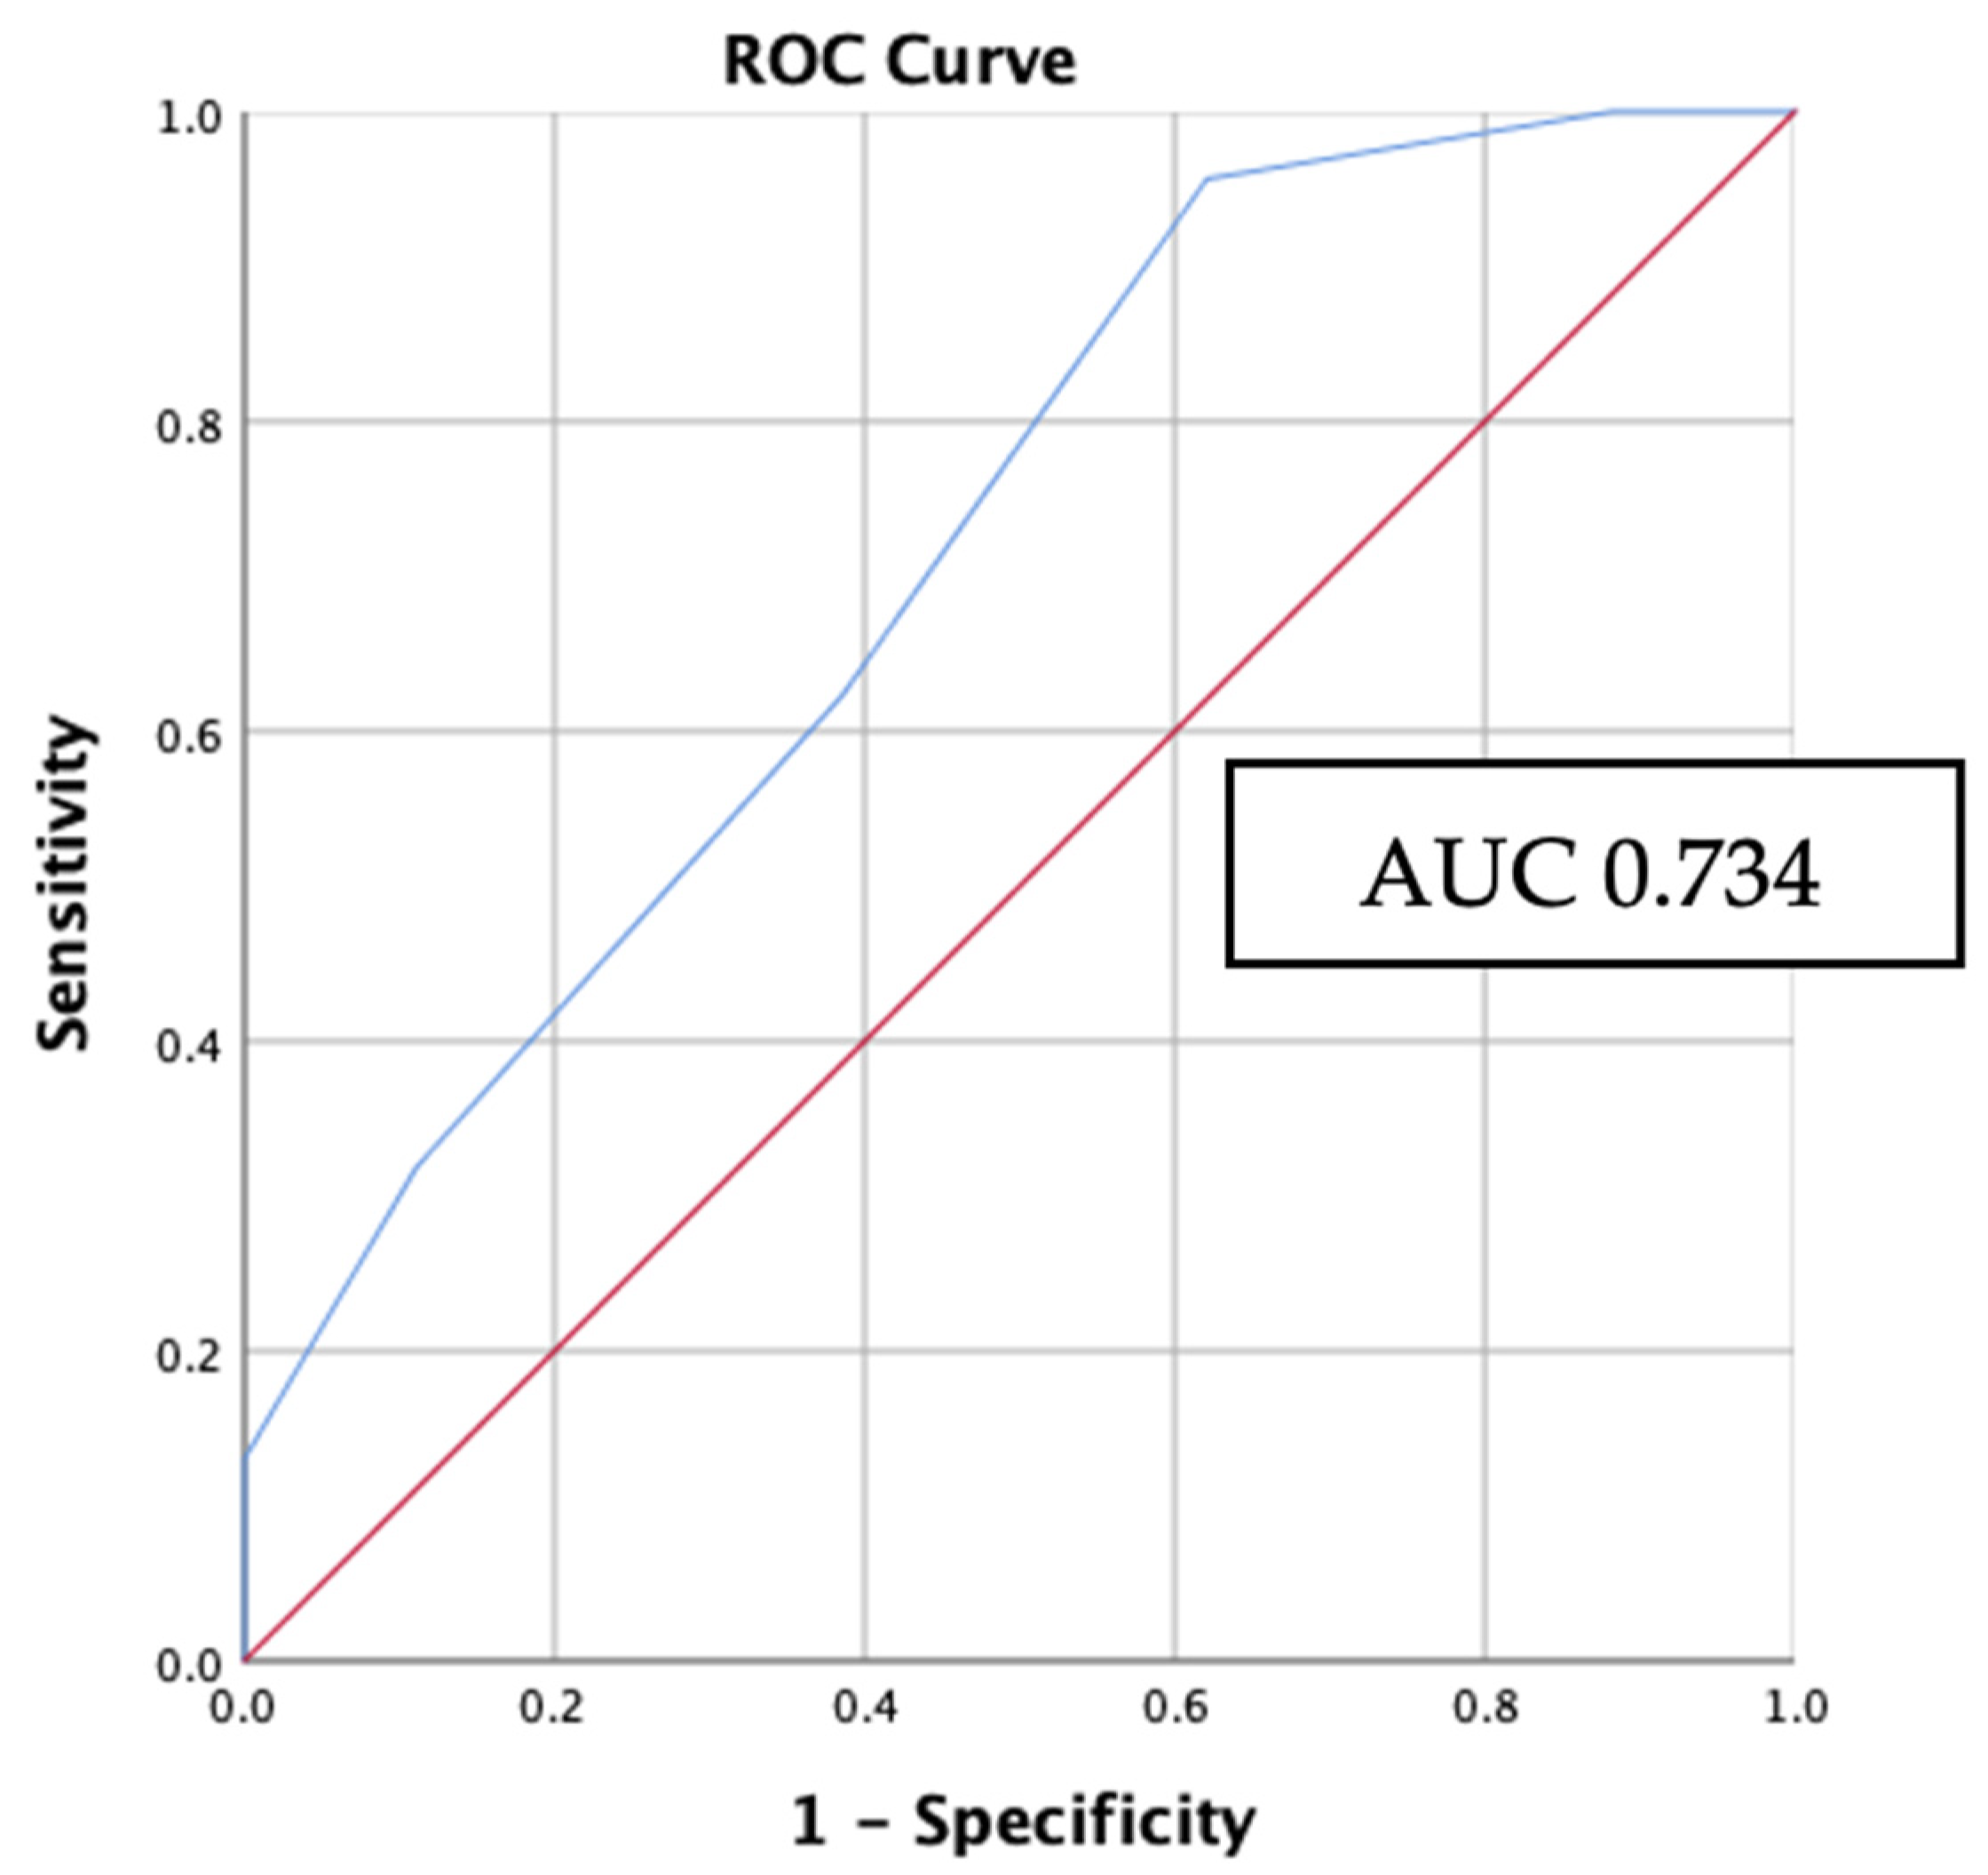
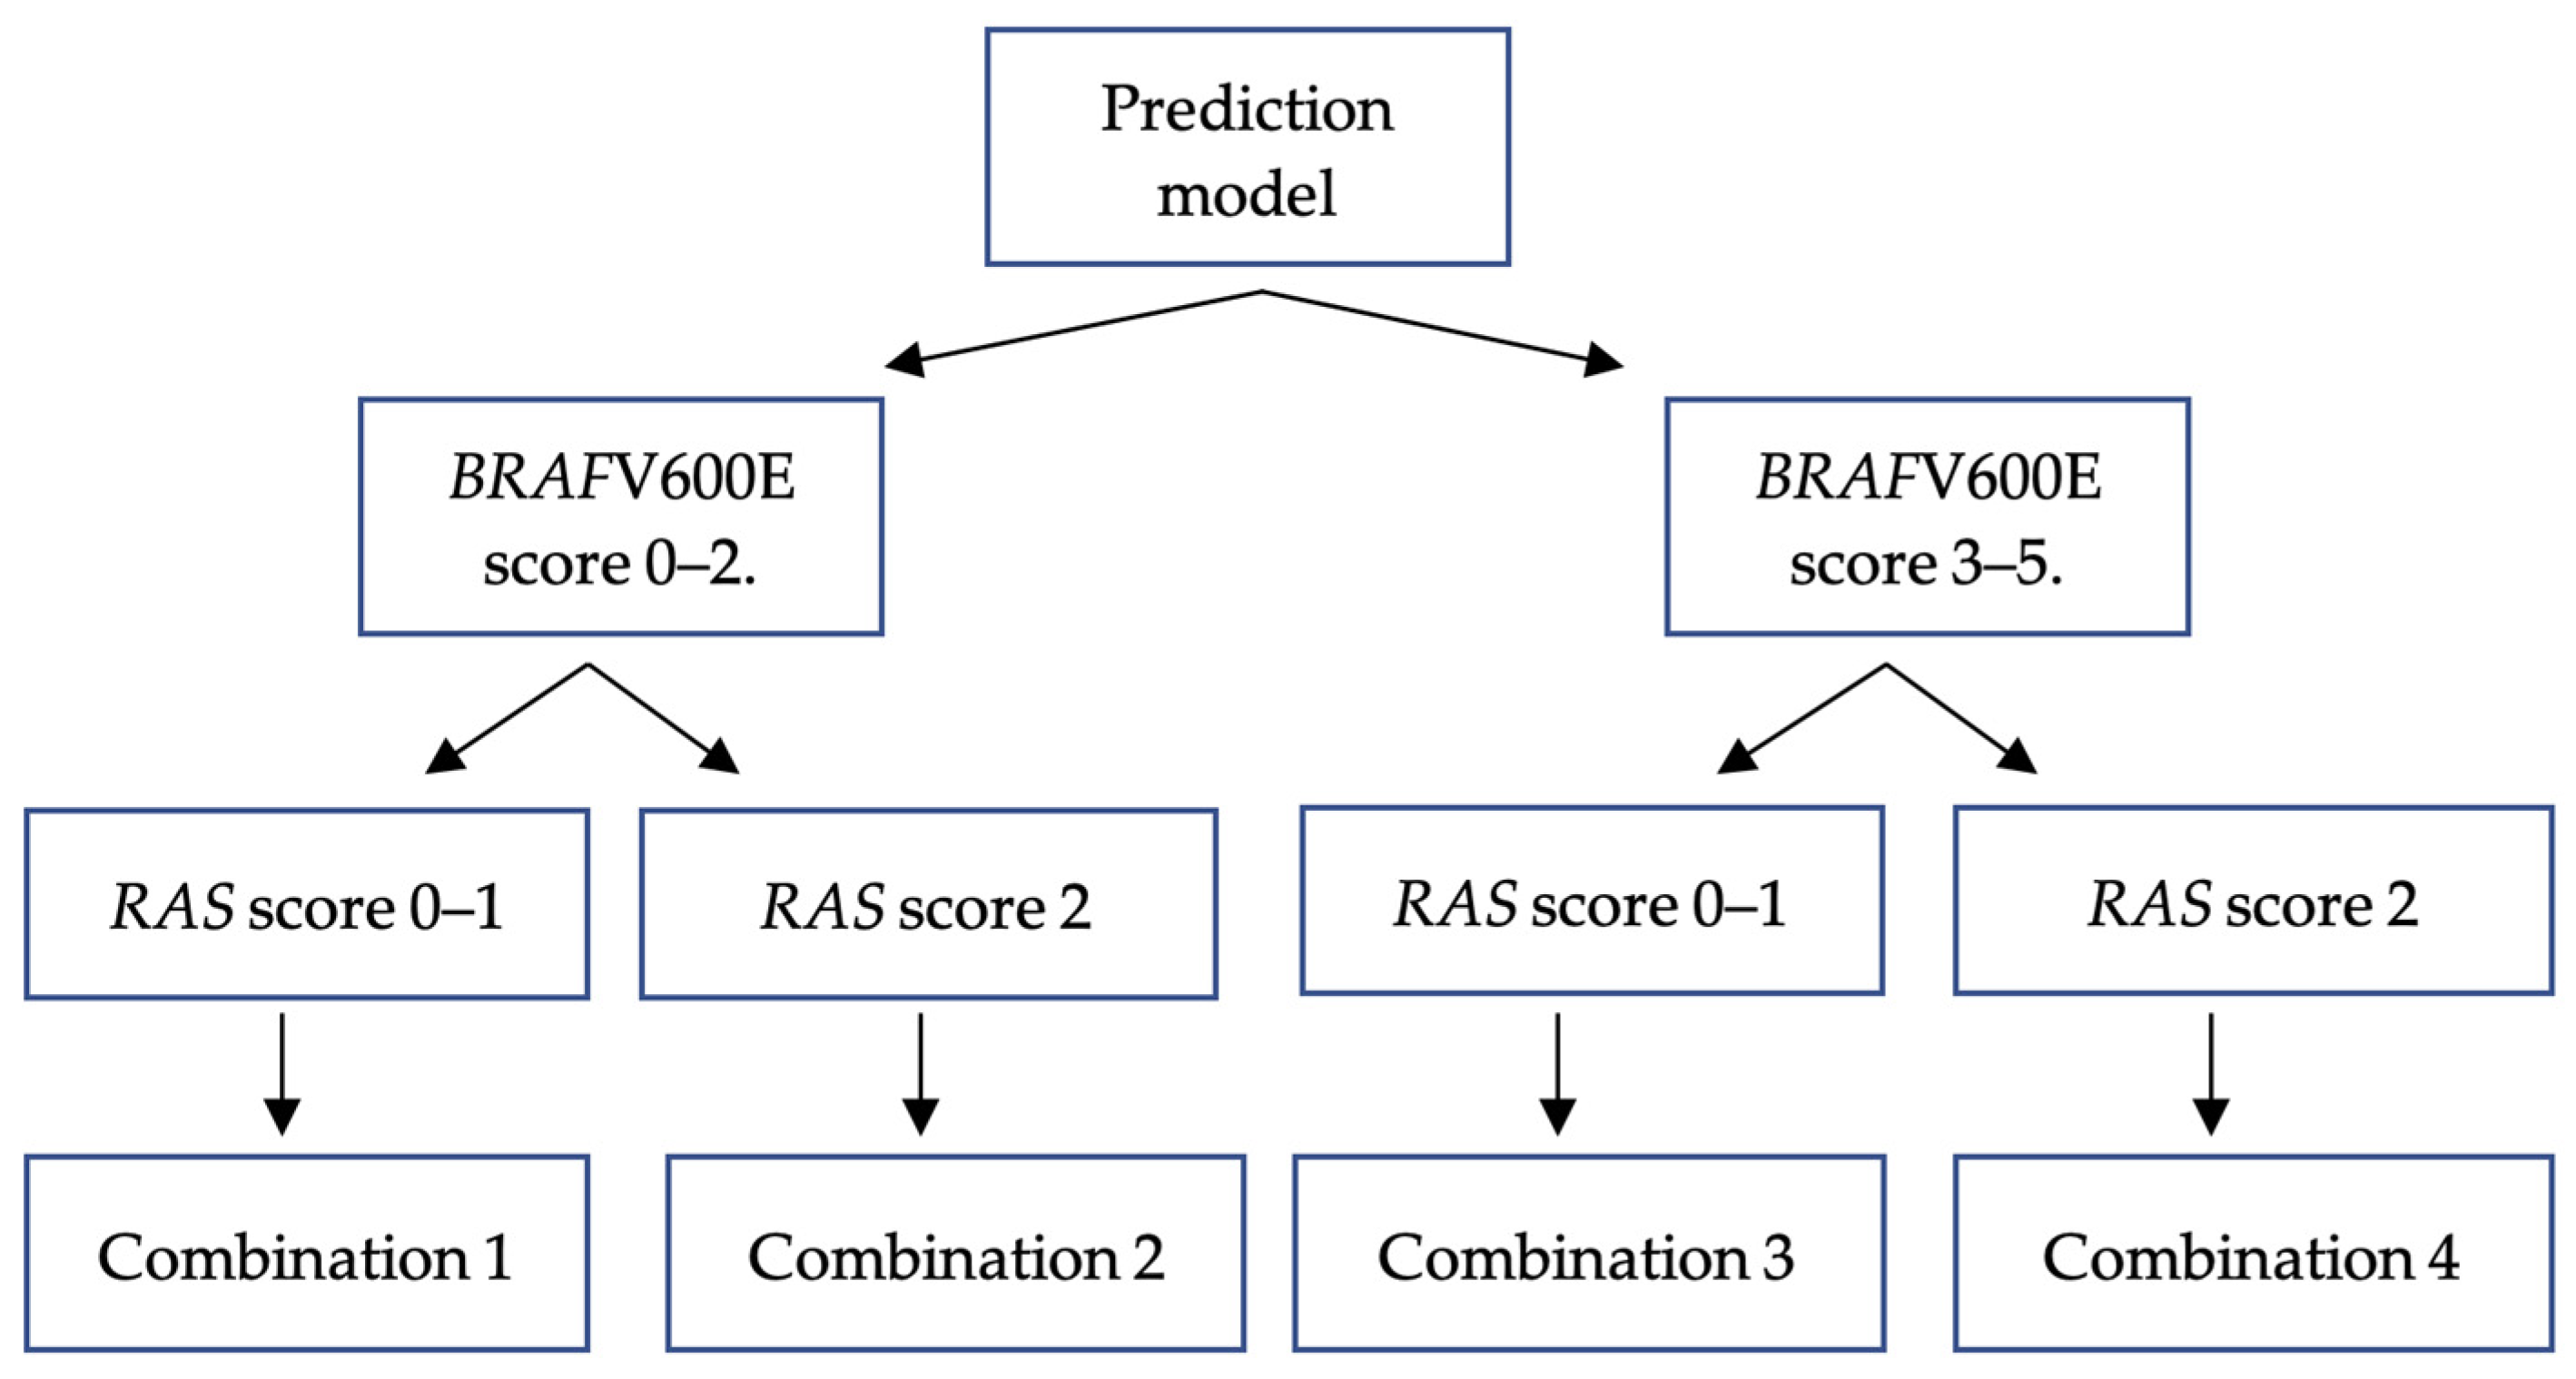
3.5. Internal Validation: Applying BRAFV600E and RAS Mutation Prediction Model to Study Samples

Both prediction models were used to internally validate all study samples. The results showed that a sample capable of fulfilling two prediction models had varying probabilities. Consequently, we established four possible combination outcomes based on the scores obtained from the model of the combination of BRAFV600E and RAS mutations (Figure 7).
The BRAFV600E prediction model results were classified into a low-BRAFV600E-scoring group (total score 0–2) and high-BRAFV600E-scoring group (total score 3–5) based on a specificity value of 65% as the middle threshold for identifying BRAFV600E mutational status. The RAS prediction model results were classified into a low-RAS-scoring group (total score of 0–1) and high-RAS-scoring group (total score of 2) using a specificity value of 91%.
Table 7 provides a summary of a multinomial analysis on four combination outcomes. The low-BRAFV600E-scoring group and low RAS-scoring group, combination 1, acted as the reference group, since they had the greatest proportion of non-BRAFV600E and non-RAS patients. Combination 2 (adjOR = 4.857, p = 0.01, 95% CI = 1.470–16.049), low-BRAFV600E-scoring group and high-RAS-scoring group, was substantially linked to more occurrences of RAS mutation and considered a RAS-like combination. A strong correlation existed between the BRAFV600E mutation and combination 3, the high-BRAFV600E-scoring group and low-RAS-scoring group (adjOR = 3.091, p = 0.001, 95% CI = 1.594–5.995) and further considered a BRAF-like combination. Combination 4, the high-BRAFV600E-scoring group and high-RAS-scoring group, was found to have significantly more RAS-mutated patients (adjOR = 14.571, p = 0.001, 95% CI = 4.095–51.855).

3.6. Correlation between Combination Groups with Clinical Endpoint of PTC

Further analysis to assess the correlation between combination groups with the clinical endpoint of PTC were performed. The clinical endpoint assessed in this present study includes clinical stage and node metastasis. As presented in Table 8, there were significant correlations between combination groups with clinical stage (p = 0.008) and node metastasis (p < 0.001). Combination 2 (RAS-like) was correlated with early clinical stage (adjOR = 1.162, 95% CI = 1.079–1.250), whereas combination 3 (BRAF-like) was correlated with the presence of node metastasis (adjOR = 4.326, 95% CI = 2.330–8.033).

4. Discussion

Various genetic alterations have been identified as contributing factors to the development of PTC. The most commonly observed genetic changes in PTC are BRAFV600E and RAS mutations [23]. These driver gene mutations are mutually exclusive and contribute to the aberrant activation of the MAPK pathway [24]. The different signaling cascades associated with BRAFV600E and RAS mutations give rise to the specific phenotypic and behavioral characteristics observed in PTC. Tumors harboring BRAFV600E mutations exhibit a greater propensity for aggressiveness, characterized by an increased likelihood of disease recurrence [25], mortality [12], and resistance to radio-ablation [13]. Conversely, tumors carrying RAS mutations tend to display more indolent behavior [18]. TCGA has emphasized the importance of categorizing PTCs into two distinct subtypes, namely, BRAF-like and RAS-like, according to their distinctive biological behaviors [2,26]. This present study aimed to develop a predictive model for BRAFV600E and RAS mutations in PTC using various histopathological features, including the novel PTC nuclear score and pERK1/2 expression.
Histopathological factors that are known to contribute to the disease’s aggressiveness are the presence of tumor multifocality, vascular invasion, perithyroidal soft-tissue invasion, and node metastases [26]. The present study provides more evidence for prior research [27,28] that has established an association between these parameters and BRAFV600E mutation status. A phospho-specific antibody that detects pERK1/2 was also examined in this study to assess the activation of the MAPK pathway on a cellular level. It was documented that pERK1/2 expression exceeding 10% was associated with a higher risk of BRAFV600E mutation. Jung et al. discovered a correlation between BRAF-like tumors and high nuclear scores [16]. The findings of this current investigation align with those of a prior study, which demonstrated an association between PTC nuclear score of 3 and the BRAFV600E mutation. We identified four features that emerged as significant predictors of the presence of the BRAFV600E mutation. These variables include a nuclear score of 3, aggressive histology subtypes, the lack of a tumor capsule, and an expression level of pERK1/2 greater than 10%. The scoring system was established utilizing the characteristics indicated in Table 3. A nuclear score of 3, the lack of a tumor capsule, and the aggressive histology subtypes each contributed a score of 1. If the expression of pERK1/2 exceeds 10%, it is assigned a score of 2. The current research demonstrates that the higher the total score, the higher the probability of being BRAFV600E-mutated. The probability of the BRAFV600E mutation is highest at 82% when a set of total five scores is taken into account.
In comparison to the BRAFV600E mutation, tumors harboring the RAS mutation have been linked to a less aggressive pathological phenotype, characterized by a follicular-patterned tumors, encapsulated tumors [17], less disease invasion [15,18] and a reduced likelihood of recurrence [18]. Our finding is in line with previous literature, in which RAS mutations were significantly more common in the follicular subtype of PTCs. Follicular subtype of PTCs are considered the non-aggressive histology subtypes, belonging to the well-differentiated thyroid carcinomas [13]. A significant difference between the signaling pathways of BRAFV600E-mutated and RAS-mutated tumors resides in the lower level of MAPK activity found in RAS-mutated tumors [2]. This present study, however, was able to display a significant association between the enhanced MAPK activity in both BRAFV600E- and RAS-mutated PTCs, as displayed in pERK1/2 immunohistochemistry expression. On multivariate analysis, it was determined that two features, namely, the presence of the follicular subtype and an expression level of pERK1/2 greater than 10%, were significant predictors of RAS mutation. The scoring system was constructed based on the criteria listed in Table 5. Each variable is assigned a value of 1, resulting in a total score of 2, which contributes to a probability of 70% of RAS mutation.
The provided study sample exhibits the capacity to satisfy two distinct prediction models with differing probabilities for BRAFV600E and RAS mutations, posing challenges in determining mutational status. Hence, this work proposes the concurrent utilization of the BRAFV600E and RAS prediction models in routine clinical applications. All samples were applied to both the BRAFV600E and RAS prediction models for internal validation. The initial utilization of the BRAFV600E prediction model involved its categorization into two distinct groups: a low-BRAFV600E-scoring group (score 0–2) and a high-BRAFV600E-scoring group (score 3–5). The RAS prediction model consists of two distinct sample groups based on their total scores. One group is characterized by RAS scores ranging from 0 to 1, the low-RAS-scoring group, while the other group has a uniform RAS score of 2, the high-RAS-scoring group. Ultimately, four possible outcomes were established, denoted as combinations within the context of this investigation (Figure 5). There are four possible outcome groups: combination 1 involves cases with low scores in both the BRAFV600E and RAS groups, combination 2 involves cases with a low BRAFV600E score and a high RAS score, combination 3 involves cases with a high BRAFV600E score and a low RAS score, and combination 4 involves cases with high scores in both the BRAFV600E and RAS prediction models. The prevalence of combination 1 was seen to be highest among individuals with non-BRAFV600E and non-RAS mutations. Combination 2 exhibited the highest prevalence in samples where RAS mutations were detected, with a statistically significant positive correlation. In combination 3, most of the samples exhibited BRAFV600E mutations, which were shown to be statistically significant. Based on the obtained results, it was determined that the dominant parts of combination 2 and combination 3 were RAS-like and BRAFV600E-like PTCs, respectively. This discovery provides evidence in favor of the proposed hypothesis. In combination 4, a significant association was shown between RAS mutations and a 14-fold increased likelihood compared to non-BRAFV600E non-RAS mutations. However, no association was found with BRAFV600E mutations. On the one hand, this combination exhibits a proclivity toward RAS mutations. However, given that PTC with the BRAFV600E mutation tends to display a more aggressive nature, it is advisable to approach its interpretation with caution to avoid potential undertreatment. Undertreatment refers to a situation in which PTC has aggressive characteristics, although the management approach is based on low-risk criteria, thereby elevating the likelihood of disease recurrence or metastasis.
This is the sole study to have constructed a predictive model pertaining to gene mutations in PTC, owing to the routine implementation of molecular examination in developed countries. The outcomes of this study may be beneficial to be implemented in countries with limited access and facilities to molecular testing. Our findings can map the histopathology characteristics of PTC into BRAF-like and RAS-like tumors as a foundation of the biological behavior of the tumor. Although this study was able to present the significant correlations between combination groups with clinical stage and node metastases, it is limited, as it does not include other clinical endpoint variables such as mortality, recurrence, distant metastases, or therapy response. Additional external validation studies are required to further assess the predictive model, utilizing larger and more diverse samples as well as incorporating additional variables, as previously mentioned.

5. Conclusions

Using clinico-histopathology features and pERK1/2 expression, two distinct predictive models for BRAFV600E and RAS mutational status in PTC were developed. The BRAFV600E prediction model consists of a PTC nuclear score of 3 (score 1), a lack of capsules (score 1), the aggressive histology subtypes (score 1), and pERK1/2 expression > 10% (score 2). The probability of the BRAFV600E mutation is highest at 82% when a set of a total five scores was reached. The RAS prediction model consists of the follicular subtype (score 1) and pERK1/2 expression > 10% (score 1). BRAF-like tumors are those included in combination 3 (high-BRAFV600E-scoring group and low-RAS-scoring group), which exhibits a significant threefold increase in the BRAFV600E mutation. RAS-like tumors are those belonging to combination 2 (low-BRAFV600E-scoring group and high-RAS-scoring group), which showed a significant 4.8-fold increase in RAS mutation. Combination 2 (Ras-like) was associated with early clinical stage, whereas combination 3 (BRAF-like) was associated with the presence of node metastasis. These prediction models may serve as a fundamental basis for comprehending the distinct phenotypic and molecular characteristics of BRAF-like and RAS-like PTCs.

Author Contributions

Conceptualization, A.S.H., I.S., S.S.P., R.A.W. and D.K.; methodology, A.S.H., R.A.W., D.K., S.S.P. and A.H.A.; validation, A.S.H., M.F.H., L. and F.L.G.; formal analysis, A.S.H., R.A.W., D.K. and M.M.; resources, A.S.H., L. and F.L.G.; data curation, A.S.H., A., L. and F.L.G.; writing—original draft preparation, A.S.H., D.K. and A.H.A.; writing—review and editing, I.S., S.S.P., M.F.H., A., L., R.A.W., H.A., F.L.G. and A.H.A.; supervision, I.S., S.S.P. and M.F.H.; funding acquisition, M.F.H. All authors have read and agreed to the published version of the manuscript.

Funding

The authors would like to thank Universitas Indonesia for funding this research through PUTI grant with contract number NKB-1298/UN2.RST/HKP.05.00/2020.

Institutional Review Board Statement

The study was conducted in accordance with the Helsinki Declaration and was authorized by the Institutional Research Ethics Committee of the Faculty of Medicine, Universitas Indonesia Dr. Cipto Mangunkusumo Hospital (FMUI-220 CMH) with approval KET-253/UN2.F1/ETIK/PPM.00.02/2022.

Informed Consent Statement

An ethical waiver of informed consent from the Institutional Review Board was received (permission ND-532/UN2.FI/ETIK/PPM.00.02.2022). Inform consent was waived for this present study as it was based on data and specimen collection from the archive. This study used existing medical records and pathological specimens that were handled in a way that ensured the identity of each subject remained protected.

Data Availability Statement

The dataset utilized in this study is accessible upon request from the author responsible for correspondence.

Conflicts of Interest

The authors declare no conflict of interest.

Appendix A

PTC nuclear score assessment involved a standardized grouping of three major categories established by the consensus conference expert panel (Table A1). Each category was assigned a binary value of either present or absent and a score of 0 or 1. Nuclear size and shape, nuclear membrane irregularities, and nuclear chromatin features are the three categories used to assess the nucleus. Each category is assigned 1 point if observed. A total score of 2 or 3 indicates sufficient nuclear features in PTC for diagnostic purposes.
Table A1. PTC nuclear score assessment [29].
Nuclear Features (1 Point Each)Criteria
  1.     Size and shapeEnlargement, elongation, crowding, overlapping
  2.     Membrane irregularitiesIrregular contours, grooves, folds, intranuclear cytoplasmic inclusions
  3.     Chromatin featuresChromatin clearing, margination to nuclear membranes, glassy nuclei
  Score0: Absent or only slightly expressed
1: Present or well developed
  PTC nuclear score:0 or 1: Not diagnostic
2 or 3: Diagnostic of PTC nuclei

References

  1. Olson, E.; Wintheiser, G.; Wolfe, K.M.; Droessler, J.; Silberstein, P.T. Epidemiology of Thyroid Cancer: A Review of the National Cancer Database, 2000–2013. Cureus 2019, 11, e4127. [Google Scholar] [CrossRef] [PubMed]
  2. Agrawal, N.; Akbani, R.; Aksoy, B.A.; Ally, A.; Arachchi, H.; Asa, S.L.; Auman, J.T.; Balasundaram, M.; Balu, S.; Baylin, S.B.; et al. Integrated Genomic Characterization of Papillary Thyroid Carcinoma. Cell 2014, 159, 676–690. [Google Scholar] [CrossRef] [PubMed]
  3. Jung, C.K.; Little, M.P.; Lubin, J.H.; Brenner, A.V.; Wells, S.A.; Sigurdson, A.J.; Nikiforov, Y.E. The Increase in Thyroid Cancer Incidence during the Last Four Decades Is Accompanied by a High Frequency of BRAF Mutations and a Sharp Increase in RAS Mutations. J. Clin. Endocrinol. Metab. 2014, 99, E276–E285. [Google Scholar] [CrossRef] [PubMed]
  4. Xing, M. BRAF Mutation in Thyroid Cancer. Endocr. Relat. Cancer 2005, 12, 245–262. [Google Scholar] [CrossRef]
  5. Xie, H.; Wei, B.; Shen, H.; Gao, Y.; Wang, L.; Liu, H. BRAF Mutation in Papillary Thyroid Carcinoma (PTC) and Its Association with Clinicopathological Features and Systemic Inflammation Response Index (SIRI). Am. J. Transl. Res. 2018, 10, 2726–2736. [Google Scholar]
  6. Brehar, A.C.; Brehar, F.M.; Bulgar, A.C.; Dumitrache, C. Genetic and Epigenetic Alterations in Differentiated Thyroid Carcinoma. J. Med. Life 2013, 6, 403–408. [Google Scholar]
  7. Marotta, V.; Bifulco, M.; Vitale, M. Significance of RAS Mutations in Thyroid Benign Nodules and Non-Medullary Thyroid Cancer. Cancers 2021, 13, 3785. [Google Scholar] [CrossRef]
  8. Soares, P.; Trovisco, V.; Rocha, A.S.; Lima, J.; Castro, P.; Preto, A.; Máximo, V.; Botelho, T.; Seruca, R.; Sobrinho-Simões, M. BRAF Mutations and RET/PTC Rearrangements Are Alternative Events in the Etiopathogenesis of PTC. Oncogene 2003, 22, 4578–4580. [Google Scholar] [CrossRef]
  9. Wang, P.; Han, L.; Yu, M.; Cao, Z.; Li, X.; Shao, Y.; Zhu, G. The Prognostic Value of PERK in Cancer and Its Relationship with Immune Cell Infiltration. Front. Mol. Biosci. 2021, 8, 648752. [Google Scholar] [CrossRef]
  10. Wan, P.T.C.; Garnett, M.J.; Roe, S.M.; Lee, S.; Niculescu-Duvaz, D.; Good, V.M.; Jones, C.M.; Marshall, C.J.; Springer, C.J.; Barford, D.; et al. Cancer Genome Project. Mechanism of Activation of the RAF-ERK Signaling Pathway by Oncogenic Mutations of B-RAF. Cell 2004, 116, 855–867. [Google Scholar] [CrossRef]
  11. Cao, Y.-M.; Zhang, T.-T.; Li, B.-Y.; Qu, N.; Zhu, Y.-X. Prognostic Evaluation Model for Papillary Thyroid Cancer: A Retrospective Study of 660 Cases. Gland Surg. 2021, 10, 2170–2179. [Google Scholar] [CrossRef] [PubMed]
  12. Xing, M.; Alzahrani, A.S.; Carson, K.A.; Viola, D.; Elisei, R.; Bendlova, B.; Yip, L.; Mian, C.; Vianello, F.; Tuttle, R.M.; et al. Association between BRAF V600E Mutation and Mortality in Patients with Papillary Thyroid Cancer. JAMA 2013, 309, 1493–1501. [Google Scholar] [CrossRef] [PubMed]
  13. WHO Classification of Tumours Editorial Board. Endocrine and Neuroendocrine Tumours; International Agency for Research on Cancer: Lyon, France; Available online: https://tumourclassification.iarc.who.int/chapters/53 (accessed on 24 January 2023).
  14. Li, C.; Lee, K.C.; Schneider, E.B.; Zeiger, M.A. BRAF V600E Mutation and Its Association with Clinicopathological Features of Papillary Thyroid Cancer: A Meta-Analysis. J. Clin. Endocrinol. Metab. 2012, 97, 4559–4570. [Google Scholar] [CrossRef] [PubMed]
  15. Adeniran, A.J.; Zhu, Z.; Gandhi, M.; Steward, D.L.; Fidler, J.P.; Giordano, T.J.; Biddinger, P.W.; Nikiforov, Y.E. Correlation between Genetic Alterations and Microscopic Features, Clinical Manifestations, and Prognostic Characteristics of Thyroid Papillary Carcinomas. Am. J. Surg. Pathol. 2006, 30, 216–222. [Google Scholar] [CrossRef]
  16. Jung, C.K.; Bychkov, A.; Song, D.E.; Kim, J.H.; Zhu, Y.; Liu, Z.; Keelawat, S.; Lai, C.R.; Hirokawa, M.; Kameyama, K.; et al. Molecular Correlates and Nuclear Features of Encapsulated Follicular-Patterned Thyroid Neoplasms. Endocrinol. Metab. 2021, 36, 123–133. [Google Scholar] [CrossRef]
  17. Rivera, M.; Ricarte-Filho, J.; Knauf, J.; Shaha, A.; Tuttle, M.; Fagin, J.A.; Ghossein, R.A. Molecular Genotyping of Papillary Thyroid Carcinoma Follicular Variant According to Its Histological Subtypes (Encapsulated vs Infiltrative) Reveals Distinct BRAF and RAS Mutation Patterns. Mod. Pathol. 2010, 23, 1191–1200. [Google Scholar] [CrossRef]
  18. Schulten, H.-J.; Salama, S.; Al-Ahmadi, A.; Al-Mansouri, Z.; Mirza, Z.; Al-Ghamdi, K.; Al-Hamour, O.A.; Huwait, E.; Gari, M.; Al-Qahtani, M.H.; et al. Comprehensive Survey of HRAS, KRAS, and NRAS Mutations in Proliferative Thyroid Lesions from an Ethnically Diverse Population. Anticancer Res. 2013, 33, 4779–4784. [Google Scholar]
  19. Hara, H.; Fulton, N.; Yashiro, T.; Ito, K.; DeGroot, L.J.; Kaplan, E.L. N-Ras Mutation: An Independent Prognostic Factor for Aggressiveness of Papillary Thyroid Carcinoma. Surgery 1994, 116, 1010–1016. [Google Scholar]
  20. Odate, T.; Oishi, N.; Vuong, H.G.; Mochizuki, K.; Kondo, T. Genetic Differences in Follicular Thyroid Carcinoma between Asian and Western Countries: A Systematic Review. Gland Surg. 2020, 9, 1813–1826. [Google Scholar] [CrossRef]
  21. Gomes, C.C.; Gayden, T.; Bajic, A.; Harraz, O.F.; Pratt, J.; Nikbakht, H.; Bareke, E.; Diniz, M.G.; Castro, W.H.; St-Onge, P.; et al. TRPV4 and KRAS and FGFR1 Gain-of-Function Mutations Drive Giant Cell Lesions of the Jaw. Nat. Commun. 2018, 9, 4572. [Google Scholar] [CrossRef]
  22. Harahap, A.S.; Subekti, I.; Panigoro, S.S.; Asmarinah; Lisnawati; Werdhani, R.A.; Agustina, H.; Khoirunnisa, D.; Mutmainnah, M.; Salinah; et al. Profile of BRAFV600E, BRAFK601E, NRAS, HRAS, and KRAS Mutational Status, and Clinicopathological Characteristics of Papillary Thyroid Carcinoma in Indonesian National Referral Hospital. Appl. Clin. Genet. 2023, 16, 99–110. [Google Scholar] [CrossRef] [PubMed]
  23. Yip, L.; Nikiforova, M.N.; Yoo, J.Y.; McCoy, K.L.; Stang, M.T.; Armstrong, M.J.; Nicholson, K.J.; Ohori, N.P.; Coyne, C.; Hodak, S.P.; et al. Tumor Genotype Determines Phenotype and Disease-Related Outcomes in Thyroid Cancer: A Study of 1510 Patients. Ann. Surg. 2015, 262, 519–525; discussion 524–525. [Google Scholar] [CrossRef] [PubMed]
  24. Maik-Rachline, G.; Hacohen-Lev-Ran, A.; Seger, R. Nuclear ERK: Mechanism of Translocation, Substrates, and Role in Cancer. Int. J. Mol. Sci. 2019, 20, 1194. [Google Scholar] [CrossRef] [PubMed]
  25. Lee, A.W.; Mendoza, R.A.; Aman, S.; Hsu, R.; Liu, L. Thyroid Cancer Incidence Disparities among Ethnic Asian American Populations, 1990–2014. Ann. Epidemiol. 2022, 66, 28–36. [Google Scholar] [CrossRef]
  26. Haugen, B.R.; Alexander, E.K.; Bible, K.C.; Doherty, G.M.; Mandel, S.J.; Nikiforov, Y.E.; Pacini, F.; Randolph, G.W.; Sawka, A.M.; Schlumberger, M.; et al. 2015 American Thyroid Association Management Guidelines for Adult Patients with Thyroid Nodules and Differentiated Thyroid Cancer: The American Thyroid Association Guidelines Task Force on Thyroid Nodules and Differentiated Thyroid Cancer. Thyroid 2016, 26, 1–133. [Google Scholar] [CrossRef]
  27. Pessôa-Pereira, D.; Medeiros, M.F.d.S.; Lima, V.M.S.; Silva, J.C.d.; Cerqueira, T.L.d.O.; Silva, I.C.d.; Fonseca, L.E.; Sampaio, L.J.L.; Lima, C.R.A.d.; Ramos, H.E. Association between BRAF (V600E) Mutation and Clinicopathological Features of Papillary Thyroid Carcinoma: A Brazilian Single-Centre Case Series. Arch. Endocrinol. Metab. 2019, 63, 97–106. [Google Scholar] [CrossRef]
  28. Silver, J.A.; Bogatchenko, M.; Pusztaszeri, M.; Forest, V.-I.; Hier, M.P.; Yang, J.W.; Tamilia, M.; Payne, R.J. BRAF V600E Mutation Is Associated with Aggressive Features in Papillary Thyroid Carcinomas ≤ 1.5 cm. J. Otolaryngol.—Head Neck Surg. 2021, 50, 63. [Google Scholar] [CrossRef]
  29. Thompson, L.D.R.; Poller, D.N.; Kakudo, K.; Burchette, R.; Nikiforov, Y.E.; Seethala, R.R. An International Interobserver Variability Reporting of the Nuclear Scoring Criteria to Diagnose Noninvasive Follicular Thyroid Neoplasm with Papillary-Like Nuclear Features: A Validation Study. Endocr. Pathol. 2018, 29, 242–249. [Google Scholar] [CrossRef]
Figure 1. (A) The activation of the normal MAPK pathway occurs upon the binding of an extracellular ligand to the receptor tyrosine kinase. This signal triggers the activation of RAS and its downstream effector RAF, leading to the phosphorylation of MEK and ERK. pERK translocates to the nucleus and activates transcription factors, leading to gene transcription. (B) Mutated BRAF can independently activate the MAPK pathway without the need for ligand binding or RAS activation. This mutation leads to elevated pERK expression due to reduced sensitivity to feedback inhibition. (C) Mutated RAS activates the MAPK pathway independently of ligand binding. RAS additionally triggers the activation of RAF and PI3K/AKT signaling pathways. Created with Biorender.com available at (A) https://app.biorender.com/illustrations/640855dca9e401e58f696a60 (B) https://app.biorender.com/illustrations/63dbb90b80e0595aad605b56 (C) https://app.biorender.com/illustrations/63dd02150cdc41b887bf5865 (accessed on 8 October 2023).
Biomedicines 11 02803 g001
Figure 2. Study protocol. Created with BioRender.com available at https://app.biorender.com/illustrations/63f1d7b1a1db26aa324bb365 (accessed on 8 October 2023).
Biomedicines 11 02803 g002
Figure 3. Sample recruitment.
Biomedicines 11 02803 g003
Figure 4. (A) Classic subtype of PTC showed papillary structures with fibrovascular core (H&E); (B) follicular subtype of PTC, tumor predominantly arranged in a follicular pattern (H&E); (C) low pERK1/2 expression, stained brown in the nucleus (IHC pERK1/2); (D) high pERK1/2 expression, stained brown in the nucleus (IHC pERK1/2).
Biomedicines 11 02803 g004
Figure 5. ROC curve of the BRAFV600E prediction model. Red line represents the prediction due to chance with AUC 0.5. Blue line represents the model’s performance with AUC 0.734.
Biomedicines 11 02803 g005
Figure 6. ROC curve of the RAS prediction model. Red line represents the prediction due to chance with AUC 0.5. Blue line represents the model’s performance with AUC 0.8.
Biomedicines 11 02803 g006
Figure 7. Prediction model of four combination outcomes of BRAFV600E and RAS mutations.
Biomedicines 11 02803 g007
Table 1. Correlations between clinico-histopathology characteristics and BRAFV600E mutation.
CharacteristicsBRAFV600E
N = 64 (%)
Control
N = 116 (%)
pOR95% CI
Clinical features
Age (years)
   ≥5517 (35.4)31 (64.4)0.981 a0.9920.497–1.978
   <5547 (35.6)85 (64.4)1.000Reference
Gender
   Man18 (36.0)32 (64.0)0.938 a1.0270.520–2.028
   Woman46 (35.4)84 (64.6)1.000Reference
Clinical stage
   Clinical stage IV7 (58.3)5 (41.7)0.114 b2.9300.879–9.766
   Clinical stage III1 (20)4 (80)0.5230.057–4.824
   Clinical stage II13 (43.3)17 (56.7)1.6010.713–3.592
   Clinical stage I43 (32.3)90 (67.7)1.000Reference
Stage group
   Late stage (III–IV)8 (47.1)9 (52.9)0.298 a1.6980.621–4.643
   Early stage (I–II)56 (34.4)107 (65.6)1.000Reference
Histopathology features
Tumor size (cm)
   ≥416 (34.8)30 (64.2)0.899 a0.9560.474–1.928
   <448 (35.8)86 (65.2)1.000Reference
Nuclear score
   356 (43.4)73 (56.6)<0.001 a4.1231.796–9.466
   28 (15.7)43 (84.3)1.000Reference
Capsule
   Absent52 (44.1)66 (55.9)<0.001 a3.2831.586–6.794
   Present12 (19.4)50 (80.6)1.000Reference
Histology subtype
   Solid2 (33.3)4 (66.7)<0.001 b2.9380.459–18.786
   Oncocytic1 (10)9 (90)0.6530.072–5.878
   Classic21 (37.5)35 (62.5)3.5251.399–8.885
   Tall cell32 (60.4)21 (39.6)8.9523.532–22.690
   Follicular8 (14.5)47 (85.5)1.000Reference
Histology group
   Aggressive35 (50.7)34 (49.3)<0.001 a2.9111.544–5.488
   Non-aggressive29 (26.1)82 (73.9)1.000Reference
Multifocality
   Present50 (35.7)90 (64.3)0.934 a1.0320.494–2.154
   Absent14 (35.0)26 (65.0)1.000Reference
Lymphovascular invasion
   Present31 (43.1)41 (56.9)0.086 a1.7180.924–3.197
   Absent33 (30.6)75 (69.4)1.000Reference
Extrathyroidal extension
   Present28 (49.1)29 (50.9)0.010 a2.3331.220–4.463
   Absent36 (29.3)87 (70.7)1.000Reference
Node metastases
   Present34 (47.2)38 (52.8)0.008 a2.3261.244–4.349
   Absent30 (27.8)78 (72.2)1.000Reference
pERK1/2 expression
   High (>10%)25 (51)24 (49)0.008 a2.4571.253–4.820
   Low (<10%)39 (29.8)92 (70.2) Reference
a Chi-squared tests. b Mann–Whitney U tests.
Table 2. Correlations between clinico-histopathology characteristics and RAS mutation.
CharacteristicsRAS Mutation
N = 42 (%)
Control
N = 116 (%)
pOR95% CI
Clinical factors
Age (years)
   <5531 (26.7)85 (73.3)0.947 a1.0280.461–2.291
   ≥5511 (26.2)31 (73.8)1.000Reference
Gender
   Woman32 (27.6)84 (72.4)0.635 a1.2190.538–2.764
   Man10 (23.8)32 (76.2)1.000Reference
Clinical stage
   Clinical stage I33 (26.8)90 (73.2)0.981 b0.4580.116–1.811
   Clinical stage II5 (22.7)17 (77.3)0.3680.071–1.915
   Clinical stage III0 (0)4 (100)0.5560.310–0.997
   Clinical stage IV4 (44.4)5 (55.6)1.000Reference
Stage group
   Early stage (I–II)38 (26.2)107 (73.8)0.721 a0.7990.232–2.746
   Late stage (III–IV)4 (30.8)9 (69.2)1.000Reference
Histopathology factors
Tumor size (cm)
   <432 (27.1)86 (72.9)0.696 a1.1160.490–2.541
   ≥410 (25.0)30 (75.0)1.000Reference
Nuclear score
   219 (30.6)43 (69.4)0.353 a1.4020.686–2.867
   323 (24.0)73 (76.0)1.000Reference
Capsule
   Present22 (30.6)50 (69.4)0.302 a1.4520.715–2.948
   Absent20 (23.3)66 (76.7)1.000Reference
Histology subtype
   Follicular32 (40.5)47 (59.5)<0.001 b2.6481.121–6.253
   Solid1 (20)4 (80)0.9720.960–9.799
   Oncocytic0 (0)9 (100)1.2571.082–1.460
   Tall cell0 (0)21 (100)1.2571.082–1.460
   Classic9 (20.5)35 (79.5)1.000Reference
Histology group
   Non-aggressive41 (33.3)82 (66.7)<0.001 a17.0002.247–128.615
   Aggressive1 (2.9)34 (97.1)1.000Reference
Multifocality
   Present28 (23.7)90 (76.3)0.163 a0.5780.266–1.255
   Absent14 (35.0)26 (65.0)1.000Reference
Lymphovascular invasion
   Present15 (25.4)41 (73.2)0.966 a1.0160.486–2.124
   Absent27 (26.5)75 (73.5)1.000Reference
Extrathyroidal extension
   Absent35 (28.5)87 (71.3)0.270 a1.6670.668–4.157
   Present7 (19.4)29 (80.6)1.000Reference
Node metastasis
   Absent26 (25.0)78 (75.0)0.532 a0.7920.380–1.649
   Present16 (29.6)38 (70.4)1.00Reference
pERK1/2 expression
   High (>10%)28 (53.8)24 (46.2)<0.001 a7.6673.503–16.778
   Low (<10%)14 (13.2)92 (86.8) Reference
a Chi-squared tests. b Mann–Whitney U tests.
Table 3. Logistic regression of the BRAFV600E prediction model.
VariablesB CoefficientSEWaldpadjOR95% CIB/SEScore
Nuclear score (3)1.2130.4806.3750.0123.3641.312–8.6262.5271
Capsule (absent)0.9750.4125.6050.0182.6511.183–5.9412.3661
Histology subtypes (aggressive)0.8580.3755.2180.0222.3581.130–4.9212.2881
pERK1/2 (>10%)1.4600.41012.668≤0.0014.3081.927–9.6273.5602
Table 4. Probability, sensitivity, and specificity of the outcomes of the BRAFV600E prediction model.
Total ScoreProbabilitySensitivitySpecificity
05%100%0%
112.33%100%12%
225.25%95%39%
343%63%65%
462%30%94%
582%14%100%
Table 5. Logistic regression of the RAS mutation prediction model.
VariablesB CoefficientSEWaldpadjOR95% CIB/SEScore
pERK1/2 (>10%)2.1010.43023.865≤0.0018.1713.518–18.9814.8861
Histology subtype (follicular)1.6280.45412.877≤0.0015.0922.092–12.3873.5851
Table 6. Probability, sensitivity, and specificity of the outcomes of the RAS prediction model.
Total ScoreProbabilitySensitivitySpecificity
05%100%0%
127%98%48%
270%45%91%
Table 7. Multinomial analysis between the four combination outcomes and mutational status.
Model
Outcome
BRAFV600E
N (%)
padjOR95% CIRAS
N (%)
padjOR95% CIControl
N (%)
Comb. 122 (34.4)RefRefReference14 (33.3)Ref1.00Reference68 (58.6)
Comb. 22 (3.1)0.8820.8830.171–4.5687 (16.7)0.0104.8571.470–16.0497 (6)
Comb. 337 (57.8)≤0.0013.0911.594–5.9959 (21.4)0.7251.1810.467–2.98937 (31.9)
Comb. 43 (4.7)0.2952.3180.481–11.16812 (28.6)≤0.00114.5714.095–51.8554 (3.4)
Comb. = combination.
Table 8. Correlations between combination groups with clinical stage and node metastasis.
Model
Outcome
Clinical StageNode Metastasis
Early
N (%)
Late
N (%)
padjOR95% CINo
N (%)
Yes
N (%)
padjOR95% CI
Comb. 199 (95.2)5 (4.8)0.008 a1.000Reference76 (73)28 (27)<0.001 a1.000Reference
Comb. 216 (100)0 (0)1.1621.079–1.25014 (87.5)2 (12.5) 0.3880.083–1.815
Comb. 367 (80.7)16 (19.3)4.7281.653–13.52532 (38.5)51 (61.5) 4.3262.330–8.033
Comb. 417 (89.5)2 (10.5)2.3290.418–12.99112 (63.1)7 (36.9) 1.5830.566–4.426
Comb. = combination. a Mann–Whitney U tests.
Disclaimer/Publisher’s Note: The statements, opinions and data contained in all publications are solely those of the individual author(s) and contributor(s) and not of MDPI and/or the editor(s). MDPI and/or the editor(s) disclaim responsibility for any injury to people or property resulting from any ideas, methods, instructions or products referred to in the content.

